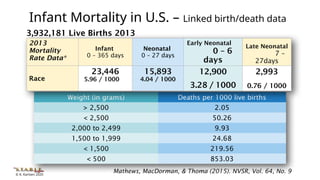
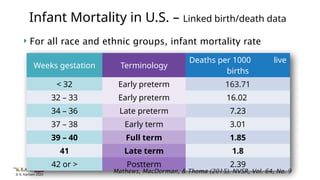
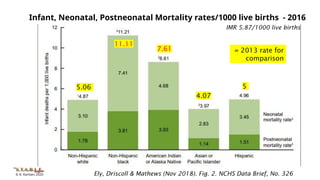
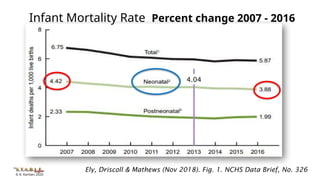
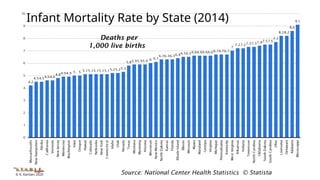
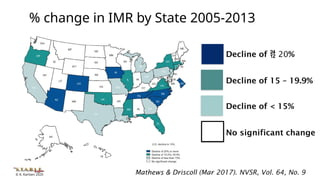
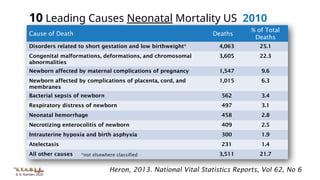
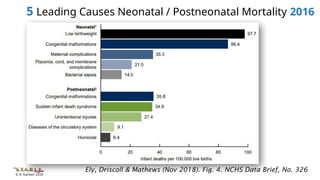
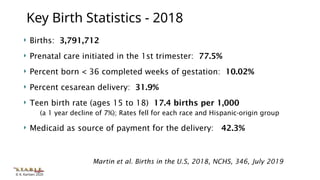
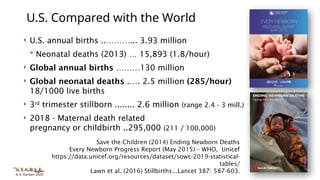
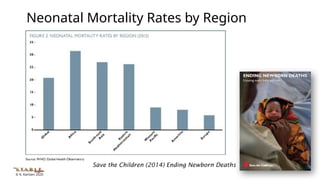
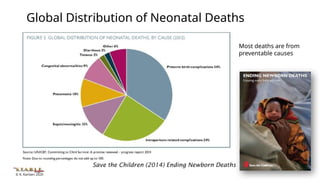
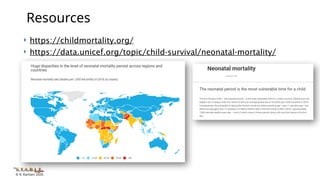
© K. Karlsen 2020
Why is Education so Important?
Infant Mortality in the U.S.
– An Overview
© K. Karlsen 2020
Infant death is a critical indicator of the health of a population.
Infant death reflects the overall state of maternal health, as well
as the quality and accessibility of primary health care available to
pregnant women and infants.
- National Vital Statistics Mortality Reporting – CDC - cdc.gov
Why are IMR Rates so Important?
© K. Karlsen 2020
Mathews, MacDorman, & Thoma (2015). NVSR, Vol. 64, No. 9
Ely, Driscoll & Mathews (Nov 2018). Fig. 2. NCHS Data Brief, No. 326
© K. Karlsen 2020
2013
Mortality
Rate Data*
Infant
0 – 365 days
Neonatal
0 – 27 days
Early Neonatal
0 – 6
days
Late Neonatal
7 –
27days
Race
23,446
5.96 / 1000
15,893
4.04 / 1000
12,900
3.28 / 1000
2,993
0.76 / 1000
Asian / PI 4.07 / 1000 2.99 / 1000
Hispanic 5 / 1000 3.55 / 1000
White 5.06 / 1000 3.34 / 1000
Am Ind / AN 7.61 / 1000 4.11 / 1000
Black 11.11 / 1000 7.46 / 1000
3,932,181 Live Births 2013
PI – Pacific Islander, AN – Alaskan Native
Mathews, MacDorman, & Thoma (2015). NVSR, Vol. 64, No. 9
Infant Mortality in U.S. – Linked birth/death data
© K. Karlsen 2020
Infant Mortality in U.S. – Linked birth/death data
Births
by
gest/weight
% of all births Died (N)
% all infant
deaths
% all neonatal
deaths
< 37 weeks
447,361
11.4 15,552 66
< 32 weeks
75,464
1.9 12,354 53
< 1000 grams
27,808
0.7 10,997 47 69
Mathews, MacDorman, & Thoma (2015). NVSR, Vol. 64, No. 9
2013
Mortality
Rate Data*
Infant
0 – 365 days
Neonatal
0 – 27 days
Early Neonatal
0 – 6
days
Late Neonatal
7 –
27days
Race
23,446
5.96 / 1000
15,893
4.04 / 1000
12,900
3.28 / 1000
2,993
0.76 / 1000
3,932,181 Live Births 2013
© K. Karlsen 2020
Weight (in grams) Deaths per 1000 live births
> 2,500 2.05
< 2,500 50.26
2,000 to 2,499 9.93
1,500 to 1,999 24.68
< 1,500 219.56
< 500 853.03
2013
Mortality
Rate Data*
Infant
0 – 365 days
Neonatal
0 – 27 days
Early Neonatal
0 – 6
days
Late Neonatal
7 –
27days
Race
23,446
5.96 / 1000
15,893
4.04 / 1000
12,900
3.28 / 1000
2,993
0.76 / 1000
3,932,181 Live Births 2013
Mathews, MacDorman, & Thoma (2015). NVSR, Vol. 64, No. 9
Infant Mortality in U.S. – Linked birth/death data
© K. Karlsen 2020
 For all race and ethnic groups, infant mortality rate
Weeks gestation Terminology
Deaths per 1000 live
births
< 32 Early preterm 163.71
32 – 33 Early preterm 16.02
34 – 36 Late preterm 7.23
37 – 38 Early term 3.01
39 – 40 Full term 1.85
41 Late term 1.8
42 or > Postterm 2.39
Infant Mortality in U.S. – Linked birth/death data
Mathews, MacDorman, & Thoma (2015). NVSR, Vol. 64, No. 9
© K. Karlsen 2020
Infant, Neonatal, Postneonatal Mortality rates/1000 live births - 2016
Ely, Driscoll & Mathews (Nov 2018). Fig. 2. NCHS Data Brief, No. 326
4.07
5
5.06
7.61
11.11
= 2013 rate for
comparison
IMR 5.87/1000 live births
© K. Karlsen 2020
Infant Mortality Rate Percent change 2007 - 2016
Ely, Driscoll & Mathews (Nov 2018). Fig. 1. NCHS Data Brief, No. 326
4.04
© K. Karlsen 2020
Infant Mortality Rate by State (2014)
Source: National Center Health Statistics © Statista
Deaths per
1,000 live births
© K. Karlsen 2020
% change in IMR by State 2005-2013
Mathews & Driscoll (Mar 2017). NVSR, Vol. 64, No. 9
Decline of  20%
Decline of 15 – 19.9%
Decline of < 15%
No significant change
© K. Karlsen 2020
Heron, 2013. National Vital Statistics Reports, Vol 62, No 6
10 Leading Causes Neonatal Mortality US 2010
Cause of Death Deaths
% of Total
Deaths
Disorders related to short gestation and low birthweight* 4,063 25.1
Congenital malformations, deformations, and chromosomal
abnormalities
3,605 22.3
Newborn affected by maternal complications of pregnancy 1,547 9.6
Newborn affected by complications of placenta, cord, and
membranes
1,015 6.3
Bacterial sepsis of newborn 562 3.4
Respiratory distress of newborn 497 3.1
Neonatal hemorrhage 458 2.8
Necrotizing enterocolitis of newborn 409 2.5
Intrauterine hypoxia and birth asphyxia 300 1.9
Atelectasis 231 1.4
All other causes 3,511 21.7
*not elsewhere classified
© K. Karlsen 2020
Ely, Driscoll & Mathews (Nov 2018). Fig. 4. NCHS Data Brief, No. 326
5 Leading Causes Neonatal / Postneonatal Mortality 2016
© K. Karlsen 2020
 Births: 3,791,712
 Prenatal care initiated in the 1st trimester: 77.5%
 Percent born < 36 completed weeks of gestation: 10.02%
 Percent cesarean delivery: 31.9%
 Teen birth rate (ages 15 to 18) 17.4 births per 1,000
(a 1 year decline of 7%); Rates fell for each race and Hispanic-origin group
 Medicaid as source of payment for the delivery: 42.3%
Key Birth Statistics - 2018
Martin et al. Births in the U.S, 2018, NCHS, 346, July 2019
© K. Karlsen 2020
Follow for new reports at:
https://www.cdc.gov/nchs/nvss/linked-birth.htm
© K. Karlsen 2020
 U.S. annual births ..………... 3.93 million
 Neonatal deaths (2013) … 15,893 (1.8/hour)
 Global annual births ………130 million
 Global neonatal deaths .…. 2.5 million (285/hour)
18/1000 live births
 3rd
trimester stillborn ........ 2.6 million (range 2.4 - 3 mill.)
 2018 - Maternal death related to to
pregnancy or childbirth ..295,000 (211 / 100,000)
U.S. Compared with the World
Save the Children (2014) Ending Newborn Deaths
Every Newborn Progress Report (May 2015) – WHO, Unicef
https://data.unicef.org/resources/dataset/sowc-2019-statistical-
tables/
Lawn et al. (2016) Stillbirths...Lancet 387: 587-603.
© K. Karlsen 2020
Neonatal Mortality Rates by Region
Save the Children (2014) Ending Newborn Deaths
© K. Karlsen 2020
Global Distribution of Neonatal Deaths
Save the Children (2014) Ending Newborn Deaths
Most deaths are from
preventable causes
© K. Karlsen 2020
 https://childmortality.org/
 https://data.unicef.org/topic/child-survival/neonatal-mortality/
Resources
© K. Karlsen 2020
This is why education is
so important

InfantMortalityInTheUSAnOverview_2019.pptx

  • 1.
    © K. Karlsen2020 Why is Education so Important? Infant Mortality in the U.S. – An Overview
  • 2.
    © K. Karlsen2020 Infant death is a critical indicator of the health of a population. Infant death reflects the overall state of maternal health, as well as the quality and accessibility of primary health care available to pregnant women and infants. - National Vital Statistics Mortality Reporting – CDC - cdc.gov Why are IMR Rates so Important?
  • 3.
    © K. Karlsen2020 Mathews, MacDorman, & Thoma (2015). NVSR, Vol. 64, No. 9 Ely, Driscoll & Mathews (Nov 2018). Fig. 2. NCHS Data Brief, No. 326
  • 4.
    © K. Karlsen2020 2013 Mortality Rate Data* Infant 0 – 365 days Neonatal 0 – 27 days Early Neonatal 0 – 6 days Late Neonatal 7 – 27days Race 23,446 5.96 / 1000 15,893 4.04 / 1000 12,900 3.28 / 1000 2,993 0.76 / 1000 Asian / PI 4.07 / 1000 2.99 / 1000 Hispanic 5 / 1000 3.55 / 1000 White 5.06 / 1000 3.34 / 1000 Am Ind / AN 7.61 / 1000 4.11 / 1000 Black 11.11 / 1000 7.46 / 1000 3,932,181 Live Births 2013 PI – Pacific Islander, AN – Alaskan Native Mathews, MacDorman, & Thoma (2015). NVSR, Vol. 64, No. 9 Infant Mortality in U.S. – Linked birth/death data
  • 5.
    © K. Karlsen2020 Infant Mortality in U.S. – Linked birth/death data Births by gest/weight % of all births Died (N) % all infant deaths % all neonatal deaths < 37 weeks 447,361 11.4 15,552 66 < 32 weeks 75,464 1.9 12,354 53 < 1000 grams 27,808 0.7 10,997 47 69 Mathews, MacDorman, & Thoma (2015). NVSR, Vol. 64, No. 9 2013 Mortality Rate Data* Infant 0 – 365 days Neonatal 0 – 27 days Early Neonatal 0 – 6 days Late Neonatal 7 – 27days Race 23,446 5.96 / 1000 15,893 4.04 / 1000 12,900 3.28 / 1000 2,993 0.76 / 1000 3,932,181 Live Births 2013
  • 6.
    © K. Karlsen2020 Weight (in grams) Deaths per 1000 live births > 2,500 2.05 < 2,500 50.26 2,000 to 2,499 9.93 1,500 to 1,999 24.68 < 1,500 219.56 < 500 853.03 2013 Mortality Rate Data* Infant 0 – 365 days Neonatal 0 – 27 days Early Neonatal 0 – 6 days Late Neonatal 7 – 27days Race 23,446 5.96 / 1000 15,893 4.04 / 1000 12,900 3.28 / 1000 2,993 0.76 / 1000 3,932,181 Live Births 2013 Mathews, MacDorman, & Thoma (2015). NVSR, Vol. 64, No. 9 Infant Mortality in U.S. – Linked birth/death data
  • 7.
    © K. Karlsen2020  For all race and ethnic groups, infant mortality rate Weeks gestation Terminology Deaths per 1000 live births < 32 Early preterm 163.71 32 – 33 Early preterm 16.02 34 – 36 Late preterm 7.23 37 – 38 Early term 3.01 39 – 40 Full term 1.85 41 Late term 1.8 42 or > Postterm 2.39 Infant Mortality in U.S. – Linked birth/death data Mathews, MacDorman, & Thoma (2015). NVSR, Vol. 64, No. 9
  • 8.
    © K. Karlsen2020 Infant, Neonatal, Postneonatal Mortality rates/1000 live births - 2016 Ely, Driscoll & Mathews (Nov 2018). Fig. 2. NCHS Data Brief, No. 326 4.07 5 5.06 7.61 11.11 = 2013 rate for comparison IMR 5.87/1000 live births
  • 9.
    © K. Karlsen2020 Infant Mortality Rate Percent change 2007 - 2016 Ely, Driscoll & Mathews (Nov 2018). Fig. 1. NCHS Data Brief, No. 326 4.04
  • 10.
    © K. Karlsen2020 Infant Mortality Rate by State (2014) Source: National Center Health Statistics © Statista Deaths per 1,000 live births
  • 11.
    © K. Karlsen2020 % change in IMR by State 2005-2013 Mathews & Driscoll (Mar 2017). NVSR, Vol. 64, No. 9 Decline of  20% Decline of 15 – 19.9% Decline of < 15% No significant change
  • 12.
    © K. Karlsen2020 Heron, 2013. National Vital Statistics Reports, Vol 62, No 6 10 Leading Causes Neonatal Mortality US 2010 Cause of Death Deaths % of Total Deaths Disorders related to short gestation and low birthweight* 4,063 25.1 Congenital malformations, deformations, and chromosomal abnormalities 3,605 22.3 Newborn affected by maternal complications of pregnancy 1,547 9.6 Newborn affected by complications of placenta, cord, and membranes 1,015 6.3 Bacterial sepsis of newborn 562 3.4 Respiratory distress of newborn 497 3.1 Neonatal hemorrhage 458 2.8 Necrotizing enterocolitis of newborn 409 2.5 Intrauterine hypoxia and birth asphyxia 300 1.9 Atelectasis 231 1.4 All other causes 3,511 21.7 *not elsewhere classified
  • 13.
    © K. Karlsen2020 Ely, Driscoll & Mathews (Nov 2018). Fig. 4. NCHS Data Brief, No. 326 5 Leading Causes Neonatal / Postneonatal Mortality 2016
  • 14.
    © K. Karlsen2020  Births: 3,791,712  Prenatal care initiated in the 1st trimester: 77.5%  Percent born < 36 completed weeks of gestation: 10.02%  Percent cesarean delivery: 31.9%  Teen birth rate (ages 15 to 18) 17.4 births per 1,000 (a 1 year decline of 7%); Rates fell for each race and Hispanic-origin group  Medicaid as source of payment for the delivery: 42.3% Key Birth Statistics - 2018 Martin et al. Births in the U.S, 2018, NCHS, 346, July 2019
  • 15.
    © K. Karlsen2020 Follow for new reports at: https://www.cdc.gov/nchs/nvss/linked-birth.htm
  • 16.
    © K. Karlsen2020  U.S. annual births ..………... 3.93 million  Neonatal deaths (2013) … 15,893 (1.8/hour)  Global annual births ………130 million  Global neonatal deaths .…. 2.5 million (285/hour) 18/1000 live births  3rd trimester stillborn ........ 2.6 million (range 2.4 - 3 mill.)  2018 - Maternal death related to to pregnancy or childbirth ..295,000 (211 / 100,000) U.S. Compared with the World Save the Children (2014) Ending Newborn Deaths Every Newborn Progress Report (May 2015) – WHO, Unicef https://data.unicef.org/resources/dataset/sowc-2019-statistical- tables/ Lawn et al. (2016) Stillbirths...Lancet 387: 587-603.
  • 17.
    © K. Karlsen2020 Neonatal Mortality Rates by Region Save the Children (2014) Ending Newborn Deaths
  • 18.
    © K. Karlsen2020 Global Distribution of Neonatal Deaths Save the Children (2014) Ending Newborn Deaths Most deaths are from preventable causes
  • 19.
    © K. Karlsen2020  https://childmortality.org/  https://data.unicef.org/topic/child-survival/neonatal-mortality/ Resources
  • 20.
    © K. Karlsen2020 This is why education is so important