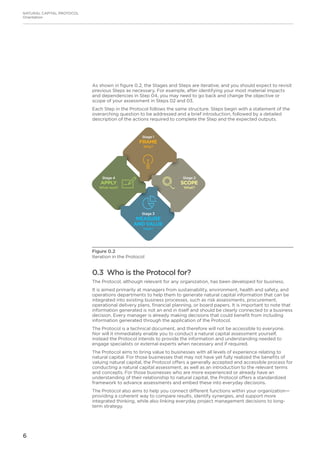
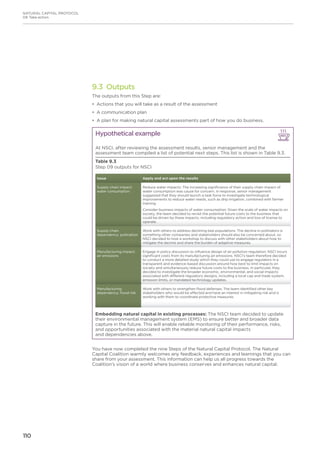
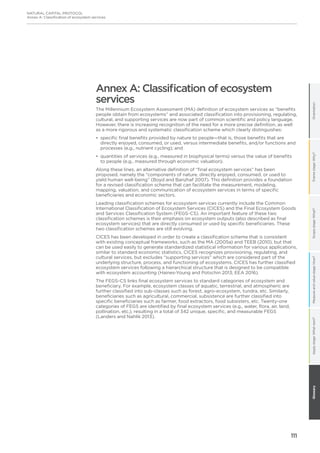
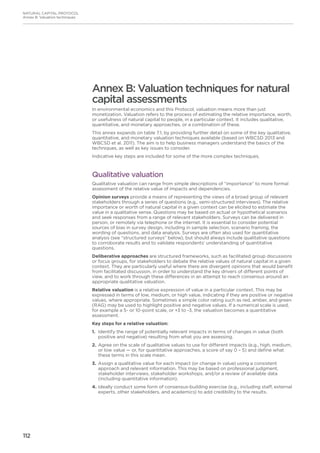
The Natural Capital Protocol is a standardized framework to help businesses identify, measure, and value their direct and indirect impacts and dependencies on natural capital. It provides a four-stage process to guide assessments: Frame, Scope, Measure and Value, and Apply. The goal is to generate credible information to inform internal business decisions. While flexible, it includes principles of relevance, rigor, replicability, and consistency. Sector guides provide additional practical guidance. The Protocol is intended to help managers understand natural capital considerations and engage necessary experts.

![125
NATURAL CAPITAL PROTOCOL
References and resources
We would like to thank all those who voluntarily shared their publically available and
proprietary methodologies to aid the development of the Protocol. Additional thanks to
the Methodology Review Panel who objectively reviewed the submissions of proprietary
methodologies. More information is available on the Natural Capital Coalition website.
All weblinks accessed May 2016.
A4S. 2015. “Natural and Social Capital Accounting: An introduction for finance teams.”
The Accounting for Sustainability Chief Financial Officer Leadership Network. [Online]
Available at: http://www.accountingforsustainability.org/cfos/network-of-chief-financial-
officers/a4s-cfo-leadership-network-activities/natural-and-social-capital
ABPmer and eftec. 2013. “The Scottish Marine Protected Area Project – Developing the
Evidence Base for Impact Assessments and the Sustainability Appraisal Final Report
Report R.2097”. [Online] Available at: http://www.gov.scot/Publications/2013/08/9645
ACCA, Flora and Fauna International, and KPMG. 2012. “Is Natural Capital a Material
Issue?” Association of Chartered Certified Accountants, Flora Fauna International and
KPMG. [Online] Available at: http://www.accaglobal.com/uk/en/technical-activities/
technical-resources-search/2012/november/is-natural-capital-a-material-issue.html
AICPA and CIMA. 2014. “Rethinking the value chain: accounting for natural capital in the
value chain.” Chartered Global Management Consultant Briefing. American Institute of
Certified Public Accountants and Chartered Institute of Management Accountants
[Online] Available at: http://www.cgma.org/Resources/DownloadableDocuments/
Accounting-for-natural-capital-in-the-value-chain.pdf
Aretano, R., I. Petrosillo, N. Zaccarelli, T. Semeraro, and G. Zurlini. 2013. People perception
of landscape change effects on ecosystem services in small Mediterranean islands: A
combination of subjective and objective assessments. Landscape and Urban Planning 112:
63-73
Atkinson, G. and D. Pearce. 1995. “Measuring sustainable development.” In: Bromley, D. W.,
(ed.) Handbook of Environmental Economics. Blackwell, Oxford, UK, pp. 166-182
Bateman, I.J., Harwood, a. R., Mace, G. M., Watson, R. T., Abson, D. J., Andrews, B.,
Termansen, M. 2013. Bringing Ecosystem Services into Economic Decision-Making: Land
Use in the United Kingdom. Science: (341): 6141: 45–50
Bauch, S. C., Birkenbach, A. M., Pattanayak, S. K., and Sills, E. O. 2015. Public health
impacts of ecosystem change in the Brazilian Amazon. Proceedings of the National
Academy of Sciences, 112(24), 7414-7419
Bishop, J. (ed.) 2010. “The Economics of Ecosystems and Biodiversity in Business and
Enterprise.” London and New York: Earthscan
Boyd, J., and S. Banzhaf. 2007. “What are ecosystem services? The need for standardized
environmental accounting units”. Ecological Economics 63: 616– 626
Business and Biodiversity Offsets Programme (BBOP). 2012. Standard on Biodiversity
Offsets. BBOP, Washington, DC. Available at http://www.forest-trends.org/documents/
files/doc_3078.pdf
Cambridge Natural Capital Leaders Platform. 2013. “E.valu.a.te: The Practical Guide.”
[Online] Available at: http://www.cisl.cam.ac.uk/publications/publication-pdfs/evaluate-
practical-guide-nov-2013-new.pdf
Canadian Council of Ministers of the Environment. 2010. Water Valuation Guidance
Document PN 1443 ISBN 978-1-896997-92-6 PDF [Online] Available at: http://www.ccme.
ca/files/Resources/water/water_valuation/water_valuation_en_1.0.pdf
Cardinale, B.J. 2012. “Biodiversity loss and its impact on humanity” Nature 486, 59-67
Chartered Institute of Internal Auditors. 2015. “What is internal audit?”: https://iia.org.uk/
about-us/what-is-internal-audit/
CDSB. 2015. “CDSB Framework: Promoting and advancing disclosure of environmental
information in mainstream reports.” [Online] http://www.cdsb.net/sites/cdsbnet/files/
cdsb_framework_for_reporting_environmental_information_natural_capital.pdf
Corporate Reporting Dialogue. 2016. “Statement of Common Principles of Materiality of
the Corporate Reporting Dialogue.” [Online] http://corporatereportingdialogue.com/
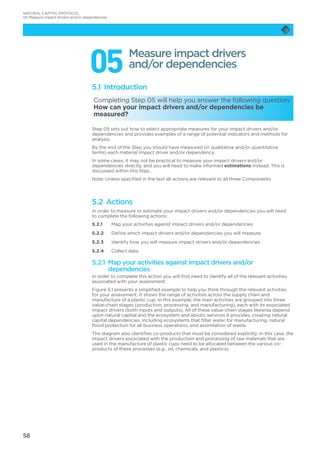
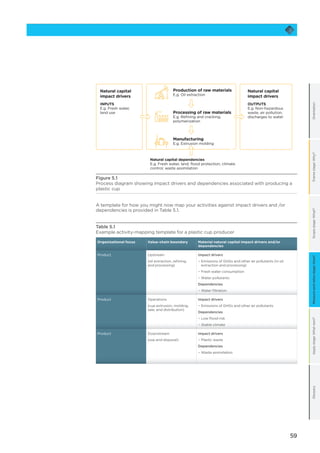
wp-content/uploads/2016/03/Statement-of-Common-Principles-of-Materiality1.pdf
References and resources](https://image.slidesharecdn.com/151e9f9a-cbbb-4f9b-9327-73768910886c-160809082448/85/NCC_Protocol_WEB_2016-07-12-127-320.jpg)
![126
NATURAL CAPITAL PROTOCOL
References and resources
Crutzen, Paul J. 2002. “Geology of mankind.” Nature 415.6867: 23-23.
Danish Environmental Protection Agency. 2007. “Practical tools for value transfer in
Denmark – guidelines and an example.” [Online] Available at: http://mst.dk/service/
publikationer/publikationsarkiv/2007/dec/practical-tools-for-value-transfer-in-denmark-
guidelines-and-an-example/
Danish Environmental Protection Agency. 2014. “Methodology report for Novo Nordisk’s
environmental profit and loss account” [Online] Available at: http://www.trucost.com/_
uploads/publishedResearch/Novo%20Nordisk%20EPandL.pdf
EEA. 2016. “CICES. Toward a Common Classification of Ecosystem Services”. [Online]
Available at http://cices.eu/
eftec. 2012. “Scoping study to develop understanding of a Natural Capital Asset Check.”
Revised final report for Defra. [Online] Available at: http://www.eftec.co.uk/eftec-
projects/defra-natura-capital-asset-check
eftec. 2010. “Valuing Environmental Impacts: Practical Guidelines for the Use of Value
Transfer in Policy and Project Appraisal.” Value Transfer Guidelines submitted to
Department for Environment, Food and Rural Affairs. [Online] Available at: http://www.
eftec.co.uk/eftec-projects/valuing-environmental-impacts-practical-guidelines-for-the-
use-of-value-transfer-in-policy-and-project-appraisal
Forum for the Future, WWF, and The Climate Group. 2014. “The Net Positive Report”
[online] Available at: https://www.forumforthefuture.org/project/net-positive-project/
overview
Global Nature Fund. 2014. “How Business Values Natural Capital: Taking Stock and
Looking Forward.” International Foundation for the Protection of Environment and Nature.
[Online] Available at: http://www.business-biodiversity.eu/global/
download/%7BSYYFGQIDSY-6242014124559-MRIRELADKC%7D.pdf
GLOBE International. 2014. “GLOBE Natural Capital Accounting Study: 2nd Edition. Legal
and policy developments in twenty-one countries.” GLOBE International and University
College London, London, United Kingdom
GRI. 2013. G4 Sustainability Reporting Guidelines: Implementation Manual. Global
Reporting Initiative. [Online] Available at: https://www.globalreporting.org/
resourcelibrary/GRIG4-Part1-Reporting-Principles-and-Standard-Disclosures.pdf
Haines-Young, R., and Potschin, M. 2011. Common international classification of ecosystem
services (CICES): 2011 Update. Nottingham: Report to the European Environmental
Agency
Haines-Young, R. and Potschin, M. 2013. “CICES V4.3 – Revised report prepared following
consultation on CICES Version 4, August-December 2012.” EEA Framework Contract No
EEA/IEA/09/003
Hoekstra, A.Y., Chapagain, A.Y., Aldaya, M, M. and Mekonnen, M. M. 2011. “The Water
Footprint Assessment Manual: Setting the Global Standard.” Water Footprint Network.
[Online] Available at: http://waterfootprint.org/media/downloads/
TheWaterFootprintAssessmentManual_2.pdf
Houdet, J. 2012. “Le Bilan Biodiversité. Une méthodologie pour intégrer la nature dans
votre comptabilité.” Natureparif – Synergiz, Victoires Editions
Houdet, J., Finisdore, J., Martin-Ortega, J., Ding, H., Maleganos, J., Spurgeon, J., Hartmann,
T., and Steuerman, D. 2015. “Accounting for ecosystem services in business.” In Potschin,
M., Haines-Young, R., Fish, R. and Turner, R.K. (eds) Routledge Handbook of Ecosystem
Services. Routledge, London and New York
Hull, S, I. Dickie, R. Tinch and J. Saunders. 2014. Issues and challenges in spatio-temporal
application of an ecosystem services framework to UK seas. Marine Policy 45 (2014) 359–
367
IEMA, 2015. Climate Change Adaptation: Building the Business Case Guidance for
Environment and Sustainability Practitioners [Online] Available at http://www.iema.net/
readingroom/articles/cca-business-case-guidance
IIRC. 2013. International Integrated Reporting Framework. International Integrated
Reporting Council [Online] Available at: http://integratedreporting.org/wp-content/
uploads/2015/03/13-12-08-THE-INTERNATIONAL-IR-FRAMEWORK-2-1.pdf](https://image.slidesharecdn.com/151e9f9a-cbbb-4f9b-9327-73768910886c-160809082448/85/NCC_Protocol_WEB_2016-07-12-128-320.jpg)
![127
International Finance Corporation (IFC). 2012. “Performance Standards on Environmental
and Social Sustainability” [Online] Available at: http://www.ifc.org/wps/wcm/
connect/115482804a0255db96fbffd1a5d13d27/PS_English_2012_Full-Document.
pdf?MOD=AJPERES
IPIECA. 2011. “Ecosystem services guidance: Biodiversity and ecosystem services guide.”
International Petroleum Industry Environmental Conversation Association. [Online]
Available at:http://www.ipieca.org/publication/ecosystem-services-guidance-
biodiversity-and-ecosystem-services-guide
ITU. 2010. World Telecommunication/ICT Development Report, Monitoring the WSIS
Targets: A mid-term review, Executive Summary [Online] Available at: https://www.itu.int/
dms_pub/itu-d/opb/ind/D-IND-WTDR-2010-SUM-PDF-E.pdf
Jansson, A., M. Hammer, C. Folke, and R. Costanza (eds.) 1994. Investing in Natural Capital:
The Ecological Economics Approach To Sustainability. Island Press: Washington, DC
Kering. 2014. Environmental Profit Loss: Methodology 2013 Group Results [Online]
Available at: http://www.kering.com/sites/default/files/document/kering_epl_
methodology_and_2013_group_results_0.pdf
Kitzes, J. 2013. ‘An Introduction to Environmentally-Extended Input-Output Analysis’,
Resources, 2: 489-503
KPMG. 2014a. “Sustainable Insight: the essentials of Materiality Assessments.” [Online]
Available at: https://www.kpmg.com/Global/en/IssuesAndInsights/ArticlesPublications/
Documents/materiality-assessment.pdf
KPMG. 2014b. “A New Vision of Value: Connecting corporate and societal value creation.”
[Online] Available at: https://www.kpmg.com/Global/en/topics/climate-change-
sustainability-services/Documents/a-new-vision-of-value.pdf
Landers, D.H. and A.M. Nahlik. 2013. “Final Ecosystem Goods and Services Classification
System (FEGS-CS).” EPA/600/R-13/ORD- 004914. U.S. Environmental Protection Agency,
Office of Research and Development, Washington, DC
Layke, C. 2009. “Measuring Nature’s Benefits: A Preliminary Roadmap for Improving
Ecosystem Service Indicators.” WRI Working Paper. World Resources Institute,
Washington DC
Leontief, W. 1970. ‘Environmental repercussions and the economic structure: an input-
output approach’, Review of Economics and Statistics, Vol. 52, No 3, pp. 262–271
Liu, S., R. Portela, A. Ghermandi, N. Rao, and X. Wang. 2012. Environmental Benefit
Transfers of Ecosystem Service Valuation in van den Belt M. and Costanza R. (eds) Volume
12, ‘Ecological Economics of Estuaries and Coasts’. In Wolanski E. and McLusky D.S. (eds)
Treatise on Estuarine and Coastal Science. Waltham, MA: Academic Press
MA. 2005a. “Millennium Ecosystem Assessment: Ecosystems and human wellbeing.
Biodiversity Synthesis.” Washington DC: Island Press
MA. 2005b. “Millennium Ecosystem Assessment: PowerPoint MA findings: Animated
slides. Slide 86.” [Online] Available at: http://www.millenniumassessment.org/en/
SlidePresentations.html
Mace, G., Norris, K and A.H. Fitter. 2012. Biodiversity and ecosystem services: A
multilayered relationship. Trends in Ecology Evolution: 27 (1): 19-26
Martín-López, B., Iniesta-Arandia, I., García-Llorente, M., Palomo, I., Casado-Arzuaga, I., Del
Amo, D. G. and Montes, C. 2012. Uncovering ecosystem service bundles through social
preferences. PloS one, 7(6), e38970
McKenzie, E., Rosenthal, A., Bernhardt, J., Girvetz, E., Kovacs, K., Olwero, N. and Toft, J.
2012. “Developing scenarios to assess ecosystem service tradeoffs: Guidance and case
studies for InVEST users.” [Online] http://www.naturalcapitalproject.org/pubs/
ScenariosGuide.pdf
Miller, R.E. and P.D. Blair. 2009. Input – output analysis: Foundations and extensions. (2nd
ed.). New York: Cambridge University Press
Natural Capital Coalition. 2014. “Valuing Natural Capital in Business. Taking stock: Existing
initiatives and applications.” [Online] Available at: http://www.naturalcapitalcoalition.org/
js/plugins/filemanager/files/Valuing_Nature_in_Business_Part_2_Taking_Stock_WEB.
pdf](https://image.slidesharecdn.com/151e9f9a-cbbb-4f9b-9327-73768910886c-160809082448/85/NCC_Protocol_WEB_2016-07-12-129-320.jpg)
![128
NATURAL CAPITAL PROTOCOL
References and resources
Natural Capital Coalition. 2013. “Natural Capital at Risk: The Top 100 Externalities of
Business.” [Online] Available at: http://www.naturalcapitalcoalition.org/projects/natural-
capital-at-risk.html
Nijhof, B. et al. 2014. “Extracts of BESMETRICS Draft Final Report.” ARCADIS IP.
OECD. 2015. “Glossary of Statistical Terms. Organisation for Economic Co-operation and
Development.” [Online] Available at: https://stats.oecd.org/glossary/
Pearce, D. and Atkinson, G. 1998. “The concept of sustainable development: an evaluation
of its usefulness ten years after Brundtland.” Swiss Journal of Economics and Statistics,
134 (3). pp. 251-269
Pearce, D. and G. Atkinson. 1993. “Capital theory and the measurement of sustainable
development: an indicator of “weak” sustainability.” Ecological Economics, 8 (2). pp. 103-
108
PwC. 2010. “The rise of Generation C: Implications for the world of 2020”, originally
published by Booz Company in 2010 [Online] Available at: http://www.strategyand.pwc.
com/uk/home/press_contacts/displays/rise_of_generation_c
PwC. 2015. “Valuing corporate environmental impacts: PwC methodology document.”
[Online] Available at: http://www.pwc.co.uk/sustainability-climate-change/total-impact/
natural-capital-exploring-the-risks.jhtml
Ricketts, T., et al. 2004. “Economic value of tropical forest to coffee production.”
Proceedings of the National Academy of Sciences of the United States of America. vol. 101
no. 34, 12579–12582
Rockström, J., W. Steffen, K. Noone, Å. Persson, F. S. Chapin, III, E. Lambin, T. M. Lenton, M.
Scheffer, C. Folke, H. Schellnhuber, B. Nykvist, C. A. De Wit, T. Hughes, S. van der Leeuw,
H. Rodhe, S. Sörlin, P. K. Snyder, R. Costanza, U. Svedin, M. Falkenmark, L. Karlberg, R. W.
Corell, V. J. Fabry, J. Hansen, B. Walker, D. Liverman, K. Richardson, P. Crutzen, and J.
Foley. 2009. “Planetary boundaries: exploring the safe operating space for humanity.”
Ecology and Society: 14 (2): 32
Spurgeon, J.P.G. 2014. “Natural Capital Accounting for Business: Guide to selecting an
approach.” [Online] Available at: http://ec.europa.eu/environment/biodiversity/business/
assets/pdf/b-at-b-platform-nca-workstream-final-report.pdf
Spurgeon, J.P.G. 2015. “Comparing Natural Capital Accounting approaches, data
availability and data requirements for businesses, governments and financial institutions: a
preliminary overview.” [Online]. Available at: http://ec.europa.eu/environment/
biodiversity/business/assets/pdf/b-at-b-workstream-1-natural-capital-accounting.pdf
Steffen et al. 2015. “Planetary Boundaries: Guiding human development on a changing
planet.” Science Vol. 347 no. 6223
TEEB. 2010. “The Economics of Ecosystems and Biodiversity: Ecological Economics
Foundations.” Edited by P. Kumar. Earthscan, London and Washington, DC
TEEB. 2011. “The Economics of Ecosystems and Biodiversity in National and International
Policy Making.” Edited by P. ten Brink. Earthscan, London and Washington, DC
TEEB. 2012. “The Economics of Ecosystems and Biodiversity in Business and Enterprise.”
Edited by J. Bishop. Earthscan, London and New York, DC
TESSA. 2014. “Toolkit for ecosystem service site based assessment.” Birdlife International.
[Online] Available at: http://tessa.tools/
The Crown Estate. 2013. “Our Contribution” [Online] available at: http://www.
thecrownestate.co.uk/our-business/how-we-measure-value/
Tukker, A., G. Huppes, L.F.C.M van Oers and R. Heijungs. 2006. Environmentally extended
input-output tables and models for Europe, Report EUR 22194 EN [Online]Available at:
http://ftp.jrc.es/EURdoc/eur22194en.pdf
UN. 1992. “Convention on Biological Diversity: Text of the Convention.” United Nations
[Online] Available at: https://www.cbd.int/doc/legal/cbd-en.pdf
UN. 1997. “Glossary of Environment Statistics, Studies in Methods, Series F, No. 67.” United
Nations: New York
UN. 2014. System of Environmental Economic Accounting (SEEA) 2012— Central
Framework. United Nations. New York. [Online] Available at: http://unstats.un.org/unsd/
envaccounting/seeaRev/SEEA_CF_Final_en.pdf](https://image.slidesharecdn.com/151e9f9a-cbbb-4f9b-9327-73768910886c-160809082448/85/NCC_Protocol_WEB_2016-07-12-130-320.jpg)
![129
UNEP. 2015. “Consumption - Measuring Sustainability - Life Cycle Assessment.” United
Nations Environment Program [Online] Available at: http://www.unep.org/
resourceefficiency/Consumption/StandardsandLabels/MeasuringSustainability/
LifeCycleAssessment/tabid/101348/Default.aspx
UN Statistics Division. 2007. “System of Environmental-Economic Accounting for Water.”
Prepared by United Nations Statistics Division upon recommendation by the UN
Committee of Experts on Environmental Economic Accounting
UNEP. 2015. “Consumption - Measuring Sustainability - Life Cycle Assessment.” United
Nations Environment Program [Online] Available at: http://www.unep.org/
resourceefficiency/Consumption/StandardsandLabels/MeasuringSustainability/
LifeCycleAssessment/tabid/101348/Default.aspx
Van der Ploeg, S. and R.S. de Groot. 2010. The TEEB Valuation Database – a searchable
database of 1310 estimates of the monetary values of ecosystem services. Foundation for
Sustainable Development, Wageningen, The Netherlands
Wallace, K.J. 2007. “Classification of ecosystem services: problems and solutions.”
Biological Conservation: 139: 3-4
WBCSD. 2013. “Business Guide to Water Valuation: An introduction to concepts and
techniques.” World Business Council for Sustainable Development. [Online] Available at:
http://www.wbcsd.org/Pages/EDocument/EDocumentDetails.aspx?ID=15801
WBCSD. 2015. “Towards a Social Capital Protocol. A Call for Collaboration: Measuring
social impacts and dependencies for better business”. [Online] Available at: http://
wbcsdpublications.org/project/towards-a-social-capital-protocol-a-call-for-collaboration/
WBCSD, IUCN, ERM, and PwC. 2011. “Guide to Corporate Ecosystem Valuation.” World
Business Council for Sustainable Development, International Union for the Conservation of
Nature, ERM and PwC. [Online] Available at: http://www.wbcsd.org/pages/edocument/
edocumentdetails.aspx?id=104nosearchcontextkey=true
World Bank. 2012 “Massive Show of Support for Action on Natural Capital Accounting at
Rio Summit” [Online] Available at: http://www.worldbank.org/en/news/press-
release/2012/06/20/massive-show-support-action-natural-capital-accounting-rio-summit
World Bank. 2011. “The Changing Wealth of Nations—Measuring Sustainable Development
in the New Millennium”. Washington DC
World Economic Forum and PwC. 2010. “Biodiversity and Business Risk”. [Online]
Available at: http://www.pwc.co.uk/assets/pdf/wef-biodiversity-and-business-risk.pdf
WRI. 2005. “Ecosystems and Human Well-Being: Opportunities and Challenges for
Business and Industry.” World Resources Institute. [Online] Available at: http://www.
millenniumassessment.org/documents/document.353.aspx.pdf
WRI, WBCSD and the Meridian Institute. 2012. “Corporate Ecosystem Services Review,
Version 2.0.” World Resources Institute. [Online] Available at: http://www.wri.org/sites/
default/files/corporate_ecosystem_services_review_1.pdf
WRI and WBCSD. 2004. “The Greenhouse Gas Protocol: A Corporate Accounting and
Reporting Standard. Revised Edition”. World Resources Institute and World Business
Council for Sustainable Development [Online] Available at: http://www.ghgprotocol.org/
files/ghgp/public/ghg-protocol-revised.pdf
WWF. 2014. “Living Planet Report 2014: species and spaces, people and places.” World
Wildlife Fund: McLellan, R., Iyengar, L., Jeffries, B., and Oerlemans, N. (Eds.). Available at:
http://wwf.panda.org/about_our_earth/all_publications/living_planet_report/](https://image.slidesharecdn.com/151e9f9a-cbbb-4f9b-9327-73768910886c-160809082448/85/NCC_Protocol_WEB_2016-07-12-131-320.jpg)