

More Related Content
Viewers also liked
Viewers also liked (11)
More from FIFIsland
More from FIFIsland (20)
Navitas kristinn pétursson 2014
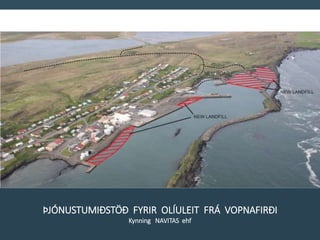
- 1. ÞJÓNUSTUMIÐSTÖÐ FYRIR OLÍULEIT FRÁ VOPNAFIRÐI Kynning NAVITAS ehf
- 2. • Fulltrúi frá Norsea Group, Tore Kolnes kom til Íslands í apríl 2013. • Hann skoðaði 12 hafnir frá Reyðarfirði til Siglufjarðar. • Einnig hitti hann fulltrúa Akureyrarhafna og forstjóra þróunarfélags Eyjafjarðar. • Niðurstaða NorSea Group var að Vopnafjörður væri besti valkosturinn. 2
- 3. • NorSea Group starfrækir 9 þjónustumiðstöðvar í Noregi. • Reynsla NorSea Group í þjónustunni er 47 ár. • Hafnarsvæði NorSea Group í Noregi nemur samtals 2500 Ha • Byggingar á hafnar- svæðum NorSea Group þekja 550 Ha 3
- 4. 4
- 6. Vegalengdir á Drekasvæðið 10 mílur/klst Gunnólfsvík Klst: 21,3 19,5 19,6 16,8 Vopafjörður Klst: 22,7 20,2 20,7 17,5 Reyðarfjörður Klst: 27,4 25,2 24,4 20,6 Húsavík Klst: 25,9 24,1 25,1 22,9 Akureyri Klst: 29,8 28,2 29,3 27,1 6
- 7. Vopnafjörður: Mismunur á siglingatíma. Gagnhraði 10 Sjm/Klst. Svæði: 1, 2, 3 og 4. Gunnólfsvík Klst +2,8 + 2,6 + 2,2 + 1,4 Reyðarfjörður Klst -9,4 -8,8 -7,4 -6,2 Húsavík Klst: -6,4 -6,6 -8,8 -10,8 Akureyri Klst: -14,2 - 14,8 -17,2 -19,2 7
- 8. Grænland: Leyfissvæði til leitar námu og jarðefnaeldsneytis • Aukið samstarf Íslands og Grænlands . • Viðskiptasamning vantar. • Grænlendingar eru áhugasamir • Íslendingar eiga að auka viðskipti við Grænland. 8
- 9. Sóknarfæri tengd olíuleit tækifæri/ógnanir 1. Styrkja samkeppnisstöðu fyrirtækjanna: 1. Meiri tækni 2. Öflugri gæðastjórnun 2. Við endurnýjun skipaflotanns 1. Huga að LNG valkosti 3. Næstu raforkusamningar 1. Twin orkusamningar 2. Huga að Twin/LNG 9
- 10. Eftir 3-5 ár... 1. Ísland allt ein þjónustumiðstöð 2. Styst frá Vopnafirði á Drekasvæðið. 3. Styst er frá Reyðarfirði til meginlandsins. 4. Norröna skiptir máli. 5. Vopnafjörður, Reyðafjörður, Seyðisfjörður, koma sterkt inn saman. 6. Brúttó flutningar ein leitar borhola er talin um 10 þús. Tn. 7. Tími leitarborun ... 3 – 4 mán. að sumarlagi. 8. Óvissa um framhald eftir fyrstu leitarborun... 10