SlideShare a Scribd company logo
1 of 10
NAB Residential Property Survey: Q4 2015
by NAB Group Economics
Embargoed until: 11.30am Wednesday 3 February 2016
NAB’s Residential Property Index falls to its lowest level since mid-2012 as house price growth slows.
QLD tipped to lead country for capital gains in the next 1-2 years. Local investors playing a smaller
role in both new and established property markets. Foreign buyers also less active, except in QLD.
Survey Highlights
 NAB’s Residential Property Index fell to +1 in Q4 (+10 in Q3) and is now well below its long-term average (+13). Sentiment
weakened in most states, especially NSW & QLD. VIC also softer, but strongest overall (replacing NSW) and currently the only
state still tracking above its long-term average. Sentiment fell further in SA/NT and remains very weak in WA.
 Average house price expectations were scaled back in most states bar WA (but still negative). Highest capital growth expected
in QLD & VIC next year with prices flat in NSW and falling in WA & SA/NT. QLD to lead for capital gains in 2 years’ time.
 NAB has also lowered its house price forecast for 2016 to 1% (from 2.3%), with weaker expectations for all capitals (led by
Sydney & Melbourne). Unit prices are tipped to fall 1.2%, with flat to falling prices in all capitals (see page 8 for more detail).
 Australian investors were less active in the markets for both new and established property. This was particularly apparent in
established housing markets, where their share of total demand fell to a survey low 19.2%, from a survey high 25.2% in Q3’14.
 At a national level, foreign buyers were also less prevalent in Q4, accounting for 14.4% of all new property sales (15.7% in Q3)
and 8.6% in established markets (9% in Q3). Activity weakened in most states, except QLD, where foreign buyers accounted for
20.9% of new property sales (17.7% in Q3) and 8.9% of established properties (7.6% in Q3).
 Foreign buyers were notably less active in VIC, where their share of total new property sales declined to 16.4% from 25.2% in
Q3. In established markets, it fell to 8.6%, down from a survey high 15% in Q3. There was less change in foreign buyer activity
in NSW - 11.7% for new property (13.6% in Q3) and 9.4% in established markets (9.7% in Q3).
 Overall, around 53% of foreign purchases of Australian residential property were for apartments, 32% houses and 16% for re-
development purposes. But these ratios continue to vary widely by state. In QLD, for example apartments accounted for 61%
of all foreign purchases in Q4 (56% in Q3) - by far the biggest share among the main states.
 The largest share of apartments (42%) bought by foreigners were valued between $500,000-1 million. Over 11% were valued
at more than $ 2million. Again, there are some interesting differences across states. For example, VIC had the biggest share of
property sales both below $500,000 and above $5 million.
 In the housing market, around 53% of houses purchased by foreigners in NSW and 58% in VIC were valued at less than $1
million, compared to 72% in QLD and 79% in WA.
-1.0
0.0
1.0
2.0
3.0
4.0
Qld
Vic
Australia
NSW
WA
SA/NT
Qld
Australia
Vic
WA
NSW
SA/NT
Average Survey House Price Expectations (%)
Q4'14 Q3'15 Q4'15
%
Next 12 months Next 2 years
-6
-4
-2
0
2
4
6
8
10
12
14
16
CapitalCityAverage
Sydney
Melbourne
Brisbane
Adelaide
Perth
Hobart
CapitalCityAverage
Sydney
Melbourne
Brisbane
Adelaide
Perth
Hobart
NAB House & Unit Price Forecasts (%)
2014 2015 2016f
NAB Residential Property Index
Q2
2015
Q3
2015
Q4
2015
Next
Qtr
Next
1 yr
Next
2 yrs
VIC 49 31 23 16 30 35
NSW 50 43 10 25 39 46
QLD 11 28 7 23 41 41
SA/NT -42 -21 -31 -13 -6 13
WA -56 -61 -59 -50 -2 23
Index 17 10 1 10 29 37
16.1
11.4 11.5
9.4
19.0
11.3
14.9
9.5
17.9
11.2
17.6
9.0
0
5
10
15
20
New Apartments Established Apartments New Houses Established Houses
Overseas Buyers: Purchases by Property Type
(% of total sales)
Q2'15 Q3'15 Q4'15
%
CONTACTS:
Alan Oster, Chief Economist
(03) 8634-2937 0414 444 652
Dean Pearson, Head of Behavioural &
Industry Economics
(03) 8634 3221 0457 517 342
Robert De Iure, Senior Economist -
Behavioural & Industry Economics
(03 8634-4611 0477 723 769
Brien McDonald, Senior Economist -
Behavioural & Industry Economics
(03) 8634-3837 0455 052 520
National Australia Bank - Group Economics | 1
NAB Residential Property Survey Q4 2015
1. Residential Property - Market Performance
House price expectations
The average expectation for national house price growth
next year was scaled back again in Q4 and is now tipped
to grow just 0.5% (1.5% in Q3 Survey). Expectations were
cut back in all states bar WA (but still negative). Capital
gains tipped to be strongest in QLD (1.9%) & VIC (0.7%).
Outlook for NSW flat with prices falling in SA/NT (-0.6%)
& WA (-0.5%). National prices to rise 1% in 2 years’ time
(1.8% in Q3 Survey), led by QLD (2.7%), VIC (1%) & WA
(0.6%), with smaller gains in NSW (0.2%) & SA/NT (0.2%).
Rental expectations
The outlook for rents varies across states. Property
professionals are forecasting higher returns next year in
NSW (1.8%) & VIC (1.7%), flat growth in SA/NT and more
modest returns in QLD (0.6%). Rents are expected to
continue falling in WA (-0.4%) as employment and
population slows. NSW (2.6%) & VIC (2%) expected to
remain the best yielding states in 2 years’ time, with
growth also resuming in WA (1%). Expectations in QLD
have been scaled back, but remain positive (0.9%).
-1.0
0.0
1.0
2.0
3.0
4.0
Qld
Vic
Australia
NSW
WA
SA/NT
Qld
Australia
Vic
WA
NSW
SA/NT
Average Survey House Price Expectations (%)
Q4'14 Q3'15 Q4'15
%
Next 12 months Next 2 years
-2.0
-1.0
0.0
1.0
2.0
3.0
NSW
Victoria
Australia
Qld
SA/NT
WA
NSW
Victoria
Australia
WA
Qld
SA/NT
Average Survey Rental Expectations (%)
Q4'14 Q3'15 Q4'15
%
Next 12 months Next 2 years
NAB Residential Property Index
The NAB Residential Property Index fell to +1 in Q4 (+10 in Q3) - its third consecutive fall - dragged down by softer
expectations for house price growth. The overall index is now sitting well below its long-term average (+13 points)
and has fallen to its lowest level since mid-2012. Market sentiment weakened in most states, especially in NSW
(down 32 to +10) and QLD (down 20 to +7). Sentiment also softened in VIC (down 8 to +23), but is now strongest
overall (replacing NSW). VIC is also the only state tracking above its long-term average (+15). Sentiment fell further in
SA/NT to -31 and remains very weak in WA (-59). NAB’s Residential Property Index is expected to rise to +29 next
year, with property professionals in QLD the most optimistic in the country. The index is expected to climb to +37 in
2 years’ time, with NSW & QLD leading and WA the big improver.
-20
-10
0
10
20
30
40
50
Q1'11
Q2'11
Q3'11
Q4'11
Q1'12
Q2'12
Q3'12
Q4'12
Q1'13
Q2'13
Q3'13
Q4'13
Q1'14
Q2'14
Q3'14
Q4'14
Q1'15
Q2'15
Q3'15
Q4'15
NAB Residential Property IndexIndex
average
-80
-60
-40
-20
0
20
40
60
Q3'15 Q4'15 Next Qtr Next 12 months Next 2 years
NAB Residential Property Index by State
Australia Victoria NSW Qld SA/NT WA
Index
National Australia Bank - Group Economics | 2
NAB Residential Property Survey Q4 2015
2. Residential Property - New Developments
Demand for new properties by buyer
FHBs (owner occupiers) were more active in new property markets in Q4, with their share of total demand rising
to 18.3% nationally (16.4% in Q3), with increased activity in NSW (19.4%), VIC (17.1%) & WA (28.4%). The share of
FHB (investors) fell further to 10.9% (12.5% in Q3), as these buyers retreated from markets in QLD & NSW. In total,
FHBs accounted for 29.2% of total new property demand in Q4 (28.9% in Q3).
0
10
20
30
40
50
FHBs(owneroccupier)
FHBs(imvestor)
ResidentOwnerOccupiers
AustralianInvestors
OverseasBuyers
Other
FHBs(owneroccupier)
FHBs(imvestor)
ResidentOwnerOccupiers
AustralianInvestors
OverseasBuyers
Other
Percentage Share of Buyers - New Developments
Q4'14 Q3'15 Q4'15
%
Current Quarter Next 12 months
Owner occupiers (net of FHBs) were more active in new
property markets (in all states bar WA), with their share
of national demand rising to 30.4% (28.6% in Q3).
The Survey suggests new housing investment is slowing,
with the share of local investors (net of FHBs) in the
national market dipping to 22.5% (26.3% in Q3), with a
smaller presence in NSW (21.1%) & VIC (25%).
Foreign buyers were also less active in new property
markets, accounting for 14.4% of total new property
demand (15.7% in Q3). Foreign buyers were notably less
active in VIC (16.4% vs 25.2% in Q3), NSW (11.7%) & WA
(5.8%), but more active in QLD (20.9% vs 17.7% in Q3).
Expected demand for new property by type and location
Expectations for new property demand next year softened relative to Q3, but still rated “good” for all property
types except for middle/outer ring high rise apartments (“fair”). By state, demand for all new property is expected
to remain “good” in NSW, led by CBD apartments. Demand in VIC is also expected to be “good” for most property
types, except CBD and high rise apartments in the middle outer ring. In QLD, demand expectations are strongest
for CBD apartments and weakest for high and low rise apartments in the middle and outer ring (“fair”). In WA,
demand is expected to be strongest for CBD apartments and inner city houses, albeit expectations are only “fair”.
0.50 1.50 2.50 3.50 4.50 5.50
Middle/Outer Ring High Rise Apts
Middle/Outer RingLow Rise Apts
CBD Apartments
Inner City High Rise Apts
Inner City Houses
Inner City Low Rise Apts
Middle/Outer Ring Houses
Demand for New Residential Developments
(next 12 months)
Q4'15 Q3'15 Q4'14
Poor Fair Good Very Good Excellent 0.50 1.50 2.50 3.50 4.50 5.50
CBD Apartments
Inner City Houses
Inner City High Rise Apts
Inner City Low Rise Apts
Middle/Outer Ring Houses
Middle/Outer Ring High Rise Apts
Middle/Outer Ring Low Rise Apts
Demand for New Residential Developments by State
(next 12 months)
WA Qld NSW Victoria
Poor Fair Good Very Good Excellent
Constraints on new housing development
Tight credit remains the biggest constraint for new housing development (particularly in SA/NT, NSW, WA & VIC).
Housing affordability is the next biggest issue (led by VIC & NSW), and has now emerged as the most “significant”
constraint in QLD. Construction costs are also seen as a “significant” constraint, especially in VIC & SA/NT.
0.50 1.50 2.50 3.50 4.50 5.50
Rising Interest Rates
Labour Availability
Lack of Development Sites
Sustainability of House Price Gains
Construction Costs
Housing Affordability
Tight Credit for New Residential Development
Constraints on New Housing Developments
Q4'15 Q3'15 Q4'14
Not at all
Significant
Not Very
Significant
Somewhat
Significant
Significant
Very
Significant
0.50 1.50 2.50 3.50 4.50 5.50
Rising Interest Rates
Tight Credit for New Residential Development
Lack of Development Sites
Sustainability of House Price Gains
Housing Affordability
Construction Costs
Labour Availability
Constraints on New Housing Developments by State
WA SA/NT Qld NSW Victoria
Not at all
Significant
Not Very
Significant
Somewhat
Significant
Significant
Very
Significant
National Australia Bank - Group Economics | 3
NAB Residential Property Survey Q4 2015
3. Residential Property - Established Property
0
10
20
30
40
50
60
FHBs(owneroccupier)
FHBs(investor)
ResidentOwnerOccupiers
AustralianInvestors
OverseasBuyers
Other
FHBs(owneroccupier)
FHBs(investor)
ResidentOwnerOccupiers
AustralianInvestors
OverseasBuyers
Other
Percentage Share of Buyers - Established Properties
Q4'14 Q3'15 Q4'15
%
Current Quarter Next 12 months
Demand for established property by buyer
FHBs (owner occupiers) significantly increased their share
of total demand in established property markets to 20.2%
in Q4 (15.7% in Q3), led by VIC, WA & NSW. FHBs
(investors) were less active in all states, with their overall
market share falling to 9.8% (10.5% in Q3).
Owner occupiers (net of FHBs) saw their share of total
demand fall further to 40.7% (43.2% in Q3), dragged
down by weaker outcomes in NSW, WA & SA/NT.
The share of local investors (net of FHBs) in the national
market fell to 19.2% (20.7% in Q3) - its lowest level since
the Survey began. Lower activity was reported in this
buyer group in all states except VIC.
Foreign buyers were also less prevalent in established property markets in Q4, with their share of national demand
falling to 8.6% (9% in Q3). The share of foreign buyers in established property markets fell sharply in VIC to 8.6%,
down from a Survey high 15% in Q3, and was broadly unchanged in NSW (9.4%). Foreign buyers in this market were
however somewhat more active in QLD (8.9% vs 7.6% in Q3) and WA (7.2% vs 6.6% in Q3).
Expected demand for established property by type and location
National demand expectations for established property over the next year weakened for all types of property, except
for inner city houses, but are still rated “good” except for established high rise apartments in the middle and outer
ring (“fair”). By state, survey participants in VIC expect “very good” demand for houses in the middle/outer ring, but
only “fair” demand for CBD and inner city high rise apartments. NSW and QLD participants anticipate “good” demand
for all types of established property (except for high rise apartments in the middle outer ring of QLD). In contrast,
market professionals in WA expect “fair” demand for all types of established property next year.
0.50 1.50 2.50 3.50 4.50 5.50
Middle/Outer Ring High Rise Apts
CBD Apartments
Middle/Outer Ring Low Rise Apts
Inner City High Rise Apts
Middle/Outer Ring Houses
Inner City Low Rise Apts
Inner City Houses
Demand for Established Residential Property
(next 12 months)
Q4'15 Q3'15 Q4'14
Poor Fair Good Very Good Excellent 0.50 1.50 2.50 3.50 4.50 5.50
CBD Apartments
Inner City Houses
Inner City High Rise Apts
Inner City Low Rise Apts
Middle/Outer Ring Houses
Middle/Outer Ring High Rise Apts
Middle/Outer Ring Low Rise Apts
Demand for Established Residential Property by State
(next 12 months)
WA Qld NSW Victoria
Poor Fair Good Very Good Excellent
Constraints on established property
Property professionals continue to identify employment security as the biggest impediment to buying existing
property nationally and in most states, especially WA & SA/NT. Access to credit was identified as the second biggest
(and growing) constraint to buying existing property, led by NSW & WA. House price levels were also a “significant”
constraint (led by NSW & VIC), but less than in Q3. Concerns about rising interest rates have also increased,
particularly in NSW, where the level of concern was “significant”.
0.50 1.50 2.50 3.50 4.50 5.50
Lack of Stock
Relative Returns on Other Investments
Rising Interest Rates
Level of Prices
Access to Credit
Employment Security
Major Constraints on Established Property
Q4'15 Q3'15 Q4'14
Not At All
Significant
Not Very
Significant
Somewhat
Significant
Significant
Very
Significant
0.50 1.50 2.50 3.50 4.50 5.50
Rising Interest Rates
Access to Credit
Lack of Stock
Level of Prices
Employment Security
Relative Returns on Other Investments
Major Constraints on Established Property by State
WA SA/NT Qld NSW Victoria
Not At All
Significant
Not Very
Significant
Somewhat
Significant
Significant
Very
Significant
National Australia Bank - Group Economics | 4
NAB Residential Property Survey Q4 2015
4. Foreign Buyers
Overall foreign buying activity
Foreign buyers were somewhat less prominent in Australian residential property markets in Q4. Overall, foreign
buyers accounted for 14.4% of total demand for new property (15.7% in Q3) and 8.6% of total demand for
established property (9% in Q3).
In new property markets, the share of foreign buyers in the overall market fell notably to 16.4% in VIC (25.2% in Q3).
Foreign buyers were also less prevalent in NSW (11.7% vs 13.6% in Q3) and WA (5.8% vs 8.3% in Q3). In contrast, the
share of demand for new property from foreign buyers in QLD increased to 20.9%, up from 17.7% in Q3.
A similar trend was also evident in established property markets. Foreign buyers made up just 8.6% of total demand
for established property in VIC, down from a Survey high 15% in Q3. Foreign buyers were also less active in NSW
(9.4% vs 9.7% in Q3), but increased their market share in QLD (8.9% vs 7.6% in Q3) and WA (7.2% vs 6.6% in Q3).
0
5
10
15
20
25
30
35
Q2'10
Q3'10
Q4'10
Q1'11
Q2'11
Q3'11
Q4'11
Q1'12
Q2'12
Q3'12
Q4'12
Q1'13
Q2'13
Q3'13
Q4'13
Q1'14
Q2'14
Q3'14
Q4'14
Q1'15
Q2'15
Q3'15
Q4'15
Share of Demand for New Properties from
Overseas Buyers (%)
Australia Victoria NSW Qld WA
%
0
5
10
15
20
25
30
35
Q2'10
Q3'10
Q4'10
Q1'11
Q2'11
Q3'11
Q4'11
Q1'12
Q2'12
Q3'12
Q4'12
Q1'13
Q2'13
Q3'13
Q4'13
Q1'14
Q2'14
Q3'14
Q4'14
Q1'15
Q2'15
Q3'15
Q4'15
Share of Demand for Existing Properties from Overseas
Buyers (%)
Australia Victoria NSW Qld WA
%
17.9
25.0
15.0
23.1
8.0
14.6
12.9 13.3
22.3
7.0
0
5
10
15
20
25
30
Australia Victoria NSW Qld WA
Overseas Buyers: Share of New Property Sales (%)
Apartments Houses
%
Foreign buying by property type: new property
By property type, Survey estimates suggest that foreign
buyers accounted for 17.9% of all new apartment sales in
Q4 (down from 19% in Q3) and 14.6% of all new house
sales (down from 14.9% in Q3).
Foreign buyers continue to be most active in new
apartment markets in VIC, albeit their market share fell
to 25% (28.5% in Q3). The share of foreign buyers in the
new apartment market in NSW was broadly unchanged
at 15% (15.5% in Q3), but it increased significantly in
QLD to 23.1% (17.4% in Q3).
There was also a notable decline in the share of foreign
buyers of new houses in VIC to 12.9% (26% in Q3).
In contrast, foreign buyers of new houses were significantly more active QLD, with their share of total demand
climbing to 22.3%, from 16.2% in Q3. Foreign buyers of new houses also increased their presence in NSW (13.3% vs
10.9% in Q3), but were less active in WA (7% vs 10% in Q3).
11.2
12.6 12.3
10.8
8.4
9.0
10.1
11.2
7.9
5.4
0
5
10
15
Australia Victoria NSW Qld WA
Overseas Buyers: Share of Established Property Sales (%)
Apartments Houses
%
Foreign buying by property type: established property
The latest Survey indicates that foreign buyers accounted
for 11.2% of all established apartment sales (11.3% in
Q3) and 9% of house sales (9.5% in Q3) nationally.
The Survey also suggests that foreign buyers were much
less active in established property markets in VIC. In Q4,
foreign buyers in VIC accounted for just 12.6% of total
demand for established apartments (19.4% in Q3) and
10.1% of established houses (16.5% in Q3). Foreign
buyers in WA also appeared to have pulled back in
established property markets, with their share of total
demand falling to 8.4% in the apartment market (9.7% in
Q3) and 5.4% in the housing market (7% in Q3).
In contrast, foreign buyers in NSW were more active in the established apartment (12.3% vs 9.9% in Q3) and housing
(11.2% vs 9.3% in Q3) markets. Foreign buyers in QLD also increased their market presence in established apartment
(10.8% vs 9.5% in Q3) and housing (7.9% vs 7.7% in Q3) markets during the Survey period.
National Australia Bank - Group Economics | 5
NAB Residential Property Survey Q4 2015
Type of property purchased by foreign buyers
Overall, 53% of foreign purchases of Australian residential property were for apartments, 32% houses and 16% for
re-development. However, these ratios continue to vary widely by state.
Buying patterns in VIC were broadly unchanged. Apartments accounted for 44.2% of all foreign purchases in VIC in
Q4 (41.8% in Q3), 35.2% were houses (34.5% in Q3) and 20.6% for re-development (23.6% in Q3).
In NSW, however, there was a notable change in foreign buyer preferences in Q4. Around 54% of all properties
purchased by foreigners were apartments (43% in Q3) and 32.4% houses (38.8% in Q3). The share of property
bought for re-development purposes fell to 14.1% (18.2% in Q3).
In QLD, apartments accounted for 61% of all foreign purchases in Q4 (56.2% in Q3) - by far the biggest share among
the main states. Houses accounted for 26.4% of foreign sales (29.5% in Q3) and re-development 13% (14.8% in Q3).
In WA, apartment sales accounted for just over 1 in2 of all foreign purchases, houses for 29.8% (26% in Q3) and
land for re-development 19.4% (24.6% in Q3).
51
31
18
49
32
19
53
32
16
0
10
20
30
40
50
60
Apartments Houses Dwelling/Land for Re-
Development
Type of Property Purchased by Foreign Investors
(% share of total)
Q2'15 Q3'15 Q4'15
%
44
54
61
51
35
32
26
30
21
14 13
19
0
10
20
30
40
50
60
70
Vic NSW Qld WA
Type of Property Purchased by Foreign Investors by
State (% share of total)
Apartments Houses Dwelling/Land for Re-Development
%
Price range of property purchased by foreign buyers
Just over 1 in 3 (33.7%) foreign apartment purchases were for properties valued less than $500,000 (34.5% in Q3)
while 41.7% were for apartments valued between $500,000-$1 million (38.6% in Q3. Around 14.8% of apartments
bought by foreigners were in the $1-2 million range (17.2% in Q3), with slightly more sales occurring in the $2-5
million range (7.9% vs 7.6% in Q3) and in the market for properties over $5 million (3.3% vs 2.5% in Q3).
There were however, some interesting differences across states. More foreign buyers in VIC (40.5%) bought
properties worth less than $500,000 than in other state, which may reflect a greater number of smaller apartments
being built and marketed to these foreign buyers. In contrast, 18.2% of foreign buyers in NSW bought apartments
valued between $1-2 million, compared to 7.9% in WA, 14.6% in QLD and 15.2% in VIC. Interestingly, more foreign
buyers in VIC (5%) also purchased apartments valued over $5 million than in any other state.
In the housing market, around 65% of foreign buyers nationally bought houses valued less than $1 million (broadly
unchanged from Q3), with around 25% buying houses worth less than $500k (28% in Q3) and 40% in the $500,000-
$1 million range (37% in Q3). Around 23% of all house sales were in the $1-2 million range (21% in Q3), with the
balance of sales above $2 million.
By state, around 53% of houses purchased by foreigners in NSW and 58% in VIC were valued below $1 million,
compared to 72% in QLD and 79% in WA. Around 31% of all houses purchased in NSW and 24% in VIC were valued
between $1-2 million, with almost 1 in 5 house sales in both VIC and NSW valued at over $2 million (with around
7% of total sales in both states for houses over $5 million).
0
10
20
30
40
50
Australia Victoria NSW Qld WA
Price Range of All Apartments Purchased by Foreign
Investors by State (% share of total)
<$500k $500k to <$1mn $1mn to <$2mn $2mn to <$5mn $5mn+
%
0
10
20
30
40
50
60
Australia Victoria NSW Qld WA
Price Range of All Houses Purchased by Foreign
Investors by State (% share of total)
<$500k $500k to <$1mn $1mn to <$2mn $2mn to <$5mn $5mn+
%
National Australia Bank - Group Economics | 6
NAB Residential Property Survey Q4 2015
5. Suburbs tipped to enjoy above average capital growth
6. Survey Respondents Expectations (average)
House Prices
Q2 15 Q3 15 Q4 15 Next qtr Next 1 yr Next 2 yrs
VIC 2.3 1.5 0.9 0.4 0.7 1.0
NSW 2.6 2.1 -0.2 -0.2 0.0 0.2
QLD 1.1 0.9 0.4 0.9 1.9 2.7
SA/NT -1.8 -0.5 -0.5 -0.2 -0.6 0.2
WA -1.6 -1.7 -2.0 -1.6 -0.5 0.6
Australia 1.3 0.8 0.0 0.0 0.5 1.0
Rents
Q2 15 Q3 15 Q4 15 Next Qtr Next 1 yr Next 2 yrs
VIC 0.7 0.6 0.6 0.9 1.7 2.0
NSW 0.4 0.4 0.3 1.0 1.8 2.6
QLD -0.3 0.2 -0.6 -0.4 0.6 0.9
SA/NT -2.1 -2.4 -2.0 -0.7 0.0 -0.1
WA -3.0 -2.2 -2.8 -2.0 -0.4 1.0
Australia -0.4 -0.4 -0.4 0.1 1.0 1.6
WESTERN AUSTRALIA
Alkimos, Armadale
QUEENSLAND
Brisbane, Bulimba, Coomera,
Gold Coast, Lutwyche, Mermaid
Beach, New Farm, Springfield,
Teneriffe, West End
NEW SOUTH WALES
Annandale, Blacktown, Enmore,
Gerringong, Parramatta,
Penrith, Riverstone, Ryde,
Sydney
VICTORIA
Dandenong, Frankston, Melbourne
National Australia Bank - Group Economics | 7
NAB Residential Property Survey Q4 2015
7. NAB’s View of Residential House Prices
The Australian housing market had another solid year in 2015 - albeit with mixed results across the capital cities - but
weakening fundamentals have already seen the market start to cool, suggesting that the best of the price gains are
probably behind us.
Over 2015, Sydney recorded double digit growth in house prices (up 11.5%) for the third straight year, but a
slowdown in the last few months saw Melbourne surpass it to record the fastest rate of growth (11.2%) of all the
capital cities. Gains elsewhere have generally been more mixed, with Brisbane showing reasonable growth (4.3%),
while cities where economic performance has been more sluggish have been in decline. Adelaide and Hobart prices
were down 0.3% and 1.6% respectively, while the mining downturn has had a particularly large impact on Perth,
where house prices dropped 3.8%. Outcomes across the major apartment markets have been broadly similar,
although the Sydney market was the clear outperformer (up 11.3%).
Going into 2016, momentum in the market is expected to flatten out as credit restrictions on investors and
worsening affordability bites in Sydney and - to a lesser extent Melbourne - where foreign investment is a larger
element. Additionally, the existing pipeline of residential construction remains large, especially in the apartment
market, which will more than offset new demand. It is also unclear just how restricting the investor regulatory
changes will be, given that to-date, at least, there seems to have been some shifting in credit growth from investors
to owner-occupiers.
In response to these factors, the forecast for average national house price growth in 2016 has been lowered further
to just 1%, from 2.3%. However, given the growing importance of units to the current housing market, we have
included our forecast for unit/apartment prices for the first time in this report. Given that much of the new supply is
going into large apartment blocks (currently a small proportion of the housing stock), negative price pressures will
be stronger for this market. Consequently, unit prices are expected to fall 1.2% over 2016. Aside from the strong
supply response in the apartment sector, however, greater reliance on foreign buyers adds a degree of
unpredictability to the outlook (both positive and negative).
In 2016, the downward revision to national house price growth to 1% reflects weaker expectations in all capital
cities. However, the sharp moderation in 2016 is largely driven by much flatter house price growth in both Sydney
and Melbourne. NAB Economics expects house price growth to decelerate in Sydney to 0.6%, while price growth in
Melbourne will ease to 2%. Consistent with the survey, Brisbane is tipped to see the fastest house price growth (3%) -
a reflection of better affordability and an improving local economy - especially in South East Queensland. The
Adelaide market is not expected to improve much in 2016 - an increase 0.2% roughly offsetting a similar fall in prices
in 2015. Perth will remain very weak as prices decline by another 3%.
In contrast, flat to falling apartment prices are expected across the board for the capital cities. The worst declines will
again be in Perth (-3%), although Melbourne is expected to experience similar declines as the CBD in particular
becomes further over supplied - with signs of elevated vacancy rates. Sydney unit prices will not escape the market
slowdown (-0.6%) with Brisbane unit prices expected to decline by a similar amount.
Despite a significant moderation in the housing market, our overall assessment is that the possibility of a more
severe correction in the Australian housing market is still remote, although the risks have escalated over the past 6
months. Nevertheless, a sharp correction will likely require an external catalyst, triggering a sharp deterioration in
the local labour market and/or a wave of Chinese selling. The other possible trigger - a large increase in interest rates
- looks highly unlikely in the current environment.
Authors:
James Glenn (Senior Economist - Australia) Riki Polygenis (Head of Australian Economics)
+(61 3) 9208 8129 +(61 3) 8679 9534
NAB House / Unit Price Forecasts (%)
2011 2012 2013 2014 2015 2016f 2011 2012 2013 2014 2015 2016f
Capital City Average -4.0 -0.5 9.9 8.4 7.8 1.0 -2.6 0.5 9.0 5.1 7.9 -1.2
Sydney -2.6 1.3 15.2 13.4 11.5 0.6 -1.3 2.3 11.6 8.3 11.3 -0.6
Melbourne -4.4 -2.9 8.5 8.4 11.7 2.0 -3.2 -2.5 8.7 1.1 6.9 -3.0
Brisbane -7.0 -0.5 5.3 5.2 4.3 3.0 -2.0 -3.5 3.5 1.2 1.8 -0.6
Adelaide -3.8 -0.8 3.0 4.5 -0.3 0.2 -8.0 -0.5 0.6 2.5 1.4 0.2
Perth -3.4 0.6 10.2 2.1 -3.8 -3.0 -5.4 3.3 6.3 1.9 -3.5 -3.0
Hobart -8.8 -0.5 2.9 3.3 -1.6 -0.6 -5.6 4.2 -5.1 5.9 8.6 0.0
House Prices Unit Prices
Percentage change represents through the year growth rates to Q4
SOURCE: Corelogic, NAB Economics
National Australia Bank - Group Economics | 8
NAB Residential Property Survey Q4 2015
About the Survey
The NAB Quarterly Australian Residential Property Survey was first launched in Q1 2011.
The survey was expanded from NAB's Quarterly Australian Commercial Property Survey, which was launched in April
2010. Given the large number of respondents who are also directly exposed to the residential market, NAB expanded
the survey questionnaire to focus more extensively on the Australian Residential market.
The large external panel of respondents consisted of Real Estate Agents/Managers, Property Developers, Asset/Fund
Managers and Owners/Investors.
Around 250 panellists participated in the Q4 2015 Survey and the breakdown of our Survey respondents - by location,
property sector and business type - are shown below.
Victoria
24%
New South Wales
33%
Queensland
21%
SA/NT
8%
Western Australia
12%
ACT
2%
Tasmania
2%
Respondents by State
Office Property
16%
Retail Property
14%
Industrial Property
17%
Residential Property
42%
Infrastructure
1%
Hotels/
Entertainment
3%
Other
7%
Respondents by Property Sector
Real Estate Agents
and Managers
35%
Asset
Managers/Property
Operators 14%
Property Developers
14%
Owners/Investors
in Real Property
16%
Fund Managers
(Real Estate)
4%
Valuers
8%
Other
4%
Respondents by Business Type
National Australia Bank - Group Economics | 9
NAB Residential Property Survey Q4 2015
Group Economics
Alan Oster
Group Chief Economist
+61 3 8634 2927
Jacqui Brand
Personal Assistant
+61 3 8634 2181
Australian Economics
& Commodities
Riki Polygenis
Head of Australian Economics
+61 3 8679 9534
James Glenn
Senior Economist - Australia
+(61 3) 9208 8129
Vyanne Lai
Economist - Australia
+(61 3) 8634 0198
Amy Li
Economist - Australia
+(61 3) 8634 1563
Phin Ziebell
Economist - Agribusiness
+(61 4) 55 051 024
Industry & Behavioural
Economics
Dean Pearson
Head of Behavioural & Industry
Economics
+(61 3) 8634 2331
Robert De Iure
Senior Economist - Behavioural &
Industry Economics
+(61 3) 8634 4611
Brien McDonald
Senior Economist - Behavioural &
Industry Economics
+(61 3) 8634 3837
International Economics
Tom Taylor
Head of Economics, International
+61 3 8634 1883
Tony Kelly
Senior Economist - International
+(61 3) 9208 5049
Gerard Burg
Senior Economist - Asia
+(61 3) 8634 2788
John Sharma
Economist - Sovereign Risk
+(61 3) 8634 4514
Global Markets Research
Peter Jolly
Global Head of Research
+61 2 9237 1406
Australia
Economics
Ivan Colhoun
Chief Economist, Markets
+61 2 9237 1836
David de Garis
Senior Economist
+61 3 8641 3045
Tapas Strickland
Economist
+61 2 9237 1980
FX Strategy
Ray Attrill
Global Co-Head of FX Strategy
+61 2 9237 1848
Rodrigo Catril
Currency Strategist
+61 2 9293 7109
Interest Rate Strategy
Skye Masters
Head of Interest Rate Strategy
+61 2 9295 1196
Credit Research
Michael Bush
Head of Credit Research
+61 3 8641 0575
Simon Fletcher
Senior Credit Analyst - FI
+61 29237 1076
Andrew Jones
Credit Analyst
+61 3 8641 0978
Distribution
Barbara Leong
Research Production Manager
+61 2 9237 8151
New Zealand
Stephen Toplis
Head of Research, NZ
+64 4 474 6905
Craig Ebert
Senior Economist
+64 4 474 6799
Doug Steel
Senior Economist
+64 4 474 6923
Kymberly Martin
Senior Market Strategist
+64 4 924 7654
Jason Wong
Currency Strategist
+64 4 924 7652
Yvonne Liew
Publications & Web Administrator
+64 4 474 9771
UK/Europe
Nick Parsons
Head of Research, UK/Europe,
and Global Co-Head of FX Strategy
+44 207 710 2993
Gavin Friend
Senior Markets Strategist
+44 207 710 2155
Derek Allassani
Research Production Manager
+44 207 710 1532
Asia
Christy Tan
Head of Markets
Strategy/Research, Asia
+852 2822 5350
Julian Wee
Senior Markets Strategist, Asia
+65 6632 8055
Important Notice
This document has been prepared by National Australia Bank Limited ABN 12 004 044 937 AFSL 230686 ("NAB"). Any advice contained in this
document has been prepared without taking into account your objectives, financial situation or needs. Before acting on any advice in this
document, NAB recommends that you consider whether the advice is appropriate for your circumstances.
NAB recommends that you obtain and consider the relevant Product Disclosure Statement or other disclosure document, before making any
decision about a product including whether to acquire or to continue to hold it.
Please click here to view our disclaimer and terms of use.
National Australia Bank - Group Economics | 10

More Related Content

Similar to Nab residential prop-survey-q4-2015

latest edition of Queensland Market Monitor - a quarterly report presenting s...
latest edition of Queensland Market Monitor - a quarterly report presenting s...latest edition of Queensland Market Monitor - a quarterly report presenting s...
latest edition of Queensland Market Monitor - a quarterly report presenting s...LJ Gilland Real Estate Pty Ltd
 
Queensland Market Monitor - September Quarter 2015
Queensland Market Monitor - September Quarter 2015Queensland Market Monitor - September Quarter 2015
Queensland Market Monitor - September Quarter 2015National Property Buyers
 
Queensland Market Monitor - March Quarter 2015
Queensland Market Monitor - March Quarter 2015Queensland Market Monitor - March Quarter 2015
Queensland Market Monitor - March Quarter 2015National Property Buyers
 
Quantum Australian Property Market Update February 2019
Quantum Australian Property Market Update February 2019Quantum Australian Property Market Update February 2019
Quantum Australian Property Market Update February 2019Peter Gribble
 
RAC Lagos House Price Index - 2018 Outlook
RAC Lagos House Price Index -  2018 OutlookRAC Lagos House Price Index -  2018 Outlook
RAC Lagos House Price Index - 2018 OutlookRotimi Akinlose
 
Queensland Market Monitor - December Quarter 2014
Queensland Market Monitor - December Quarter 2014Queensland Market Monitor - December Quarter 2014
Queensland Market Monitor - December Quarter 2014National Property Buyers
 
Queensland Market Monitor, June Quarter 2016
Queensland Market Monitor, June Quarter 2016Queensland Market Monitor, June Quarter 2016
Queensland Market Monitor, June Quarter 2016National Property Buyers
 
Ingh0101 ing home autumn buyers guide full guide with appendix
Ingh0101 ing home autumn buyers guide full guide with appendixIngh0101 ing home autumn buyers guide full guide with appendix
Ingh0101 ing home autumn buyers guide full guide with appendixLJ Gilland Real Estate Pty Ltd
 

Similar to Nab residential prop-survey-q4-2015 (20)

REIQ QLD MARKET MONITOR 27 SEPTEMBER 2015
REIQ QLD MARKET MONITOR 27 SEPTEMBER 2015REIQ QLD MARKET MONITOR 27 SEPTEMBER 2015
REIQ QLD MARKET MONITOR 27 SEPTEMBER 2015
 
Qmm issue28 linda_debello
Qmm issue28 linda_debelloQmm issue28 linda_debello
Qmm issue28 linda_debello
 
Qmm issue28 linda_debello
Qmm issue28 linda_debelloQmm issue28 linda_debello
Qmm issue28 linda_debello
 
latest edition of Queensland Market Monitor - a quarterly report presenting s...
latest edition of Queensland Market Monitor - a quarterly report presenting s...latest edition of Queensland Market Monitor - a quarterly report presenting s...
latest edition of Queensland Market Monitor - a quarterly report presenting s...
 
Queensland Market Monitor - September Quarter 2015
Queensland Market Monitor - September Quarter 2015Queensland Market Monitor - September Quarter 2015
Queensland Market Monitor - September Quarter 2015
 
Australian Regional Market Report
Australian Regional Market ReportAustralian Regional Market Report
Australian Regional Market Report
 
Queensland Market Monitor
Queensland Market MonitorQueensland Market Monitor
Queensland Market Monitor
 
Queensland Market Monitor - March Quarter 2015
Queensland Market Monitor - March Quarter 2015Queensland Market Monitor - March Quarter 2015
Queensland Market Monitor - March Quarter 2015
 
Qmm issue26 linda_debello
Qmm issue26 linda_debelloQmm issue26 linda_debello
Qmm issue26 linda_debello
 
QLD MARKET MONITOR - REIQ AS AT 9-6-15
QLD MARKET MONITOR - REIQ AS AT 9-6-15QLD MARKET MONITOR - REIQ AS AT 9-6-15
QLD MARKET MONITOR - REIQ AS AT 9-6-15
 
REIQ MARKET MONITOR JUNE 2015- ISSUE 26
REIQ MARKET MONITOR JUNE 2015- ISSUE 26 REIQ MARKET MONITOR JUNE 2015- ISSUE 26
REIQ MARKET MONITOR JUNE 2015- ISSUE 26
 
2018 08--cl18 quarterly-economic_and_property_review
2018 08--cl18 quarterly-economic_and_property_review2018 08--cl18 quarterly-economic_and_property_review
2018 08--cl18 quarterly-economic_and_property_review
 
Quantum Australian Property Market Update February 2019
Quantum Australian Property Market Update February 2019Quantum Australian Property Market Update February 2019
Quantum Australian Property Market Update February 2019
 
RAC Lagos House Price Index - 2018 Outlook
RAC Lagos House Price Index -  2018 OutlookRAC Lagos House Price Index -  2018 Outlook
RAC Lagos House Price Index - 2018 Outlook
 
Queensland Market Monitor - December Quarter 2014
Queensland Market Monitor - December Quarter 2014Queensland Market Monitor - December Quarter 2014
Queensland Market Monitor - December Quarter 2014
 
Queensland Market Monitor, June Quarter 2016
Queensland Market Monitor, June Quarter 2016Queensland Market Monitor, June Quarter 2016
Queensland Market Monitor, June Quarter 2016
 
Best of the Best 2022 Property Report
Best of the Best 2022 Property ReportBest of the Best 2022 Property Report
Best of the Best 2022 Property Report
 
R E I Q
R  E  I  QR  E  I  Q
R E I Q
 
Ingh0101 ing home autumn buyers guide full guide with appendix
Ingh0101 ing home autumn buyers guide full guide with appendixIngh0101 ing home autumn buyers guide full guide with appendix
Ingh0101 ing home autumn buyers guide full guide with appendix
 
CoreLogic-home-value-index-FEB-23-FINAL.pdf
CoreLogic-home-value-index-FEB-23-FINAL.pdfCoreLogic-home-value-index-FEB-23-FINAL.pdf
CoreLogic-home-value-index-FEB-23-FINAL.pdf
 

More from LJ Gilland Real Estate Pty Ltd

CoreLogic’s national Home Value Index (HVI) rose 0.7% in July marking a fift...
CoreLogic’s national Home Value Index (HVI) rose 0.7% in July  marking a fift...CoreLogic’s national Home Value Index (HVI) rose 0.7% in July  marking a fift...
CoreLogic’s national Home Value Index (HVI) rose 0.7% in July marking a fift...LJ Gilland Real Estate Pty Ltd
 
ASIC REPORT RE TIMESHARE 642 published-6-december-2019
ASIC REPORT RE TIMESHARE 642 published-6-december-2019ASIC REPORT RE TIMESHARE 642 published-6-december-2019
ASIC REPORT RE TIMESHARE 642 published-6-december-2019LJ Gilland Real Estate Pty Ltd
 
FIRB 2019 20 ANNUAL REPORT - Queensland is quickly becoming the a choice dest...
FIRB 2019 20 ANNUAL REPORT - Queensland is quickly becoming the a choice dest...FIRB 2019 20 ANNUAL REPORT - Queensland is quickly becoming the a choice dest...
FIRB 2019 20 ANNUAL REPORT - Queensland is quickly becoming the a choice dest...LJ Gilland Real Estate Pty Ltd
 
12 05 20 national vacancy rate increase in apr 2020_media release
12 05 20 national vacancy rate increase in apr 2020_media release12 05 20 national vacancy rate increase in apr 2020_media release
12 05 20 national vacancy rate increase in apr 2020_media releaseLJ Gilland Real Estate Pty Ltd
 

More from LJ Gilland Real Estate Pty Ltd (20)

CoreLogic-HVI-Sep-2023-FINAL.pdf
CoreLogic-HVI-Sep-2023-FINAL.pdfCoreLogic-HVI-Sep-2023-FINAL.pdf
CoreLogic-HVI-Sep-2023-FINAL.pdf
 
CoreLogic’s national Home Value Index (HVI) rose 0.7% in July marking a fift...
CoreLogic’s national Home Value Index (HVI) rose 0.7% in July  marking a fift...CoreLogic’s national Home Value Index (HVI) rose 0.7% in July  marking a fift...
CoreLogic’s national Home Value Index (HVI) rose 0.7% in July marking a fift...
 
CoreLogic-HVI-JUN-2023-FINAL.pdf
CoreLogic-HVI-JUN-2023-FINAL.pdfCoreLogic-HVI-JUN-2023-FINAL.pdf
CoreLogic-HVI-JUN-2023-FINAL.pdf
 
AU_Women_and_Property_2023_Research
AU_Women_and_Property_2023_ResearchAU_Women_and_Property_2023_Research
AU_Women_and_Property_2023_Research
 
Corelogic home value index dec 1 2021 final
Corelogic home value index dec 1 2021 finalCorelogic home value index dec 1 2021 final
Corelogic home value index dec 1 2021 final
 
ASIC REPORT RE TIMESHARE 642 published-6-december-2019
ASIC REPORT RE TIMESHARE 642 published-6-december-2019ASIC REPORT RE TIMESHARE 642 published-6-december-2019
ASIC REPORT RE TIMESHARE 642 published-6-december-2019
 
FIRB 2019 20 ANNUAL REPORT - Queensland is quickly becoming the a choice dest...
FIRB 2019 20 ANNUAL REPORT - Queensland is quickly becoming the a choice dest...FIRB 2019 20 ANNUAL REPORT - Queensland is quickly becoming the a choice dest...
FIRB 2019 20 ANNUAL REPORT - Queensland is quickly becoming the a choice dest...
 
Htw month-in-review-march-2021-residential
Htw month-in-review-march-2021-residentialHtw month-in-review-march-2021-residential
Htw month-in-review-march-2021-residential
 
Core logic home value index jan 2021 final
Core logic home value index jan 2021 finalCore logic home value index jan 2021 final
Core logic home value index jan 2021 final
 
Htw month-in-review-september-2020-residential
Htw month-in-review-september-2020-residentialHtw month-in-review-september-2020-residential
Htw month-in-review-september-2020-residential
 
12 05 20 national vacancy rate increase in apr 2020_media release
12 05 20 national vacancy rate increase in apr 2020_media release12 05 20 national vacancy rate increase in apr 2020_media release
12 05 20 national vacancy rate increase in apr 2020_media release
 
Core logic home value index may 2020 final
Core logic home value index may 2020 finalCore logic home value index may 2020 final
Core logic home value index may 2020 final
 
Covid 19_vs_property_2020
Covid 19_vs_property_2020Covid 19_vs_property_2020
Covid 19_vs_property_2020
 
htw-month-in-review-march-2020-residential
htw-month-in-review-march-2020-residentialhtw-month-in-review-march-2020-residential
htw-month-in-review-march-2020-residential
 
Core logic home value index feb 2020 final 0
Core logic home value index feb 2020 final 0Core logic home value index feb 2020 final 0
Core logic home value index feb 2020 final 0
 
Core logic home value index jan 2020 final
Core logic home value index jan 2020 finalCore logic home value index jan 2020 final
Core logic home value index jan 2020 final
 
htw-month-in-review-november-2019 v2-residential
htw-month-in-review-november-2019 v2-residentialhtw-month-in-review-november-2019 v2-residential
htw-month-in-review-november-2019 v2-residential
 
Core logic home value index Nov 19 final
Core logic home value index Nov 19 finalCore logic home value index Nov 19 final
Core logic home value index Nov 19 final
 
The QBE - Australian-Housing-Outlook-2019-2022
The QBE - Australian-Housing-Outlook-2019-2022The QBE - Australian-Housing-Outlook-2019-2022
The QBE - Australian-Housing-Outlook-2019-2022
 
htw-month-in-review-july-2019 residential
htw-month-in-review-july-2019 residentialhtw-month-in-review-july-2019 residential
htw-month-in-review-july-2019 residential
 

Recently uploaded

slideshare Call girls Noida Escorts 9999965857 henakhan
slideshare Call girls Noida Escorts 9999965857 henakhanslideshare Call girls Noida Escorts 9999965857 henakhan
slideshare Call girls Noida Escorts 9999965857 henakhanhanshkumar9870
 
VIP Amritsar Call Girl 7001035870 Enjoy Call Girls With Our Escorts
VIP Amritsar Call Girl 7001035870 Enjoy Call Girls With Our EscortsVIP Amritsar Call Girl 7001035870 Enjoy Call Girls With Our Escorts
VIP Amritsar Call Girl 7001035870 Enjoy Call Girls With Our Escortssonatiwari757
 
CALL ON ➥8923113531 🔝Call Girls Vineet Khand Lucknow best Night Fun service 🧦
CALL ON ➥8923113531 🔝Call Girls Vineet Khand Lucknow best Night Fun service  🧦CALL ON ➥8923113531 🔝Call Girls Vineet Khand Lucknow best Night Fun service  🧦
CALL ON ➥8923113531 🔝Call Girls Vineet Khand Lucknow best Night Fun service 🧦anilsa9823
 
SME IPO and sme ipo listing consultants .pptx
SME IPO and sme ipo listing consultants .pptxSME IPO and sme ipo listing consultants .pptx
SME IPO and sme ipo listing consultants .pptxindia IPO
 
VIP Call Girl Amritsar 7001035870 Enjoy Call Girls With Our Escorts
VIP Call Girl Amritsar 7001035870 Enjoy Call Girls With Our EscortsVIP Call Girl Amritsar 7001035870 Enjoy Call Girls With Our Escorts
VIP Call Girl Amritsar 7001035870 Enjoy Call Girls With Our Escortssonatiwari757
 
Collective Mining | Corporate Presentation - May 2024
Collective Mining | Corporate Presentation - May 2024Collective Mining | Corporate Presentation - May 2024
Collective Mining | Corporate Presentation - May 2024CollectiveMining1
 
Q3 FY24 Earnings Conference Call Presentation
Q3 FY24 Earnings Conference Call PresentationQ3 FY24 Earnings Conference Call Presentation
Q3 FY24 Earnings Conference Call PresentationSysco_Investors
 
Sustainability Leadership, April 26 2024
Sustainability Leadership, April 26 2024Sustainability Leadership, April 26 2024
Sustainability Leadership, April 26 2024TeckResourcesLtd
 
Nicola Mining Inc. Corporate Presentation May 2024
Nicola Mining Inc. Corporate Presentation May 2024Nicola Mining Inc. Corporate Presentation May 2024
Nicola Mining Inc. Corporate Presentation May 2024nicola_mining
 
Call Girls in Friends Colony 9711199171 Delhi Enjoy Call Girls With Our Escorts
Call Girls in Friends Colony 9711199171 Delhi Enjoy Call Girls With Our EscortsCall Girls in Friends Colony 9711199171 Delhi Enjoy Call Girls With Our Escorts
Call Girls in Friends Colony 9711199171 Delhi Enjoy Call Girls With Our Escortsindian call girls near you
 

Recently uploaded (20)

slideshare Call girls Noida Escorts 9999965857 henakhan
slideshare Call girls Noida Escorts 9999965857 henakhanslideshare Call girls Noida Escorts 9999965857 henakhan
slideshare Call girls Noida Escorts 9999965857 henakhan
 
Call Girls Service Green Park @9999965857 Delhi 🫦 No Advance VVIP 🍎 SERVICE
Call Girls Service Green Park @9999965857 Delhi 🫦 No Advance  VVIP 🍎 SERVICECall Girls Service Green Park @9999965857 Delhi 🫦 No Advance  VVIP 🍎 SERVICE
Call Girls Service Green Park @9999965857 Delhi 🫦 No Advance VVIP 🍎 SERVICE
 
Sensual Moments: +91 9999965857 Independent Call Girls Noida Delhi {{ Monika}...
Sensual Moments: +91 9999965857 Independent Call Girls Noida Delhi {{ Monika}...Sensual Moments: +91 9999965857 Independent Call Girls Noida Delhi {{ Monika}...
Sensual Moments: +91 9999965857 Independent Call Girls Noida Delhi {{ Monika}...
 
VIP Amritsar Call Girl 7001035870 Enjoy Call Girls With Our Escorts
VIP Amritsar Call Girl 7001035870 Enjoy Call Girls With Our EscortsVIP Amritsar Call Girl 7001035870 Enjoy Call Girls With Our Escorts
VIP Amritsar Call Girl 7001035870 Enjoy Call Girls With Our Escorts
 
@9999965857 🫦 Sexy Desi Call Girls Vaishali 💓 High Profile Escorts Delhi 🫶
@9999965857 🫦 Sexy Desi Call Girls Vaishali 💓 High Profile Escorts Delhi 🫶@9999965857 🫦 Sexy Desi Call Girls Vaishali 💓 High Profile Escorts Delhi 🫶
@9999965857 🫦 Sexy Desi Call Girls Vaishali 💓 High Profile Escorts Delhi 🫶
 
Call Girls In South Delhi 📱 9999965857 🤩 Delhi 🫦 HOT AND SEXY VVIP 🍎 SERVICE
Call Girls In South Delhi 📱  9999965857  🤩 Delhi 🫦 HOT AND SEXY VVIP 🍎 SERVICECall Girls In South Delhi 📱  9999965857  🤩 Delhi 🫦 HOT AND SEXY VVIP 🍎 SERVICE
Call Girls In South Delhi 📱 9999965857 🤩 Delhi 🫦 HOT AND SEXY VVIP 🍎 SERVICE
 
Call Girls In Kalkaji 📱 9999965857 🤩 Delhi 🫦 HOT AND SEXY VVIP 🍎 SERVICE
Call Girls In Kalkaji 📱  9999965857  🤩 Delhi 🫦 HOT AND SEXY VVIP 🍎 SERVICECall Girls In Kalkaji 📱  9999965857  🤩 Delhi 🫦 HOT AND SEXY VVIP 🍎 SERVICE
Call Girls In Kalkaji 📱 9999965857 🤩 Delhi 🫦 HOT AND SEXY VVIP 🍎 SERVICE
 
CALL ON ➥8923113531 🔝Call Girls Vineet Khand Lucknow best Night Fun service 🧦
CALL ON ➥8923113531 🔝Call Girls Vineet Khand Lucknow best Night Fun service  🧦CALL ON ➥8923113531 🔝Call Girls Vineet Khand Lucknow best Night Fun service  🧦
CALL ON ➥8923113531 🔝Call Girls Vineet Khand Lucknow best Night Fun service 🧦
 
SME IPO and sme ipo listing consultants .pptx
SME IPO and sme ipo listing consultants .pptxSME IPO and sme ipo listing consultants .pptx
SME IPO and sme ipo listing consultants .pptx
 
Call Girls 🫤 East Of Kailash ➡️ 9999965857 ➡️ Delhi 🫦 Russian Escorts FULL ...
Call Girls 🫤 East Of Kailash ➡️ 9999965857  ➡️ Delhi 🫦  Russian Escorts FULL ...Call Girls 🫤 East Of Kailash ➡️ 9999965857  ➡️ Delhi 🫦  Russian Escorts FULL ...
Call Girls 🫤 East Of Kailash ➡️ 9999965857 ➡️ Delhi 🫦 Russian Escorts FULL ...
 
VIP Call Girl Amritsar 7001035870 Enjoy Call Girls With Our Escorts
VIP Call Girl Amritsar 7001035870 Enjoy Call Girls With Our EscortsVIP Call Girl Amritsar 7001035870 Enjoy Call Girls With Our Escorts
VIP Call Girl Amritsar 7001035870 Enjoy Call Girls With Our Escorts
 
Vip Call Girls Vasant Kunj ➡️ Delhi ➡️ 9999965857 No Advance 24HRS Live
Vip Call Girls Vasant Kunj ➡️ Delhi ➡️ 9999965857 No Advance 24HRS LiveVip Call Girls Vasant Kunj ➡️ Delhi ➡️ 9999965857 No Advance 24HRS Live
Vip Call Girls Vasant Kunj ➡️ Delhi ➡️ 9999965857 No Advance 24HRS Live
 
Collective Mining | Corporate Presentation - May 2024
Collective Mining | Corporate Presentation - May 2024Collective Mining | Corporate Presentation - May 2024
Collective Mining | Corporate Presentation - May 2024
 
Q3 FY24 Earnings Conference Call Presentation
Q3 FY24 Earnings Conference Call PresentationQ3 FY24 Earnings Conference Call Presentation
Q3 FY24 Earnings Conference Call Presentation
 
Sustainability Leadership, April 26 2024
Sustainability Leadership, April 26 2024Sustainability Leadership, April 26 2024
Sustainability Leadership, April 26 2024
 
Nicola Mining Inc. Corporate Presentation May 2024
Nicola Mining Inc. Corporate Presentation May 2024Nicola Mining Inc. Corporate Presentation May 2024
Nicola Mining Inc. Corporate Presentation May 2024
 
Rohini Sector 15 Call Girls Delhi 9999965857 @Sabina Saikh No Advance
Rohini Sector 15 Call Girls Delhi 9999965857 @Sabina Saikh No AdvanceRohini Sector 15 Call Girls Delhi 9999965857 @Sabina Saikh No Advance
Rohini Sector 15 Call Girls Delhi 9999965857 @Sabina Saikh No Advance
 
(👉゚9999965857 ゚)👉 VIP Call Girls Friends Colony 👉 Delhi 👈 : 9999 Cash Payment...
(👉゚9999965857 ゚)👉 VIP Call Girls Friends Colony 👉 Delhi 👈 : 9999 Cash Payment...(👉゚9999965857 ゚)👉 VIP Call Girls Friends Colony 👉 Delhi 👈 : 9999 Cash Payment...
(👉゚9999965857 ゚)👉 VIP Call Girls Friends Colony 👉 Delhi 👈 : 9999 Cash Payment...
 
Vip Call Girls Hauz Khas ➡️ Delhi ➡️ 9999965857 No Advance 24HRS Live
Vip Call Girls Hauz Khas ➡️ Delhi ➡️ 9999965857 No Advance 24HRS LiveVip Call Girls Hauz Khas ➡️ Delhi ➡️ 9999965857 No Advance 24HRS Live
Vip Call Girls Hauz Khas ➡️ Delhi ➡️ 9999965857 No Advance 24HRS Live
 
Call Girls in Friends Colony 9711199171 Delhi Enjoy Call Girls With Our Escorts
Call Girls in Friends Colony 9711199171 Delhi Enjoy Call Girls With Our EscortsCall Girls in Friends Colony 9711199171 Delhi Enjoy Call Girls With Our Escorts
Call Girls in Friends Colony 9711199171 Delhi Enjoy Call Girls With Our Escorts
 

Nab residential prop-survey-q4-2015

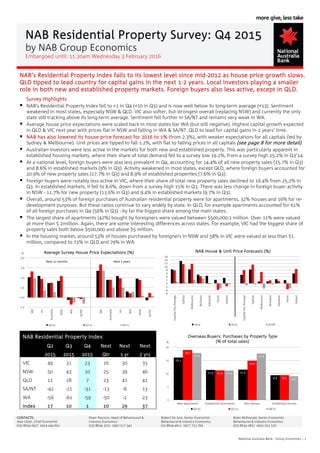
  • 1. NAB Residential Property Survey: Q4 2015 by NAB Group Economics Embargoed until: 11.30am Wednesday 3 February 2016 NAB’s Residential Property Index falls to its lowest level since mid-2012 as house price growth slows. QLD tipped to lead country for capital gains in the next 1-2 years. Local investors playing a smaller role in both new and established property markets. Foreign buyers also less active, except in QLD. Survey Highlights  NAB’s Residential Property Index fell to +1 in Q4 (+10 in Q3) and is now well below its long-term average (+13). Sentiment weakened in most states, especially NSW & QLD. VIC also softer, but strongest overall (replacing NSW) and currently the only state still tracking above its long-term average. Sentiment fell further in SA/NT and remains very weak in WA.  Average house price expectations were scaled back in most states bar WA (but still negative). Highest capital growth expected in QLD & VIC next year with prices flat in NSW and falling in WA & SA/NT. QLD to lead for capital gains in 2 years’ time.  NAB has also lowered its house price forecast for 2016 to 1% (from 2.3%), with weaker expectations for all capitals (led by Sydney & Melbourne). Unit prices are tipped to fall 1.2%, with flat to falling prices in all capitals (see page 8 for more detail).  Australian investors were less active in the markets for both new and established property. This was particularly apparent in established housing markets, where their share of total demand fell to a survey low 19.2%, from a survey high 25.2% in Q3’14.  At a national level, foreign buyers were also less prevalent in Q4, accounting for 14.4% of all new property sales (15.7% in Q3) and 8.6% in established markets (9% in Q3). Activity weakened in most states, except QLD, where foreign buyers accounted for 20.9% of new property sales (17.7% in Q3) and 8.9% of established properties (7.6% in Q3).  Foreign buyers were notably less active in VIC, where their share of total new property sales declined to 16.4% from 25.2% in Q3. In established markets, it fell to 8.6%, down from a survey high 15% in Q3. There was less change in foreign buyer activity in NSW - 11.7% for new property (13.6% in Q3) and 9.4% in established markets (9.7% in Q3).  Overall, around 53% of foreign purchases of Australian residential property were for apartments, 32% houses and 16% for re- development purposes. But these ratios continue to vary widely by state. In QLD, for example apartments accounted for 61% of all foreign purchases in Q4 (56% in Q3) - by far the biggest share among the main states.  The largest share of apartments (42%) bought by foreigners were valued between $500,000-1 million. Over 11% were valued at more than $ 2million. Again, there are some interesting differences across states. For example, VIC had the biggest share of property sales both below $500,000 and above $5 million.  In the housing market, around 53% of houses purchased by foreigners in NSW and 58% in VIC were valued at less than $1 million, compared to 72% in QLD and 79% in WA. -1.0 0.0 1.0 2.0 3.0 4.0 Qld Vic Australia NSW WA SA/NT Qld Australia Vic WA NSW SA/NT Average Survey House Price Expectations (%) Q4'14 Q3'15 Q4'15 % Next 12 months Next 2 years -6 -4 -2 0 2 4 6 8 10 12 14 16 CapitalCityAverage Sydney Melbourne Brisbane Adelaide Perth Hobart CapitalCityAverage Sydney Melbourne Brisbane Adelaide Perth Hobart NAB House & Unit Price Forecasts (%) 2014 2015 2016f NAB Residential Property Index Q2 2015 Q3 2015 Q4 2015 Next Qtr Next 1 yr Next 2 yrs VIC 49 31 23 16 30 35 NSW 50 43 10 25 39 46 QLD 11 28 7 23 41 41 SA/NT -42 -21 -31 -13 -6 13 WA -56 -61 -59 -50 -2 23 Index 17 10 1 10 29 37 16.1 11.4 11.5 9.4 19.0 11.3 14.9 9.5 17.9 11.2 17.6 9.0 0 5 10 15 20 New Apartments Established Apartments New Houses Established Houses Overseas Buyers: Purchases by Property Type (% of total sales) Q2'15 Q3'15 Q4'15 % CONTACTS: Alan Oster, Chief Economist (03) 8634-2937 0414 444 652 Dean Pearson, Head of Behavioural & Industry Economics (03) 8634 3221 0457 517 342 Robert De Iure, Senior Economist - Behavioural & Industry Economics (03 8634-4611 0477 723 769 Brien McDonald, Senior Economist - Behavioural & Industry Economics (03) 8634-3837 0455 052 520 National Australia Bank - Group Economics | 1
  • 2. NAB Residential Property Survey Q4 2015 1. Residential Property - Market Performance House price expectations The average expectation for national house price growth next year was scaled back again in Q4 and is now tipped to grow just 0.5% (1.5% in Q3 Survey). Expectations were cut back in all states bar WA (but still negative). Capital gains tipped to be strongest in QLD (1.9%) & VIC (0.7%). Outlook for NSW flat with prices falling in SA/NT (-0.6%) & WA (-0.5%). National prices to rise 1% in 2 years’ time (1.8% in Q3 Survey), led by QLD (2.7%), VIC (1%) & WA (0.6%), with smaller gains in NSW (0.2%) & SA/NT (0.2%). Rental expectations The outlook for rents varies across states. Property professionals are forecasting higher returns next year in NSW (1.8%) & VIC (1.7%), flat growth in SA/NT and more modest returns in QLD (0.6%). Rents are expected to continue falling in WA (-0.4%) as employment and population slows. NSW (2.6%) & VIC (2%) expected to remain the best yielding states in 2 years’ time, with growth also resuming in WA (1%). Expectations in QLD have been scaled back, but remain positive (0.9%). -1.0 0.0 1.0 2.0 3.0 4.0 Qld Vic Australia NSW WA SA/NT Qld Australia Vic WA NSW SA/NT Average Survey House Price Expectations (%) Q4'14 Q3'15 Q4'15 % Next 12 months Next 2 years -2.0 -1.0 0.0 1.0 2.0 3.0 NSW Victoria Australia Qld SA/NT WA NSW Victoria Australia WA Qld SA/NT Average Survey Rental Expectations (%) Q4'14 Q3'15 Q4'15 % Next 12 months Next 2 years NAB Residential Property Index The NAB Residential Property Index fell to +1 in Q4 (+10 in Q3) - its third consecutive fall - dragged down by softer expectations for house price growth. The overall index is now sitting well below its long-term average (+13 points) and has fallen to its lowest level since mid-2012. Market sentiment weakened in most states, especially in NSW (down 32 to +10) and QLD (down 20 to +7). Sentiment also softened in VIC (down 8 to +23), but is now strongest overall (replacing NSW). VIC is also the only state tracking above its long-term average (+15). Sentiment fell further in SA/NT to -31 and remains very weak in WA (-59). NAB’s Residential Property Index is expected to rise to +29 next year, with property professionals in QLD the most optimistic in the country. The index is expected to climb to +37 in 2 years’ time, with NSW & QLD leading and WA the big improver. -20 -10 0 10 20 30 40 50 Q1'11 Q2'11 Q3'11 Q4'11 Q1'12 Q2'12 Q3'12 Q4'12 Q1'13 Q2'13 Q3'13 Q4'13 Q1'14 Q2'14 Q3'14 Q4'14 Q1'15 Q2'15 Q3'15 Q4'15 NAB Residential Property IndexIndex average -80 -60 -40 -20 0 20 40 60 Q3'15 Q4'15 Next Qtr Next 12 months Next 2 years NAB Residential Property Index by State Australia Victoria NSW Qld SA/NT WA Index National Australia Bank - Group Economics | 2
  • 3. NAB Residential Property Survey Q4 2015 2. Residential Property - New Developments Demand for new properties by buyer FHBs (owner occupiers) were more active in new property markets in Q4, with their share of total demand rising to 18.3% nationally (16.4% in Q3), with increased activity in NSW (19.4%), VIC (17.1%) & WA (28.4%). The share of FHB (investors) fell further to 10.9% (12.5% in Q3), as these buyers retreated from markets in QLD & NSW. In total, FHBs accounted for 29.2% of total new property demand in Q4 (28.9% in Q3). 0 10 20 30 40 50 FHBs(owneroccupier) FHBs(imvestor) ResidentOwnerOccupiers AustralianInvestors OverseasBuyers Other FHBs(owneroccupier) FHBs(imvestor) ResidentOwnerOccupiers AustralianInvestors OverseasBuyers Other Percentage Share of Buyers - New Developments Q4'14 Q3'15 Q4'15 % Current Quarter Next 12 months Owner occupiers (net of FHBs) were more active in new property markets (in all states bar WA), with their share of national demand rising to 30.4% (28.6% in Q3). The Survey suggests new housing investment is slowing, with the share of local investors (net of FHBs) in the national market dipping to 22.5% (26.3% in Q3), with a smaller presence in NSW (21.1%) & VIC (25%). Foreign buyers were also less active in new property markets, accounting for 14.4% of total new property demand (15.7% in Q3). Foreign buyers were notably less active in VIC (16.4% vs 25.2% in Q3), NSW (11.7%) & WA (5.8%), but more active in QLD (20.9% vs 17.7% in Q3). Expected demand for new property by type and location Expectations for new property demand next year softened relative to Q3, but still rated “good” for all property types except for middle/outer ring high rise apartments (“fair”). By state, demand for all new property is expected to remain “good” in NSW, led by CBD apartments. Demand in VIC is also expected to be “good” for most property types, except CBD and high rise apartments in the middle outer ring. In QLD, demand expectations are strongest for CBD apartments and weakest for high and low rise apartments in the middle and outer ring (“fair”). In WA, demand is expected to be strongest for CBD apartments and inner city houses, albeit expectations are only “fair”. 0.50 1.50 2.50 3.50 4.50 5.50 Middle/Outer Ring High Rise Apts Middle/Outer RingLow Rise Apts CBD Apartments Inner City High Rise Apts Inner City Houses Inner City Low Rise Apts Middle/Outer Ring Houses Demand for New Residential Developments (next 12 months) Q4'15 Q3'15 Q4'14 Poor Fair Good Very Good Excellent 0.50 1.50 2.50 3.50 4.50 5.50 CBD Apartments Inner City Houses Inner City High Rise Apts Inner City Low Rise Apts Middle/Outer Ring Houses Middle/Outer Ring High Rise Apts Middle/Outer Ring Low Rise Apts Demand for New Residential Developments by State (next 12 months) WA Qld NSW Victoria Poor Fair Good Very Good Excellent Constraints on new housing development Tight credit remains the biggest constraint for new housing development (particularly in SA/NT, NSW, WA & VIC). Housing affordability is the next biggest issue (led by VIC & NSW), and has now emerged as the most “significant” constraint in QLD. Construction costs are also seen as a “significant” constraint, especially in VIC & SA/NT. 0.50 1.50 2.50 3.50 4.50 5.50 Rising Interest Rates Labour Availability Lack of Development Sites Sustainability of House Price Gains Construction Costs Housing Affordability Tight Credit for New Residential Development Constraints on New Housing Developments Q4'15 Q3'15 Q4'14 Not at all Significant Not Very Significant Somewhat Significant Significant Very Significant 0.50 1.50 2.50 3.50 4.50 5.50 Rising Interest Rates Tight Credit for New Residential Development Lack of Development Sites Sustainability of House Price Gains Housing Affordability Construction Costs Labour Availability Constraints on New Housing Developments by State WA SA/NT Qld NSW Victoria Not at all Significant Not Very Significant Somewhat Significant Significant Very Significant National Australia Bank - Group Economics | 3
  • 4. NAB Residential Property Survey Q4 2015 3. Residential Property - Established Property 0 10 20 30 40 50 60 FHBs(owneroccupier) FHBs(investor) ResidentOwnerOccupiers AustralianInvestors OverseasBuyers Other FHBs(owneroccupier) FHBs(investor) ResidentOwnerOccupiers AustralianInvestors OverseasBuyers Other Percentage Share of Buyers - Established Properties Q4'14 Q3'15 Q4'15 % Current Quarter Next 12 months Demand for established property by buyer FHBs (owner occupiers) significantly increased their share of total demand in established property markets to 20.2% in Q4 (15.7% in Q3), led by VIC, WA & NSW. FHBs (investors) were less active in all states, with their overall market share falling to 9.8% (10.5% in Q3). Owner occupiers (net of FHBs) saw their share of total demand fall further to 40.7% (43.2% in Q3), dragged down by weaker outcomes in NSW, WA & SA/NT. The share of local investors (net of FHBs) in the national market fell to 19.2% (20.7% in Q3) - its lowest level since the Survey began. Lower activity was reported in this buyer group in all states except VIC. Foreign buyers were also less prevalent in established property markets in Q4, with their share of national demand falling to 8.6% (9% in Q3). The share of foreign buyers in established property markets fell sharply in VIC to 8.6%, down from a Survey high 15% in Q3, and was broadly unchanged in NSW (9.4%). Foreign buyers in this market were however somewhat more active in QLD (8.9% vs 7.6% in Q3) and WA (7.2% vs 6.6% in Q3). Expected demand for established property by type and location National demand expectations for established property over the next year weakened for all types of property, except for inner city houses, but are still rated “good” except for established high rise apartments in the middle and outer ring (“fair”). By state, survey participants in VIC expect “very good” demand for houses in the middle/outer ring, but only “fair” demand for CBD and inner city high rise apartments. NSW and QLD participants anticipate “good” demand for all types of established property (except for high rise apartments in the middle outer ring of QLD). In contrast, market professionals in WA expect “fair” demand for all types of established property next year. 0.50 1.50 2.50 3.50 4.50 5.50 Middle/Outer Ring High Rise Apts CBD Apartments Middle/Outer Ring Low Rise Apts Inner City High Rise Apts Middle/Outer Ring Houses Inner City Low Rise Apts Inner City Houses Demand for Established Residential Property (next 12 months) Q4'15 Q3'15 Q4'14 Poor Fair Good Very Good Excellent 0.50 1.50 2.50 3.50 4.50 5.50 CBD Apartments Inner City Houses Inner City High Rise Apts Inner City Low Rise Apts Middle/Outer Ring Houses Middle/Outer Ring High Rise Apts Middle/Outer Ring Low Rise Apts Demand for Established Residential Property by State (next 12 months) WA Qld NSW Victoria Poor Fair Good Very Good Excellent Constraints on established property Property professionals continue to identify employment security as the biggest impediment to buying existing property nationally and in most states, especially WA & SA/NT. Access to credit was identified as the second biggest (and growing) constraint to buying existing property, led by NSW & WA. House price levels were also a “significant” constraint (led by NSW & VIC), but less than in Q3. Concerns about rising interest rates have also increased, particularly in NSW, where the level of concern was “significant”. 0.50 1.50 2.50 3.50 4.50 5.50 Lack of Stock Relative Returns on Other Investments Rising Interest Rates Level of Prices Access to Credit Employment Security Major Constraints on Established Property Q4'15 Q3'15 Q4'14 Not At All Significant Not Very Significant Somewhat Significant Significant Very Significant 0.50 1.50 2.50 3.50 4.50 5.50 Rising Interest Rates Access to Credit Lack of Stock Level of Prices Employment Security Relative Returns on Other Investments Major Constraints on Established Property by State WA SA/NT Qld NSW Victoria Not At All Significant Not Very Significant Somewhat Significant Significant Very Significant National Australia Bank - Group Economics | 4
  • 5. NAB Residential Property Survey Q4 2015 4. Foreign Buyers Overall foreign buying activity Foreign buyers were somewhat less prominent in Australian residential property markets in Q4. Overall, foreign buyers accounted for 14.4% of total demand for new property (15.7% in Q3) and 8.6% of total demand for established property (9% in Q3). In new property markets, the share of foreign buyers in the overall market fell notably to 16.4% in VIC (25.2% in Q3). Foreign buyers were also less prevalent in NSW (11.7% vs 13.6% in Q3) and WA (5.8% vs 8.3% in Q3). In contrast, the share of demand for new property from foreign buyers in QLD increased to 20.9%, up from 17.7% in Q3. A similar trend was also evident in established property markets. Foreign buyers made up just 8.6% of total demand for established property in VIC, down from a Survey high 15% in Q3. Foreign buyers were also less active in NSW (9.4% vs 9.7% in Q3), but increased their market share in QLD (8.9% vs 7.6% in Q3) and WA (7.2% vs 6.6% in Q3). 0 5 10 15 20 25 30 35 Q2'10 Q3'10 Q4'10 Q1'11 Q2'11 Q3'11 Q4'11 Q1'12 Q2'12 Q3'12 Q4'12 Q1'13 Q2'13 Q3'13 Q4'13 Q1'14 Q2'14 Q3'14 Q4'14 Q1'15 Q2'15 Q3'15 Q4'15 Share of Demand for New Properties from Overseas Buyers (%) Australia Victoria NSW Qld WA % 0 5 10 15 20 25 30 35 Q2'10 Q3'10 Q4'10 Q1'11 Q2'11 Q3'11 Q4'11 Q1'12 Q2'12 Q3'12 Q4'12 Q1'13 Q2'13 Q3'13 Q4'13 Q1'14 Q2'14 Q3'14 Q4'14 Q1'15 Q2'15 Q3'15 Q4'15 Share of Demand for Existing Properties from Overseas Buyers (%) Australia Victoria NSW Qld WA % 17.9 25.0 15.0 23.1 8.0 14.6 12.9 13.3 22.3 7.0 0 5 10 15 20 25 30 Australia Victoria NSW Qld WA Overseas Buyers: Share of New Property Sales (%) Apartments Houses % Foreign buying by property type: new property By property type, Survey estimates suggest that foreign buyers accounted for 17.9% of all new apartment sales in Q4 (down from 19% in Q3) and 14.6% of all new house sales (down from 14.9% in Q3). Foreign buyers continue to be most active in new apartment markets in VIC, albeit their market share fell to 25% (28.5% in Q3). The share of foreign buyers in the new apartment market in NSW was broadly unchanged at 15% (15.5% in Q3), but it increased significantly in QLD to 23.1% (17.4% in Q3). There was also a notable decline in the share of foreign buyers of new houses in VIC to 12.9% (26% in Q3). In contrast, foreign buyers of new houses were significantly more active QLD, with their share of total demand climbing to 22.3%, from 16.2% in Q3. Foreign buyers of new houses also increased their presence in NSW (13.3% vs 10.9% in Q3), but were less active in WA (7% vs 10% in Q3). 11.2 12.6 12.3 10.8 8.4 9.0 10.1 11.2 7.9 5.4 0 5 10 15 Australia Victoria NSW Qld WA Overseas Buyers: Share of Established Property Sales (%) Apartments Houses % Foreign buying by property type: established property The latest Survey indicates that foreign buyers accounted for 11.2% of all established apartment sales (11.3% in Q3) and 9% of house sales (9.5% in Q3) nationally. The Survey also suggests that foreign buyers were much less active in established property markets in VIC. In Q4, foreign buyers in VIC accounted for just 12.6% of total demand for established apartments (19.4% in Q3) and 10.1% of established houses (16.5% in Q3). Foreign buyers in WA also appeared to have pulled back in established property markets, with their share of total demand falling to 8.4% in the apartment market (9.7% in Q3) and 5.4% in the housing market (7% in Q3). In contrast, foreign buyers in NSW were more active in the established apartment (12.3% vs 9.9% in Q3) and housing (11.2% vs 9.3% in Q3) markets. Foreign buyers in QLD also increased their market presence in established apartment (10.8% vs 9.5% in Q3) and housing (7.9% vs 7.7% in Q3) markets during the Survey period. National Australia Bank - Group Economics | 5
  • 6. NAB Residential Property Survey Q4 2015 Type of property purchased by foreign buyers Overall, 53% of foreign purchases of Australian residential property were for apartments, 32% houses and 16% for re-development. However, these ratios continue to vary widely by state. Buying patterns in VIC were broadly unchanged. Apartments accounted for 44.2% of all foreign purchases in VIC in Q4 (41.8% in Q3), 35.2% were houses (34.5% in Q3) and 20.6% for re-development (23.6% in Q3). In NSW, however, there was a notable change in foreign buyer preferences in Q4. Around 54% of all properties purchased by foreigners were apartments (43% in Q3) and 32.4% houses (38.8% in Q3). The share of property bought for re-development purposes fell to 14.1% (18.2% in Q3). In QLD, apartments accounted for 61% of all foreign purchases in Q4 (56.2% in Q3) - by far the biggest share among the main states. Houses accounted for 26.4% of foreign sales (29.5% in Q3) and re-development 13% (14.8% in Q3). In WA, apartment sales accounted for just over 1 in2 of all foreign purchases, houses for 29.8% (26% in Q3) and land for re-development 19.4% (24.6% in Q3). 51 31 18 49 32 19 53 32 16 0 10 20 30 40 50 60 Apartments Houses Dwelling/Land for Re- Development Type of Property Purchased by Foreign Investors (% share of total) Q2'15 Q3'15 Q4'15 % 44 54 61 51 35 32 26 30 21 14 13 19 0 10 20 30 40 50 60 70 Vic NSW Qld WA Type of Property Purchased by Foreign Investors by State (% share of total) Apartments Houses Dwelling/Land for Re-Development % Price range of property purchased by foreign buyers Just over 1 in 3 (33.7%) foreign apartment purchases were for properties valued less than $500,000 (34.5% in Q3) while 41.7% were for apartments valued between $500,000-$1 million (38.6% in Q3. Around 14.8% of apartments bought by foreigners were in the $1-2 million range (17.2% in Q3), with slightly more sales occurring in the $2-5 million range (7.9% vs 7.6% in Q3) and in the market for properties over $5 million (3.3% vs 2.5% in Q3). There were however, some interesting differences across states. More foreign buyers in VIC (40.5%) bought properties worth less than $500,000 than in other state, which may reflect a greater number of smaller apartments being built and marketed to these foreign buyers. In contrast, 18.2% of foreign buyers in NSW bought apartments valued between $1-2 million, compared to 7.9% in WA, 14.6% in QLD and 15.2% in VIC. Interestingly, more foreign buyers in VIC (5%) also purchased apartments valued over $5 million than in any other state. In the housing market, around 65% of foreign buyers nationally bought houses valued less than $1 million (broadly unchanged from Q3), with around 25% buying houses worth less than $500k (28% in Q3) and 40% in the $500,000- $1 million range (37% in Q3). Around 23% of all house sales were in the $1-2 million range (21% in Q3), with the balance of sales above $2 million. By state, around 53% of houses purchased by foreigners in NSW and 58% in VIC were valued below $1 million, compared to 72% in QLD and 79% in WA. Around 31% of all houses purchased in NSW and 24% in VIC were valued between $1-2 million, with almost 1 in 5 house sales in both VIC and NSW valued at over $2 million (with around 7% of total sales in both states for houses over $5 million). 0 10 20 30 40 50 Australia Victoria NSW Qld WA Price Range of All Apartments Purchased by Foreign Investors by State (% share of total) <$500k $500k to <$1mn $1mn to <$2mn $2mn to <$5mn $5mn+ % 0 10 20 30 40 50 60 Australia Victoria NSW Qld WA Price Range of All Houses Purchased by Foreign Investors by State (% share of total) <$500k $500k to <$1mn $1mn to <$2mn $2mn to <$5mn $5mn+ % National Australia Bank - Group Economics | 6
  • 7. NAB Residential Property Survey Q4 2015 5. Suburbs tipped to enjoy above average capital growth 6. Survey Respondents Expectations (average) House Prices Q2 15 Q3 15 Q4 15 Next qtr Next 1 yr Next 2 yrs VIC 2.3 1.5 0.9 0.4 0.7 1.0 NSW 2.6 2.1 -0.2 -0.2 0.0 0.2 QLD 1.1 0.9 0.4 0.9 1.9 2.7 SA/NT -1.8 -0.5 -0.5 -0.2 -0.6 0.2 WA -1.6 -1.7 -2.0 -1.6 -0.5 0.6 Australia 1.3 0.8 0.0 0.0 0.5 1.0 Rents Q2 15 Q3 15 Q4 15 Next Qtr Next 1 yr Next 2 yrs VIC 0.7 0.6 0.6 0.9 1.7 2.0 NSW 0.4 0.4 0.3 1.0 1.8 2.6 QLD -0.3 0.2 -0.6 -0.4 0.6 0.9 SA/NT -2.1 -2.4 -2.0 -0.7 0.0 -0.1 WA -3.0 -2.2 -2.8 -2.0 -0.4 1.0 Australia -0.4 -0.4 -0.4 0.1 1.0 1.6 WESTERN AUSTRALIA Alkimos, Armadale QUEENSLAND Brisbane, Bulimba, Coomera, Gold Coast, Lutwyche, Mermaid Beach, New Farm, Springfield, Teneriffe, West End NEW SOUTH WALES Annandale, Blacktown, Enmore, Gerringong, Parramatta, Penrith, Riverstone, Ryde, Sydney VICTORIA Dandenong, Frankston, Melbourne National Australia Bank - Group Economics | 7
  • 8. NAB Residential Property Survey Q4 2015 7. NAB’s View of Residential House Prices The Australian housing market had another solid year in 2015 - albeit with mixed results across the capital cities - but weakening fundamentals have already seen the market start to cool, suggesting that the best of the price gains are probably behind us. Over 2015, Sydney recorded double digit growth in house prices (up 11.5%) for the third straight year, but a slowdown in the last few months saw Melbourne surpass it to record the fastest rate of growth (11.2%) of all the capital cities. Gains elsewhere have generally been more mixed, with Brisbane showing reasonable growth (4.3%), while cities where economic performance has been more sluggish have been in decline. Adelaide and Hobart prices were down 0.3% and 1.6% respectively, while the mining downturn has had a particularly large impact on Perth, where house prices dropped 3.8%. Outcomes across the major apartment markets have been broadly similar, although the Sydney market was the clear outperformer (up 11.3%). Going into 2016, momentum in the market is expected to flatten out as credit restrictions on investors and worsening affordability bites in Sydney and - to a lesser extent Melbourne - where foreign investment is a larger element. Additionally, the existing pipeline of residential construction remains large, especially in the apartment market, which will more than offset new demand. It is also unclear just how restricting the investor regulatory changes will be, given that to-date, at least, there seems to have been some shifting in credit growth from investors to owner-occupiers. In response to these factors, the forecast for average national house price growth in 2016 has been lowered further to just 1%, from 2.3%. However, given the growing importance of units to the current housing market, we have included our forecast for unit/apartment prices for the first time in this report. Given that much of the new supply is going into large apartment blocks (currently a small proportion of the housing stock), negative price pressures will be stronger for this market. Consequently, unit prices are expected to fall 1.2% over 2016. Aside from the strong supply response in the apartment sector, however, greater reliance on foreign buyers adds a degree of unpredictability to the outlook (both positive and negative). In 2016, the downward revision to national house price growth to 1% reflects weaker expectations in all capital cities. However, the sharp moderation in 2016 is largely driven by much flatter house price growth in both Sydney and Melbourne. NAB Economics expects house price growth to decelerate in Sydney to 0.6%, while price growth in Melbourne will ease to 2%. Consistent with the survey, Brisbane is tipped to see the fastest house price growth (3%) - a reflection of better affordability and an improving local economy - especially in South East Queensland. The Adelaide market is not expected to improve much in 2016 - an increase 0.2% roughly offsetting a similar fall in prices in 2015. Perth will remain very weak as prices decline by another 3%. In contrast, flat to falling apartment prices are expected across the board for the capital cities. The worst declines will again be in Perth (-3%), although Melbourne is expected to experience similar declines as the CBD in particular becomes further over supplied - with signs of elevated vacancy rates. Sydney unit prices will not escape the market slowdown (-0.6%) with Brisbane unit prices expected to decline by a similar amount. Despite a significant moderation in the housing market, our overall assessment is that the possibility of a more severe correction in the Australian housing market is still remote, although the risks have escalated over the past 6 months. Nevertheless, a sharp correction will likely require an external catalyst, triggering a sharp deterioration in the local labour market and/or a wave of Chinese selling. The other possible trigger - a large increase in interest rates - looks highly unlikely in the current environment. Authors: James Glenn (Senior Economist - Australia) Riki Polygenis (Head of Australian Economics) +(61 3) 9208 8129 +(61 3) 8679 9534 NAB House / Unit Price Forecasts (%) 2011 2012 2013 2014 2015 2016f 2011 2012 2013 2014 2015 2016f Capital City Average -4.0 -0.5 9.9 8.4 7.8 1.0 -2.6 0.5 9.0 5.1 7.9 -1.2 Sydney -2.6 1.3 15.2 13.4 11.5 0.6 -1.3 2.3 11.6 8.3 11.3 -0.6 Melbourne -4.4 -2.9 8.5 8.4 11.7 2.0 -3.2 -2.5 8.7 1.1 6.9 -3.0 Brisbane -7.0 -0.5 5.3 5.2 4.3 3.0 -2.0 -3.5 3.5 1.2 1.8 -0.6 Adelaide -3.8 -0.8 3.0 4.5 -0.3 0.2 -8.0 -0.5 0.6 2.5 1.4 0.2 Perth -3.4 0.6 10.2 2.1 -3.8 -3.0 -5.4 3.3 6.3 1.9 -3.5 -3.0 Hobart -8.8 -0.5 2.9 3.3 -1.6 -0.6 -5.6 4.2 -5.1 5.9 8.6 0.0 House Prices Unit Prices Percentage change represents through the year growth rates to Q4 SOURCE: Corelogic, NAB Economics National Australia Bank - Group Economics | 8
  • 9. NAB Residential Property Survey Q4 2015 About the Survey The NAB Quarterly Australian Residential Property Survey was first launched in Q1 2011. The survey was expanded from NAB's Quarterly Australian Commercial Property Survey, which was launched in April 2010. Given the large number of respondents who are also directly exposed to the residential market, NAB expanded the survey questionnaire to focus more extensively on the Australian Residential market. The large external panel of respondents consisted of Real Estate Agents/Managers, Property Developers, Asset/Fund Managers and Owners/Investors. Around 250 panellists participated in the Q4 2015 Survey and the breakdown of our Survey respondents - by location, property sector and business type - are shown below. Victoria 24% New South Wales 33% Queensland 21% SA/NT 8% Western Australia 12% ACT 2% Tasmania 2% Respondents by State Office Property 16% Retail Property 14% Industrial Property 17% Residential Property 42% Infrastructure 1% Hotels/ Entertainment 3% Other 7% Respondents by Property Sector Real Estate Agents and Managers 35% Asset Managers/Property Operators 14% Property Developers 14% Owners/Investors in Real Property 16% Fund Managers (Real Estate) 4% Valuers 8% Other 4% Respondents by Business Type National Australia Bank - Group Economics | 9
  • 10. NAB Residential Property Survey Q4 2015 Group Economics Alan Oster Group Chief Economist +61 3 8634 2927 Jacqui Brand Personal Assistant +61 3 8634 2181 Australian Economics & Commodities Riki Polygenis Head of Australian Economics +61 3 8679 9534 James Glenn Senior Economist - Australia +(61 3) 9208 8129 Vyanne Lai Economist - Australia +(61 3) 8634 0198 Amy Li Economist - Australia +(61 3) 8634 1563 Phin Ziebell Economist - Agribusiness +(61 4) 55 051 024 Industry & Behavioural Economics Dean Pearson Head of Behavioural & Industry Economics +(61 3) 8634 2331 Robert De Iure Senior Economist - Behavioural & Industry Economics +(61 3) 8634 4611 Brien McDonald Senior Economist - Behavioural & Industry Economics +(61 3) 8634 3837 International Economics Tom Taylor Head of Economics, International +61 3 8634 1883 Tony Kelly Senior Economist - International +(61 3) 9208 5049 Gerard Burg Senior Economist - Asia +(61 3) 8634 2788 John Sharma Economist - Sovereign Risk +(61 3) 8634 4514 Global Markets Research Peter Jolly Global Head of Research +61 2 9237 1406 Australia Economics Ivan Colhoun Chief Economist, Markets +61 2 9237 1836 David de Garis Senior Economist +61 3 8641 3045 Tapas Strickland Economist +61 2 9237 1980 FX Strategy Ray Attrill Global Co-Head of FX Strategy +61 2 9237 1848 Rodrigo Catril Currency Strategist +61 2 9293 7109 Interest Rate Strategy Skye Masters Head of Interest Rate Strategy +61 2 9295 1196 Credit Research Michael Bush Head of Credit Research +61 3 8641 0575 Simon Fletcher Senior Credit Analyst - FI +61 29237 1076 Andrew Jones Credit Analyst +61 3 8641 0978 Distribution Barbara Leong Research Production Manager +61 2 9237 8151 New Zealand Stephen Toplis Head of Research, NZ +64 4 474 6905 Craig Ebert Senior Economist +64 4 474 6799 Doug Steel Senior Economist +64 4 474 6923 Kymberly Martin Senior Market Strategist +64 4 924 7654 Jason Wong Currency Strategist +64 4 924 7652 Yvonne Liew Publications & Web Administrator +64 4 474 9771 UK/Europe Nick Parsons Head of Research, UK/Europe, and Global Co-Head of FX Strategy +44 207 710 2993 Gavin Friend Senior Markets Strategist +44 207 710 2155 Derek Allassani Research Production Manager +44 207 710 1532 Asia Christy Tan Head of Markets Strategy/Research, Asia +852 2822 5350 Julian Wee Senior Markets Strategist, Asia +65 6632 8055 Important Notice This document has been prepared by National Australia Bank Limited ABN 12 004 044 937 AFSL 230686 ("NAB"). Any advice contained in this document has been prepared without taking into account your objectives, financial situation or needs. Before acting on any advice in this document, NAB recommends that you consider whether the advice is appropriate for your circumstances. NAB recommends that you obtain and consider the relevant Product Disclosure Statement or other disclosure document, before making any decision about a product including whether to acquire or to continue to hold it. Please click here to view our disclaimer and terms of use. National Australia Bank - Group Economics | 10