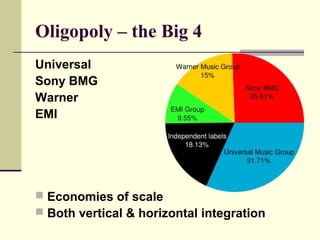
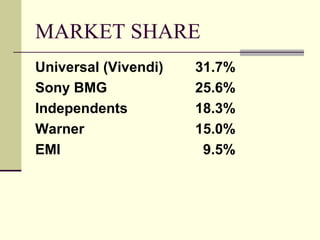
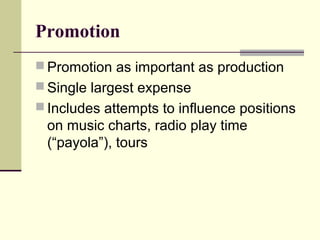
MUSIC INDUSTRY
Oligopoly – the Big 4
Universal
Sony BMG
Warner
EMI
 Economies of scale
 Both vertical & horizontal integration
MARKET SHARE
Universal (Vivendi) 31.7%
Sony BMG 25.6%
Independents 18.3%
Warner 15.0%
EMI 9.5%
Music Sales Trends
U.S Music Sales (1/3 of worldwide sales)
 2007 $10.4bn (down 9%)
 2006 $11.5bn
 Down from $12.3bn in 2005
 Down from $14.5bn in 1999
MUSIC REVENUE TRENDS
Sales of CDs are falling steadily
Sales of digital tracks are rising
Piracy / CD burning represents annual
lost revenue of $4bn+
Who’s Buying?
1. 45+ 26%
2. 15–19 13%
3. 25–29 13%
What Are We Buying?
1. Rock 34.0%
2. Country 13.0%
3. Rap/Hip-hop 11.4%
4. R&B/Urban 11.0%
SOURCES OF COMPETITION
 Piracy of CDs and Cassettes.
 In No.2 market, Japan, 236m CD-Rs were
burned in 2002, while legitimate CD sales
were 229m.
 In Spain, two out of five records were pirated.
 MP3 file swapping
 Competition from new forms of entertainment
including video games and DVD films
Promotion
 Promotion as important as production
 Single largest expense
 Includes attempts to influence positions
on music charts, radio play time
(“payola”), tours
Conglomeration
 Synergies through ties to film
studios, TV networks, publishing,
etc.
 film scores developed from
corporate-owned library
 music video channels promote own
artists
 artists appear on talk shows
 magazine articles
Industry Strategies
 commonly 5 renewable 1-album contracts,
 royalty system pays the artist 7-15%
payable after costs are met (plus
songwriter publishing royalties),
 Decisions according to track records and
reputations: celebrity power
 Pre-selection systems: selecting that
which is most likely to succeed in light of
recent successes

Music Industry Analysis

  • 1.
  • 2.
    Oligopoly – theBig 4 Universal Sony BMG Warner EMI  Economies of scale  Both vertical & horizontal integration
  • 3.
    MARKET SHARE Universal (Vivendi)31.7% Sony BMG 25.6% Independents 18.3% Warner 15.0% EMI 9.5%
  • 4.
    Music Sales Trends U.SMusic Sales (1/3 of worldwide sales)  2007 $10.4bn (down 9%)  2006 $11.5bn  Down from $12.3bn in 2005  Down from $14.5bn in 1999
  • 5.
    MUSIC REVENUE TRENDS Salesof CDs are falling steadily Sales of digital tracks are rising Piracy / CD burning represents annual lost revenue of $4bn+
  • 6.
    Who’s Buying? 1. 45+26% 2. 15–19 13% 3. 25–29 13%
  • 7.
    What Are WeBuying? 1. Rock 34.0% 2. Country 13.0% 3. Rap/Hip-hop 11.4% 4. R&B/Urban 11.0%
  • 8.
    SOURCES OF COMPETITION Piracy of CDs and Cassettes.  In No.2 market, Japan, 236m CD-Rs were burned in 2002, while legitimate CD sales were 229m.  In Spain, two out of five records were pirated.  MP3 file swapping  Competition from new forms of entertainment including video games and DVD films
  • 9.
    Promotion  Promotion asimportant as production  Single largest expense  Includes attempts to influence positions on music charts, radio play time (“payola”), tours
  • 10.
    Conglomeration  Synergies throughties to film studios, TV networks, publishing, etc.  film scores developed from corporate-owned library  music video channels promote own artists  artists appear on talk shows  magazine articles
  • 11.
    Industry Strategies  commonly5 renewable 1-album contracts,  royalty system pays the artist 7-15% payable after costs are met (plus songwriter publishing royalties),  Decisions according to track records and reputations: celebrity power  Pre-selection systems: selecting that which is most likely to succeed in light of recent successes