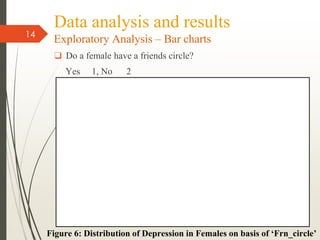
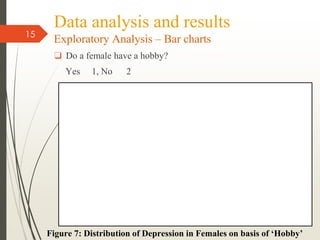
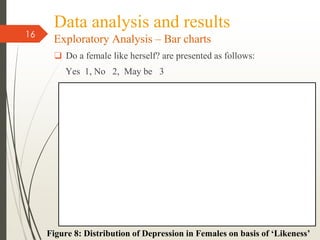
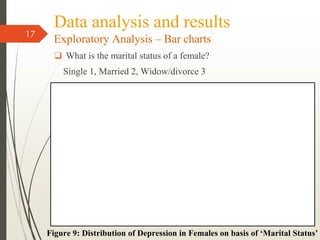
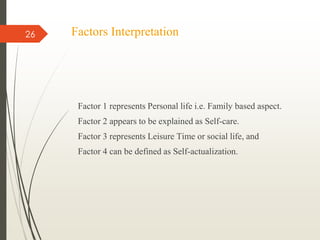
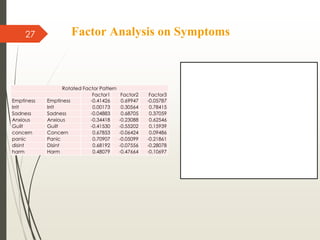
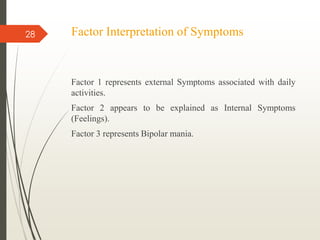
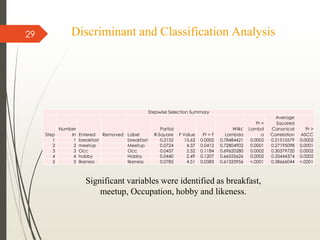
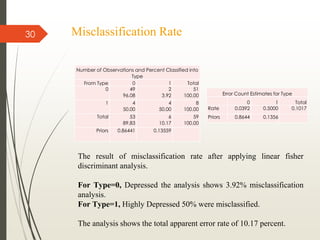
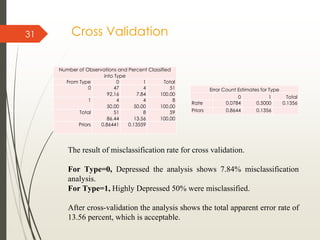
3. Introduction
3
❑ According to the article published by the Guardian The News,
depression is on its rise.
❑ According to the World Health Organization (WHO), there was
increased number of cases for depression reported from a period of
2005-2015, by nearly a fifth.
❑ The report suggested that people born after 1945 has 10 times more
likelihood of being depressed.
❑ Trend of depression in women are more likely than men.
❑ Depression is a complex term, it is not merely a feeling of
disappointment, being down or dump, not the intense feeling of grief
one experienced after a huge loss.
4. Introduction
4
❑ It is a cluster of symptoms and factors that affects a person’s daily
functioning.
❑ It has been termed as the 10th of the leading cause of early death.
❑ Keeping the complex matter in mind and the trend with which the
clinical depression is on a rise especially in women; a survey with
the aid of medical students of Dubai Medical College was
conducted to see what symptoms were experienced by the person
and how common factors of one’s daily life effect the level of
depression.
5. Aim and Objectives
❑ The Aim of the study and survey was to statistically
analyze what variables are responsible for defining
depression and how can they be factorized together.
❑ The objectives of the study and survey was :
� To conduct an exploratory study for each variable
associated with personal, social and daily aspect of one’s
life on different level of depression.
� To evaluate the factors that define the depression in
females.
� To classify patients in groups based on the personal, social
and daily life variables.
5
6. Literature review
❑ (Regestein et al., 2010) conducted a study with the objective of
evaluating relationships between sleep habits and depressive
symptoms.
❑ Pilot study data were collected about sleep schedules, related
factors and depression in female college students.
❑ Stepwise logistic regression was used to find whether students
who reported significant sleep debt also reported
disproportionately greater sleepiness, as adjusted for arising
times, number of daily naps or irregular bedtimes.
❑ Multivariate logistic regression was used to find sleep measures
that independently correlated with depression scores.
❑ larger female student numbers exposed a relationship between
diminished sleep and depression.
❑ The main study also demonstrated that bedtimes later than 2:00
a.m. risked higher Depression.
❑ Connections were found between sleep and depression clinical
problems such as energy level, self-image, concentration,
appetite.
6
7. Literature review
❑ (White et al., 1997) study was on women doctors from 25-35 years.
❑ Researchers identified stressors experienced by women who opt for
hospital medicine and general practice.
❑ The research was conducted using face-to-face pilot interviews and
postal questionnaires.
❑ The 22 items on the sources of pressure scale were factor analyzed.
❑ Factor scores were computed for each respondent and used in
independent samples t-test analysis.
❑ Five factors were extracted: career development; job demands;
organizational climate; working hours; external factors.
❑ A stepwise multiple regression was performed to identify which
pressure variables were predictive of mental health in GPs and HDs.
❑ No statistically significant differences were observed between HDs
and GPs on the measures of mental health.
7
8. Literature review
❑ (Lombardo et al., 2014) conducted a research on association
between eating disorders and reduction of sleep quality.
❑ 1019 female university students participated in the study.
❑ questionnaires were used and evidence was found that increased
severity of insomnia is associated with higher severity of disordered
eating.
❑ Both insomnia and disordered eating symptoms were related to
depression.
❑ The sleep groups classified and compared in respect to body mass
index, age, and depression using one-way (ANOVA).
❑ Disordered Eating Questionnaire scores were used as a continuous
dependent variable in an analysis of covariance (ANCOVA)
comparing sleep groups defined on the basis of the Sleep Disorders
Questionnaire.
8
9. Literature review
❑ Depression is a complication of mild traumatic brain injury (mTBI).
❑ A research indicated that abnormalities in the autonomic nervous
system (ANS) can be evaluated by a noninvasive power spectral
analysis of the heart rate variability (HRV).
❑ (Sung et al., 2016) investigated whether a frequency-domain
analysis of HRV was correlated with depression in mTBI patients.
❑ 181 mTBI patients and 83 healthy controls were recruited .
❑ Spearman’s correlation coefficient was used to analyze the
correlation between BDI scores and HRV parameters.
❑ Logistic regression was used to examine the odds ratio (OR) of
depression with or without adjusting for ageeers as healthy controls.
❑ Statistical analyses were performed using SAS (v. 9.4) .
❑ Female mTBI patients were more vulnerable to depression
accompanied by reduced HRV compared to healthy controls
9
10. Data analysis and results
Exploratory Analysis – Bar charts
❑ How often do a female eat breakfast?
Everyday 1, Somedays 2, Never 3
10
Figure 2: Distribution of Depression in Females on basis of ‘Breakfast’
11. Data analysis and results
Exploratory Analysis – Bar charts
❑ How many children do a female have?
No children – 0,1 child, 2 children,3 children, More than 3 children - 4
11
Figure 3: Distribution of Depression in Females on basis of ‘No of Children’
12. Data analysis and results
Exploratory Analysis – Bar charts
❑ how often a female exercise?
Always 1, Occasionally 2 , Rarely 3
12
Figure 4: Distribution of Depression in Females on basis of ‘Exercise’
13. Data analysis and results
Exploratory Analysis – Bar charts
❑ what family type a female has?
Nuclear 1, Extended 2
13
Figure 5: Distribution of Depression in Females on basis of ‘Family_Type’
14. Data analysis and results
Exploratory Analysis – Bar charts
❑ Do a female have a friends circle?
Yes 1, No 2
14
Figure 6: Distribution of Depression in Females on basis of ‘Frn_circle’
15. Data analysis and results
Exploratory Analysis – Bar charts
❑ Do a female have a hobby?
Yes 1, No 2
15
Figure 7: Distribution of Depression in Females on basis of ‘Hobby’
16. Data analysis and results
Exploratory Analysis – Bar charts
❑ Do a female like herself? are presented as follows:
Yes 1, No 2, May be 3
16
Figure 8: Distribution of Depression in Females on basis of ‘Likeness’
17. Data analysis and results
Exploratory Analysis – Bar charts
❑ What is the marital status of a female?
Single 1, Married 2, Widow/divorce 3
17
Figure 9: Distribution of Depression in Females on basis of ‘Marital Status’
18. Data analysis and results
Exploratory Analysis – Bar charts
❑ How often do a female meet her friends?
Always 1, Occasionally 2, Rarely 3
18
Figure 10: Distribution of Depression in Females on basis of ‘meetup’
19. Data analysis and results
Exploratory Analysis – Bar charts
❑ How often do a female spend time for Self-care?
Always 1, Occasionally 2, Rarely 3
19
Figure 15: Distribution of Depression in Females on basis of ‘Self care’
20. Data analysis and results
Exploratory Analysis – Bar charts
❑ How a female defines her weekend?
Self-care time 1, Family time 2, House chores time 3
20
Figure 18: Distribution of Depression in Females on basis of ‘Weekend’
21. Principal Component Analysis
Principal Component Analysis was used to identify outliers.
The component scores matrix shows the distribution of each
principal component score and a scatter plot of each pair of
component scores.
The observations in the data set and their scores on first ten
components were shown in Figure 19. Score plots provide
interesting information about patterns in the observations such
as outliers and groupings of observations. From the figure no
outlier’s values were found.
21
23. Factor Analysis on Variables
Factor Analysis is one of the most popular multivariate
statistical techniques. In order to achieve the objective of being
able to interpretive the variables that define depression in
females in reduce factors
23
26. Factors Interpretation
Factor 1 represents Personal life i.e. Family based aspect.
Factor 2 appears to be explained as Self-care.
Factor 3 represents Leisure Time or social life, and
Factor 4 can be defined as Self-actualization.
26
28. Factor Interpretation of Symptoms
Factor 1 represents external Symptoms associated with daily
activities.
Factor 2 appears to be explained as Internal Symptoms
(Feelings).
Factor 3 represents Bipolar mania.
28
29. Discriminant and Classification Analysis
Stepwise Selection Summary
Step
Number
In Entered Removed Label
Partial
R-Square F Value Pr > F
Wilks'
Lambda
Pr <
Lambd
a
Average
Squared
Canonical
Correlation
Pr >
ASCC
1 1 breakfast breakfast 0.2152 15.63 0.0002 0.78484421 0.0002 0.21515579 0.0002
2 2 meetup Meetup 0.0724 4.37 0.0412 0.72804902 0.0001 0.27195098 0.0001
3 3 Occ Occ 0.0437 2.52 0.1184 0.69620280 0.0002 0.30379720 0.0002
4 4 hobby Hobby 0.0440 2.49 0.1207 0.66555626 0.0002 0.33444374 0.0002
5 5 likeness likeness 0.0785 4.51 0.0383 0.61333956 <.0001 0.38666044 <.0001
29
Significant variables were identified as breakfast,
meetup, Occupation, hobby and likeness.
30. Misclassification Rate
Number of Observations and Percent Classified into
Type
From Type 0 1 Total
0 49
96.08
2
3.92
51
100.00
1 4
50.00
4
50.00
8
100.00
Total 53
89.83
6
10.17
59
100.00
Priors 0.86441 0.13559
30
Error Count Estimates for Type
0 1 Total
Rate 0.0392 0.5000 0.1017
Priors 0.8644 0.1356
The result of misclassification rate after applying linear fisher
discriminant analysis.
For Type=0, Depressed the analysis shows 3.92% misclassification
analysis.
For Type=1, Highly Depressed 50% were misclassified.
The analysis shows the total apparent error rate of 10.17 percent.
31. Cross Validation
Number of Observations and Percent Classified
into Type
From Type 0 1 Total
0 47
92.16
4
7.84
51
100.00
1 4
50.00
4
50.00
8
100.00
Total 51
86.44
8
13.56
59
100.00
Priors 0.86441 0.13559
31
Error Count Estimates for Type
0 1 Total
Rate 0.0784 0.5000 0.1356
Priors 0.8644 0.1356
The result of misclassification rate for cross validation.
For Type=0, Depressed the analysis shows 7.84% misclassification
analysis.
For Type=1, Highly Depressed 50% were misclassified.
After cross-validation the analysis shows the total apparent error rate of
13.56 percent, which is acceptable.
32. Conclusion
❑ From the exploratory analysis, it was found that depressed females are
either in the beginning of their lives at their twenties or at their fifties.
However, the highly depressed females are all in their twenties and that
shows that younger generation are suffering the most.
❑ Also, from the study it is concluded that introvert females tend to be
highly depressed.
❑ Moreover, females who are highly depressed do not like themselves and
occasionally get praised although they have friends circle, however, they
rarely meet with their friends. Females with extended family represent the
highest portion in both depressed and highly depressed females.
❑ The study shows that highly depressed women are married and least are
divorced or widowed. In addition, the highest number of depressed and
highly depressed females are the ones with lower number of children.
Consequently, the highest number of females in both categories are
without children.
32
33. Conclusion
❑ Lack of sleep was found a factor that increases number of
depressed and highly depressed females. Females who have
irregular diet especially breakfast tend to be highly depressed.
❑ Exercising a lot contributes to minimizing depression in females.
❑ The study shows that females with hobbies are still most
depressed and highly depressed females unless their hobby is
shopping then then tend to be almost the least.
❑ Statistics showed that highly depressed females spend their
weekend in house chores and occasionally do recreational
activities.
33
34. Conclusion
❑ Through Stepwise Selection method for Discriminant analysis,
interesting facts were found that the most significant variables for
classification of depression level in females are:
❑ Breakfast,
❑ Meetup,
❑ Occupation,
❑ Hobby and
❑ Likeness.
34