Download to read offline


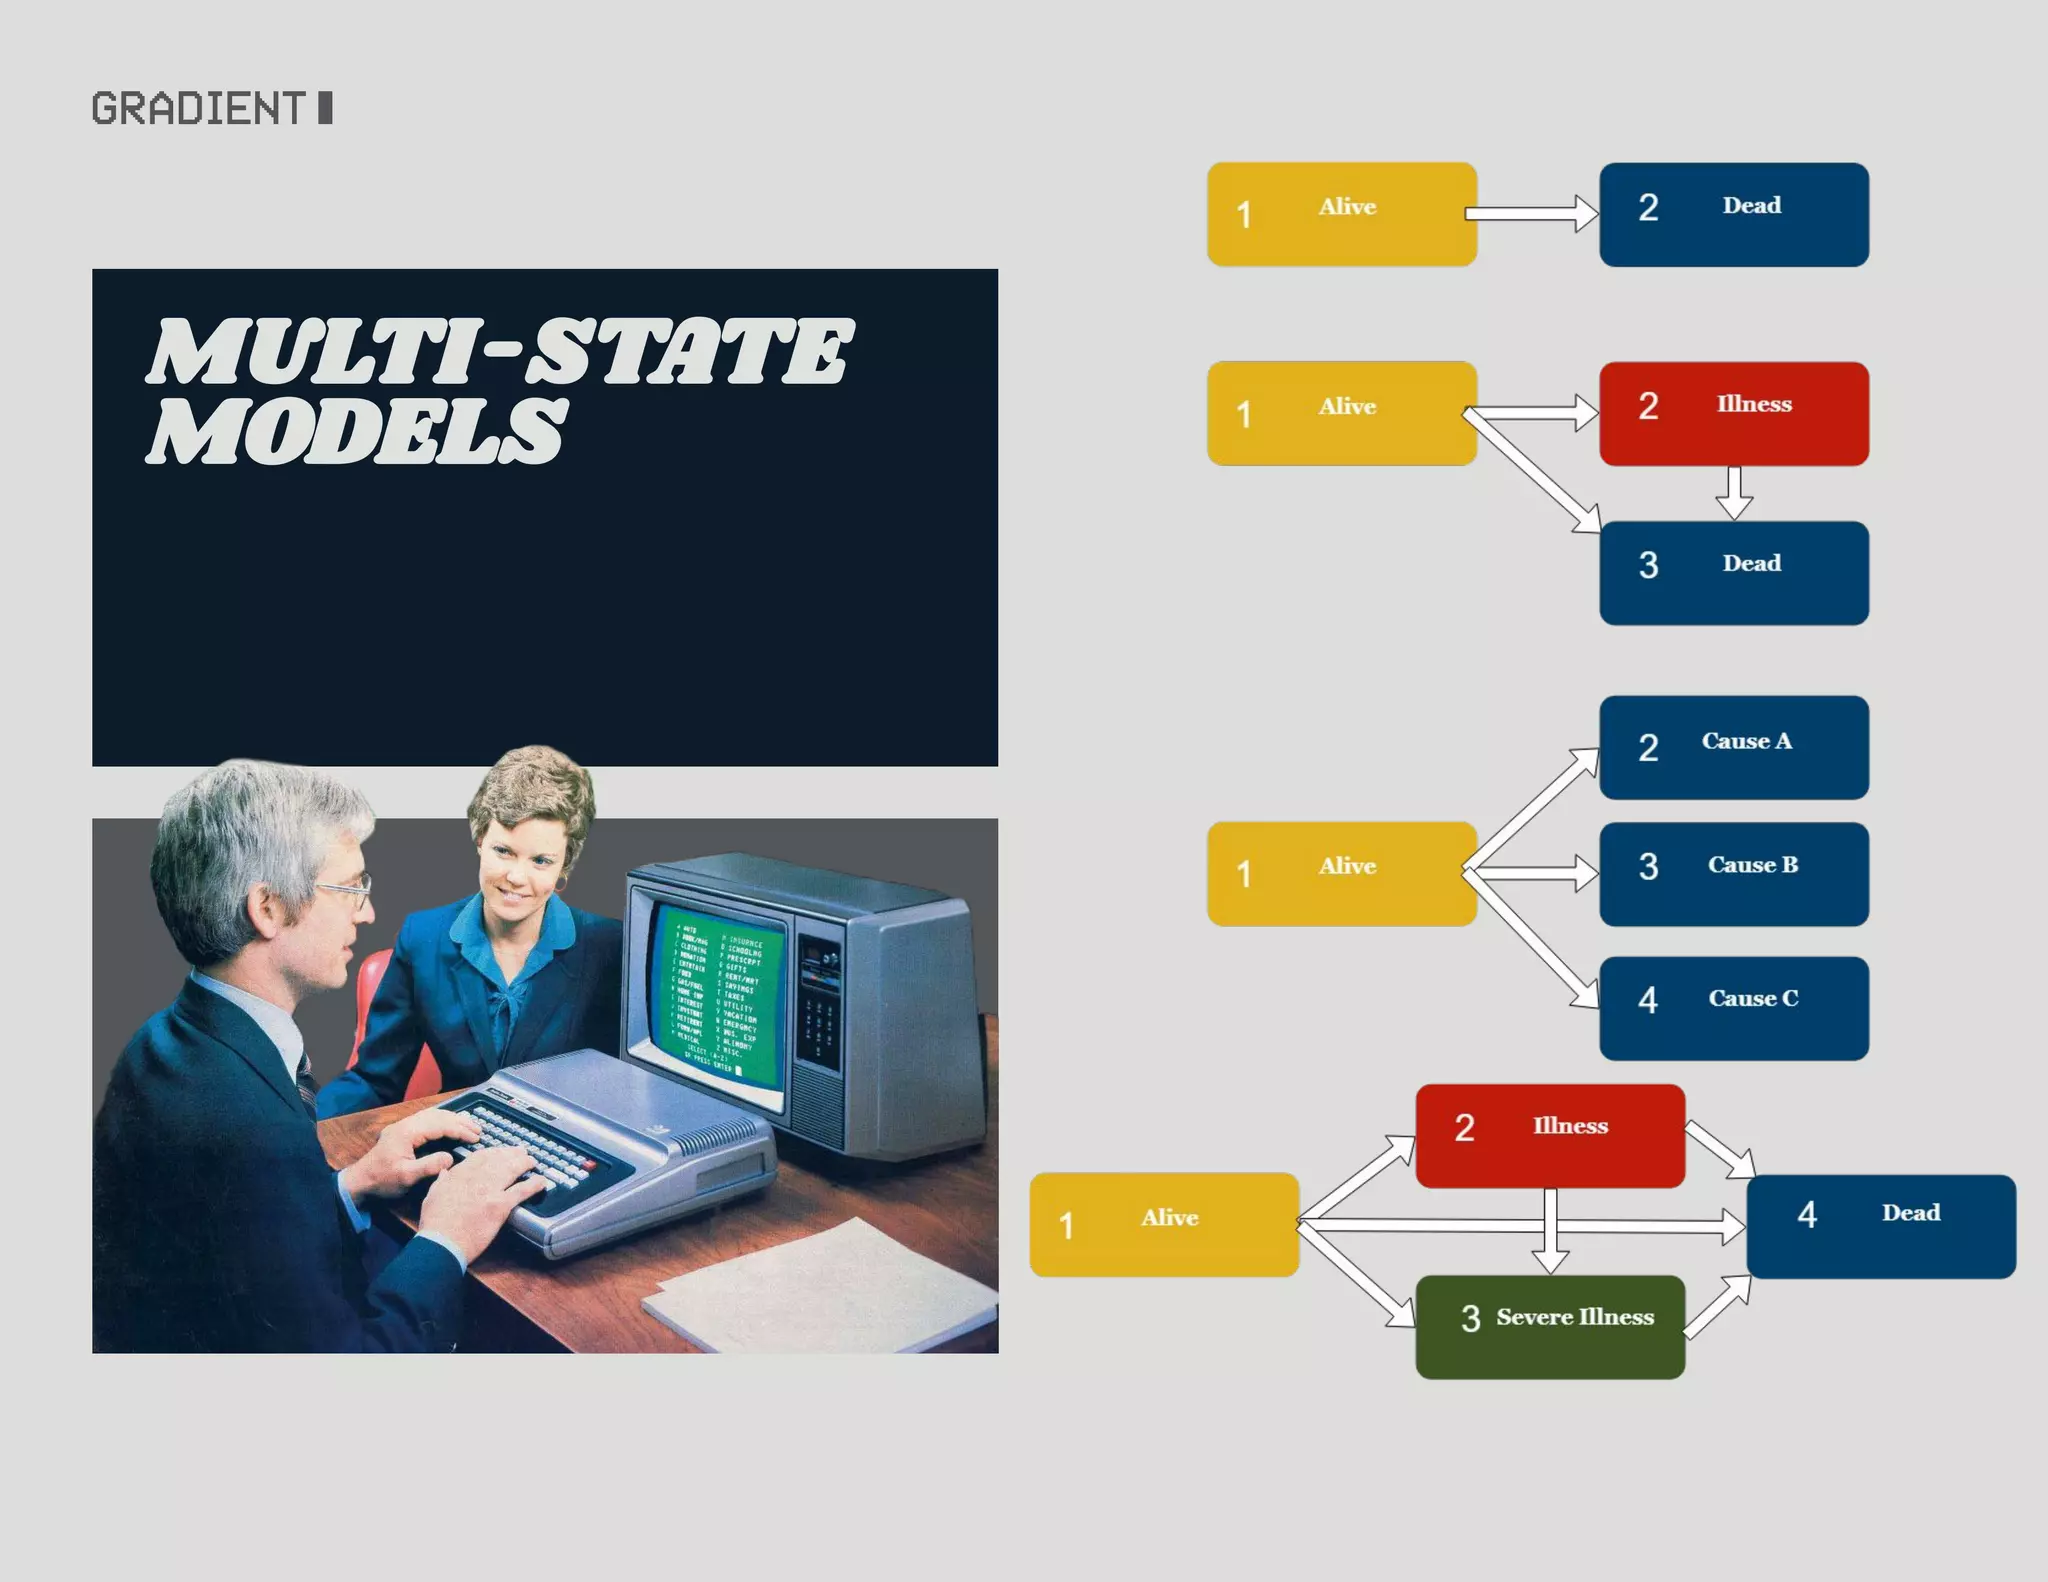
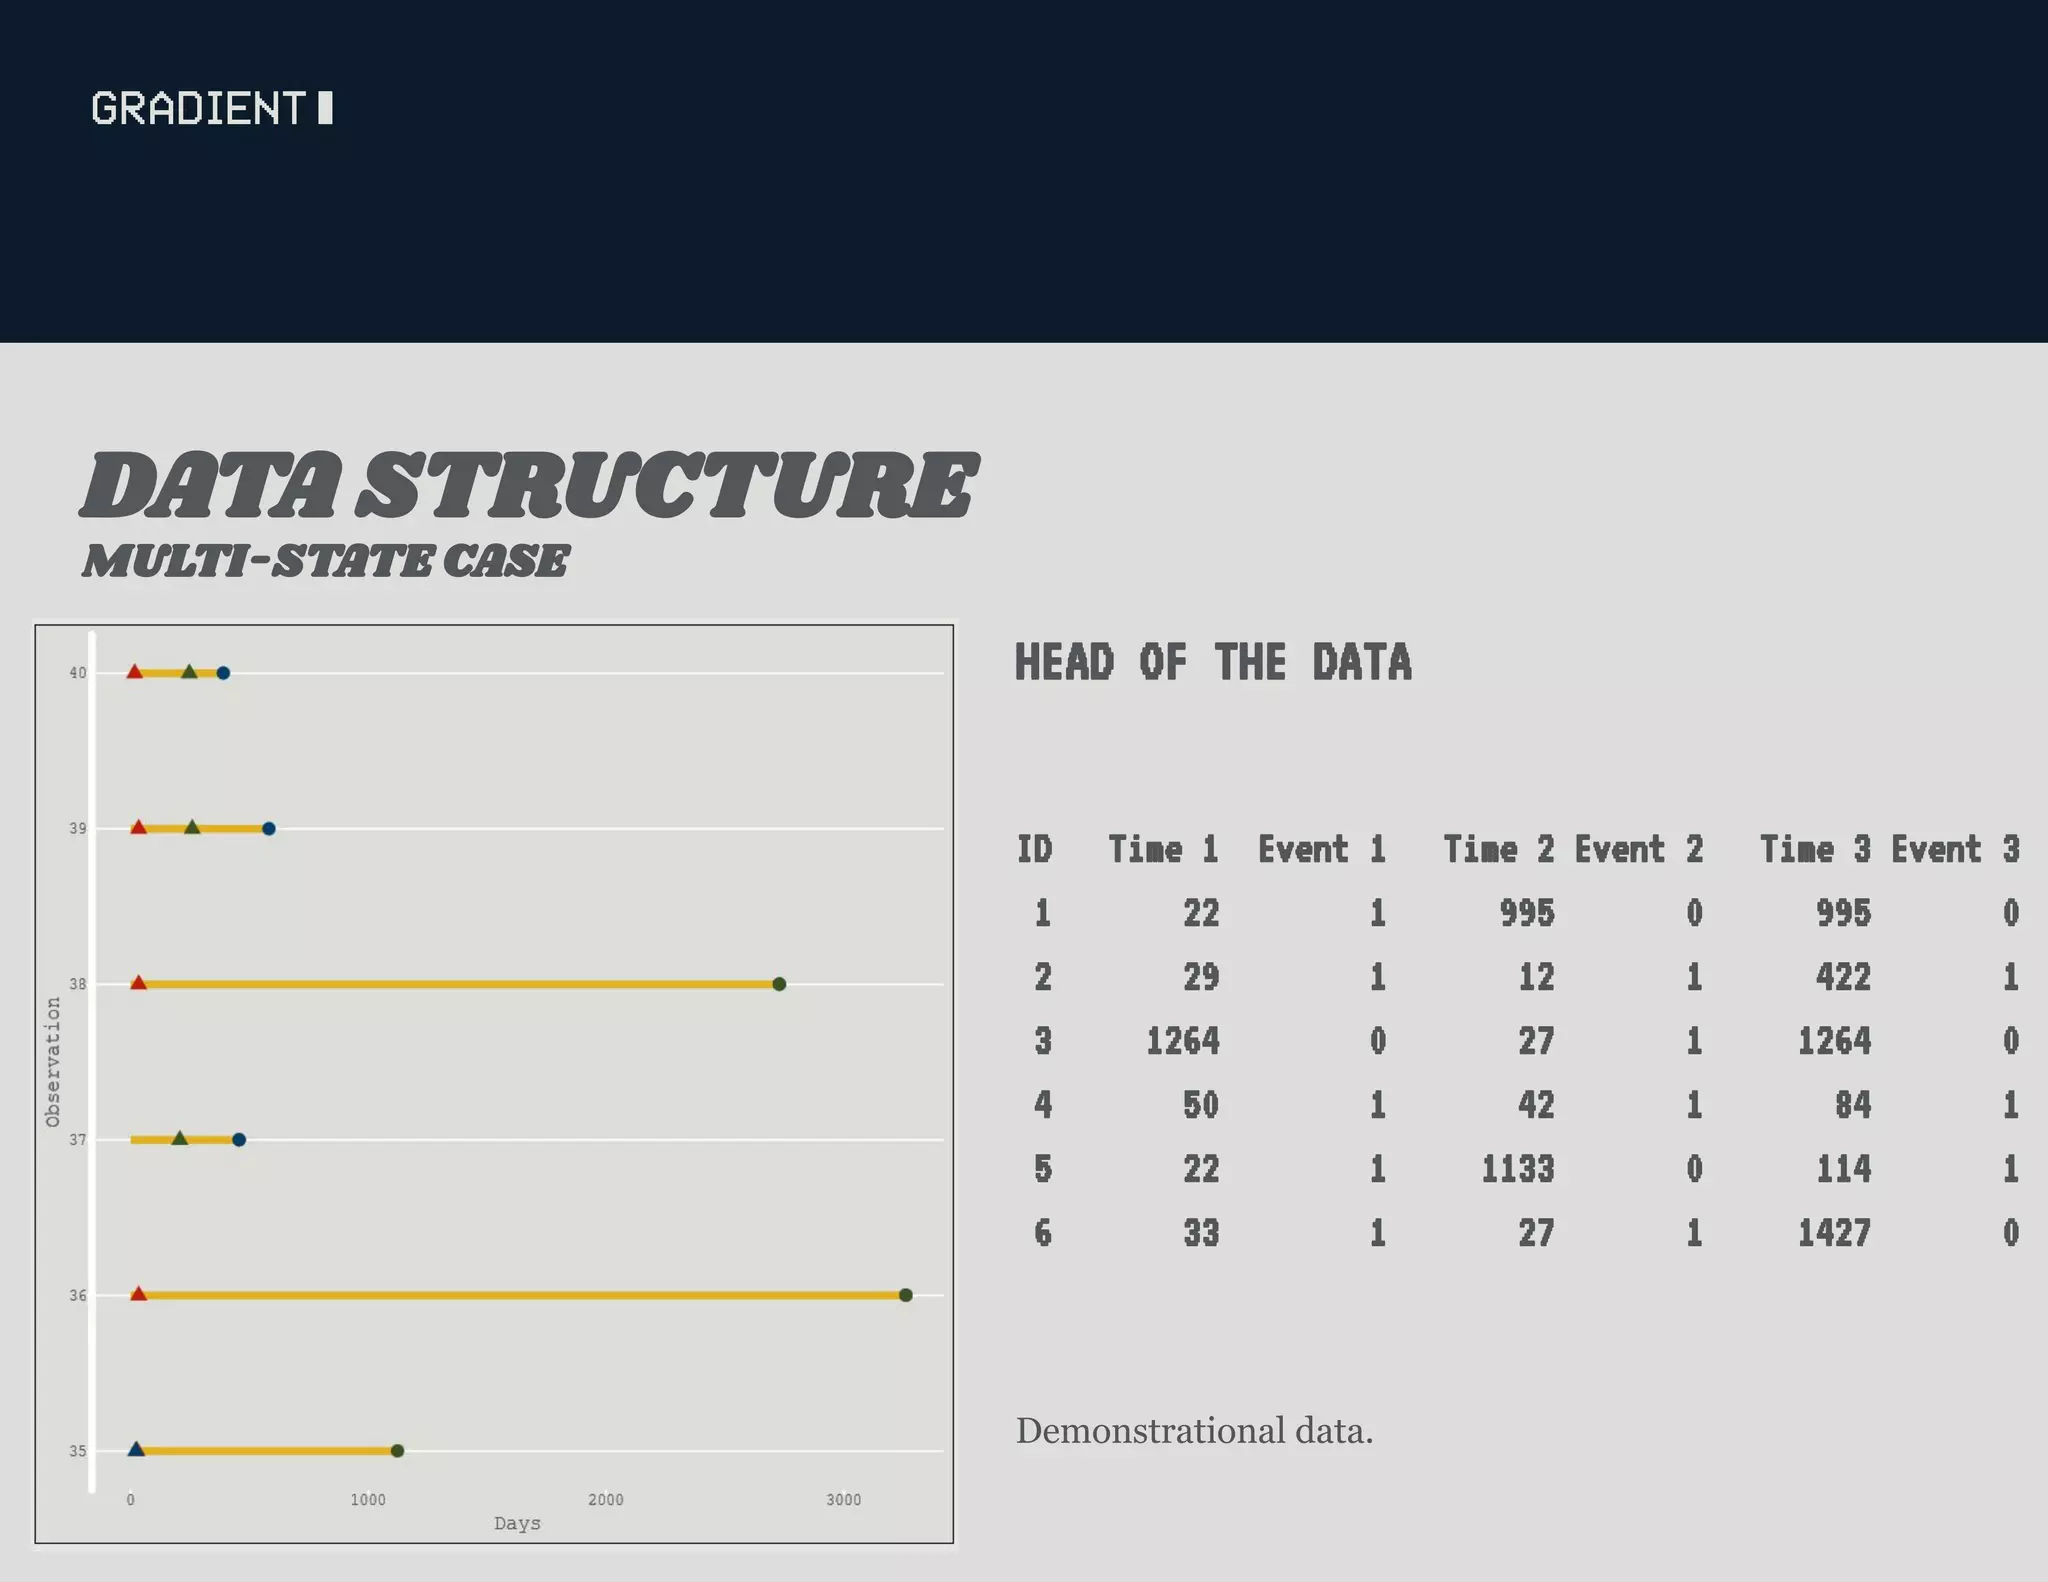
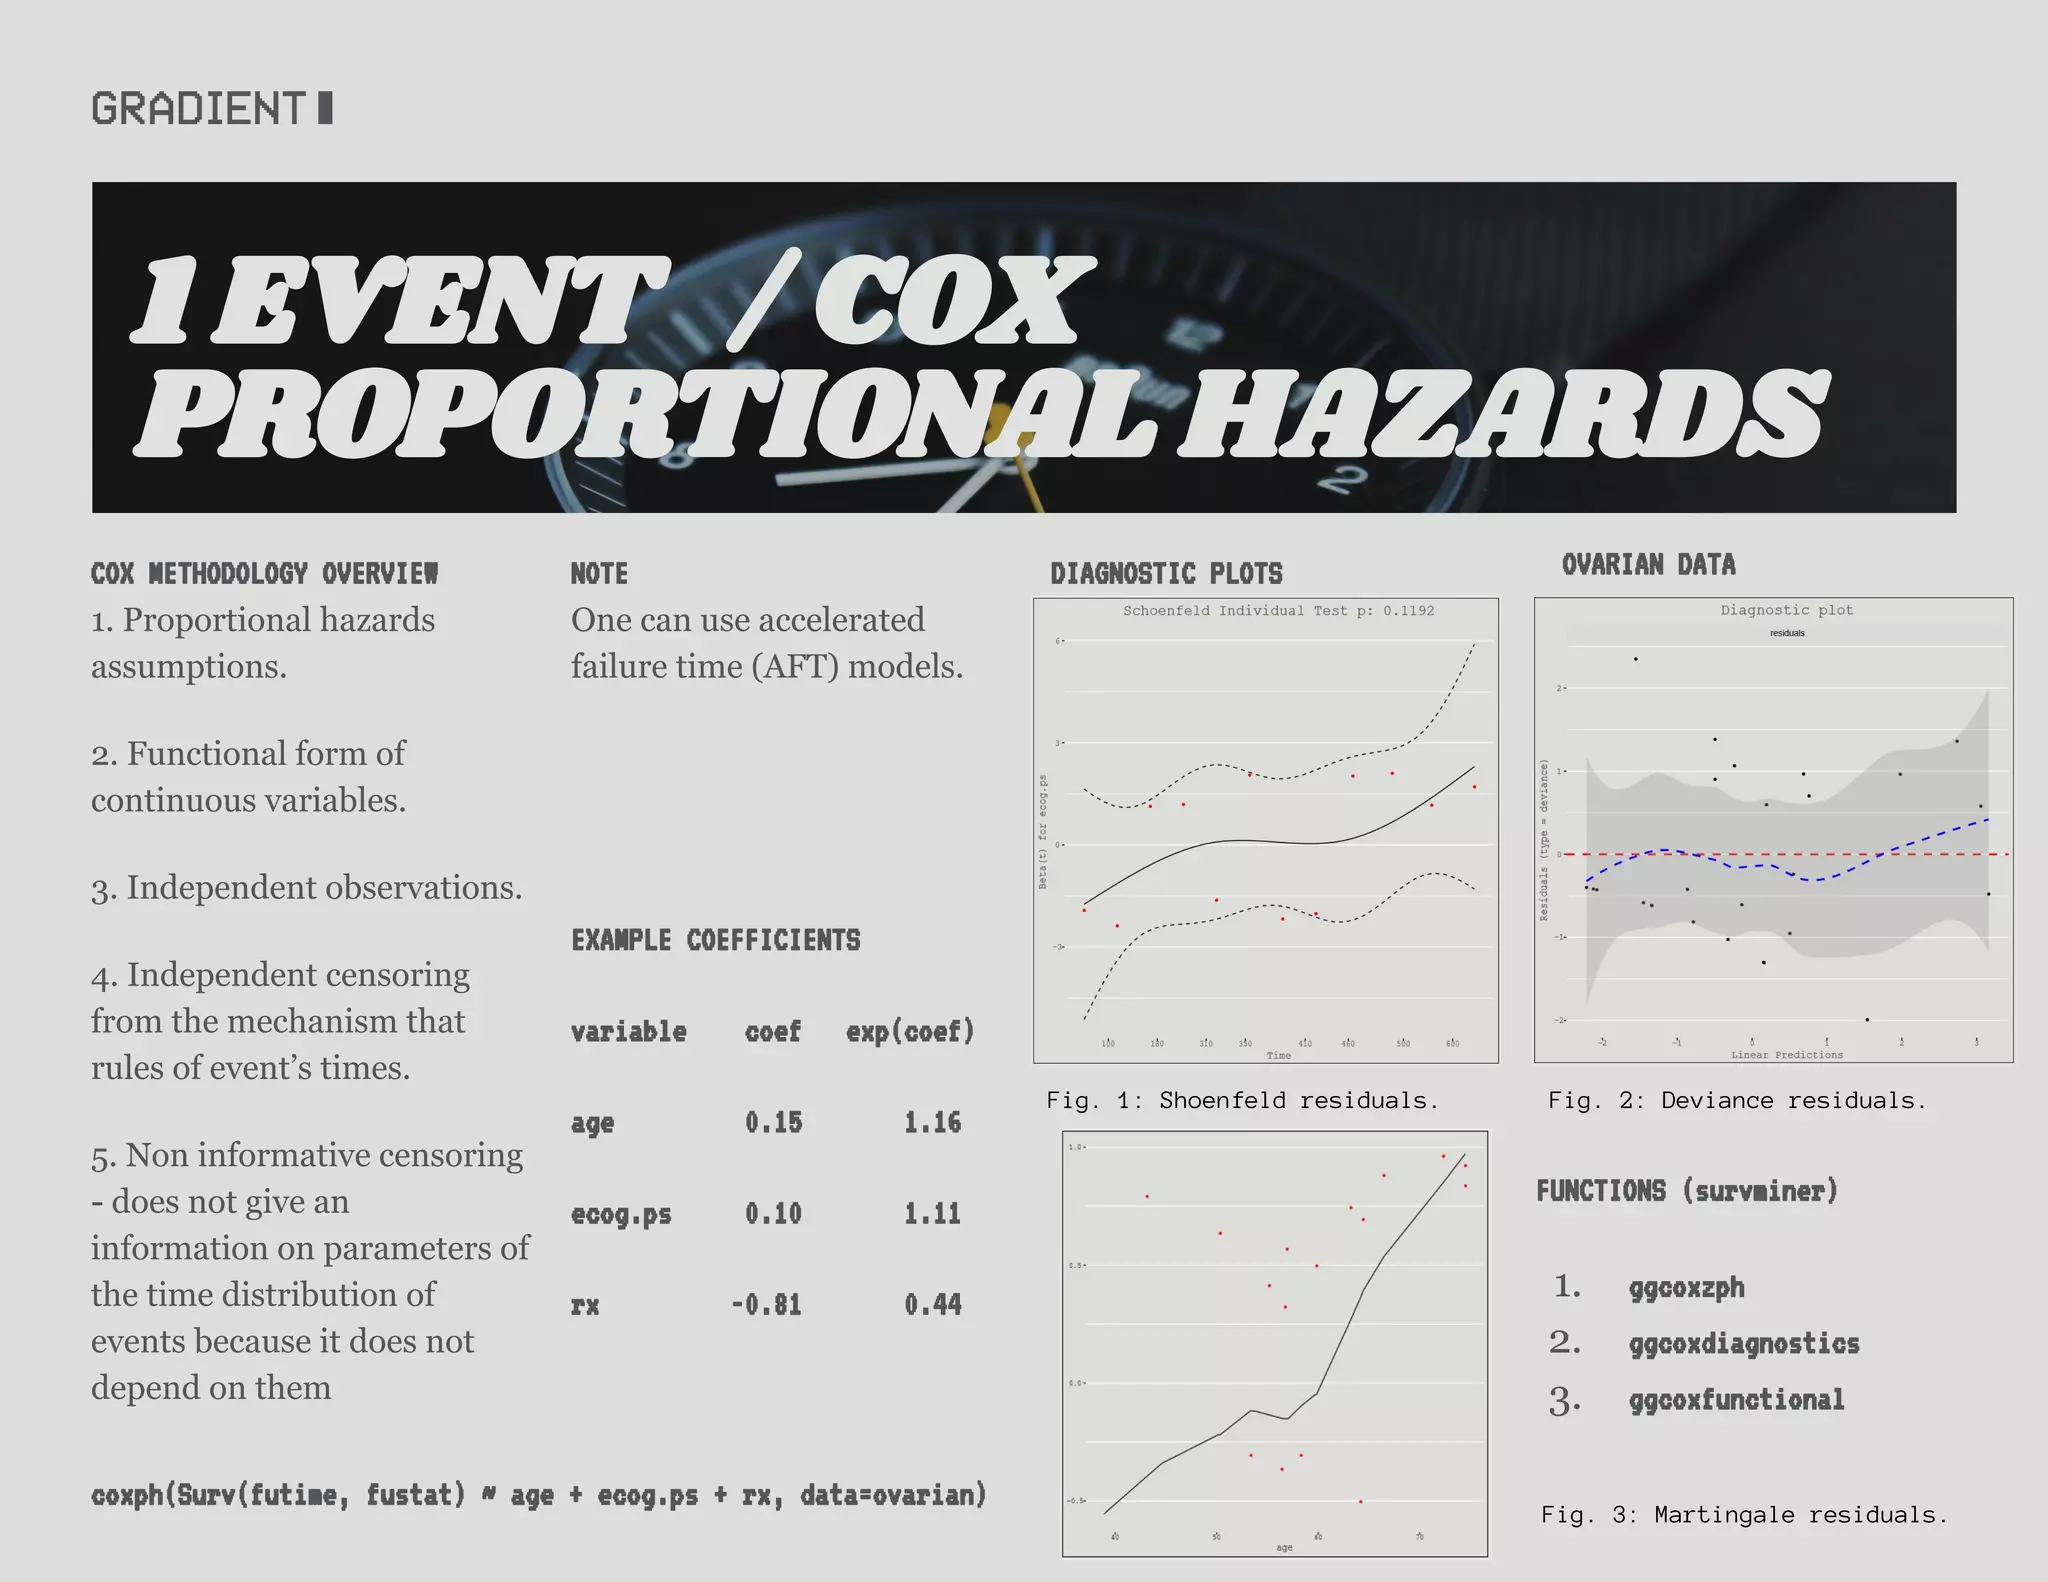
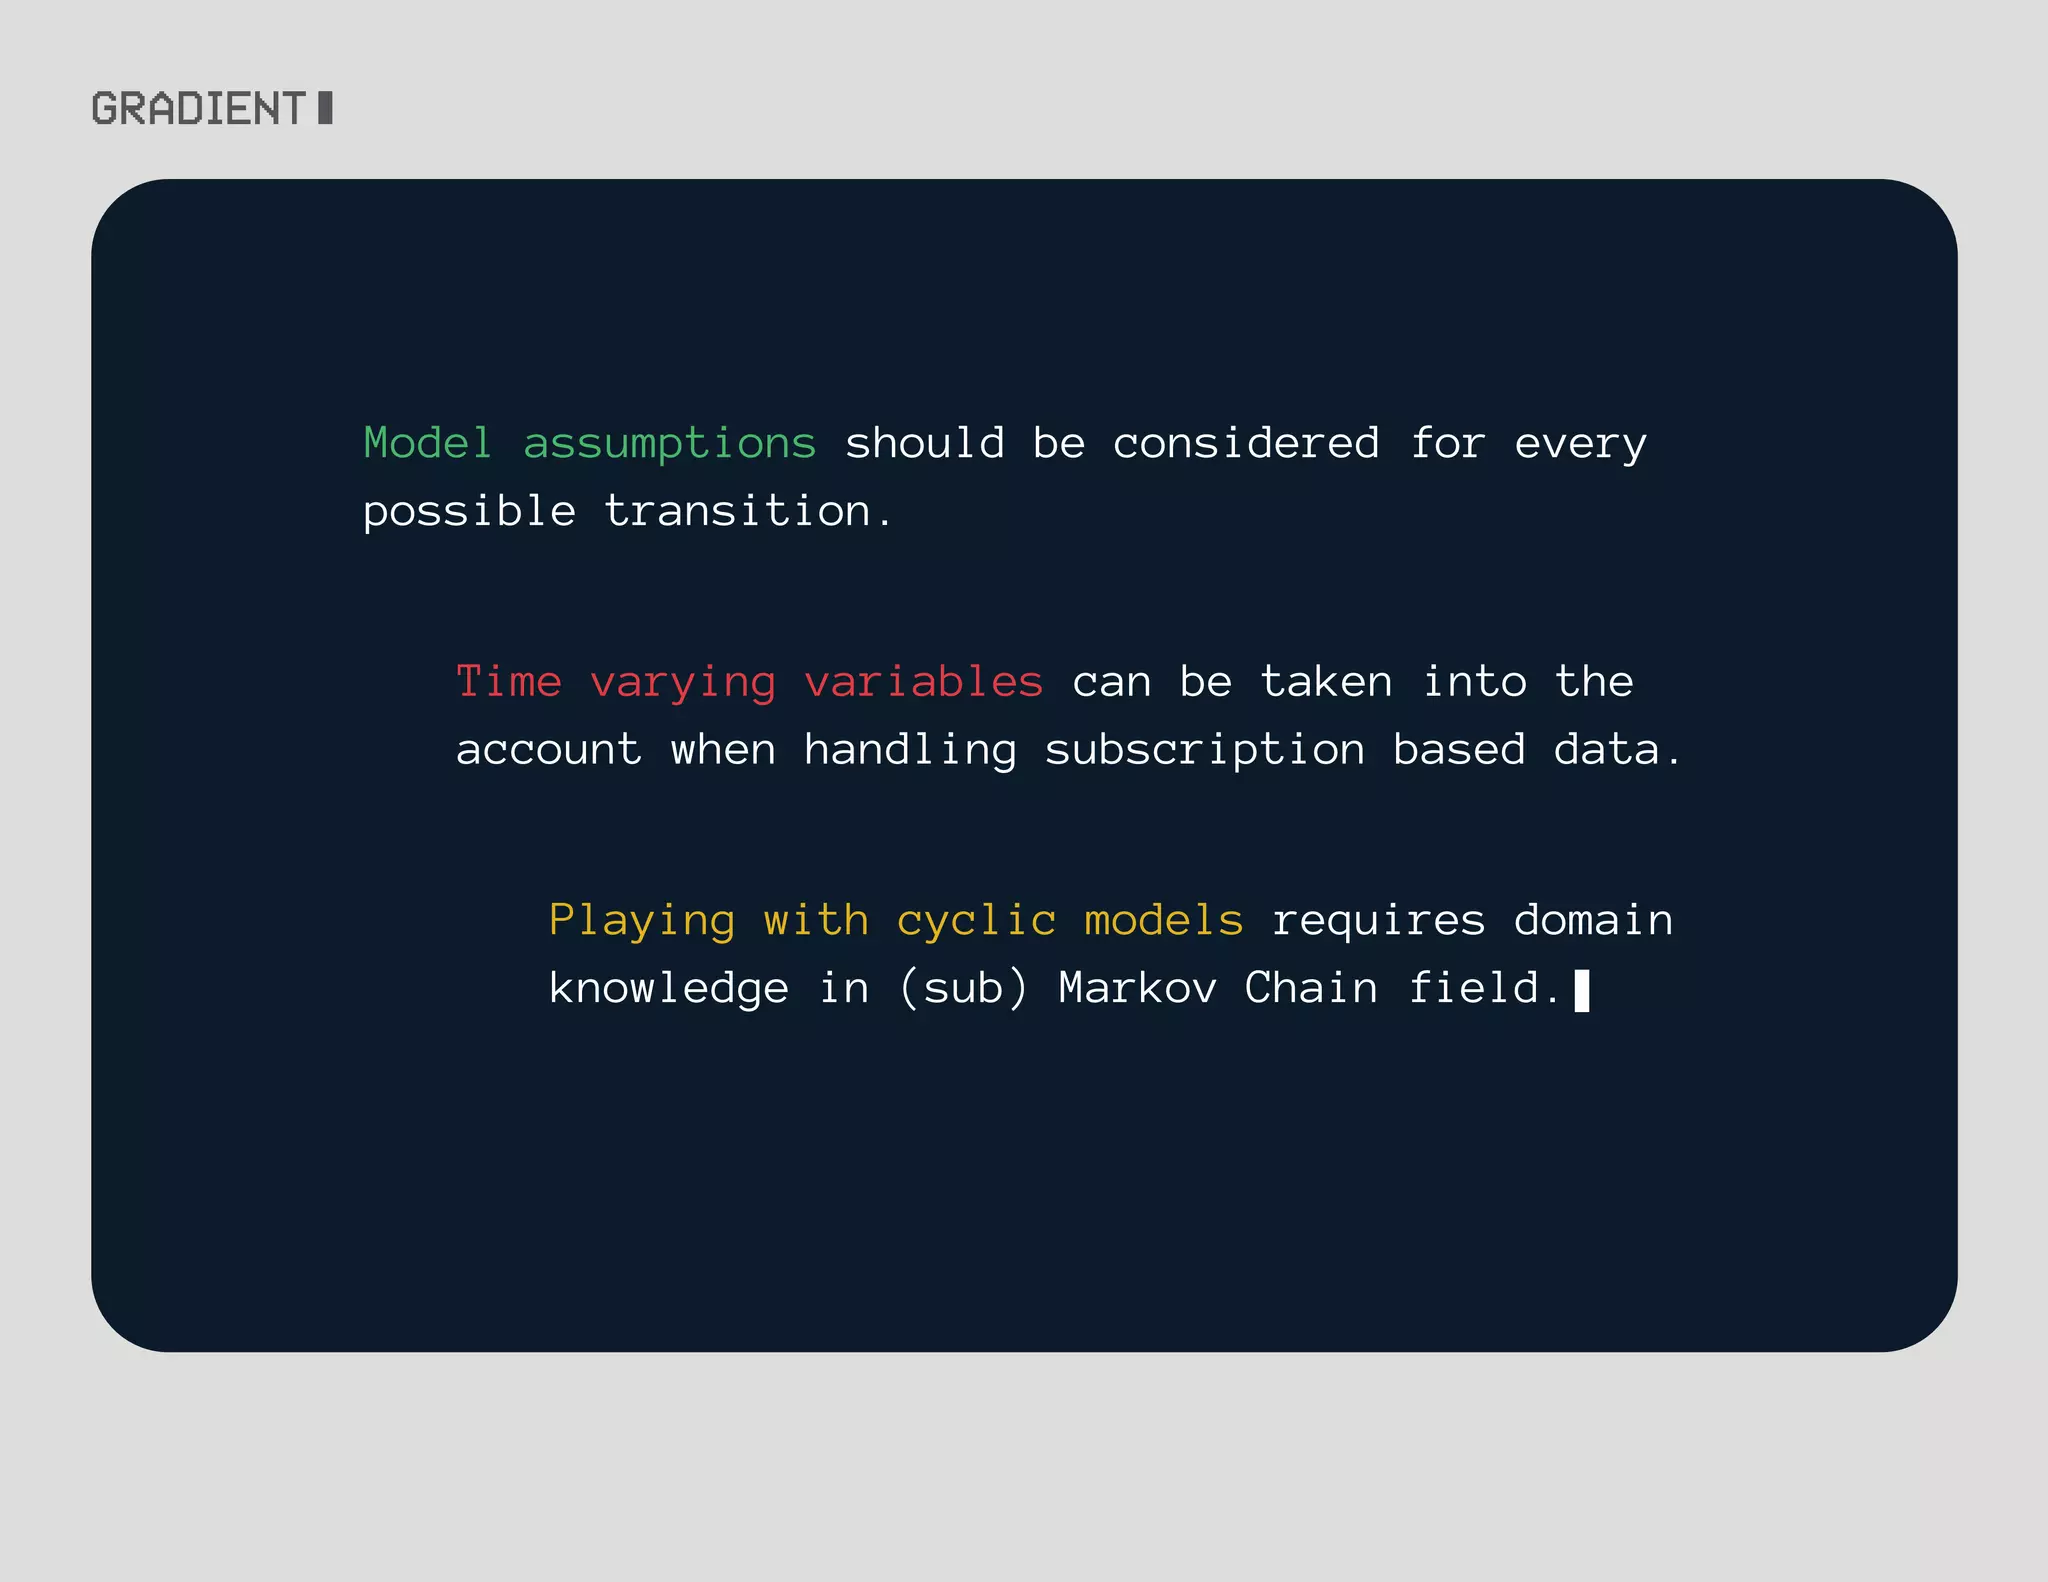
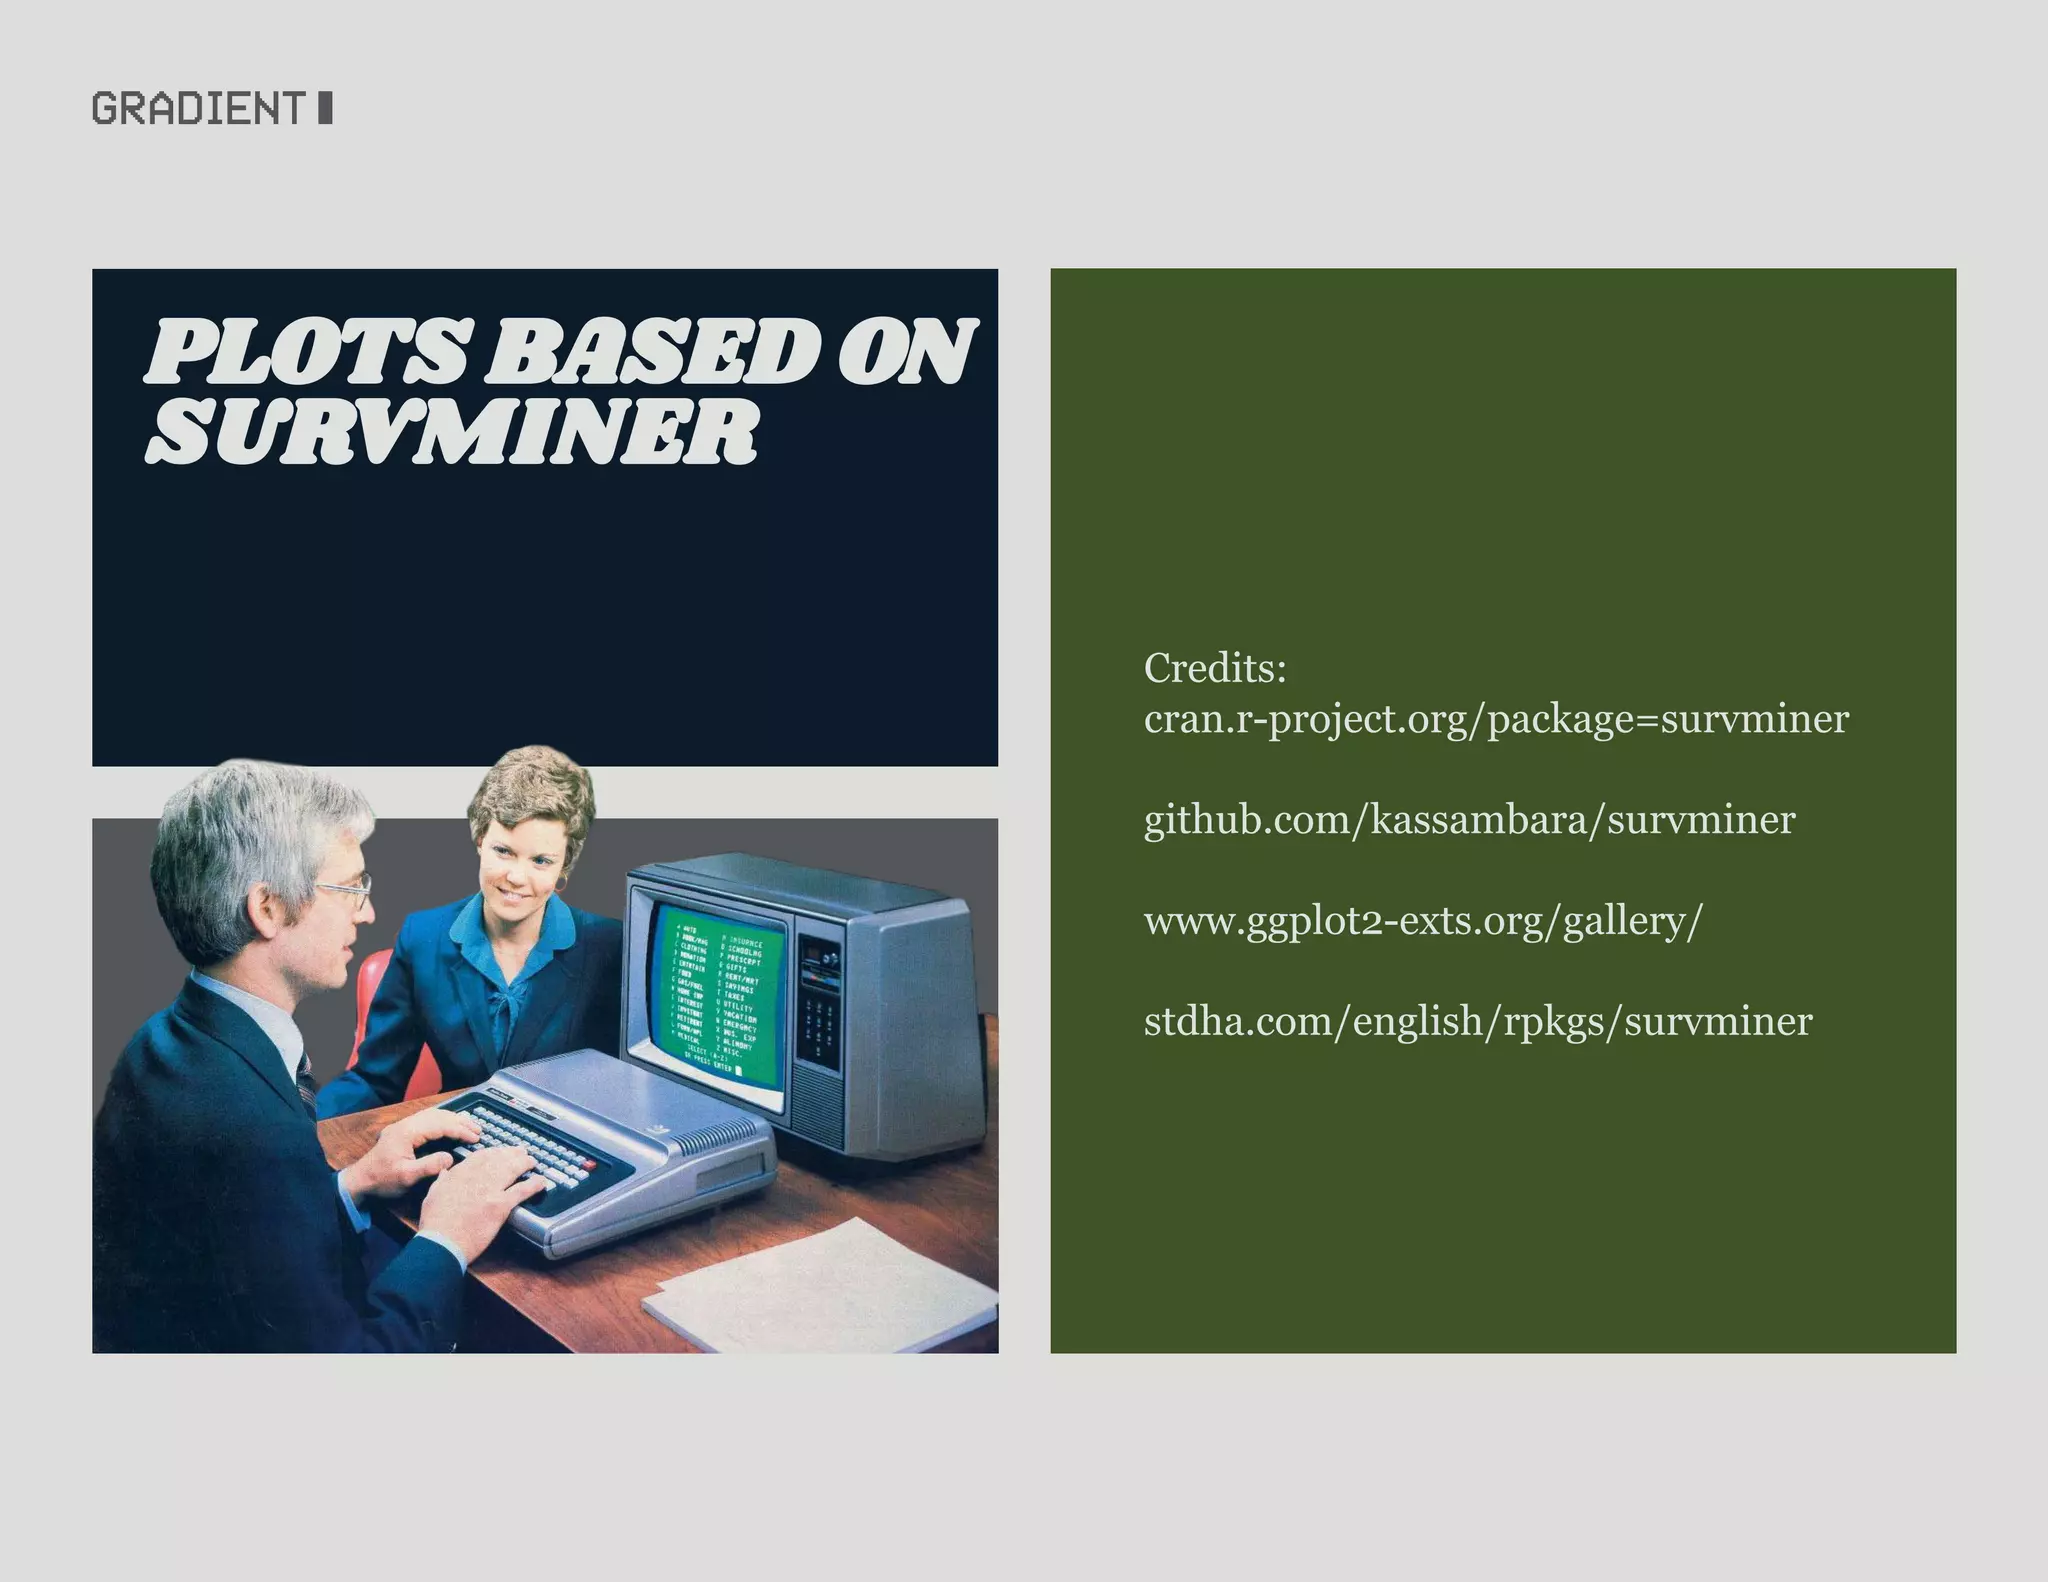


The document is a presentation on survival analysis, including its definition, applications, and various methodologies used to analyze time until events occur, such as customer churn in subscription services. It features examples, data structures, statistical tools, and specific analytical techniques like Cox proportional hazards models. The document emphasizes the importance of proper data coding and understanding underlying assumptions when creating predictive models.


![[DSC Europe 25] Djordje Hirs - Revolutionizing Telco Customer Experience with...](https://cdn.slidesharecdn.com/ss_thumbnails/zif75aur3qscnckv6tnc-djordje-hirs-cc-dsc2025-1-251219145617-679178aa-thumbnail.jpg?width=640&height=640&fit=bounds)
![[DSC Europe 25] Mathias Halkjær Petersen - The AI workforce revolution.pptx](https://cdn.slidesharecdn.com/ss_thumbnails/3xviexv7q5gojhdsyvat-the-ai-workforce-revolution-251218084820-f3c286ed-thumbnail.jpg?width=640&height=640&fit=bounds)
![[DSC Europe 25] Ivan Petrovic - Is it really that expensive to build an AI sy...](https://cdn.slidesharecdn.com/ss_thumbnails/ybqhdwvusbg7jms3doxh-9-251216105605-7aab5a10-thumbnail.jpg?width=640&height=640&fit=bounds)


![[DSC Europe 25] Hans Kleinsman - The Compliance Gearbox: How Tax Tech Mediate...](https://cdn.slidesharecdn.com/ss_thumbnails/dxdytie1toel0hr90bjs-2-251212103250-174fdbe7-thumbnail.jpg?width=640&height=640&fit=bounds)


![[DSC Europe 25] Danica Soc - The Science Behind Marketing: Experimentation me...](https://cdn.slidesharecdn.com/ss_thumbnails/c0nofsggs9gw5ucmallr-3-251216103155-56bd64d1-thumbnail.jpg?width=640&height=640&fit=bounds)


![[DSC Europe 25] Katherine Forrest - AI NOW: Understanding the Velocity of Cha...](https://cdn.slidesharecdn.com/ss_thumbnails/wvvbruqfrci0sfq9xwgb-4-251212104007-e5ad1987-thumbnail.jpg?width=640&height=640&fit=bounds)


