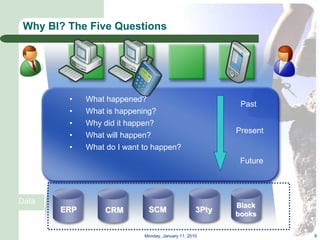
structured data Web logs: unstructured data
ERP: structured data CRM: structured data
SCM: structured data 3rd party: structured data
Data quality: cleansing, matching Master data management
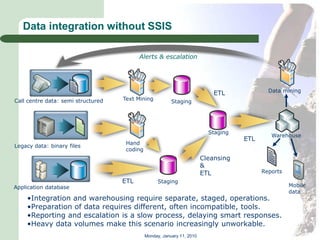
Metadata management Data integration without SSIS
Data integration without SSIS
Data integration without SSIS
Data integration without SSIS
Data integration without SSIS
Data integration without SSIS
Data integration without SSIS
Data integration without SSIS
Data integration without SSIS
Data integration without SSIS
Data integration without SSIS
Data integration without SSIS
Data integration without SSIS
Data integration without SSIS