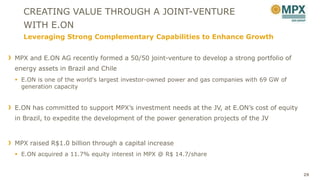
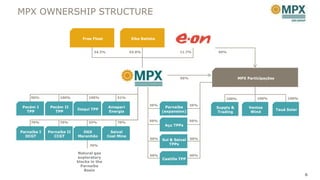
MPX CORPORATE PRESENTATION
DISCLAIMER


The material that follows is a presentation of general background information about MPX Energia S.A. and its subsidiaries (collectively, “MPX”
or the “ Company ” ) as of the date of the presentation. It is information in summary form and does not purport to be complete. No
representation or warranty, express or implied, is made concerning, and no reliance should be placed on, the accuracy, fairness, or
completeness of this information.
This presentation may contain certain forward-looking statements and information relating to MPX that reflect the current views and/or
expectations of the Company and its management with respect to its performance, business and future events. Forward looking statements
include, without limitation, any statement that may predict, forecast, indicate or imply future results, performance or achievements, and
may contain words like “may”, “plan”, “believe”, “anticipate”, “expect”, “envisages”, “will likely result”, or any other words or phrases of similar
meaning. Such statements are subject to a number of risks, uncertainties and assumptions. We caution you that a number of important
factors could cause actual results to differ materially from the plans, objectives, expectations, estimates and intentions expressed in this
presentation. In no event, neither the Company, any of its affiliates, directors, officers, agents or employees nor any of the placement
agents shall be liable before any third party (including investors) for any investment or business decision made or action taken in reliance on
the information and statements contained in this presentation or for any consequential, special or similar damages.
This presentation does not constitute an offer, or invitation, or solicitation of an offer, to subscribe for or purchase any securities.
Neither this presentation nor anything contained herein shall form the basis of any contract or commitment whatsoever.
Recipients of this presentation are not to construe the contents of this summary as legal, tax or investment advice and recipients should
consult their own advisors in this regard.
The market and competitive position data, including market forecasts, used throughout this presentation were obtained from internal
surveys, market research, publicly available information and industry publications. Although we have no reason to believe that any of this
information or these reports are inaccurate in any material respect, we have not independently verified the competitive position, market
share, market size, market growth or other data provided by third parties or by industry or other publications. MPX, the placement agents
and the underwriters do not make any representation as to the accuracy of such information.
This presentation and its contents are proprietary information and may not be reproduced or otherwise disseminated in whole or in part
without MPX’s prior written consent.
                                                                                                                                                       2
1
MPX AT A GLANCE
A PROVEN RECORD OF ACHIEVEMENT


                                                                                                                                           2012
                                                                                                                  2011
                                                                                                                               MPX/E.ON
                                                                                                     TPP Parnaíba licensed    partnership
                                                                                                     capacity increased to
                                                                                                                               Acquisition of
                                                                                                     3,722 MW
                                                                                                                               Greenfield Wind
                                                                                                     Power supply
                                                                                                                               Projects in Northeast
                                                                                     2010            contracts secured for
                                                                                                                               Brazil (600 MW)
                                                                                                     1,193 MW and
                                                                          License granted for
                                                                                                     construction works at     Drill-stem test in
                                                                          TPP Parnaiba
                                                                                                                               well OGX-88 (Bom
                                                            2009          (1,863 MW)
                                                                                                     TPP Parnaíba begin
                                                                                                                               Jesus) concluded
                                                                                                     D&M estimates for
                                  2008           Construction works      Initiation of drilling    risked resources in       with 36 meters of
                                                 at TPPs Itaqui and       campaign in the                                      net pay, supporting
                       365 MW contracted in                                                         the Parnaíba basin
                                                 Pecém II begin           Parnaíba basin                                       future development
          2007         the A-5 Auction                                                               amount to over 11Tcf
                                                 Acquisition of                                     Declaration of           MPX included in the
 IPO: US$ 1.1         Construction works at
                                                 interest in 7 onshore                               commerciality for 2       MSCI
  billion raised       TPP Pecém I begin
                                                 exploratory blocks in                               gas fields with
 1,080 MW                                       the Parnaíba basin                                  estimated production
  contracted in the                                                                                  of 6 MM m3/day
  A-5 Auction

                                                                                                                                                 4
A DIVERSIFIED ENERGY COMPANY
 Largest Portfolio Of Power Generation Projects In South America


                                                                             Power agreements secured for 3 GW
                                    Amapari Energia
                                    23 MW                                     (Discos = 2.6 GW + Free mkt = 0.4 GW)
                 Natural Gas                    Itaqui
           Exploratory blocks                   360 MW
                                                          Pecém I
                        11 Tcf                            720 MW             Environmental license for an additional
                      Parnaíba                            Pecém II            10 GW
                      1,556 MW                            365 MW
                      Parnaíba
                      2,166 MW                      Ventos Wind Complex
                                                    600 MW + 600 MW          Natural Gas E&P integrated to power
                                           Solar Tauá                         generation: >11 Tcf of risked gas
                                           1 MW
                                            Açu
                                                                              resources in the Parnaiba Basin
                                            2,100 MW – Coal
Castilla                                    3,300 MW – Natural Gas
   TBD
                   Sul            Seival mine                                Joint-Venture with leading global player
               727 MW
                                                                              E.ON AG
                                 Seival             MPX
                                 600 MW
                                                    Joint-Venture w/ E.ON
                                                                                                                    5
MPX OWNERSHIP STRUCTURE

                              Free Float               Eike Batista


                                   34.3%               53.9%                  11.7%        50%


                                                                               50%                    MPX Participações


     50%          100%           100%          51%                                             100%            100%            100%

                                                                35%                  35%
 Pecém I      Pecém II                     Amapari                      Parnaíba           Supply &        Ventos
                           Itaqui TPP                                                                                     Tauá Solar
   TPP          TPP                        Energia                    (expansion)          Trading          Wind

     70%          70%            33%           70%              50%                  50%
                                                                       Açu TPPs
Parnaíba I   Parnaíba II     OGX            Seival
  OCGT          CCGT       Maranhão        Coal Mine
                                                                50%   Sul & Seival   50%

                                 70%                                      TPPs

                           Natural gas
                                                                50%                  50%
                           exploratory                                Castilla TPP
                           blocks in the
                             Parnaíba
                              Basin
                                                                                                                                       6
2
INVESTMENT HIGHLIGHTS


Exposure to Brazil’s growing energy demand

Tax-advantaged thermal power plants coming on-line in 2012

Attractive monetization of natural gas resources

Robust pipeline of thermal projects to meet Brazil’s need for a more
reliable electric system

Joint-venture with E.ON to develop strong portfolio of energy assets and
accelerate growth

Experienced management team to execute on strategic vision
                                                                           8
3
EXPOSURE TO BRAZIL’S GROWING
ENERGY DEMAND
BRAZIL WILL NEED ADDITIONAL 10 AVG GW FROM
     2015-2019
     Power Supply/Demand

       Energy Deficit starting in 2015 = Investment Opportunities

                     Energy Load (forecast)

                     Firm Energy


                                              2015-on: new generation required
                                              10 GW avg required from 2015 to 2019


Source: ANEEL                                                                        10
BRAZIL NEEDS NEW THERMAL CAPACITY TO
  INCREASE SUPPLY RELIABILITY

     Water storage capacity has stagnated, leading to decreased system autonomy
          Storage Capacity (Southeast)          Autonomy = [Storage Capacity / (Load – Thermal Generation)]


                                                                                     Actual
                                                                                     Reservoir
                                                                                     Autonomy:
                                                                                     ~ 5 months
                                    Storage
                                    capacity
                                   stagnation
                                                                  2001: Energy
                                                                  Deficit
                                                                  (load reduction)


                Storage Capacity (SIN):

          Southeast = 69%    Northeast = 19%             New thermal plants are necessary to guarantee
          South = 7%         North = 5%                  a reliable power supply.
Source: ONS                                                                                                   11
4
TAX-ADVANTAGED THERMAL POWER PLANTS
COMING ON-LINE STARTING IN 2012
OPERATIONS START IN 2012
   Fully contracted power plants will generate steady revenues
   from 2012 onwards


           Installed Capacity (MW)                                                       Capacity Payments (R$ billion)


                                                  1,920                                                                      1.39
                                                                                                               1.35
                             1,558                                                       1.14


        720


       2012                  2013                 2014                                  2013                   2014          2015
                                                                                                         Capacity Payments


Note 1. Figures adjusted for ownership
Note 2. Capacity Payments are indexed to the IPCA inflation index (Figures shown are in real terms, as of September, 2012)
                                                                                                                                    13
POWER AGREEMENTS SECURED FOR 3 GW
        Minimum guaranteed revenues will reach R$ 1.4 billion in 2014

                                       TOTAL                ADJUSTED
                                                                                 ENERGY SOLD            ANNUAL CAPACITY                        PPA
                                      CAPACITY              CAPACITY                                                          FUEL SOURCE
                                                                                  (AVG MW)                 PAYMENT                           PERIOD
                                        (MW)                  (MW)

 Pecém I                                    720                  360                     308                 R$ 282 million       Coal       2012-2027

 Itaqui                                     360                  360                     315                 R$ 298 million       Coal       2012-2027


 Pecém II                                   365                  365                     276                 R$ 268 million       Coal       2013-2028

 Parnaíba I                                 676                  473                     315                 R$ 293 million    Natural Gas   2013-2028

 Parnaíba II                                517                  362                     315                 R$ 246 million    Natural Gas   2014-2034

 Total – Reg Market                       2,638                1,920                     1,529             R$ 1,387 million


    MPX and MMX signed an energy supply contract for 200 average MW, from January 2019 until May 2029, at a base
    price of R$ 125/ MWh (as of May 2011).

Note 1. Adjusted Capacity, Energy Sold and Annual Capacity Payment: Figures adjusted for MPX’s ownership in each project
Note 2. Capacity Payments are indexed to the IPCA inflation index (Figures as of September, 2012)                                                        14
PECÉM I


           PECÉM I


Location              Ceará, NE Brazil

Installed Capacity            720 MW

Firm Energy              615 avg MW

MPX Stake                        50%

Total Investment        R$ 3.0 billion

PPA Period                2012- 2027

Fuel Source                      Coal


  100% contracted in the Regulated Market (pool of distribution companies)
  Milestones to commercial operation (DCO):
           Unit #1: DCO on Dec 01, 2012

           Unit #2: Reinstatement –> By-pass operation –> Steam-to-turbine –> Electrical tests –> First synchronization –>
           Electrical load tests –> DCO
                                                                                                                       15
PECÉM II


           PECÉM II


Location               Ceará, NE Brazil

Installed Capacity            365 MW

Firm Energy              276 avg MW

MPX Stake                       100%

Total Investment         R$ 1.5 billion

PPA Period                2013- 2028

Fuel Source                        Coal


100% contracted in the Regulated Market (pool of distribution companies)

Milestones to commercial operation (DCO):

           Cold commissioning  First fire  Steam blowing  Reinstatement  By-pass operation  Steam to turbine 
           Electrical tests  First synchronization  Electrical load tests  DCO
                                                                                                                      16
TPP PECÉM I & II


                   17
ITAQUI


              ITAQUI


Location              Maranhão, NE Brazil

Installed Capacity              360 MW

Firm Energy                 315 avg MW

MPX Stake                         100%

Total Investment           R$ 2.2 billion

PPA Period                   2012- 2027

Fuel Source                          Coal


  100% contracted in the Regulated Market (pool of distribution companies)

  Milestones to commercial operation (DCO):

             Electrical load tests –> DCO


                                                                             18
TPP ITAQUI


             19
PARNAÍBA I


             PARNAÍBA I OCGT


Location             Maranhão, NE Brazil

Installed Capacity              676MW

Firm Energy                450 avg MW

MPX Stake                          70%

Total Investment          R$ 1.3 billion

PPA Period                  2013- 2028

Fuel Source                 Natural Gas


 100% contracted in the Regulated Market (pool of distribution companies)

 EPC contract with Duro Felguera
        Commissioning phase on schedule to start in 4Q12

 A 363 MW expansion (cycle closing) is registered for the 2012 A-5 Auction, scheduled for December 2012
                                                                                                          20
PARNAÍBA II

              PARNAÍBA II CCGT


Location             Maranhão, NE Brazil

Installed Capacity             517 MW

Firm Energy                450 avg MW

MPX Stake                          70%

Total Investment          R$ 1.3 billion

PPA Period                 2014- 2034

Fuel Source                  Natural Gas


   100% contracted in the Regulated Market (pool of distribution companies)
   EPC contract with Initec Energia


                                                                              21
TPP PARNAÍBA I & II


                      22
5
NATURAL GAS E&P
MPX OWNS 23% OF A UNIQUE ONSHORE NATURAL
   GAS PORTFOLIO
                     Ownership Structure:
OGX Maranhão
Blocks

Total area:
24,500 km²


                     Gas Production at Gavião Real field to start in Jan 2013
                     Discovery Evaluation Plan for Bom Jesus field approved by ANP
                           Drill-stem test in well OGX-88 concluded with 36 meters of
                           net pay
                           2 additional wells drilled with positive results, supporting
                           development

                     Exploratory campaign has identified 4 accumulations and over 20
                     prospects

                     5 drill-rigs in operation: 3 exploratory wells underway              24
GAS PRODUCTION IS PLANNED TO START IN 1H13
  Initial production of 6 MM m3/day will supply Parnaíba I & II GTs

On schedule to start production at
Gavião Real in Jan, 2013
 Estimated production capacity in 2013:
  7.5 MM m³/day

 16 production wells already drilled

 Commissioning of Gas Treatment Unit
  expected in 4Q12

Competitive costs:
 Average operating cost: US$ 0.30/1,000ft³

R$ 600 million bridge-loan to fund
production development disbursed in
January 2012

                                                                      25
ATTRACTIVE OPPORTUNITIES TO MONETIZE
 ADDITIONAL PRODUCTION
 Efficient Integration of Natural Gas Resources with Power Generation

2.5 GW licensed and still
uncontracted could demand further
12 MM m3/day

Inexpensive connection to the
electrical grid

Limited competition in gas-fueled
power generation

Tax-advantaged region can attract
industrial investments when gas is
available

                                                                        26
PARNAÍBA: E&P – NATURAL GAS


                              27
6
JOINT-VENTURE WITH E.ON TO ACCELERATE
GROWTH
CREATING VALUE THROUGH A JOINT-VENTURE
  WITH E.ON
  Leveraging Strong Complementary Capabilities to Enhance Growth


MPX and E.ON AG recently formed a 50/50 joint-venture to develop a strong portfolio of
energy assets in Brazil and Chile
 E.ON is one of the world's largest investor-owned power and gas companies with 69 GW of
  generation capacity


E.ON has committed to support MPX’s investment needs at the JV, at E.ON’s cost of equity
in Brazil, to expedite the development of the power generation projects of the JV


MPX raised R$1.0 billion through a capital increase
 E.ON acquired a 11.7% equity interest in MPX @ R$ 14.7/share


                                                                                            29
FUTURE GROWTH OPPORTUNITIES
  MPX is positioned for leadership in the Brazilian energy market

Parnaíba GT: Key competitive advantage
through the integration of natural gas                                                   Ventos Wind
production and power generation in a tax-                                                Complex
                                                                                         600 MW + 600 MW
advantaged region


Ventos Wind: High-quality greenfield assets in                    Parnaíba
                                                                  2,166 MW
one of Brazil’s best wind resource areas
                                                                                          Solar Tauá
                                                                                          1 MW
                                                  Castilla
Açu: Studies underway to assess installation of      TBD                              Açu
                                                                                      2,100 MW – Coal
regasification terminal at the port                                                   3,300 MW – Natural Gas
                                                                 Sul
                                                             727 MW
                                                                             Seival
MPX Sul + Seival: low generation cost in a                                   600 MW
region with limited hydro potential and
transmission constraints                                                                                30
VENTOS: A 600 MW WIND COMPLEX IN ONE OF
BRAZIL’S BEST WIND RESOURCE AREAS
High-quality greenfield assets in northeast Brazil


                                             Total Capacity: 600 MW + call option on
                                             additional 600 MW
                   João

                                             Estimated Load Factor: 48% (P50)
                   Câmara


                                             Location: Rio Grande do Norte, NE Brazil
                                        RN


                                             Grid connection 30km from Complex

                                             All land rights secured

                                             158.7 MW registered for 2012 energy auctions

                                             Environmental license granted

                                                                                        31
AÇU: A 5.4 GW GREENFIELD GENERATION COMPLEX
3.3 GW in gas-fired + 2.1 GW in coal-fired capacity located in
Brazil’s load center

 Located in one of the most important
 port-industrial complex in Latin America

 Total capacity of 5,400 MW
   Coal: 2,100 MW
   Natural Gas: 3,300 MW

 Located 150km from natural gas accumulations
 discovered in the Campos Basin

 The industries located within the Superport will
 benefit from auto production sharing, which at
 current prices represents a reduction in energy
 costs by approximately 30%
                                                                 32
SUL + SEIVAL: 1.3 GW INTEGRATED TO A
LIGNITE MINE
Open-pit mine with low mining costs, located adjacent to the power
plants, resulting in competitive fuel costs
 MPX Sul and MPX Seival:
   Capacity: 727 MW + 600 MW
   Fluidized Coal Bed technology
   Lower emissions resulting from the mix
    burning of coal and wood chips

 Seival Mine:
   Partnership between MPX and Copelmi –
    one of Brazil’s largest coal miner
   Operating License granted
   152 MM tons in proven reserves and 459
    MM tons in total resources

 Located in a region with limited hydro
 potential and transmission constraints.
                                                                     33
7
FINANCIAL HIGHLIGHTS
STEADY AND PREDICTABLE CASH FLOWS

           Installed Capacity (MW)                                                         Capacity Payments (R$ billion)


                                                    1,920                                                                     1.39
                                                                                                               1.35
                                                                                          1.14
                            1,558


      720


     2012                   2013                    2014                                 2013                  2014           2015
            Pecém I                           Parnaíba I

            Itaqui                             Parnaíba II

            Pecém II


Note 1. Figures adjusted for ownership.
Note 2. Capacity Payments are indexed to the IPCA inflation index (Figures shown are in real terms, as of September, 2012).
Note 3. EBITDA figures do not include MPX’s interest in the Parnaíba basin gas onshore blocks.                                       35
INDEBTEDNESS

                                                                                         Debt Profile

  R$ billion                 Jun/12      Sep/12

    Gross Debt (R$ MM)         5.1          5.6                                     33%                   37%

    Net Debt (R$ MM)           4.0          4.6                                                                                   Short Term
                                                                                    67%                   63%
    Average Cost (%)           9.4          8.7                                                                                   Long Term

    Average Tenure (years)     5.6          5.1
                                                                                  Jun/12                Sep/12


                               Maturity Profile (R$ million)                                                                               2,902.4


       R$ 1,454 million bridge-loan to                                                     2,095.3

       Parnaíba I & II power plants -> to be
       paid-off with draw down from long-                  1,003.0

       term financing
                                                                            169.8                           278.3           265.2


                                                  Cash & Cash Equivalents2012               2013            2014             2015       From 2016 on


                                                  *Values incorporate principal + capitalized interest + charges and exclude outstanding convertible
                                                  debentures.
                                                                                                                                                       36
For more information, contact:
      Investor Relations
      (55 21) 2555-9215
     ri.mpx@mpx.com.br

MPX Corporate Presentation - December 2012

  • 1.
  • 2.
    DISCLAIMER The material thatfollows is a presentation of general background information about MPX Energia S.A. and its subsidiaries (collectively, “MPX” or the “ Company ” ) as of the date of the presentation. It is information in summary form and does not purport to be complete. No representation or warranty, express or implied, is made concerning, and no reliance should be placed on, the accuracy, fairness, or completeness of this information. This presentation may contain certain forward-looking statements and information relating to MPX that reflect the current views and/or expectations of the Company and its management with respect to its performance, business and future events. Forward looking statements include, without limitation, any statement that may predict, forecast, indicate or imply future results, performance or achievements, and may contain words like “may”, “plan”, “believe”, “anticipate”, “expect”, “envisages”, “will likely result”, or any other words or phrases of similar meaning. Such statements are subject to a number of risks, uncertainties and assumptions. We caution you that a number of important factors could cause actual results to differ materially from the plans, objectives, expectations, estimates and intentions expressed in this presentation. In no event, neither the Company, any of its affiliates, directors, officers, agents or employees nor any of the placement agents shall be liable before any third party (including investors) for any investment or business decision made or action taken in reliance on the information and statements contained in this presentation or for any consequential, special or similar damages. This presentation does not constitute an offer, or invitation, or solicitation of an offer, to subscribe for or purchase any securities. Neither this presentation nor anything contained herein shall form the basis of any contract or commitment whatsoever. Recipients of this presentation are not to construe the contents of this summary as legal, tax or investment advice and recipients should consult their own advisors in this regard. The market and competitive position data, including market forecasts, used throughout this presentation were obtained from internal surveys, market research, publicly available information and industry publications. Although we have no reason to believe that any of this information or these reports are inaccurate in any material respect, we have not independently verified the competitive position, market share, market size, market growth or other data provided by third parties or by industry or other publications. MPX, the placement agents and the underwriters do not make any representation as to the accuracy of such information. This presentation and its contents are proprietary information and may not be reproduced or otherwise disseminated in whole or in part without MPX’s prior written consent. 2
  • 3.
    1 MPX AT AGLANCE
  • 4.
    A PROVEN RECORDOF ACHIEVEMENT 2012 2011  MPX/E.ON  TPP Parnaíba licensed partnership capacity increased to  Acquisition of 3,722 MW Greenfield Wind  Power supply Projects in Northeast 2010 contracts secured for Brazil (600 MW) 1,193 MW and  License granted for construction works at  Drill-stem test in TPP Parnaiba well OGX-88 (Bom 2009 (1,863 MW) TPP Parnaíba begin Jesus) concluded  D&M estimates for 2008  Construction works  Initiation of drilling risked resources in with 36 meters of at TPPs Itaqui and campaign in the net pay, supporting  365 MW contracted in the Parnaíba basin Pecém II begin Parnaíba basin future development 2007 the A-5 Auction amount to over 11Tcf  Acquisition of  Declaration of  MPX included in the  IPO: US$ 1.1  Construction works at interest in 7 onshore commerciality for 2 MSCI billion raised TPP Pecém I begin exploratory blocks in gas fields with  1,080 MW the Parnaíba basin estimated production contracted in the of 6 MM m3/day A-5 Auction 4
  • 5.
    A DIVERSIFIED ENERGYCOMPANY Largest Portfolio Of Power Generation Projects In South America  Power agreements secured for 3 GW Amapari Energia 23 MW (Discos = 2.6 GW + Free mkt = 0.4 GW) Natural Gas Itaqui Exploratory blocks 360 MW Pecém I 11 Tcf 720 MW  Environmental license for an additional Parnaíba Pecém II 10 GW 1,556 MW 365 MW Parnaíba 2,166 MW Ventos Wind Complex 600 MW + 600 MW  Natural Gas E&P integrated to power Solar Tauá generation: >11 Tcf of risked gas 1 MW Açu resources in the Parnaiba Basin 2,100 MW – Coal Castilla 3,300 MW – Natural Gas TBD Sul Seival mine  Joint-Venture with leading global player 727 MW E.ON AG Seival MPX 600 MW Joint-Venture w/ E.ON 5
  • 6.
    MPX OWNERSHIP STRUCTURE Free Float Eike Batista 34.3% 53.9% 11.7% 50% 50% MPX Participações 50% 100% 100% 51% 100% 100% 100% 35% 35% Pecém I Pecém II Amapari Parnaíba Supply & Ventos Itaqui TPP Tauá Solar TPP TPP Energia (expansion) Trading Wind 70% 70% 33% 70% 50% 50% Açu TPPs Parnaíba I Parnaíba II OGX Seival OCGT CCGT Maranhão Coal Mine 50% Sul & Seival 50% 70% TPPs Natural gas 50% 50% exploratory Castilla TPP blocks in the Parnaíba Basin 6
  • 7.
  • 8.
    INVESTMENT HIGHLIGHTS Exposure toBrazil’s growing energy demand Tax-advantaged thermal power plants coming on-line in 2012 Attractive monetization of natural gas resources Robust pipeline of thermal projects to meet Brazil’s need for a more reliable electric system Joint-venture with E.ON to develop strong portfolio of energy assets and accelerate growth Experienced management team to execute on strategic vision 8
  • 9.
    3 EXPOSURE TO BRAZIL’SGROWING ENERGY DEMAND
  • 10.
    BRAZIL WILL NEEDADDITIONAL 10 AVG GW FROM 2015-2019 Power Supply/Demand Energy Deficit starting in 2015 = Investment Opportunities Energy Load (forecast) Firm Energy 2015-on: new generation required 10 GW avg required from 2015 to 2019 Source: ANEEL 10
  • 11.
    BRAZIL NEEDS NEWTHERMAL CAPACITY TO INCREASE SUPPLY RELIABILITY Water storage capacity has stagnated, leading to decreased system autonomy Storage Capacity (Southeast) Autonomy = [Storage Capacity / (Load – Thermal Generation)] Actual Reservoir Autonomy: ~ 5 months Storage capacity stagnation 2001: Energy Deficit (load reduction) Storage Capacity (SIN): Southeast = 69% Northeast = 19% New thermal plants are necessary to guarantee South = 7% North = 5% a reliable power supply. Source: ONS 11
  • 12.
    4 TAX-ADVANTAGED THERMAL POWERPLANTS COMING ON-LINE STARTING IN 2012
  • 13.
    OPERATIONS START IN2012 Fully contracted power plants will generate steady revenues from 2012 onwards Installed Capacity (MW) Capacity Payments (R$ billion) 1,920 1.39 1.35 1,558 1.14 720 2012 2013 2014 2013 2014 2015 Capacity Payments Note 1. Figures adjusted for ownership Note 2. Capacity Payments are indexed to the IPCA inflation index (Figures shown are in real terms, as of September, 2012) 13
  • 14.
    POWER AGREEMENTS SECUREDFOR 3 GW Minimum guaranteed revenues will reach R$ 1.4 billion in 2014 TOTAL ADJUSTED ENERGY SOLD ANNUAL CAPACITY PPA CAPACITY CAPACITY FUEL SOURCE (AVG MW) PAYMENT PERIOD (MW) (MW) Pecém I 720 360 308 R$ 282 million Coal 2012-2027 Itaqui 360 360 315 R$ 298 million Coal 2012-2027 Pecém II 365 365 276 R$ 268 million Coal 2013-2028 Parnaíba I 676 473 315 R$ 293 million Natural Gas 2013-2028 Parnaíba II 517 362 315 R$ 246 million Natural Gas 2014-2034 Total – Reg Market 2,638 1,920 1,529 R$ 1,387 million MPX and MMX signed an energy supply contract for 200 average MW, from January 2019 until May 2029, at a base price of R$ 125/ MWh (as of May 2011). Note 1. Adjusted Capacity, Energy Sold and Annual Capacity Payment: Figures adjusted for MPX’s ownership in each project Note 2. Capacity Payments are indexed to the IPCA inflation index (Figures as of September, 2012) 14
  • 15.
    PECÉM I PECÉM I Location Ceará, NE Brazil Installed Capacity 720 MW Firm Energy 615 avg MW MPX Stake 50% Total Investment R$ 3.0 billion PPA Period 2012- 2027 Fuel Source Coal 100% contracted in the Regulated Market (pool of distribution companies) Milestones to commercial operation (DCO): Unit #1: DCO on Dec 01, 2012 Unit #2: Reinstatement –> By-pass operation –> Steam-to-turbine –> Electrical tests –> First synchronization –> Electrical load tests –> DCO 15
  • 16.
    PECÉM II PECÉM II Location Ceará, NE Brazil Installed Capacity 365 MW Firm Energy 276 avg MW MPX Stake 100% Total Investment R$ 1.5 billion PPA Period 2013- 2028 Fuel Source Coal 100% contracted in the Regulated Market (pool of distribution companies) Milestones to commercial operation (DCO): Cold commissioning  First fire  Steam blowing  Reinstatement  By-pass operation  Steam to turbine  Electrical tests  First synchronization  Electrical load tests  DCO 16
  • 17.
    TPP PECÉM I& II 17
  • 18.
    ITAQUI ITAQUI Location Maranhão, NE Brazil Installed Capacity 360 MW Firm Energy 315 avg MW MPX Stake 100% Total Investment R$ 2.2 billion PPA Period 2012- 2027 Fuel Source Coal 100% contracted in the Regulated Market (pool of distribution companies) Milestones to commercial operation (DCO): Electrical load tests –> DCO 18
  • 19.
  • 20.
    PARNAÍBA I PARNAÍBA I OCGT Location Maranhão, NE Brazil Installed Capacity 676MW Firm Energy 450 avg MW MPX Stake 70% Total Investment R$ 1.3 billion PPA Period 2013- 2028 Fuel Source Natural Gas 100% contracted in the Regulated Market (pool of distribution companies) EPC contract with Duro Felguera Commissioning phase on schedule to start in 4Q12 A 363 MW expansion (cycle closing) is registered for the 2012 A-5 Auction, scheduled for December 2012 20
  • 21.
    PARNAÍBA II PARNAÍBA II CCGT Location Maranhão, NE Brazil Installed Capacity 517 MW Firm Energy 450 avg MW MPX Stake 70% Total Investment R$ 1.3 billion PPA Period 2014- 2034 Fuel Source Natural Gas 100% contracted in the Regulated Market (pool of distribution companies) EPC contract with Initec Energia 21
  • 22.
  • 23.
  • 24.
    MPX OWNS 23%OF A UNIQUE ONSHORE NATURAL GAS PORTFOLIO Ownership Structure: OGX Maranhão Blocks Total area: 24,500 km² Gas Production at Gavião Real field to start in Jan 2013 Discovery Evaluation Plan for Bom Jesus field approved by ANP Drill-stem test in well OGX-88 concluded with 36 meters of net pay 2 additional wells drilled with positive results, supporting development Exploratory campaign has identified 4 accumulations and over 20 prospects 5 drill-rigs in operation: 3 exploratory wells underway 24
  • 25.
    GAS PRODUCTION ISPLANNED TO START IN 1H13 Initial production of 6 MM m3/day will supply Parnaíba I & II GTs On schedule to start production at Gavião Real in Jan, 2013  Estimated production capacity in 2013: 7.5 MM m³/day  16 production wells already drilled  Commissioning of Gas Treatment Unit expected in 4Q12 Competitive costs:  Average operating cost: US$ 0.30/1,000ft³ R$ 600 million bridge-loan to fund production development disbursed in January 2012 25
  • 26.
    ATTRACTIVE OPPORTUNITIES TOMONETIZE ADDITIONAL PRODUCTION Efficient Integration of Natural Gas Resources with Power Generation 2.5 GW licensed and still uncontracted could demand further 12 MM m3/day Inexpensive connection to the electrical grid Limited competition in gas-fueled power generation Tax-advantaged region can attract industrial investments when gas is available 26
  • 27.
    PARNAÍBA: E&P –NATURAL GAS 27
  • 28.
    6 JOINT-VENTURE WITH E.ONTO ACCELERATE GROWTH
  • 29.
    CREATING VALUE THROUGHA JOINT-VENTURE WITH E.ON Leveraging Strong Complementary Capabilities to Enhance Growth MPX and E.ON AG recently formed a 50/50 joint-venture to develop a strong portfolio of energy assets in Brazil and Chile  E.ON is one of the world's largest investor-owned power and gas companies with 69 GW of generation capacity E.ON has committed to support MPX’s investment needs at the JV, at E.ON’s cost of equity in Brazil, to expedite the development of the power generation projects of the JV MPX raised R$1.0 billion through a capital increase  E.ON acquired a 11.7% equity interest in MPX @ R$ 14.7/share 29
  • 30.
    FUTURE GROWTH OPPORTUNITIES MPX is positioned for leadership in the Brazilian energy market Parnaíba GT: Key competitive advantage through the integration of natural gas Ventos Wind production and power generation in a tax- Complex 600 MW + 600 MW advantaged region Ventos Wind: High-quality greenfield assets in Parnaíba 2,166 MW one of Brazil’s best wind resource areas Solar Tauá 1 MW Castilla Açu: Studies underway to assess installation of TBD Açu 2,100 MW – Coal regasification terminal at the port 3,300 MW – Natural Gas Sul 727 MW Seival MPX Sul + Seival: low generation cost in a 600 MW region with limited hydro potential and transmission constraints 30
  • 31.
    VENTOS: A 600MW WIND COMPLEX IN ONE OF BRAZIL’S BEST WIND RESOURCE AREAS High-quality greenfield assets in northeast Brazil Total Capacity: 600 MW + call option on additional 600 MW João Estimated Load Factor: 48% (P50) Câmara Location: Rio Grande do Norte, NE Brazil RN Grid connection 30km from Complex All land rights secured 158.7 MW registered for 2012 energy auctions Environmental license granted 31
  • 32.
    AÇU: A 5.4GW GREENFIELD GENERATION COMPLEX 3.3 GW in gas-fired + 2.1 GW in coal-fired capacity located in Brazil’s load center Located in one of the most important port-industrial complex in Latin America Total capacity of 5,400 MW  Coal: 2,100 MW  Natural Gas: 3,300 MW Located 150km from natural gas accumulations discovered in the Campos Basin The industries located within the Superport will benefit from auto production sharing, which at current prices represents a reduction in energy costs by approximately 30% 32
  • 33.
    SUL + SEIVAL:1.3 GW INTEGRATED TO A LIGNITE MINE Open-pit mine with low mining costs, located adjacent to the power plants, resulting in competitive fuel costs MPX Sul and MPX Seival:  Capacity: 727 MW + 600 MW  Fluidized Coal Bed technology  Lower emissions resulting from the mix burning of coal and wood chips Seival Mine:  Partnership between MPX and Copelmi – one of Brazil’s largest coal miner  Operating License granted  152 MM tons in proven reserves and 459 MM tons in total resources Located in a region with limited hydro potential and transmission constraints. 33
  • 34.
  • 35.
    STEADY AND PREDICTABLECASH FLOWS Installed Capacity (MW) Capacity Payments (R$ billion) 1,920 1.39 1.35 1.14 1,558 720 2012 2013 2014 2013 2014 2015 Pecém I Parnaíba I Itaqui Parnaíba II Pecém II Note 1. Figures adjusted for ownership. Note 2. Capacity Payments are indexed to the IPCA inflation index (Figures shown are in real terms, as of September, 2012). Note 3. EBITDA figures do not include MPX’s interest in the Parnaíba basin gas onshore blocks. 35
  • 36.
    INDEBTEDNESS Debt Profile R$ billion Jun/12 Sep/12 Gross Debt (R$ MM) 5.1 5.6 33% 37% Net Debt (R$ MM) 4.0 4.6 Short Term 67% 63% Average Cost (%) 9.4 8.7 Long Term Average Tenure (years) 5.6 5.1 Jun/12 Sep/12 Maturity Profile (R$ million) 2,902.4 R$ 1,454 million bridge-loan to 2,095.3 Parnaíba I & II power plants -> to be paid-off with draw down from long- 1,003.0 term financing 169.8 278.3 265.2 Cash & Cash Equivalents2012 2013 2014 2015 From 2016 on *Values incorporate principal + capitalized interest + charges and exclude outstanding convertible debentures. 36
  • 37.
    For more information,contact: Investor Relations (55 21) 2555-9215 ri.mpx@mpx.com.br

Editor's Notes

  • #11 Isso já considera plantas em default canceladas? Sim Onde posso achar esses dados?Garantia Física (projetos existentes): http://www.aneel.gov.br/aplicacoes/capacidadebrasil/energiaassegurada.aspGarantia Física (EXPANSÃO): Portarias de Garantia Física publicadas a cada ano antes dos respectivos leilões.Previsão de carga de Energia: deck Newave (necessário ser agente da CCEE), o mercado não tem acesso a essa previsão de carga