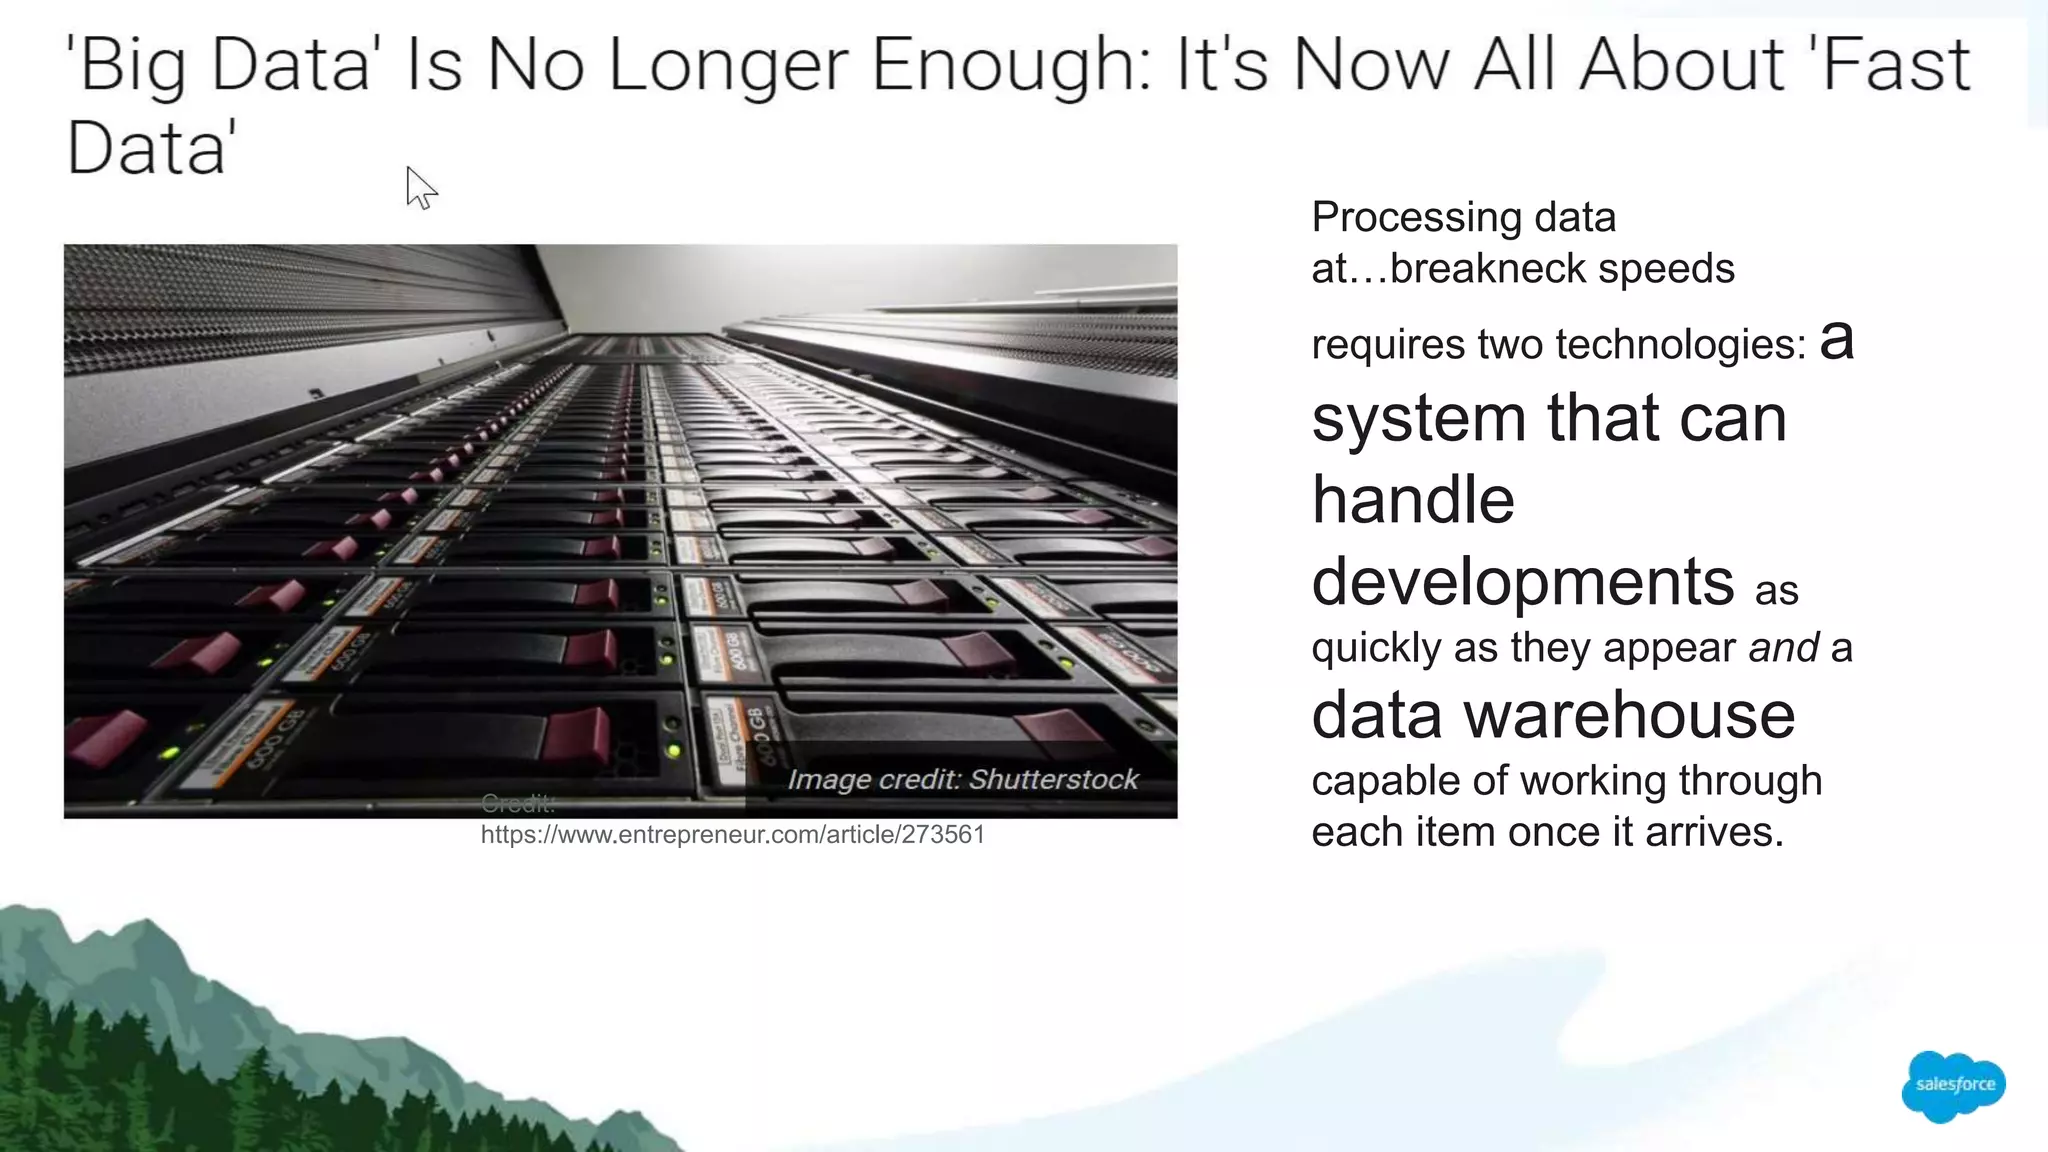
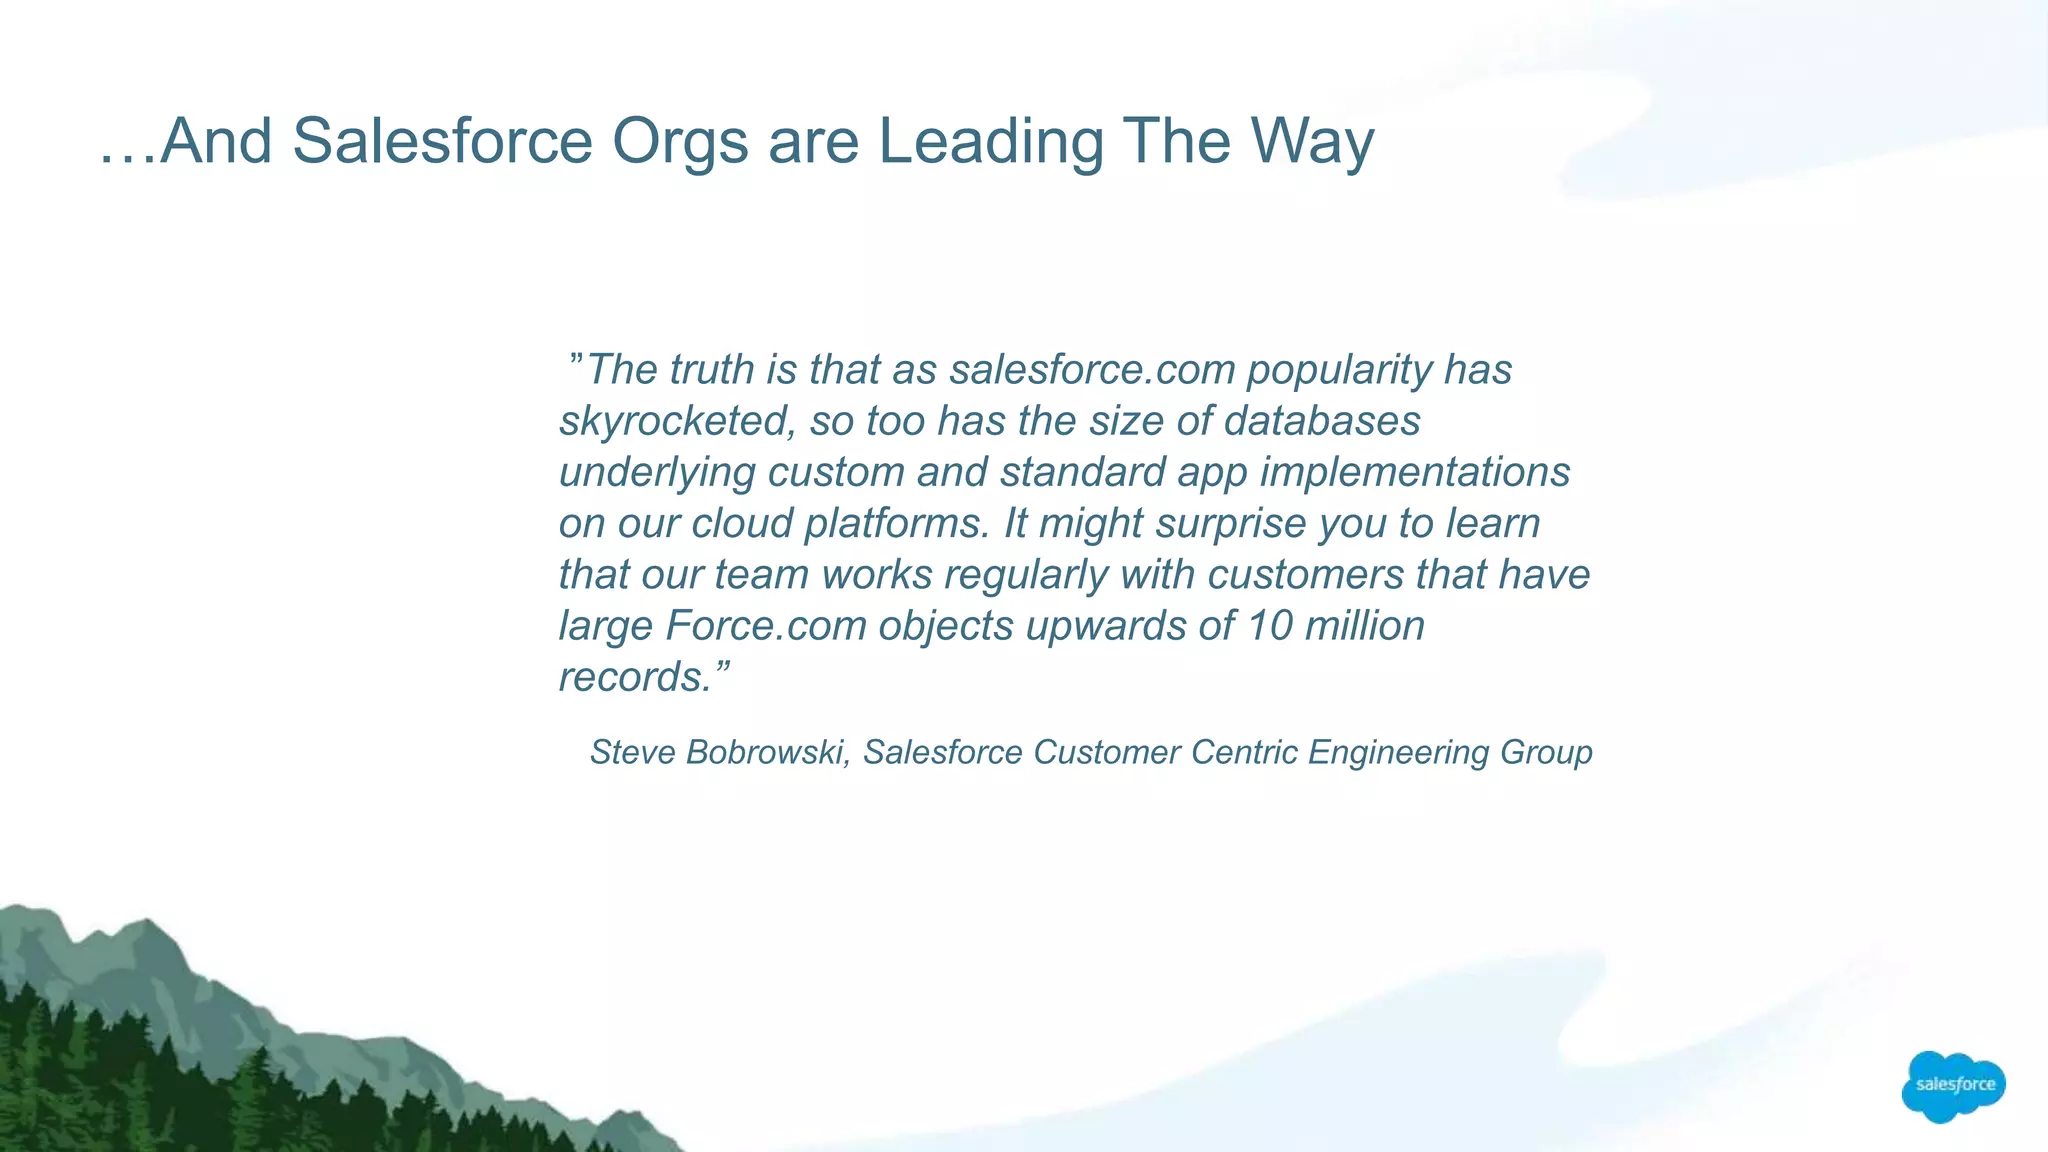
As enterprises continue to push more or their data to the cloud, Salesforce has seen data volumes in its tenant orgs grow at an exponential rate. How do you manage such volumes efficiently? How do you build queries and reports that respond in a timely manner?
The document provides an overview of topics to be covered in a 60 minute session on big data. It will discuss big data architecture, Hadoop, data science career opportunities, and include a Q&A. The presenter is introduced as a big data entrepreneur with 14 years of experience architecting distributed data systems. Key aspects of big data are defined, including where data is generated from various sources. Different data types and challenges of structured vs unstructured data are outlined. The architecture of big data systems is depicted, including components like Hadoop, data warehouses, data marts and more. Examples of big data in various industries are given to showcase the growth of data.
This document provides an overview of signals and signal extraction methodology. It begins with defining a signal as a pattern that is indicative of an impending business outcome. Examples of signals in different industries are provided. The document then outlines a 9-step methodology for extracting signals from data, including defining the business problem, building a data model, conducting univariate and correlation analysis, building predictive models, creating a business narrative, and identifying actions and ROI. R commands for loading, manipulating, and analyzing data in R are also demonstrated. The key points are that signals can provide early warnings for business outcomes and the outlined methodology is a rigorous approach for extracting meaningful signals from data.
This document summarizes an analysis of unstructured data and text analytics. It discusses how text analytics can extract meaning from unstructured sources like emails, surveys, forums to enhance applications like search, information extraction, and predictive analytics. Examples show how tools can extract entities, relationships, sentiments to gain insights from sources in domains like healthcare, law enforcement, and customer experience.
Machine Learning with Big Data using Apache SparkInSemble
"Machine Learning with Big Data
using Apache Spark" was presented to Lansing Big Data and Hadoop User Group by Muk Agaram and Amit Singh on 3/31/2015. It goes over the basics of machine learning and demos a use case of predicting recession using Apache Spark through Logistic Regression, SVM and Random Forest Algorithm
This video will give you an idea about Data science for beginners.
Also explain Data Science Process , Data Science Job Roles , Stages in Data Science Project
1) Data analytics involves treating available digital data as a "gold mine" to obtain tangible outputs that can improve business efficiency when applied. Machine learning uses algorithms to correlate parameters in data and improve relationships.
2) The document provides an overview of getting started in data science, covering business objectives, statistical analysis, programming tools like R and Python, and problem-solving approaches like supervised and unsupervised learning.
3) It describes the iterative "rule of seven" process for data science projects, including collecting/preparing data, exploring/analyzing it, transforming features, applying models, evaluating performance, and visualizing results.
Online retail a look at data consulting approachShesha R
This document discusses big data problems in retail analytics including product recommendation, demand analysis and forecasting, and customer churn. For each problem, it identifies the relevant data sources and types, whether it is a big data problem considering volume, velocity and variety, appropriate machine learning approaches, and major Hadoop components needed in the solution. Capacity planning shows that over 5932 terabytes of data will be generated over 7 years requiring thousands of data nodes and petabytes of storage.
The data science lifecycle consists of 5 stages: 1) Concept study to understand the problem, data, and requirements. 2) Data preparation where raw data is cleaned and prepared for analysis. 3) Modelling where suitable techniques and models are chosen, data is split for training and testing, and models are validated. 4) Model deployment where the trained model is deployed using an API. 5) Communicating results to the client by explaining the lifecycle and determining the project's success level.
Guiding through a typical Machine Learning PipelineMichael Gerke
Many People are talking about AI and Machine Learning. Here's a quick guideline how to manage ML Projects and what to consider in order to implement machine learning use cases.
Data Science Training | Data Science For Beginners | Data Science With Python...Simplilearn
This Data Science presentation will help you understand what is Data Science, who is a Data Scientist, what does a Data Scientist do and also how Python is used for Data Science. Data science is an interdisciplinary field of scientific methods, processes, algorithms and systems to extract knowledge or insights from data in various forms, either structured or unstructured, similar to data mining. This Data Science tutorial will help you establish your skills at analytical techniques using Python. With this Data Science video, you’ll learn the essential concepts of Data Science with Python programming and also understand how data acquisition, data preparation, data mining, model building & testing, data visualization is done. This Data Science tutorial is ideal for beginners who aspire to become a Data Scientist.
This Data Science presentation will cover the following topics:
1. What is Data Science?
2. Who is a Data Scientist?
3. What does a Data Scientist do?
This Data Science with Python course will establish your mastery of data science and analytics techniques using Python. With this Python for Data Science Course, you’ll learn the essential concepts of Python programming and become an expert in data analytics, machine learning, data visualization, web scraping and natural language processing. Python is a required skill for many data science positions, so jumpstart your career with this interactive, hands-on course.
Why learn Data Science?
Data Scientists are being deployed in all kinds of industries, creating a huge demand for skilled professionals. A data scientist is the pinnacle rank in an analytics organization. Glassdoor has ranked data scientist first in the 25 Best Jobs for 2016, and good data scientists are scarce and in great demand. As a data you will be required to understand the business problem, design the analysis, collect and format the required data, apply algorithms or techniques using the correct tools, and finally make recommendations backed by data.
You can gain in-depth knowledge of Data Science by taking our Data Science with python certification training course. With Simplilearn’s Data Science certification training course, you will prepare for a career as a Data Scientist as you master all the concepts and techniques. Those who complete the course will be able to:
1. Gain an in-depth understanding of data science processes, data wrangling, data exploration, data visualization, hypothesis building, and testing. You will also learn the basics of statistics.
Install the required Python environment and other auxiliary tools and libraries
2. Understand the essential concepts of Python programming such as data types, tuples, lists, dicts, basic operators and functions
3. Perform high-level mathematical computing using the NumPy package and its largelibrary of mathematical functions.
Learn more at: https://www.simplilearn.com
Data Scientist Salary, Skills, Jobs And Resume | Data Scientist Career | Data...Simplilearn
This presentation about "Data Science Engineer Career, Salary, and Resume" will help you understand who is a Data Science Engineer, the salary of a Data Science Engineer, Data Science Engineer Skillset and Data Science Engineer Resume. Data science is a systematic way to analyze a massive amount of data and extract information from them. Data Science can answer a lot of questions, as well. Data Science is mainly required for
better decision making, predictive analysis, and pattern recognition.
Below are topics that we will be discussing in this presentation:
1. Introduction to Data Science
2. Who is a Data Science Engineer
3. Data Science Engineer Skillset
4. Data Science Engineer job roles
5. Data Science Engineer salary trends
6. Data Science Engineer Resume
Why learn Data Science?
Data Scientists are being deployed in all kinds of industries, creating a huge demand for skilled professionals. The data scientist is the pinnacle rank in an analytics organization. Glassdoor has ranked data scientist first in the 25 Best Jobs for 2016, and good data scientists are scarce and in great demand. As a data, you will be required to understand the business problem, design the analysis, collect and format the required data, apply algorithms or techniques using the correct tools, and finally make recommendations backed by data.
You can gain in-depth knowledge of Data Science by taking our Data Science with python certification training course. With Simplilearn’s Data Science certification training course, you will prepare for a career as a Data Scientist as you master all the concepts and techniques. Those who complete the course will be able to:
1. Gain an in-depth understanding of data science processes, data wrangling, data exploration, data visualization, hypothesis building, and testing. You will also learn the basics of statistics.
Install the required Python environment and other auxiliary tools and libraries
2. Understand the essential concepts of Python programming such as data types, tuples, lists, dicts, basic operators and functions
3. Perform high-level mathematical computing using the NumPy package and its large library of mathematical functions
Perform scientific and technical computing using the SciPy package and its sub-packages such as Integrate, Optimize, Statistics, IO, and Weave
4. Perform data analysis and manipulation using data structures and tools provided in the Pandas package
5. Gain expertise in machine learning using the Scikit-Learn package
Data Science with python is recommended for:
1. Analytics professionals who want to work with Python
2. Software professionals looking to get into the field of analytics
3. IT professionals interested in pursuing a career in analytics
4. Graduates looking to build a career in analytics and data science
Learn more at https://www.simplilearn.com/big-data-and-analytics/python-for-data-science-training
Vanderbilt University Medical Center has annual operating expenses of $2.3 billion, an annual sponsored research budget of $471.6 million, and annual unrecovered costs of charity care, community benefits, and other costs of $843.6 million. The document then discusses challenges in accessing and analyzing healthcare data from their databases due to issues such as lack of integration, improper structuring of the data, and cultural barriers between operations and IT. Strategies provided to help address these challenges include establishing standard data requests, designating cross-functional leads, and developing relationships with different types of "data people".
Personalized Search and Job Recommendations - Simon Hughes, Dice.comLucidworks
This document summarizes Simon Hughes' presentation on personalized search and job recommendations. Hughes is the Chief Data Scientist at Dice.com, where he works on recommender engines, skills pages, and other projects. The presentation discusses relevancy feedback algorithms like Rocchio that can be used to improve search results based on user interactions. It also describes how content-based and collaborative filtering recommendations can be provided in real-time using Solr plugins. Finally, it shows how personalized search can be achieved by boosting results matching a user's profile or search history.
Scaling Box-Search: Gearing up for Petabyte Scale - Shubhro Roy & Anthony Urb...Lucidworks
The document discusses how Box is scaling its search capabilities to handle a petabyte-scale index. It outlines Box's existing search infrastructure and scaling issues, and proposes solutions like key range partitioning, shard growth handling, and optimized shard allocation to improve query performance and cluster utilization as the index grows towards 1 petabyte in size over the next 5 years. The talk also covers future work like integrating key range partitioning into SolrCloud and building a search federation service to classify and rank results across collections.
This document discusses data science and the role of data scientists. It defines data science as using theories and principles to perform data-related tasks like collection, cleaning, integration, modeling, and visualization. It distinguishes data science from business intelligence, statistics, database management, and machine learning. Common skills for data scientists include statistics, data munging (formatting data), and visualization. Data scientists perform tasks like preparing models, running models, and communicating results.
Webinar: Question Answering and Virtual Assistants with Deep LearningLucidworks
This document discusses question answering and virtual assistants using deep learning. It provides an overview of question answering systems, including their uses for customer support and knowledge transfer. It describes the typical workflow of initial candidate retrieval using Solr followed by reranking using machine learning models. The document also discusses feature engineering, training data sources, and models for question answering, including supervised models like XGBoost and Siamese neural networks as well as unsupervised models using embeddings. It concludes that deep learning models outperform traditional models with sufficient training data.
Slides from Enterprise Search & Analytics Meetup @ Cisco Systems - http://www.meetup.com/Enterprise-Search-and-Analytics-Meetup/events/220742081/
Relevancy and Search Quality Analysis - By Mark David and Avi Rappoport
The Manifold Path to Search Quality
To achieve accurate search results, we must come to an understanding of the three pillars involved.
1. Understand your data
2. Understand your customers’ intent
3. Understand your search engine
The first path passes through Data Analysis and Text Processing.
The second passes through Query Processing, Log Analysis, and Result Presentation.
Everything learned from those explorations feeds into the final path of Relevancy Ranking.
Search quality is focused on end users finding what they want -- technical relevance is sometimes irrelevant! Working with the short head (very frequent queries) has the most return on investment for improving the search experience, tuning the results, for example, to emphasize recent documents or de-emphasize archive documents, near-duplicate detection, exposing diverse results in ambiguous situations, using synonyms, and guiding search via best bets and auto-suggest. Long-tail analysis can reveal user intent by detecting patterns, discovering related terms, and identifying the most fruitful results by aggregated behavior. all this feeds back into the regression testing, which provides reliable metrics to evaluate the changes.
By merging these insights, you can improve the quality of the search overall, in a scalable and maintainable fashion.
The document provides an introduction to data mining concepts. It discusses how data mining can be used to extract useful patterns and relationships from large datasets. It explains the differences between supervised and unsupervised learning, and gives examples of classification and clustering. The document also compares various data mining techniques and algorithms such as decision trees, k-means clustering, and neural networks.
Strategic Value from Enterprise Search and Insights - Viren Patel, PwCLucidworks
Viren Patel discusses PwC's enterprise search strategy and capabilities. The Chief Data Office's goals are to leverage data as a strategic asset by reducing unnecessary data, indexing valuable data, creating master data sources of truth, and exposing data to enable broader access. PwC's enterprise search engine Fathom provides value by allowing knowledge workers to easily find information, discover existing documents to reuse, and free up time with clients. Fathom uses analytics, machine learning and AI to power search and provide answers to questions. Governance focuses on metrics, processes, training and marketing to drive awareness and benefits of enterprise search. Demos of Fathom search, a chatbot and reading comprehension model are provided.
What is Web Scraping and What is it Used For? | Definition and Examples EXPLAINED
For More details Visit - https://hirinfotech.com
About Web scraping for Beginners - Introduction, Definition, Application and Best Practice in Deep Explained
What is Web Scraping or Crawling? and What it is used for? Complete introduction video.
Web Scraping is widely used today from small organizations to Fortune 500 companies. A wide range of applications of web scraping a few of them are listed here.
1. Lead Generation and Marketing Purpose
2. Product and Brand Monitoring
3. Brand or Product Market Reputation Analysis
4. Opening Mining and Sentimental Analysis
5. Gathering data for machine learning
6. Competitor Analysis
7. Finance and Stock Market Data analysis
8. Price Comparison for Product or Service
9. Building a product catalog
10. Fueling Job boards with Job listings
11. MAP compliance monitoring
12. Social media Monitor and Analysis
13. Content and News monitoring
14. Scrape search engine results for SEO monitoring
15. Business-specific application
------------
Basics of web scraping using python
Python Scraping Library
The document is an agenda for a seminar on machine learning techniques and tools. It will cover an introduction to machine learning, common techniques like classification, clustering and regression. It will also discuss tools for machine learning like Apache Mahout, Weka, Spark MLLib and R. Finally, it will include a hands-on demonstration of machine learning algorithms and discuss benefits of using machine learning.
A Practical Approach To Data Mining Presentationmillerca2
This document provides an overview of data mining, including common uses, tools, and challenges related to system performance, security, privacy, and ethics. It discusses how data mining involves extracting patterns from data using techniques like classification, clustering, and association rule learning. Maintaining privacy and anonymity while aggregating data from multiple sources for analysis poses ethical issues. The document also offers tips for gaining access to data and navigating performance concerns when conducting data mining projects.
BDVe Webinar Series - Designing Big Data pipelines with Toreador (Ernesto Dam...Big Data Value Association
In the Internet of Everything, huge volumes of multimedia data are generated at very high rates by heterogeneous sources in various formats, such as sensors readings, process logs, structured data from RDBMS, etc. The need of the hour is setting up efficient data pipelines that can compute advanced analytics models on data and use results to customize services, predict future needs or detect anomalies. This Webinar explores the TOREADOR conversational, service-based approach to the easy design of efficient and reusable analytics pipelines to be automatically deployed on a variety of cloud-based execution platforms.
The document describes the key phases of a data analytics lifecycle for big data projects:
1) Discovery - The team learns about the problem, data sources, and forms hypotheses.
2) Data Preparation - Data is extracted, transformed, and loaded into an analytic sandbox.
3) Model Planning - The team determines appropriate modeling techniques and variables.
4) Model Building - Models are developed using selected techniques and training/test data.
5) Communicate Results - The team analyzes outcomes, articulates findings to stakeholders.
6) Operationalization - Useful models are deployed in a production environment on a small scale.
Design Thinking is a holistic approach to solving human problems through research, logical reasoning, imagination, and intuition. It involves understanding human motivations, needs, and perspectives through research and discovery. Ideas are tested through prototyping and implementation to understand real-world impacts. The process is iterative, with continuous redesign to address new problems. Design Thinking helps marketers shift from campaign-focused marketing to relationship-focused design by deeply understanding customers.
CNX16 - Connecting the Cloud: Marketing Cloud ConnectCloud_Services
Discover how to optimize the Marketing Cloud Connect features in order to better leverage data across Salesforce Marketing, Sales, and Services Clouds in our Cloud Services hands on workshop.
For more information around Cloud Services, visit our website:
http://sforce.co/1ZuutDV
CNX16 - How To Get the Most Out of Your Marketing Cloud Premier Success PlanCloud_Services
Premier Success plans help customers increase Marketing Cloud ROI. Join us to learn how to best utilize all the resources included with Marketing Cloud Premier Success. Success Resources, Premier Support, Developer Services, Accelerators, Online training, and configuration services help our customers go faster and achieve more. We'll cover these topics and share best practices on how to maximize the value of your Premier Success.
For more information around Cloud Services, visit our website:
http://sforce.co/1ZuutDV
CNX16 - Concept to Creation: Taking Your Customer Journeys from the Whiteboar...Cloud_Services
This document discusses using Salesforce Journey Builder to evolve customer interactions from simple campaigns to personalized, data-driven customer journeys. It provides an example of how an online bank, Cumulus, could use Journey Builder to improve its basic checking onboarding process. Journey Builder allows mapping customer touchpoints, using data to personalize interactions across channels, and measuring results in real-time. The document emphasizes understanding the customer journey, planning interactions based on goals and available customer data, and bringing all customer touchpoints together into a unified experience.
CNX16 - Nine Ways to Track and Empower Social Media SuccessCloud_Services
Learn how Salesforce effectively and efficiently takes customers of all types, ranging from Financial Services and Pharmaceuticals to Retail and Manufacturing, through a journey to Social Maturity and realized ROI. This interactive session will educate you on 9 dimensions of maturity that will help your company reach new heights of social media success. Leave the workshop understanding where your company is on the Maturity Scale and knowing what the next tactical steps are in order for you to drive your social media analytics of success.
For more information around Cloud Services, visit our website:
http://sforce.co/1ZuutDV
Dreamforce 2017: Salesforce DX - an Admin's PerspectiveMike White
The Salesforce DX tool-set dramatically improves the development process for programmatic creation on the Salesforce platform but admins can use these same tools to streamline the declarative creation process as well.
These slides were part of the Dreamforce 2017 admin track presentation titled "Salesforce DX - an Admin's Perspective" given on November 7, 2017.
In this workshop, we'll explore methods and tools to evolve your current email creative. Learn how to critique your designs from a marketer and user point of view, and determine where your program lies on the design sophistication spectrum.
For more information around Cloud Services, visit our website:
http://sforce.co/1ZuutDV
CNX16 - Getting Started with Social StudioCloud_Services
Learn how to coordinate your Social Media Channels with the Social Studio through our hands on workshop. This session will demonstrate the power of combining Analyze, Publish and Engage into one tool.
For more information around Cloud Services, visit our website:
http://sforce.co/1ZuutDV
Basics of cloud computing & salesforce.comDeepu S Nath
This document provides an overview of cloud computing and discusses Salesforce.com. It defines cloud computing as using computing resources delivered over a network, and notes the cost savings and scalability benefits it provides compared to on-premise IT. Common cloud service models including SaaS, PaaS and IaaS are described. The document also summarizes how Salesforce.com alleviated concerns about security, integration and TCO that initially held some organizations back from adopting cloud computing. It identifies Salesforce.com as a major player in the cloud market with over 100,000 customers.
7 Strategies for Account-Based Marketing with SalesforceSangram Vajre
Presented at Dreamforce '17 by Terminus Co-Founder & CMO, Sangram Vajre, author of "Account-Based Marketing for Dummies" and founder of the #FlipMyFunnel movement transforming B2B marketing and sales. Learn the basics of ABM and seven practical strategies for demand generation, sales pipeline velocity, and customer marketing.
Einstein
Analytics: Einstein Analytics
Commerce: Commerce Cloud
Marketing: Marketing Cloud
Service: Service Cloud
Platform: AppExchange, Heroku, Lightning
Sales: Sales Cloud
13
Our Product Suite is Growing
Add-on pro
This presentation was given in one of the DSATL Mettups in March 2018 in partnership with Southern Data Science Conference 2018 (www.southerndatascience.com)
A Data Warehouse And Business Intelligence ApplicationKate Subramanian
The document outlines a project to develop a real-time fraud detection system for banking transactions by capturing functional and non-functional requirements, including system capabilities, interfaces, performance needs, security requirements, and an overall design architecture. The goal is to help banks identify fraudulent transactions in real-time through analyzing banking data and transactions based on pre-defined rules to flag suspicious activity and prevent financial losses from fraud.
Common Data Model - A Business Database!Pedro Azevedo
In this session I presented how Common Data Service will be the future of Business Application Platform and how this platform will help the Dynamics 365 to grow.
The document provides an overview of data warehousing concepts. It defines a data warehouse as a subject-oriented, integrated, time-variant, and non-volatile collection of data. It discusses the differences between OLTP and OLAP systems. It also covers data warehouse architectures, components, and processes. Additionally, it explains key concepts like facts and dimensions, star schemas, normalization forms, and metadata.
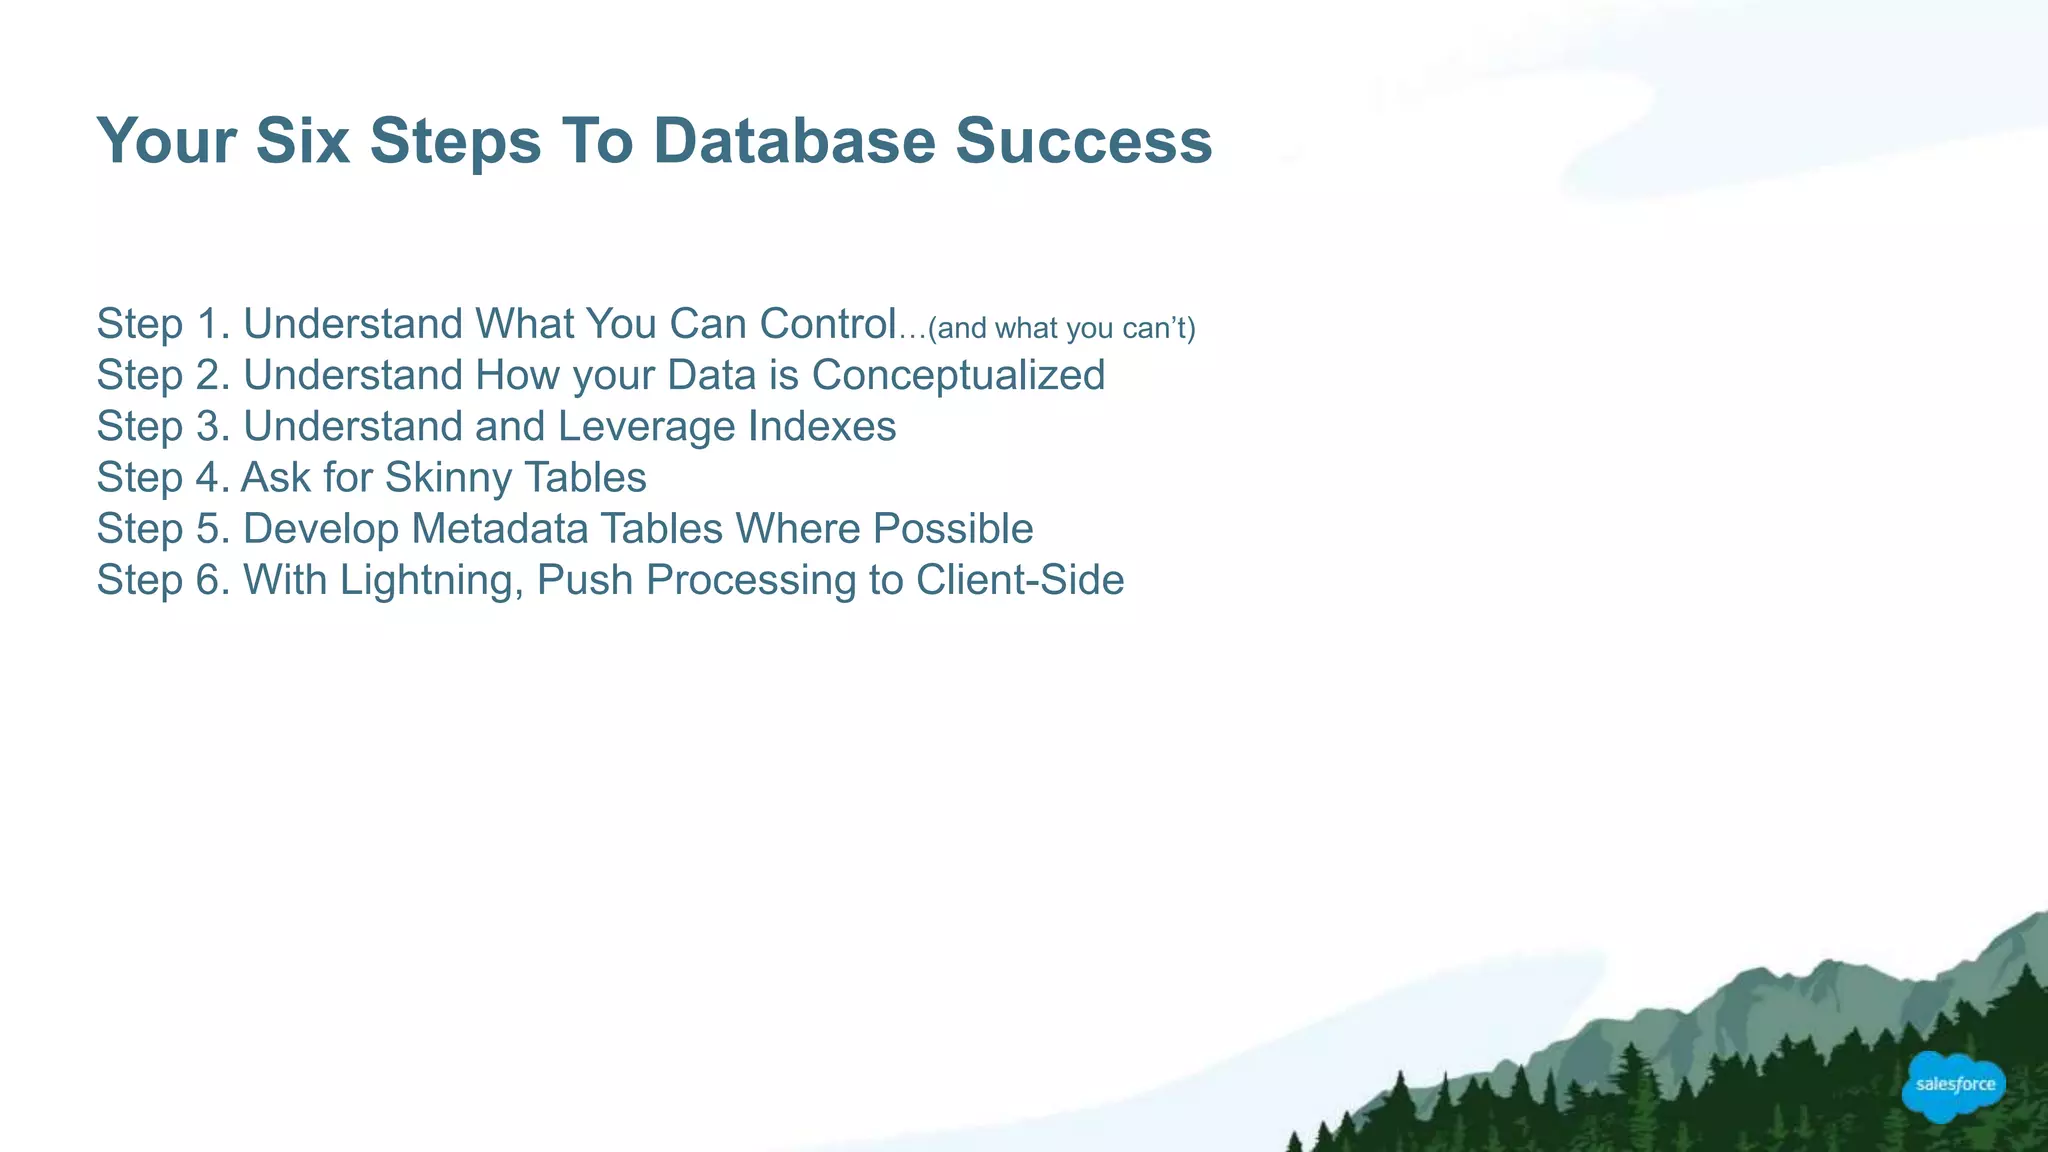
The document discusses strategies for managing large data volumes in Salesforce, including:
- Using "skinny tables" to combine standard and custom fields to improve performance.
- Creating indexes on fields used in queries to optimize search.
- Partitioning data using "divisions" to separate large amounts of records.
- Maintaining large external datasets through "mashups" to reduce the data in Salesforce.
- Avoiding "ownership skew" and "parenting skew" to prevent a single owner or parent from impacting performance.
- Considering data sharing, load strategies, and archiving techniques when dealing with large volumes.
SpeedTrack has developed revolutionary software that eliminates barriers to data integration, analytics, and insights. Their technology validates insights with customers through SaaS products and custom solutions. SpeedTrack is launching into markets with a need for solutions that liberate information from disparate data silos. Their Guided Information Access interface provides an intuitive window into scalable ad-hoc discovery of actionable insights, driving more efficient operations, better decisions, and competitive advantage. SpeedTrack offers benefits over relational databases like unlimited analytics dimensions, scalability, and visibility into all data values and associations.
Data Profiling: The First Step to Big Data QualityPrecisely
Big data offers the promise of a data-driven business model generating new revenue and competitive advantage fueled by new business insights, AI, and machine learning. Yet without high quality data that provides trust, confidence, and understanding, business leaders continue to rely on gut instinct to drive business decisions.
The critical foundation and first step to deliver high quality data in support of a data-driven view that truly leverages the value of big data is data profiling - a proven capability to analyze the actual data content and help you understand what's really there.
View this webinar on-demand to learn five core concepts to effectively apply data profiling to your big data, assess and communicate the quality issues, and take the first step to big data quality and a data-driven business.
The document discusses Business Intelligence (BI) and defines it as technologies, applications, and practices for collecting, integrating, analyzing, and presenting business information to support better business decision making. It then lists some common questions BI helps answer related to understanding what happened in the past, present, and future. Finally, it discusses how BI can help companies adapt quickly to changing customer demands and be better informed about competitors' actions.
Business Intelligence Data Warehouse SystemKiran kumar
This document provides an overview of data warehousing and business intelligence concepts. It discusses:
- What a data warehouse is and its key properties like being integrated, non-volatile, time-variant and subject-oriented.
- Common data warehouse architectures including dimensional modeling, ETL processes, and different layers like the data storage layer and presentation layer.
- How data marts are subsets of the data warehouse that focus on specific business functions or departments.
- Different types of dimensions tables and slowly changing dimensions.
- How business intelligence uses the data warehouse for analysis, querying, reporting and generating insights to help with decision making.
Common Data Service – A Business Database!Pedro Azevedo
In this session I tried to explain to SQL Community what is Common Data Service, it's a new Database or only a service to allow Power Users to create applications.
Competitive intelligence for sourcers gutmacher-TA Week 2021Glenn Gutmacher
This document provides an overview of competitive intelligence methods and tools for talent sourcers. It discusses tools for identifying competitors and analyzing talent supply and demand, such as Indeed, EMSI, LinkedIn Talent Insights, Hiretual, and SeekOut. It also covers gathering intelligence from sources like virtual conferences, social media, layoff lists, salary data sites, and org charts. Methods for analyzing intelligence like using multiple sources and demand data are presented. Gathering tools including RSS readers and alert services are also highlighted.
The document provides guidance on leveling up a company's data infrastructure and analytics capabilities. It recommends starting by acquiring and storing data from various sources in a data warehouse. The data should then be transformed into a usable shape before performing analytics. When setting up the infrastructure, the document emphasizes collecting user requirements, designing the data warehouse around key data aspects, and choosing technology that supports iteration, extensibility and prevents data loss. It also provides tips for creating effective dashboards and exploratory analysis. Examples of implementing this approach for two sample companies, MESI and SalesGenomics, are discussed.
The document discusses challenges related to managing information and metadata across SharePoint and Office 365 environments. It notes that without effective governance, most technology-focused metadata projects will fail. It highlights issues like inconsistent tagging of content by end users, which compromises search and accessibility of information. The document advocates augmenting Microsoft tools with third-party applications that can automatically generate and apply conceptual metadata to content. This helps improve search, records management, data security, compliance, and other information governance capabilities across hybrid environments.
Information On Line Transaction ProcessingStefanie Yang
Here are the key steps I would take to address this data science assessment task:
1. Data collection and cleaning: Collect data from various sources and perform data cleaning/preprocessing to address issues like missing/duplicate data, inconsistent formats, etc. Technologies used may include Python/Pandas for ETL.
2. Exploratory data analysis: Perform EDA to understand patterns, outliers and relationships. Visualization tools like Tableau/PowerBI would be useful.
3. Feature engineering: Derive new features/variables from existing data to help models. For example, create location categories from address data.
4. Modeling: Start with basic techniques like decision trees to identify key factors for student choice. More advanced models
ETL processes , Datawarehouse and Datamarts.pptxParnalSatle
The document discusses ETL processes, data warehousing, and data marts. It defines ETL as extracting data from source systems, transforming it, and loading it into a data warehouse. Data warehouses integrate data from multiple sources to support business intelligence and analytics. Data marts are focused subsets of data warehouses that serve specific business functions or departments. The document outlines the key components and architecture of data warehousing systems, including source data, data staging, data storage in warehouses and marts, and analytical applications.
What Your Database Query is Really DoingDave Stokes
Do you ever wonder what your database servers is REALLY doing with that query you just wrote. This is a high level overview of the process of running a query
Similar to Moyez Dreamforce 2017 presentation on Large Data Volumes in Salesforce (20)
Codeless Generative AI Pipelines
(GenAI with Milvus)
https://ml.dssconf.pl/user.html#!/lecture/DSSML24-041a/rate
Discover the potential of real-time streaming in the context of GenAI as we delve into the intricacies of Apache NiFi and its capabilities. Learn how this tool can significantly simplify the data engineering workflow for GenAI applications, allowing you to focus on the creative aspects rather than the technical complexities. I will guide you through practical examples and use cases, showing the impact of automation on prompt building. From data ingestion to transformation and delivery, witness how Apache NiFi streamlines the entire pipeline, ensuring a smooth and hassle-free experience.
Timothy Spann
https://www.youtube.com/@FLaNK-Stack
https://medium.com/@tspann
https://www.datainmotion.dev/
milvus, unstructured data, vector database, zilliz, cloud, vectors, python, deep learning, generative ai, genai, nifi, kafka, flink, streaming, iot, edge
4th Modern Marketing Reckoner by MMA Global India & Group M: 60+ experts on W...Social Samosa
The Modern Marketing Reckoner (MMR) is a comprehensive resource packed with POVs from 60+ industry leaders on how AI is transforming the 4 key pillars of marketing – product, place, price and promotions.
Predictably Improve Your B2B Tech Company's Performance by Leveraging DataKiwi Creative
Harness the power of AI-backed reports, benchmarking and data analysis to predict trends and detect anomalies in your marketing efforts.
Peter Caputa, CEO at Databox, reveals how you can discover the strategies and tools to increase your growth rate (and margins!).
From metrics to track to data habits to pick up, enhance your reporting for powerful insights to improve your B2B tech company's marketing.
- - -
This is the webinar recording from the June 2024 HubSpot User Group (HUG) for B2B Technology USA.
Watch the video recording at https://youtu.be/5vjwGfPN9lw
Sign up for future HUG events at https://events.hubspot.com/b2b-technology-usa/
Moyez Dreamforce 2017 presentation on Large Data Volumes in Salesforce
1. Tools, Techniques and Solutions To
Avoid A Big-Data Blowout In Your Org
moyez@t.digital, @moyezthanawalla
Moyez Thanawalla, President – Thanawalla Digital
4. What Prompted Me To Speak About Large Data in Salesforce?
AT&T Uverse:
• Exponential Record Growth.
• Expected to double in size next year
• Slow queries, mostly relegated to overnight batch jobs
• 48 hour turn-around to get leads allocated to dealers
• Client need to react much, much faster (minutes instead of days) to business ad-hoc needs
• Yes, Salesforce CAN go there
5. By [2020], our accumulated digital universe of data will grow from
4.4 zettabyets today to around 44 zettabytes, or
44 trillion gigabytes.
Even on a logarithmic scale, data is growing at an exponential rate…
6. By [2020], our accumulated digital universe of data will grow from
4.4 zettabyets today to around 44 zettabytes, or
44 trillion gigabytes.
Even on a logarithmic scale, data is growing at an exponential rate…
7. …And Salesforce Orgs are Leading The Way
”The truth is that as salesforce.com popularity has
skyrocketed, so too has the size of databases
underlying custom and standard app implementations
on our cloud platforms. It might surprise you to learn
that our team works regularly with customers that have
large Force.com objects upwards of 10 million
records.”
Steve Bobrowski, Salesforce Customer Centric Engineering Group
8. Your Six Steps To Database Success
Step 1. Understand What You Can Control…(and what you can’t)
Step 2. Understand How your Data is Conceptualized
Step 3. Understand and Leverage Indexes
Step 4. Ask for Skinny Tables
Step 5. Develop Metadata Tables Where Possible
Step 6. With Lightning, Push Processing to Client-Side
9. Step 1. Understand What You Can Control…(and what you can’t)
“As a customer, you also cannot
optimize the SQL that
underlie many application operations because it is
generated by the
system, not written by each tenant. “
10. …And Managing Large Volumes in Salesforce is Different..
Multitenancy and Metadata
11. Step 2. Understand How your Data is Conceptualized
In Agile, the Class-diagrams of Domain
Modelling, derived from the Use-Cases, have
usually replaced Entity-Relationship modelling; but the
need for planning has not diminished. We still need to
understand the data and what it’s
supposed to do and what are the best and safest ways
to manage, store, and protect it.
….in other words…Are class-diagrams the enemy of database design?
13. Step 3. Understand and Leverage Indexes
Salesforce supports custom indexes to speed up queries, and you can create custom
indexes by contacting Salesforce Customer Support.
On Most Objects…
• RecordTypeId
• Division
• CreatedDate
• Systemmodstamp
• Name
• Email (for contacts and leads)
• Foreign key relationships
• The unique Salesforce record
ID.
Salesforce also supports
custom indexes on custom
fields, Except for
• multi-select picklists,
• text areas (long),
• text areas (rich),
• non-deter. formula fields,
• encrypted text fields.
Declaring a field as an
External ID causes an index
to be created on that field;
You can create External IDs
only on the following fields.
• Auto Number
• Email
• Number
• Text
15. What Does The Query Optimizer Tell Me?
If the cost for the table scan is lower than the index, and the query is timing
out, you will need to perform further analysis on using other filters to improve selectivity,
or, if you have another selective filter in that query that is not indexed but is a candidate
for one.
16. What Is The Criteria for a Selective Query”
Does Your Query Have and Index?
• If the filter is on a standard field, it'll have an index if it is a primary key (Id, Name, OwnerId), a foreign key (CreatedById, LastModifiedById,
lookup, master-detail relationship), and an audit field (CreatedDate, SystemModstamp).
Custom fields will have an index if they have been marked as Unique or External Id
• If the filter doesn't have an index, it won't be considered for optimization.
• If the filter has an index, determine how many records it would return:
For a standard index, the threshold is 30 percent of the first million targeted records and 15 percent of all records after that first
million. In addition, the selectivity threshold for a standard index maxes out at 1 million total targeted records, which you could reach
only if you had more than 5.6 million total records.
For a custom index, the selectivity threshold is 10 percent of the first million targeted records and 5 percent all records after that
first million. In addition, the selectivity threshold for a custom index maxes out at 333,333 targeted records, which you could reach only if
you had more than 5.6 million records.
If the filter exceeds the threshold,it won't be considered for optimization.
If the filter doesn't exceed the threshold, this filter IS selective, and the query optimizer will consider it for optimization.
• If the filter uses an operator that is not optimizable, it won’t be considered for optimization.
The following type of operators are not optimizable: != , Leading %, null value comparisons,
23. Step 4. Ask for Skinny Tables
Salesforce uses the concept of “Skinny Tables” to speed up queries by avoiding joins
Characterisitics…
• Must be enabled by
Salesforce
• Is a collection of frequently
used fields
• Records are kept in sync with
the underlying table structure.
• Contains both Standard and
Custom fields.
• Does not include soft-deleted
records.
• Ideal when your table size
grows over a million records
• The unique Salesforce record
ID.
Considerations…
• Can be created on all
custom objects…
• but only on certain std
objects.,
• Skinny tables can contain
the following field types:
• Checkbox, Date, Date/Time,
Email, Number, Percent,
Phone, Picklist, Multi-select
Picklist, Text, Text Area, Text
Area (long) and URL.
24. Step 5. Develop Metadata Tables Where Possible
Can you infer aggregate abstractions in your
data? If so, pull those away into a metadata table,
and query, sort and report on *that* table instead.
25. Step 6. With Lightning, Push Processing to Client-Side
If moving excel tables to Salesforce, where the user wants to ‘filter on the fly’
Consider doing a broad query against Salesforce, and loading the data into a
Lightning Component (array or grid) where the user can further filter his
data in an ‘excel’ manner.
26. Your Six Steps To Database Success
Step 1. Understand What You Can Control…(and what you can’t)
Step 2. Understand How your Data is Conceptualized
Step 3. Understand and Leverage Indexes
Step 4. Ask for Skinny Tables
Step 5. Develop Metadata Tables Where Possible
Step 6. With Lightning, Push Processing to Client-Side
27. Want To Know More?
Salesforce Best Practices For Large Data
Volume:
• https://resources.docs.salesforce.com/sfdc/pdf/sal
esforce_large_data_volumes_bp.pdf
Trailhead:
• https://trailhead.salesforce.com/en/modules/datab
ase_basics_dotnet/units/writing_efficient_queries
Query Plan Tool Details:
• https://help.salesforce.com/articleView?id=000199
003&language=en_US&type=1
Editor's Notes
Thanawalla Digital….Salesforce Architect and Engineers.
https://www.entrepreneur.com/article/273561
In May of this year, Entrepreneur magazine rang the alarm bell on the need to tackle big data in your org NOW. Their approach suggested that the problem is two-fold. First, the data itself if growing at a growing rate. That is, we want to store more information about each transaction and identify MORE touchpoints on MANY MORE clients and prospects than ever before. C-suite executives want to know that we are amassing all needles in every haystack, and rigorously identifying an ever more complex understanding of our markets and clients.
BUT!!!, the article goes on, that’s only HALF the story. The more data we accumulate, the more efficient our processing engines MUST be in order to tackle the reporting and tracking requirements set by our CMOs, CFO….and down to our line managers. That’s where our companies are failing today. We ARE gathering more needles in more haystacks than ever before, but our ability to extract those needles IN-THE-MOMENT is significantly hampered by the data structures that we choose, and how we choose to access that data once it is in our possession.
In April of this year, Salesforce Customer Success invited us in to look at a problem that one of their premier clients was facing. Their database, mainly lead records, had grown…and continues to grow at an exponential rate. This, in itself does not usually cause a problem, but in this case, the number of records had already reached into the 10’s of millions of records, and the database was…is…growing at an exponential, exponential rate. The client was feeling real pain caused by delays in allocating leads. From the time a request to allocate leads came in….to the time that the leads were allocated…..was typically 4 days or more. This time was expected to deteriorate even further as the number of records continues to grow. This is not uncommon. Your business will face a similar issue, perhaps even as soon as next year……
https://www.youtube.com/watch?v=0kTH15TsxDU&feature=youtu.be
Ray Kurzweil, author of The Singularity is Near, shows us how large this problem of data-doubling really is. He makes the point that if you take 30 steps of equal size…..say, 1 meter each…. to reach the end of the hall, at the end of the 30 steps, you’ll be at the end of the hall………
…….on the other hand, if you take 30 steps, each one twice the size of the previous one………the doubling of data size in our example……at the end of the 30 steps,
https://www.forbes.com/sites/bernardmarr/2015/09/30/big-data-20-mind-boggling-facts-everyone-must-read/#ab59fe817b1e
you would have circled the earth 26 times. This, then is the challenge that you face as your company’s database administrator.
AND…..Salesforce Orgs are not exempt from this geometric growth….
https://www.forbes.com/sites/bernardmarr/2015/09/30/big-data-20-mind-boggling-facts-everyone-must-read/#ab59fe817b1e
Steve Bobrowski is an Architect Evangelist within the Salesforce Customer Centric Engineering group. Recently, he articulated Salesforce’s own experience with data-growth………[read]…..This number…that is, the number of TENANTS whose data exceeds 10 million records is also growing..
So that’s all well and good, but what CAN we do about storing and retrieving an every increasing number or records in our Saesforce database.
Today, we’ll talk about the six key concepts that you should architect around:
They Key to understanding how to tackle the problem of an ever-expanding data-set is to understand what you CAN control, and what you can’t. For those of you who come from a traditional database architecture background, you understand relational databases, indexes, SQL queries and the like. You may have also run your own queries on your local databases in Microsoft Access or SEEQUEL SERVER. But optimizing your database and your queries in a multi-tenant org is fundamentally different. For one thing, you don’t control your own SQL query. In fact, you can only have abstract inputs into the THING that ultimately generates the SQL queries that extract your data. There are multiple reasons for this, not the least of which is how the data in Salesforce is ACTUALLY laid out, compared to how you THINK it’s laid out…..
In Salesforce, your data for a single table is stored multiple places. This architecture is necessary to (1) accommodate multiple tenants on the same server, and (2) abstract and maintain indexes and differing number (and types) of fields in the same physical table. For instance, All standard objects and their standard fields (that is, those items that EVERY tenant has in common) are, simply enough, stored on one table. However, the custom fields for these same standard objects are relegated, by necessity to another table. You can see, then, if you run a query that returns a combination of fields from a standard object, then Salesforce has to first translate the query into TWO Oracle SQL queries, execute those queries, and aggregate the results before showing it to you on your list-view page or report.
Similarly, Custom objects and their fields are stored in other underlying SEEQL tables altogether. There are additional tables that store pivot tables for fields, tables that store indexes and relationships. For today’s discussion, the Index plays a front & center role.
Instead of attempting to manage a vast, ever-changing set of actual database structures for each application and tenant, the platform storage model manages virtual database structures using a set of metadata, data, and pivot tables.
Thus, if you apply traditional performance-tuning techniques based on the data and schema of your organization, you might not see the effect you expect on the actual, underlying data structures.
https://www.red-gate.com/simple-talk/sql/database-administration/how-to-get-database-design-horribly-wrong/
Robert Sheldon, In his article “How to Get Database Design Horribly Wrong”, points out that in most companies, the Agile methods of communication ignore the schema diagram in favor of Class Diagrams, which obfuscate the underlying intelligence of our database structure. As we get used to seeing Class Diagrams instead of Schema’s we tend to slowly forget how our database is laid out at the database layer….in addition (next slide)….
https://www.red-gate.com/simple-talk/sql/database-administration/how-to-get-database-design-horribly-wrong/
He makes the point that you must keep your data clean and normalized. That is, follow the rules of data-sanitation. Duplicate data must be rigorously prevented from entering your system, and duplicates that exist within your database today, must be rooted out and eliminated. The other side of that same coin is to enforce that your data is normalized. Within the Salesforce paradigm, tables have parent/child relationships. Leverage this capability to ensure that you store a clients billing address only once, and his shipping address only once, and that anytime you need that address on an order, that you lookup back to the account object to retrieve that information. Do not, store one piece of data in multiple locations.
The last point in Robert Sheldon’s essay is to…….(next slide)
Keeping Your Data Clean
Why? How?
Keeping Your Data Relational
Don’t Store Your Data in Multiple Places
Index Your Database
What is an Index, and Why do I Care?
Optimize Your Queries
How?
Certain standard fields on virtually all objects that you might query are already indexed. That makes them great as the “WHERE” part of any SOQL query as well as the filter part of an list or report. In addition, if you create certain TYPES of custom fields, these too are automatically indexed for you. Everything else….that is fields that don’t fall into these catagories MAY be indexed by asking salesforce to index them for you. Open a case, and include in that request, the org ID, the API name of the object and the API name of the field within the object that you want indexed. Here (in the center column), you see the types of fields that Salesforce CAN NOT index.
The Query Plan Tool is button on the Developer Console that allows you see the project cost of a query. To Enable the button, go to ‘Help’ on the Developer Console, and under ‘Preferences’ select Enable Query Plan Tool.
DEMO….show them how to enable the QUERY PLAN TOOL.
Why Should you care about optimizing your queries. The biggest reason to care is this. If your query is not optimized, that is…it’s running a full table scan in order to extract your data, then……even if it’s performing reasonably well today…….you risk the query timing-out when your database grows. That is, the search is not sustainable long term. Your objective, always should be to make sure that you have selective queries in your searches.
Selective: select name from account where name = 'GenePoint’
Not Selective because operation is not optimizable: select name from account where name != 'GenePoint'
Not considered for optimization because unindexed: select name from account where billingcity = 'paris’
Selective: select name from account where name = 'GenePoint’
Not Selective because operation is not optimizable: select name from account where name != 'GenePoint'
Not considered for optimization because unindexed: select name from account where billingcity = 'paris’
Selective: select name from account where name = 'GenePoint’
Not Selective because operation is not optimizable: select name from account where name != 'GenePoint'
Not considered for optimization because unindexed: select name from account where billingcity = 'paris’
Selective: select name from account where name = 'GenePoint’
Not Selective because operation is not optimizable: select name from account where name != 'GenePoint'
Not considered for optimization because unindexed: select name from account where billingcity = 'paris’
Selective: select name from account where name = 'GenePoint’
Not Selective because operation is not optimizable: select name from account where name != 'GenePoint'
Not considered for optimization because unindexed: select name from account where billingcity = 'paris’
Selective: select name from account where name = 'GenePoint’
Not Selective because operation is not optimizable: select name from account where name != 'GenePoint'
Not considered for optimization because unindexed: select name from account where billingcity = 'paris’
In the case of our client we identified metadata that could easily be extracted to a lookup table, which allowed queries to executed, in real-time against a table that was significantly smaller. For instance, if your leads can be aggregated into districts or neighborhoods, and you are able to assign them as neighborhoods to an agent, you can filter your leads at the neighborhood level, and then, when you have determined the neighborhoods to assign (after filtering and sorting through the available neighborhoods), you can execute a final routine to change the owner of the leads associated with the selected neighborhood. In some cases, we were able to run queries against a significantly smaller table (400k records) instead of doing the same thing against 80 million records in the lead table.
You are able to achieve this sort of improvement if you look at your queriable tables with an eye toward the metadata contained within the table, and ask the question….Can we abstract the metadata away into a smaller table, run our queries against the smaller table, and regain the equivalent records in the original table at the end.
Not all data should be filtered on the server. With Lightning Components, an architect has the ability to move significant processing away from server side by executing broad filters against the target data, loading that data into client-side tables, and allowing the user to apply excel style column filters to suit their needs. This is particularly useful where the user needs to be able to apply filters that the user wishes to apply in an ad-hoc manner.
So what we’ve talked about, are the six steps that we use at my company to look at a clients database….with a critical eye towards significantly improving their capability to grow their Salesforce database without their business grinding to a halt.