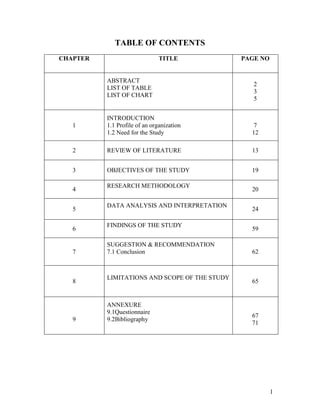
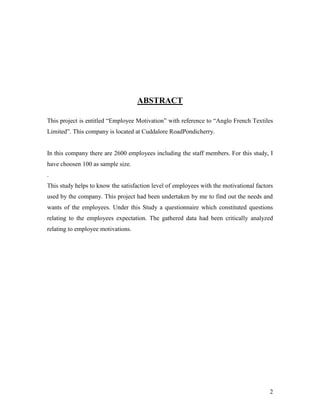
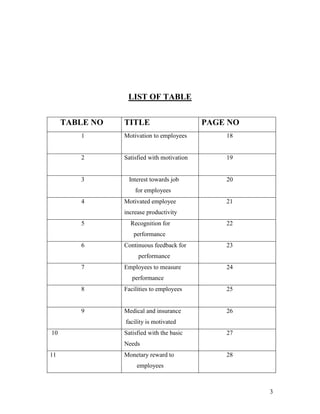
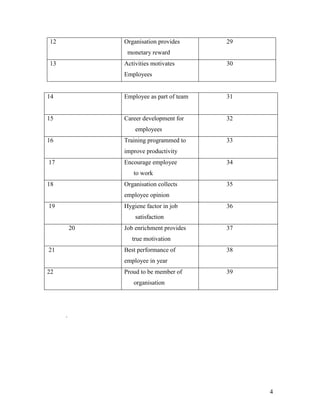
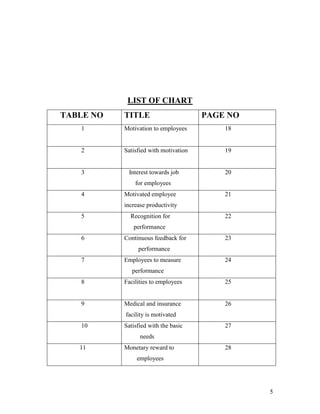
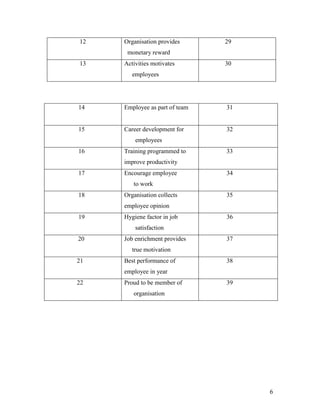
SlideShare a Scribd company logo
TABLE OF CONTENTS
CHAPTER                        TITLE           PAGE NO


          ABSTRACT
                                                  2
          LIST OF TABLE
                                                  3
          LIST OF CHART
                                                  5


          INTRODUCTION
   1      1.1 Profile of an organization          7
          1.2 Need for the Study                 12

   2      REVIEW OF LITERATURE                   13


   3      OBJECTIVES OF THE STUDY                19

          RESEARCH METHODOLOGY
   4                                             20

          DATA ANALYSIS AND INTERPRETATION
   5                                             24

          FINDINGS OF THE STUDY
   6                                             59

          SUGGESTION & RECOMMENDATION
   7      7.1 Conclusion                         62


          LIMITATIONS AND SCOPE OF THE STUDY
   8                                             65


          ANNEXURE
          9.1Questionnaire
                                                 67
   9      9.2Bibliography
                                                 71


                                                         1
ABSTRACT

This project is entitled “Employee Motivation” with reference to “Anglo French Textiles
Limited”. This company is located at Cuddalore RoadPondicherry.


In this company there are 2600 employees including the staff members. For this study, I
have choosen 100 as sample size.
.
This study helps to know the satisfaction level of employees with the motivational factors
used by the company. This project had been undertaken by me to find out the needs and
wants of the employees. Under this Study a questionnaire which constituted questions
relating to the employees expectation. The gathered data had been critically analyzed
relating to employee motivations.


                                                                                        2
LIST OF TABLE


     TABLE NO   TITLE                       PAGE NO
        1       Motivation to employees         18


        2       Satisfied with motivation       19


        3        Interest towards job           20
                    for employees
        4       Motivated employee              21
                increase productivity
        5         Recognition for               22
                   performance
        6       Continuous feedback for         23
                     performance
        7       Employees to measure            24
                   performance
        8       Facilities to employees         25


        9       Medical and insurance           26
                facility is motivated
10              Satisfied with the basic        27
                Needs
11              Monetary reward to              28
                     employees


                                                      3
12            Organisation provides      29
               monetary reward
13            Activities motivates       30
              Employees


14            Employee as part of team   31


15            Career development for     32
                  employees
16            Training programmed to     33
              improve productivity
17            Encourage employee         34
                 to work
18            Organisation collects      35
              employee opinion
19            Hygiene factor in job      36
                  satisfaction
         20   Job enrichment provides    37
                 true motivation
21            Best performance of        38
              employee in year
22            Proud to be member of      39
                 organisation


     .


                                              4
LIST OF CHART
TABLE NO   TITLE                       PAGE NO
   1       Motivation to employees         18


   2       Satisfied with motivation       19


   3        Interest towards job           20
               for employees
   4       Motivated employee              21
           increase productivity
   5         Recognition for               22
              performance
   6       Continuous feedback for         23
                performance
   7       Employees to measure            24
              performance
   8       Facilities to employees         25


   9       Medical and insurance           26
           facility is motivated
   10      Satisfied with the basic        27
                 needs
   11      Monetary reward to              28
                employees


                                                 5
12   Organisation provides      29
      monetary reward
13   Activities motivates       30
        employees


14   Employee as part of team   31


15   Career development for     32
         employees
16   Training programmed to     33
     improve productivity
17   Encourage employee         34
        to work
18   Organisation collects      35
     employee opinion
19   Hygiene factor in job      36
         satisfaction
20   Job enrichment provides    37
        true motivation
21   Best performance of        38
     employee in year
22   Proud to be member of      39
        organisation


                                     6
1. INTRODUCTION

                           1.1 COMPANY PROFILE


This project involves a study on “Employee Motivation” in Anglo French Textiles
Limited. The main objective of this study is to know the level of satisfaction of each
employee in the company. For this purpose 100samples are collected in relating to
various motivational factors used by the company.


 The analysis includes finding out the needs and expectations from the employees to
reinforce the motivational factors that they are already used by the Company.
“A Motivation Scenario employed in Anglo French Textiles at Pondicherry”.Motivation
is derived from the Word “Motive” means any idea,need, emotion or organic state
prompts a man to action.Motive is an internal factor that integrates a behavior.As the
motive is within theIndividual,it is necessary to study needs,emotions etc., in order to
motivate him to work.


Motivation is a process if getting the needs of the people realized with a view to induces
them to work for the accomplishment of organization objectives.Indeed,Motivation is
nothing but an action of inducement.Motivation is a behavioral concept. It seeks to
understand why people behave as they do.


HISTORY :

The Anglo French Textiles is a unit of Pondicherry Textiles Corporation Limited. It is
Government of Pondicherry undertaking and it is one of the largest composite textile
mills in Southern India.
 It was started by Mr.RODIER in the year 1898 and was incorporated in England in the
year 1898.It celebrated its centaury in 1998.In the beginning Africa,Australia,Europe


                                                                                        7
were the prominent buyers from Anglo French Textile now it shows the main interest in
the area of export and nearly local market.

The company was managed by different and various agencies of different periods. The
mill was expanded with additional machines and export of cloths received great attention
unfortunately in 1983 the mill faced financial and labour problems. The management
found it very difficult to run this situation gace way to selling of the mill it Shri.JATIA
and SOMINA group of Bombay at that time the mill was sacing financial crisis due to
mismanagement and some problems.


 This lead to stoppage of operation in the mills and ultimately the mill stopped its
function from 1983 and was closed.


 Employee continues to work without wages for about six months loping prosperity but
vain slowly the employees strength. It was not working for 3 years since 1983.


This affected about 7000 families in the union territory of Pondicherry and also the
economy of the state was affected the people and trade union. The press and the
politicians voice at various forms to reopen the mill and the government of Pondicherry
came forward to undertake the mill in the year 1986.At that time the formed Pondicherry
textile corporation and from that time onwards their mill become government mill. In the

beginning there were 6500 employees in all the units.


PRESENT CONTEXT OF AFT:
   Now, there are 3 units with total employee‟s strength of 4000.The Company has
planned to modernize and install new machinery. It plans to produce superfine quality
fabric for export. The company has also set up a “quality term” in which key executive
member. The main objectives of the “quality term” are to get qualification certificate like
ISO 9002 or EN 29000with this dedicated team. The Anglo French Textile
managementwould surelyenter 21stcentuary as the pride of Pondicherry.Since its
development are manifold and materialistic.


                                                                                         8
DEPARTMENT OF AFT:
The Various Department of AFT are as follows
     (A)Production Department:


       1. Spinning Department-Blow room, Carding& Spinning
       2. Weaving Department-Loom Shed
       3. Warehouse Department-Examining, Packing& Baling
       4. Processing Department-Bleaching, Printing& Dyeing


(B)Service Department:


         1. Marketing Department
         2. Finance & Accounts Department
         3. Purchase & Stores
         4. Quality Assurance
         5. Engineering
         6. Personnel


(C) Service Sections:


        1. EDP
        2. Internal Audit
        3. Costing
        4. Canteen
        5. Dispensary
        6. Security
        7. Transport & Automobile
        8. Horticulture
        9. Garment Factory


                                                              9
(D) Raw Material:


          1. Cotton
          2. Polyester


ABOUT THE PRODUCTS


            The following products are presently manufactured in Anglo French Textiles
          Limited.,(PTC)Pondicherry.
              1. Cotton Clothes
              2. Pant & Shirt Clothes
              3. Towels
              4. Screen Clothes
              5. Uniforms
              6. Bed Spread
              7. Pillow Covers


OBJECTIVES OF THE COMPANY:


The main objective of the company can be generally started as the manufacturing and
selling of cotton yarn & Cotton fabrics.
      To manufacture and market cotton yarns.
      To manufacture and market cotton fabrics.
      To manufacture garments and uniforms for various agencies and service
       organization.
      To protect the interest of the employees through welfare measures.
      To modernize the mills and its systems including computerization.


                                                                                   10
FUNCTIONS OF PERSONNEL MANAGEMENT AND HRD
DEVELOPMENT:
            Recruitment
            Training & Development
            Wage &Salary Administration
            Labor Welfare Measures
            Health & Safety Management
            Industrial Relation Management
            Compliance of Statutory Requirement
            Disciplinary Proceedings
            Carrier Planning & Development


QUALITY POLICY OF AFT:
Anglo French Textile is committed to meet the requirements of its customers and
continually improve its products services by technological up gradation and enriching the
resources with perpetual review of the quality system.


SAFETY MEASURES:
Anglo French Textiles has a full fledged safety department to monitor the safety in the
factory, the company has been a recipient of the state.


                                                                                      11
1.2 NEED FOR THE STUDY

The needs for the study are given below such as follows.


       To study and know the employee motivation scenario in “Anglo French Textiles
       Limited”.
       To know the employees satisfied level with the motivation factors undertaken by
       the company.
       To identify how the organization motivates the employees.
       To measure the level of performance before and after motivation to find out the
       improvement factors for motivating the employees.


                                                                                   12
REVIEW OF LITERATURE:

MOTIVATION:

 Some people perform the same type of job more efficiently then others some find it.


       More rewarding and interesting than others and some enjoy it more than others.
       At any given point of time people vary in the extent to which they are willing to
       direct their energies to the attainment of goals due to differences in motivation.

DEFINITION:

Motivation can be traced to be Latin word” Moves” which means “to move”.
The term motivation means to accelerate to boost and to direct the behavior of a person
for achieving success.


__Bert son and Steiner (1984) state “A motive is inner state tear energies (or moves) and
directs (or) channels behaviors towards goals”.
___Motivation is the inner state that causes an individual to behave in a way that ensures
the accomplishment of some goal.


__According to viteles “Motivation represents an unsatisfied need which creates a state
of tension or disequilibrium, causing the individual to move in a goal directed pattern
towards restoring a state of equilibrium, by satisfying the need”.


TYPES OF NEEDS:

 There are three types of needs.

      Primary Motives

      General Motives

      Secondary Motives


                                                                                            13
1.Primary Motives:
 The use of the term primary does not imply that this group of motives always takes
precedence the general and secondary motives. Although the precedence of primary
motives is implied in some motivation theories there are many situations in which the
general and secondary predominate over primary motives.


 Examples are fasting for a religious social or political cause. In both cases learned
secondary motives are stronger than unlearned primary motives.


2.General Motives:


  A separate classification for general motives is not always given. Yet such a category
seems necessary because there are a number of motives which lie in the gray area
between the primary and secondary classifications. To be included in the general
category, a motive must be unlearned but not physiologically based.


3.Secondary motives:


Secondary motives are most important. The motives of hunger and thirst are not
dominant Amount people living – in the economically developed world. Some examples
of secondary motives are power, achievement and status. Every person in a responsible
position in business, education and act may exhibit a need for power.

MOTIVATION AND MORALE:

 Motivation and morale in industry are often used interchangeably; though they are
referred as two different kinds of phenomena. Motivation refers to the propensity toward
a particular behavioral pattern to satisfy a need or deficiency. Morale describes an
employee‟s attitudes, feelings and judgment about his work, peers, supervisors,
subordinates and his organization. A highly motivated employee may not have high
morale, through motivation to some degree provides potential for morale.


                                                                                     14
THEORIES OF MOTIVATION:

 The importance of motivation to human life and work can be judged by the number of
theories that have been propounded to explain people‟s behavior. They explain human
motivation through human needs and human nature. Prominent among these Theories and
particularly relevant to us are Maslows Need Hierarchy Theory, McGregor‟s Theory „x‟
and „y‟ and Hertzberg, Motivation Hygiene Theory.


We shall discuss three important theories in detail as follows;
1. Maslows Need Hierarchy Theory
2. McGregor Theory „x‟ and „y‟ and
3. Hertzberg Two Factor Theory


1.MASLOW NEED HIERARCHY THEORY:


 Maslow theory is significant because it encompasses all human needs and classifies
them into five neat all-inclusive categories. There are give need-clusters.


(a)Physiological Needs:
 Physiological needs are basic to life viz.., thirst, and companionship among others. They
are relatively independent of each other and in some areas can be identified with a
specific location in the body. These needs are cyclic. In other words they are satisfied for
a short period: then they reappear.
 Every human being wants to fulfill their basic needs that are survival needs like food,
water and shelter and sex. once these basic needs are satisfied to the degree needed for
the sufficient and comfortable operation of the body, then the other levels of needs
become important and start acting as motivators.

(b)Safety and Security needs:
      Safety needs also called security needs, find expression in such series as
economies security and protection from physical dangers and a desire for an orderly and
predictable world. Like physiological needs, these become in active once they are
satisfied.


                                                                                         15
These the physiological needs are gratified, the safety and security needs become
predominant. These are the needs for self-preservation as against physiological needs
which are for survival; these needs include those of security, stability, freedom from
anxiety and a structured and ordered environment.

(c)Love and Social needs:
  These needs include the desire for love companionship and friendship these needs
reflect persons desire to be accepted by others.
Social needs refer to belongingness. All individuals want to associate with others to gain
acceptance and to give and receive friendship from them. People do not work for money
alone but also for companionship. Cohesive informal groups indicate that employees
have found an outlet for their social needs.

(d)Esteem needs:
  Esteem needs refer to a desire for firmly-based high evaluation from others for self
respect and self esteem. They include those needs which indicate self confidence,
achievement, competence, knowledge and independence.
 The need for esteem is to attain recognition from others which would induce a feeling of
self-worth and self-confidence in the individual. It is an urge for achievement, prestige,
status and power, self-respect is the internal recognition. The respect from others is the
external recognition.


(e)Self –Actualization needs:
 Self Actualization needs refer to self-fulfillment. The term “Self-Actualization” was
coined by a Kurt Goldstein and means to become actualized in what one is potentially
good at.
The last need is the need to develop fully and to realize ones capacities and potentialities
to the fullest extent possible, whatever these capacities and potentialities may be. This is
the highest level of need in maslow‟s hierarchy and is activated as a motivator when all
other assignments that allow for creativity and opportunities for personal growth and
Advancement.


                                                                                         16
2. THEORY X AND THEORY Y:

  Douglas McGregor proposed two distinct views of human beings. One basically
Negative, labeled theory x and other basically positive, labeled theory y.


Under theory x, the four negative assumptions held by managers are:
1. Employees inherently dislike work and whenever possible will attempt to avoid it.
2. Since employees dislike work, they must be coerced, controlled, or threatened with
punishments to achieve goals.
3. Employees will avoid responsibilities and seek formal direction whenever possible.
4. Most workers place security about all other factors associated with work and will
  display little ambition.

 In contrast to these negative views about the nature of human beings, McGregor Listed
the four positive assumptions that he called theory Y.:
1. Employees can view work as being as natural as rest or play.
2. People will exercise self-direction and self-control if they are committed to the
objectives.
3. The average person can learn to accept even seek responsibility.
4. The ability to make innovative decisions is widely dispersed throughout the Population
and is not the sole province of those in management positions.


3. HERZBERG TWO FACTOR THEORY:

  According to Hertzberg, man has two different: categories of needs, which are
essentially independent of each other and affect behavior in different ways. When people
feel happy about their job, there an extra-in job, and also it increase the job satisfaction.


 Fredrick Hertzberg two factor theories concludes that certain factors in the work place
result in job satisfaction, while others do not, but if absent lead to dissatisfaction.


                                                                                            17
He distinguished between:

Hygiene Factors:

     Wages
     Salary
     Company policies
     Interpersonal Relation with Peers
     Job Security
     Supervisors Technical

     Hygiene factors present dissatisfaction in the organization. According to him,
    hygiene factors are very necessary to maintain the human resources of an
    organization.


    Motivational Factors:


         Job itself
         Recognition
         Achievement
         Responsibility
         Growth and Advancement


        These factors are interrelated and are positively related to motivation. According
     To Hertzberg job promotions, higher responsibilities, participation in central
     decision making are all signals of growth and advancement of employee in the
     organization.


                                                                                       18
3. OBJECTIVES OF THE STUDY

 To identify the different ways in the organization to motivate the employees.
 To find out the factors that affect the employee‟s motivation provided by an
   organization.
 To know how motivation creates job satisfaction among the Employees.
 To identify the significance of motivation that has an impact on productivity.
 To identify the factors which bring high level of satisfaction.


                                                                                   19
4.RESEARCH METHODOLOGY


   Research methodology is way to systematically solve the research problem. It is a plan
of action for a research project and explains in detail how data are collected and analyzed.
Research Methodology may be understood as a science of studying how research is done
scientifically. It can cover a wide range of studies from simple description and
investigation to the construction of sophisticated experiment.


   A clear objective provides the basis of design of the project. Since the main objective
of this study is to identify the customers preference, expectation and perception. It was
decided to use descriptive research design include, surveys and fact-findings enquires of
different kinds, which found out to be the most suitable design in order to carry out the
project.


MEANING OF RESEARCH:
   Research is an art of scientific investigation. The advanced learner‟s dictionaries of current
English lay are down the meaning of research as, “a careful investigation (or) inquiry especially
through search for new facts in any branch of knowledge”. Redmen and Mary define research
as a “systematic effort to gain knowledge”.


RESEARCH DESIGN :
   A Research design is plan that specifies the objectives of the study, method to be
adopted in the collection of the data, tools in analysis of data and helpful to frame
hypothesis. “A research design is the arrangement of condition for collection and analysis
of data in a manner that aims to combine relevance to research purpose with economy in
procedure”.
   Research design is needed because it facilitates the smooth sailing of the various
project operations, thereby making the project as efficient as possible yielding maximal
information with minimal expenditure of effort time and money. Also it minimizes bias
and maximizes the reliability of the data collected.


                                                                                        20
NATURE AND SOURCE OF DATA :
Primary data:
The data which are collected afresh for the first time and thus happen to be original in character
is called primary data.
   The primary data was collected from the employees of AFT Limited through a direct
structured questionnaire. Respondent has filled the questionnaire.


Secondary data:
The data which have already been collected and analyzed by someone else is called secondary
data.
The secondary data was used mainly to support primary data. Company profiles, websites,
magazines, articles were used widely.


SAMPLING SIZE AND TECHNIQUE:
Type of universe:
The first step in developing any sample is clearly defining the set of objectives,
technically called the universe, to be studied. Here the universe is the employees of AFT
Limited
Size of sample:
It refers to the number if items to be selected from the universe to constitute a sample. Here 100
employees of AFT Limited in Pondicherry were selected as size of sample.


Sample design:
When population elements are selected for inclusion in the sample based on the case of
access, it is called convenience sampling method for the convenience of the researcher.


Questionnaire construction:
In constructing questionnaire, care was taken to investigate the difficulties that the
respondent may face while answering them. It was prepared keeping in view the objective
of the study. During the constructing care was taken to avoid questions, which may lead


                                                                                          21
misinterpretation. The question thus constructed was a structured one so as to collect al the
relevant information. The questions were arranged in a logical order/sensible sequence.
The Questionnaire consists of a variety of questions presented to the employees for their
response. Dichotomous questions and multiple choice questions were used in constructing
the questionnaire.


STATISTICAL TOOLS USED:
To arrange and interpret the collected data the following statistical tools were used.
        1. Percentage Method.
        2. Chi – square Analysis.


Percentage Method:
        The percentage method was extensively used for findings various details. It is
used for making comparison between two or more series of data. It can be generally
calculated.


                     Percentage of employees is given by
                     (Number of employees favorable/total employees) × 100


Chi – Square Analysis:
        Chi –square analysis in statistics to test the goodness of fit to verify the
distribution of observed data with assumed theoretical distribution. Therefore, it is a
measure to study the divergence of actual and expected frequencies. It makes no
assumptions about the population being sampled. The quantity χ2 (chi- square) describes
the magnitude of discrepancy between theory and observation. If χ2 is zero, it means that
the observed and expected frequency completely coincides. The greater the value of χ2,
the greater would be the discrepancy between observed and expected frequencies.


          The formula for computing Chi – Square (χ2) is as follows
χ2 = ε{(O-E)^2 /E}


                                                                                          22
The calculated value of χ2 is compared with the table of χ2 for given degrees of freedom at
specified level of significance. If the calculated value of χ2 is greater than the table value then
the difference between theory and observation is considered to be significant. On the other
hand, if the calculated value of χ2 les than the table value then the difference between theory
and observation is not considered to be significant. The degrees of freedom is (n – 1) where „n‟
is number of observed frequencies.


                                                                                          23
5. DATA ANALYSIS AND INTERPRETATIONS
                             Percentage Method
Table 1: Motivation to Employees:

Particulars                  No of Respondents            Percentage


            Yes                     75                         75


            No                      25                         25


Total                        100                               100


INFERENCES:

  From the above table shows that 75% of respondents say that the company provides
motivation to the employees, only 25%of respondents say no that the company did not
provide motivation to employees.
Chart 1:


    80            75
    70
    60
    50
    40                                                               Motivation to
                                                                     Employees
    30                     25
    20
    10
        0
                  Yes     No


                                                                                     24
Table 2:Satisfied with Motivation:


Particulars                   No of Respondents                   Percentage


    Yes                            68                              68


    No                             32                              32


Total                             100                             100


INFERENCES:

  From the above table shows that 68% of the respondents are satisfied with the
motivation that the company provides, only 32% of respondents are not satisfied with the
motivation


Chart 2:

             68
  70
  60
  50
  40
                   32                            Satisfied with
  30                                             the Motivation

  20
  10
    0
           Yes     No


                                                                                     25
Table 3: Interest towards Job for employees:


 Particulars                     No of Respondents          Percentage


  Yes                                 56                       56


  No                                  44                       44


 Total                              100                       100


         INFERENCES:
         From the above table show that 56% of respondents says that motivation creates
Interest towards a job for employees & 44% of respondents says no that theMotivation
does not create interest towards a job.


         Chart 3:

            60       56

            50
                                 44
            40

            30                                                        Motivation Creates
                                                                      Interest towards job
            20

            10

             0
                    Yes          No


                                                                                    26
Table 4: Motivated employee increase productivity:

    Particulars                       No of Respondents      Percentage


 To Large Extent                        54                      54


                                        24                      24
  To Some Extent

                                        22                      22
  Not at All

   Total                      100                            100


INFERENCES:

 From the above table shows that 54% of respondents say that motivated employee will
increase the productivity level to large extent & 24% of respondents say it to some extent
& 22% says that not at all the motivated employee will increase the Productivity level.


Chart 4:


                                                                                          27
60    54
50
40
30            24      22
20                            Highly
                              Motivated
10                            employee…
 0
       To     To     Not at
     Large   some     All
     Extend Extend


                                          28
Table 5: Recognition for Performance:

     Particulars                No of Respondents       Percentage


        Yes                            54                    54


         No                            46                    46


Total                                  100                   100


INFERENCE:

 From the above table shows that 54% of respondents say that organization provide
Recognition for performance & 46% of respondents says no that organization does not
provide recognition for performance.


Chart 5:


    54

    52

    50

    48                                                             Recognition for your
                                                                   performance
    46

    44

    42
              Yes          No


                                                                                29
Table 6: Continuous feedback for Performance:

  Particulars                 No of Respondents            Percentage


To Large Extent                    36                            36


To Some Extent                     34                            34


 Not at All                        30                            30


 Total                            100                     100


INFERENCES:

 From the above table shows that 36% of respondents says that manager gives
Continuous feedback about the performance to large extent, 34% of respondents Says to
some extent, 30% of respondents says not at all.

Chart 6:


         36
         35
         34
         33
         32
         31                                                                   Feedback about your
         30                                                                   Performance
         29
         28
         27
                To Large     To Some       Not at All
                 Extend       Extend


                                                                                  30
Table 7: Employees to Measure Performance:


Particulars                 No of Respondents            Percentage


 Yes                             55                        55


  No                             45                        45


Total                            100                     100


INFERENCES:

From the above table shows that 55% of respondents says yes that the company Teach
employees to measure their own performance & 45% of respondents says no that the
company does not teach employees to measure their own performance.


Chart 7:


                                                                               31
60         55

   50                     45

   40

   30                                                    Employee to measure
                                                         own performance
   20

   10

     0
              Yes        No


Table 8: Facilities to Employees:

Particulars                    No of Respondents   Percentage


                                                                      32
Insurance                           43                          43


 Medical                             25                          25


 Transport                           __                          __


 Canteen                             32                       32


 Total                               100                   100


INFERENCES:

From the above table shows that organization provides facilities to employees that 43%
of respondents say Insurance, 25% of respondents says medical &32% of respondents
says canteen & there is no transport for the employees.


Chart 8:


      45         43
      40
      35                                                    32
      30                        25
      25
                                                                              Facilities to the
      20                                                                      Employees
      15
      10
       5                                        0
       0
             Insurance       Medical       Transport      Canteen


                                                                                   33
Table 9: Medical and Insurance facility is motivated:


Particulars                No of Respondents            Percentage


  Yes                            65                       65


  No                             35                       35


 Total                     100                            100


INFERENCES:


                                                                     34
From the above table shows that 65% of respondents says yes that medical facility &
Insurance provided by company is highly motivate & 35% of respondents says no that it
is not motivate for them.

Chart 9:


    70         65

    60

    50

    40                      35
                                                                      Medical & Insurance
    30

    20

    10

     0
               Yes          No


Table 10: Satisfied with the basic needs:

Particulars                  No of Respondents             Percentage


Highly Satisfied                    34                        34


Satisfied                           26                        26


No opinion                          18                        18


Dissatisfied                        12                        12


Highly Dissatisfied                 10                        10


                                                                                  35
Total                         100                            100


INFERENCES:

 From the above table shows that 34% of respondents are highly satisfied with basic
needs, 26% of respondents are satisfied, 18% of respondents says no opinion, 12% of
Respondents are dissatisfied, 10% of respondents are highly dissatisfied with basic needs.


Chart 10:

        35
        30
        25
        20
        15                                                                               Basic Needs

        10
        5
        0
         Highly Satisfied            No opinion            Highly Dissatisfied


                                                                                       36
Table 11: Monetary Reward to Employees:


Particulars                No of Respondents    Percentage


   Yes                          32               32


    No                          68               68


Total                     100                  100


INFERENCES:


                                                             37
From the above table shoes that 32% of respondents says yes that company gives
monetary reward to employees, 68% of respondents says no that company does not give
monetary reward to employees.

Chart 11:


                         68
    70

    60

    50

    40
               32                                               Monetary reward to the
    30                                                          Employees

    20

    10

        0
            Yes         No


Table 12: Organisation provides Monetary Reward:

  Particulars                 No of Respondents         Percentage


 Gifts                          56                        56


 Cash Awards                    25                        25


  Allowances                    19                        19


Total                         100                       100


                                                                                38
INFERENCES:

  From the above table shows that monetary reward the organization provides for the
Employees is 56% of respondents say gifts, 25% of respondents say cash awards, and
19% of respondents say allowances.


Chart 12:


         60       56

         50

         40

         30                   25
                                         19                               Monetary Reward
         20

         10

            0
                 Gifts      Cash Allowances
                           Awards


                                                                                39
Table 13: Activities motivates employees:


 Particulars                 No of Respondents   Percentage


Monetary Reward                15                  15


Job Promotion                  30                  30


Job Security                   55                  55


Transfer                       __                  __


Total                       100                  100


                                                              40
INFERENCES:

 From the above table shows that the activities which motivates them is 15% of
Respondents says monetary reward,30% of respondents says Job promotion &55% of
respondents says Job security & the company does not provide transfer For them.

Chart 13:


       60

       50

       40

       30
                                                                                  Activities Motivates
       20

       10

         0
              Monetary  Job    Job Security Transfer
              Reward Promotion


                                                                                    41
Table 14: Employee as part of Team:


Particulars                     No of Respondents         Percentage


 Yes                              54                       54


 No                               46                       46


Total                           100                       100


INFERENCES:

From the above table shows that 54% of respondents say yes that the company makes the
employee as part of team & 46% of respondents says no that the company does not make
the employee as part of team.

Chart 14:


                                                                                  42
54
   54

   52

   50

   48                                         Employee as a part of
                        46                    Team
   46

   44

   42
            Yes        No


Table 15: Career Development for Employees:


                                                           43
Particulars                    No of Respondents          Percentage


 Yes                             45                         45


 No                              55                         55


Total                          100                        100


INFERENCES:

 From the above table shows that 45% of respondents says yes organization gives
Importance to career development for employees & 55% of respondents says no that The
organization does not gives importance to career development for employees.


Chart 15:


    60                    55

    50        45

    40

    30
                                                                     Career Development

    20

    10

       0
              Yes         No

Table 16:Training Programmed to improve Productivity:


                                                                                 44
Particulars                 No of Respondents           Percentage


To Large Extent                     54                         54


To Some Extent                      32                         32


 Not at All                         14                         14


 Total                              100                 100


INFERENCES:

 From the above table shows that 54% of respondents say organization gives Training
programmed to improve productivity to large extent, 32% of respondents Says to some
extent & 14% of respondents says not at all.

Chart 16:


         60       54
         50

         40
                               32
         30
                                                                        Training Programmed to
         20                                                             improve Productivity
                                               14
         10

          0
              To Large     To Some        Not at All
               Extend       Extend


                                                                                45
Table 17:Encourage employee to work:

  Particulars             No of Respondents    Percentage


To Large Extent               55                    55


To Some Extent                33                    33


 Not at All                   12                    12


 Total                       100              100


                                                            46
INFERENCES:

From the above table shows that 55% of respondents say that manager encourage
Employee to work independently to large extent, 33% of respondents say to some Extent
& 12% of respondents say not at all.

Chart 17:


         60        55
         50

         40                       33
         30
                                                                                 Manager Encourage
         20                                                                      Employees
                                              12
         10

            0
                To Large      To Some     Not at All
                 Extend        Extend


                                                                                  47
Table 18:Organization collect employee opinion:


     Particulars               No of Respondents               Percentage


  Suggestion Box                    56                           56


  Weekly Meetings                   25                           25


  Monthly Meetings                  19                           19


      Total                 100                                 100


INFERENCES:

From the above table shows that organization collects the employee opinion through
56% of respondents says suggestion box, 25% of respondents says Weekly meetings &
19% of respondents says monthly meetings.


Chart 18:


                                                                               48
60      56

        50
        40
        30                  25
                                        19                           Organisation collect employee
        20                                                           opinion
        10
         0
             Suggestion    Weekly    Monthly
                Box       Meetings   Meetings


Table 19: Hygiene factor in Job Satisfaction:


     Particulars                 No of Respondents               Percentage


      Job Security                     27                           27


       Promotion                       23                           23


  Working Conditions                   38                           38


  Pay and Allowances                   12                           12


        Total                         100                          100


INFERENCES:

 From the above that shows that hygiene factor will result in Job satisfaction through
27% of respondents says job security, 23% of respondent‟s saysPromotion, 38% of
respondents says working conditions, 12% of respondents Says pay & allowances.

Chart 19:


                                                                                      49
40
35
30
25
20
15                                                    Job Satisfaction
10
 5
 0
     Job Security Promotion   Working       Pay &
                              Condition   Allowance


                                                            50
Table 20: Job Enrichment provides true motivation:

     Particulars               No of Respondents                Percentage


         Yes                          53                            53


         No                           47                            47


        Total                100                          100


INFERENCES:

From the above table shows that 53% of respondents say yes that job enrichment Provide
true motivation & 47% of respondents say no that job enrichment does not provide true
motivation.


Chart 20:


                53
   53
   52
   51
   50
   49
   48                                                           Job Enrichment
                        47
   47
   46
   45
   44
                Yes     No


                                                                                   51
Table 21: Best performance of employee in year:

     Particulars                No of Respondents              Percentage


        Yes                             25                         25


        No                              75                         75


      Total                   100                        100


INFERENCES:

  From the above table shows that 25% of respondents say yes organization Select best
performance of employee in year & 75% of respondents says no that organization does
not select best performance of employee in year.


Chart 21:


                                                                                  52
80         75
70
60
50
40
                Best Performance
30   25
20
10
0
     Yes   No


                      53
Table 22: Proud to be member of organization:


       Particulars                 No of Respondents              Percentage


           Yes                           83                           83


           No                            17                           17


        Total                  100                          100


INFERENCES:

    From the above table shows that 83% of respondents are proud to be the member of the
organization & 17% of respondents are not proud to be the member of the Organization
.
        Chart 22:

      90         83
      80
      70
      60
      50                                                                    Proud to be the
      40                                                                    member of the
                                                                            Organization
      30
      20                      17

      10
       0
                 Yes          No


                              CHI-SQUARE TEST

                                                                                     54
NULL HYPOTHESIS Ho:

To find out there is significant links between Gender and activities motivated them in the
organization.


ALTERNATIVE HYPOTHESIS H1:

To find out there is a significant links between Gender and activities motivated
employees in the organization.

PARTICULARS          MONETARY               JOB               JOB              TOTAL
                       REWARD           SECURITY         PROMOTION


     MALE                  10                35                  20               65


   FEMALE                   5                20                  10               35


                           15                55                  30              100


      O                         E                       (O-E)2            (O-E)2/E


                                                                                       55
10                       9.75                      0.0625                6.410


      35                      35.75                      0.5625                0.015


      20                       19.5                       0.25                 0.012


       5                       5.25                      0.0625                0.011


      20                      19.25                      0.5625                0.029


      10                       10.5                      0.25                  0.023


TOTAL                                                                         6.5


                           Calculated value of Chi-square = 6.5

Degree of freedom     = (c-1) (r-1)
                      = (3-1) (2-1)
                      =2
The table value of chi-square for four degree of freedom at 5 percent level of significance
is 5.991


Interpretation:


The calculated value of chi-square is much more than the table value. The result, thus,
support the hypothesis and its can be concluded that the significant links between Gender
and the activities which motivated the employees most.


                                                                                        56
6. FINDINGS OF THE STUDY


 In overall employee in Anglo French Textiles Limited 75% of respondents say
   that the company provides motivation to the employees, only 25%of respondents
   says no that the company did not provide motivation to employees.


 68% of the respondents are satisfied with the motivation that the company
   provides; only 32% of respondents are not satisfied with the motivation.


 56% of respondents say that motivation creates interest towards a job for
   employees & 44% of respondents say no that the motivation does not create
   interest towards a job.


 54% of respondents say that motivated employee will increase the productivity
   level to large extent & 24% of respondents say it to some extent & 22% says that
   not at all the motivated employee will increase the Productivity level.


 54% of respondents says that organization provide Recognition for performance
   & 46% of respondents says no that organization does not provide recognition for
   performance.


 36% of respondents say that manager gives Continuous feedback about the
   performance to large extent, 34% of respondents says to some extent, 30% of
   respondents say not at all.


 55% of respondents say yes that the company teach employees to measure their
   own performance & 45% of respondents says no that the company does not teach
   employees to measure their own performance.


                                                                                57
 Organization provides facilities to employees that 43% of respondents say
   Insurance, 25% of respondents says Medical &32% of respondents says Canteen
   & there is no Transport for the employees.


 65% of respondents say yes that Medical Facility &Insurance provided by
   company is highly motivate & 25% of respondents says no that it is not motivate
   for them.


 34% of respondents are highly satisfied with basic needs, 26% of respondents are
   satisfied, 18% of respondents say no opinion, 12% of respondents are dissatisfied,
   and 10% of respondents are highly dissatisfied with basic needs.


 32% of respondents say yes that company gives monetary reward to employees,
   68% of respondents says no that company does not gives monetary reward to
   employees.


 Monetary reward the organization provides for the employees are 56% of
   respondents says Gifts, 25% of respondents say Cash Awards, 19% of
   respondents say Allowances.


 The activity which motivates them is 15% of respondents says Monetary Reward,
   30% of respondents say Job Promotion &55% of respondents says Job Security &
   the company does not provide Transfer for them.


 54% of respondents say yes that the company makes the employee as part of team
   & 46% of respondents say no that the company does not make the employee as
   part of team.


 45% of respondents says yes organization gives importance to Career
   development for employees & 55% of respondents says no that the organization
   does not gives importance to Career development for employees.


                                                                                  58
 54% of respondents say organization gives Training programmed to improve
   productivity to large extent, 32% of respondents Says to some extent & 14% of
   respondents says not at all.


 55% of respondents say that manager encourages employee to work
   independently to large extent, 33% of respondents say to some extent & 12% of
   respondents say not at all.


 Organization collects the employee opinion through 56% of respondents says
   Suggestion Box,25% of respondents says Weekly Meetings & 19% of
   respondents says Monthly Meetings.


 Hygiene factor will result in Job Satisfaction through 27% of respondents says
   Job Security,23% of respondents says Promotion,38% of respondents says
   Working Conditions,12% of respondents Says Pay & Allowances.


 53% of respondents say yes that Job Enrichment provide true motivation & 47%
   of respondents say no that Job Enrichment does not provide true motivation.


 25% of respondents says yes organization select best performance of employee in
   year & 75% of respondents says no that organization does not select best
   performance of employee in year.


 83% of respondents are proud to be the member of the organization & 17% of
   respondents are not proud to be the member of the organization.


                                                                                 59
7. SUGGESTIONS AND RECOMMENDATIONS

 The company can provide transport facility to the employees. The management
   can invest certain amount in transport and fulfill employee needs. It improves
   productivity and on time on duty in the concern.


 In AFT Limited the management can provide transfer for the employees in which
   they can go to some other places and work for a certain period.


 In AFT Limited, the organization is not giving more importance to the career
   development for the employees, so it basically affects the employee‟s future. In
   that case the company should concentrates on career development for the
   Employees.


 The organization can select the best performance for every year in which it will
   make the employee to perform well during the training period and during the
   work time.


 The organization can give training programmed in systematic programmed for the
   employees to improve the productivity level in the concern.


 In the company the manager can give feedback for the employee‟s regarding their
   performance in which the employees can correct their mistake and they can
   perform well during the work time.


 In the organization the manager can encourage the employees to work
   independently in which they can do their job well, and it will be motivating
   aspects for them.


                                                                                60
7.1 CONCLUSION


                 61
The study conducted at Anglo French Textiles Limited deals with the “Employee
Motivation ”. In this present situation, every organization should provide motivation to
the employees. Employee motivation will help to increase performance standard of an
employee as well as concern. In the duration of the project I have a lot of experience.


There are various factors that influence motivational factors such as salary, working
conditions, training and job satisfaction. Motivation is the ultimate function of so many
individuals attitudes together. It is very complex, complicated and personal experience. It
is difficult to determine the relative importance of the factors influencing motivation as
the importance varies with time and individuals. The motivation is the continuous process
of the organization have come to conclusion that the employee motivation plays a
significant role in modern organization


           8.LIMITATIONS AND SCOPE OF THE STUDY

                                                                                          62
8.1 LIMITATIONS:
      Some employees were having little difficulty in expressing the views even
         though the answer to the questions.
      Time period of this study is also very short.
      As the workers are not literate enough, it was difficult to get the responses
         from them.
      Employees of the company are not aware of whatis motivation means.
      Most of the employees didn‟t come forward to give opinion about the
         management so only it didn‟t provide me to derive a concrete solution.
      The study was limited only to one company i.e. AFT.
      The study is based on only 100 samples.
      The study only based on employs side. It is not covering the staffs.


 8.2SCOPE:

   The present study aims to find out the level of workers motivation.
   The study explores the views expressed by the Respondents about the motivation
     and providing solutions in an attempt to develop a better system.
   The study is conducted taking into consideration only the workers of Anglo
     French Textiles Limited.
   The importance of studying employee motivation isto understand the internal
     satisfaction in the minds of every employee.
   The study helps to know some employees satisfaction level and some employee‟s
     dissatisfaction level.
   The findings of this study help the company to implement the expectations from
     the employees.
   This   study helps the company to know whether the motivation undertaken is

     strongly accepted and also to know the lacking in the employee motivation.


                                                                                  63
9. ANNEXURE


9.1 QUESTIONARIES


                    64
A STUDY ON EMPLOYEE MOTIVATION SCENARIO IN
                ANGLO FRENCH TEXTILES LIMITED


GENERAL INFORMATIONS:


NAME:


AGE:


GENDER:


MARITAL STATUS:


QUALIFICATION:


1. Below SSLC     2.Higher Secondary 3.Diploma         4.Degree Holder


EXPERIENCE:


1.5-10 Years      2.10-15 Years       3.15-20 Years   4.20-25 Years


SALARY:


1. Below 5000     2.5000- 10000      3.10000-15000      4.15000 & above


1. Does the company provide any motivation to the employees?


(a) Yes (b)No


                                                                          65
2. Are you satisfied with the motivation that the company provides?


(a)Yes      (b) No

3. Does the motivation create any interest towards a job for employees?

(a)Yes      (b) No

4. Do you think that a highly motivated employee will increase the productivity level?


(a)To Large Extent (b)To Some Extent (c)Not at All


5.Does the organisation provide recognition for your employees?


(a) Yes   (b)No


6. Does the manager give continuous feedback about your performance?


(a)Yes    (b) No


7. Does the company teach the employees how to measure their own performance?


(a)Yes    (b) No

8. Does the organization provide the following facilities to the employees?


(a)Insurance       (b) Medical     (c) Transport     (d) Canteen


9. Does the medical facility and the insurance provided by the company is highly
motivate to you.?


(a)Yes    (b) No


                                                                                         66
10. Are you satisfied with the basic needs?


(a)Highly Satisfied    (b) Satisfied   (c) No opinion    (d) Dissatisfied          (e) Highly
Dissatisfied


11. Does the company give monetary reward to the employees?


 (a)Yes      (b) No

12. What type of monetary reward does the organization provides for the employees?.


 (a) Gifts                    (b) Cash Awards                    (c) Allowances


13. Which activities motivate you the most?


 (a)Monetary Reward      (b) Job promotion    (c) Job security      (d) Transfer


14. Does the company make the employee as part of team?


 (a)Yes      (b) No
15. Do you think that the organization gives importance to the career development for
employees?


  (a)Yes     (b) No


16. Does the organization give training programmed in systematic manner to improve
productivity?
 (a) To Large Extent         (b) To Some Extent          (c) Not at All


17. Does the manager encourage employees to do your work independently?


                                                                                          67
(a) To Large Extent         (b) To Some Extent           (c) Not at All


18. In which way does the organization collect the employee’s opinion?


 (a) Suggestion Box       (b) Weekly Meetings      (c) Monthly Meetings


19. Which of the following hygiene factor will result in job satisfaction?


 (a)Job security (b) Promotion (c) Pay and Allowances (d) Working Conditions


20. Does the job enrichment provide true motivation?


 (a) Yes    (b) No

21. Whether the organization select the best performance of employee in the year?


 (a)Yes     (b) No


22. Are you proud to be the member of the organization?


 (a)Yes     (b) No


                                  9.2 BIBLIOGRAPHY

1. Stephen P. Robbins & Seema Sanghi (2005) ORGANISATIONAL BEHAVIOUR,
Dorling Kindersley (Indian) Pvt Ltd., New Delhi.

2. Bhagoliwal, T.N. (1992) PERSONNEL MANAGEMENT AND INDUSTRIAL
RELATIONS, Sathitya bawan, Agra.


                                                                                    68
3. HUMAN RESOURCE MANAGEMENT (2003), ICFAI center for management
Research, Hyderabad.

4. Kothari, C.R.Research Methodology-Methods and Techniques.


                                                               69
70

More Related Content

Viewers also liked

Oppo N1 review in pictures
Oppo N1 review in picturesOppo N1 review in pictures
Oppo N1 review in pictures
91mobiles
 

Viewers also liked (7)

Maher prj
Maher prjMaher prj
Maher prj
 
Maher prj
Maher prjMaher prj
Maher prj
 
Brms road map_10-17-12
Brms road map_10-17-12Brms road map_10-17-12
Brms road map_10-17-12
 
Oppo N1 review in pictures
Oppo N1 review in picturesOppo N1 review in pictures
Oppo N1 review in pictures
 
Leadership in Public Administration
Leadership in Public Administration Leadership in Public Administration
Leadership in Public Administration
 
Succession “Losers”: What Happens to Executives Passed Over for the CEO Job?
Succession “Losers”: What Happens to Executives Passed Over for the CEO Job? Succession “Losers”: What Happens to Executives Passed Over for the CEO Job?
Succession “Losers”: What Happens to Executives Passed Over for the CEO Job?
 
How to Become a Thought Leader in Your Niche
How to Become a Thought Leader in Your NicheHow to Become a Thought Leader in Your Niche
How to Become a Thought Leader in Your Niche
 

Similar to Motivation

project report on working capital
project report on working capitalproject report on working capital
project report on working capital
sanjay3017
 
Sintex financial
Sintex financialSintex financial
Sintex financial
charvitiku
 
project report on welspun textile LALIT MORYANI ,POSWAL JITENDRA
 project report on welspun textile LALIT MORYANI ,POSWAL JITENDRA project report on welspun textile LALIT MORYANI ,POSWAL JITENDRA
project report on welspun textile LALIT MORYANI ,POSWAL JITENDRA
poswal_jitendra
 
11 syb impact assessment 2007 aceh
11 syb impact assessment 2007 aceh11 syb impact assessment 2007 aceh
11 syb impact assessment 2007 aceh
imecommunity
 
Summer internship project
Summer internship projectSummer internship project
Summer internship project
Sunil Yadav
 
Human resource Training & development
Human resource Training & developmentHuman resource Training & development
Human resource Training & development
Arun Kumar
 
Employee perception towards .docx (1)
Employee perception towards .docx (1)Employee perception towards .docx (1)
Employee perception towards .docx (1)
Ravi Dwivedy
 
Tusuka Group Ltd.
Tusuka Group Ltd.Tusuka Group Ltd.
Tusuka Group Ltd.
MD. SAIDUR RAHMAN SAID
 
Impact of training and development programs conducted in organizations. kezia...
Impact of training and development programs conducted in organizations. kezia...Impact of training and development programs conducted in organizations. kezia...
Impact of training and development programs conducted in organizations. kezia...
Sanen Walling
 

Similar to Motivation (20)

Attachments 2011 09_27
Attachments 2011 09_27Attachments 2011 09_27
Attachments 2011 09_27
 
project report on working capital
project report on working capitalproject report on working capital
project report on working capital
 
Sintex financial
Sintex financialSintex financial
Sintex financial
 
project report on welspun textile LALIT MORYANI ,POSWAL JITENDRA
 project report on welspun textile LALIT MORYANI ,POSWAL JITENDRA project report on welspun textile LALIT MORYANI ,POSWAL JITENDRA
project report on welspun textile LALIT MORYANI ,POSWAL JITENDRA
 
11 syb impact assessment 2007 aceh
11 syb impact assessment 2007 aceh11 syb impact assessment 2007 aceh
11 syb impact assessment 2007 aceh
 
Summer internship project
Summer internship projectSummer internship project
Summer internship project
 
Summer internship project
Summer internship projectSummer internship project
Summer internship project
 
Human resource Training & development
Human resource Training & developmentHuman resource Training & development
Human resource Training & development
 
Paper bag business proposal eco friendly
Paper bag  business proposal eco friendlyPaper bag  business proposal eco friendly
Paper bag business proposal eco friendly
 
Employee perception towards .docx (1)
Employee perception towards .docx (1)Employee perception towards .docx (1)
Employee perception towards .docx (1)
 
Company Analysis Of Blue Star
Company Analysis Of Blue StarCompany Analysis Of Blue Star
Company Analysis Of Blue Star
 
2022-mba-mba-batchno-Towards Online Shopping217.docx
2022-mba-mba-batchno-Towards Online Shopping217.docx2022-mba-mba-batchno-Towards Online Shopping217.docx
2022-mba-mba-batchno-Towards Online Shopping217.docx
 
Tusuka Group Ltd.
Tusuka Group Ltd.Tusuka Group Ltd.
Tusuka Group Ltd.
 
HR INITIATIVES AT SMC INSURANCE BROKERS PVT.
HR INITIATIVES AT SMC INSURANCE BROKERS PVT. HR INITIATIVES AT SMC INSURANCE BROKERS PVT.
HR INITIATIVES AT SMC INSURANCE BROKERS PVT.
 
IDBI Federal Life Insurance
IDBI Federal Life InsuranceIDBI Federal Life Insurance
IDBI Federal Life Insurance
 
Kotak life insurance project
Kotak life insurance projectKotak life insurance project
Kotak life insurance project
 
Stress Management of Employees at Shree Ram Krishna Exports Pvt. ltd.
Stress Management of Employees at Shree Ram Krishna Exports Pvt. ltd. Stress Management of Employees at Shree Ram Krishna Exports Pvt. ltd.
Stress Management of Employees at Shree Ram Krishna Exports Pvt. ltd.
 
Impact of training and development programs conducted in organizations. kezia...
Impact of training and development programs conducted in organizations. kezia...Impact of training and development programs conducted in organizations. kezia...
Impact of training and development programs conducted in organizations. kezia...
 
Modelama Exports - Apparel Manufacturing Internship Report
Modelama Exports - Apparel Manufacturing Internship ReportModelama Exports - Apparel Manufacturing Internship Report
Modelama Exports - Apparel Manufacturing Internship Report
 
206718637 a-study-on-quality-of-work-life-of-employees
206718637 a-study-on-quality-of-work-life-of-employees206718637 a-study-on-quality-of-work-life-of-employees
206718637 a-study-on-quality-of-work-life-of-employees
 

Recently uploaded

Communicative rationality and the evolution of business ethics: corporate soc...
Communicative rationality and the evolution of business ethics: corporate soc...Communicative rationality and the evolution of business ethics: corporate soc...
Communicative rationality and the evolution of business ethics: corporate soc...
BOHR International Journal of Business Ethics and Corporate Governance
 
NewBase 24 May 2024 Energy News issue - 1727 by Khaled Al Awadi_compresse...
NewBase   24 May  2024  Energy News issue - 1727 by Khaled Al Awadi_compresse...NewBase   24 May  2024  Energy News issue - 1727 by Khaled Al Awadi_compresse...
NewBase 24 May 2024 Energy News issue - 1727 by Khaled Al Awadi_compresse...
Khaled Al Awadi
 

Recently uploaded (20)

April 2024 Nostalgia Products Newsletter
April 2024 Nostalgia Products NewsletterApril 2024 Nostalgia Products Newsletter
April 2024 Nostalgia Products Newsletter
 
Improving profitability for small business
Improving profitability for small businessImproving profitability for small business
Improving profitability for small business
 
IPTV Subscription UK: Your Guide to Choosing the Best Service
IPTV Subscription UK: Your Guide to Choosing the Best ServiceIPTV Subscription UK: Your Guide to Choosing the Best Service
IPTV Subscription UK: Your Guide to Choosing the Best Service
 
Digital Transformation in PLM - WHAT and HOW - for distribution.pdf
Digital Transformation in PLM - WHAT and HOW - for distribution.pdfDigital Transformation in PLM - WHAT and HOW - for distribution.pdf
Digital Transformation in PLM - WHAT and HOW - for distribution.pdf
 
Communicative rationality and the evolution of business ethics: corporate soc...
Communicative rationality and the evolution of business ethics: corporate soc...Communicative rationality and the evolution of business ethics: corporate soc...
Communicative rationality and the evolution of business ethics: corporate soc...
 
Introduction to Amazon company 111111111111
Introduction to Amazon company 111111111111Introduction to Amazon company 111111111111
Introduction to Amazon company 111111111111
 
Pitch Deck Teardown: RAW Dating App's $3M Angel deck
Pitch Deck Teardown: RAW Dating App's $3M Angel deckPitch Deck Teardown: RAW Dating App's $3M Angel deck
Pitch Deck Teardown: RAW Dating App's $3M Angel deck
 
Maximizing Efficiency Migrating AccountEdge Data to QuickBooks.pdf
Maximizing Efficiency Migrating AccountEdge Data to QuickBooks.pdfMaximizing Efficiency Migrating AccountEdge Data to QuickBooks.pdf
Maximizing Efficiency Migrating AccountEdge Data to QuickBooks.pdf
 
RMD24 | Debunking the non-endemic revenue myth Marvin Vacquier Droop | First ...
RMD24 | Debunking the non-endemic revenue myth Marvin Vacquier Droop | First ...RMD24 | Debunking the non-endemic revenue myth Marvin Vacquier Droop | First ...
RMD24 | Debunking the non-endemic revenue myth Marvin Vacquier Droop | First ...
 
Unveiling the Secrets How Does Generative AI Work.pdf
Unveiling the Secrets How Does Generative AI Work.pdfUnveiling the Secrets How Does Generative AI Work.pdf
Unveiling the Secrets How Does Generative AI Work.pdf
 
Equinox Gold Corporate Deck May 24th 2024
Equinox Gold Corporate Deck May 24th 2024Equinox Gold Corporate Deck May 24th 2024
Equinox Gold Corporate Deck May 24th 2024
 
Strategy Analysis and Selecting ( Space Matrix)
Strategy Analysis and Selecting ( Space Matrix)Strategy Analysis and Selecting ( Space Matrix)
Strategy Analysis and Selecting ( Space Matrix)
 
NewBase 24 May 2024 Energy News issue - 1727 by Khaled Al Awadi_compresse...
NewBase   24 May  2024  Energy News issue - 1727 by Khaled Al Awadi_compresse...NewBase   24 May  2024  Energy News issue - 1727 by Khaled Al Awadi_compresse...
NewBase 24 May 2024 Energy News issue - 1727 by Khaled Al Awadi_compresse...
 
5 Things You Need To Know Before Hiring a Videographer
5 Things You Need To Know Before Hiring a Videographer5 Things You Need To Know Before Hiring a Videographer
5 Things You Need To Know Before Hiring a Videographer
 
Team-Spandex-Northern University-CS1035.
Team-Spandex-Northern University-CS1035.Team-Spandex-Northern University-CS1035.
Team-Spandex-Northern University-CS1035.
 
Cracking the Workplace Discipline Code Main.pptx
Cracking the Workplace Discipline Code Main.pptxCracking the Workplace Discipline Code Main.pptx
Cracking the Workplace Discipline Code Main.pptx
 
Lookback Analysis
Lookback AnalysisLookback Analysis
Lookback Analysis
 
12 Conversion Rate Optimization Strategies for Ecommerce Websites.pdf
12 Conversion Rate Optimization Strategies for Ecommerce Websites.pdf12 Conversion Rate Optimization Strategies for Ecommerce Websites.pdf
12 Conversion Rate Optimization Strategies for Ecommerce Websites.pdf
 
Understanding UAE Labour Law: Key Points for Employers and Employees
Understanding UAE Labour Law: Key Points for Employers and EmployeesUnderstanding UAE Labour Law: Key Points for Employers and Employees
Understanding UAE Labour Law: Key Points for Employers and Employees
 
What are the main advantages of using HR recruiter services.pdf
What are the main advantages of using HR recruiter services.pdfWhat are the main advantages of using HR recruiter services.pdf
What are the main advantages of using HR recruiter services.pdf
 

Motivation

  • 1. TABLE OF CONTENTS CHAPTER TITLE PAGE NO ABSTRACT 2 LIST OF TABLE 3 LIST OF CHART 5 INTRODUCTION 1 1.1 Profile of an organization 7 1.2 Need for the Study 12 2 REVIEW OF LITERATURE 13 3 OBJECTIVES OF THE STUDY 19 RESEARCH METHODOLOGY 4 20 DATA ANALYSIS AND INTERPRETATION 5 24 FINDINGS OF THE STUDY 6 59 SUGGESTION & RECOMMENDATION 7 7.1 Conclusion 62 LIMITATIONS AND SCOPE OF THE STUDY 8 65 ANNEXURE 9.1Questionnaire 67 9 9.2Bibliography 71 1
  • 2. ABSTRACT This project is entitled “Employee Motivation” with reference to “Anglo French Textiles Limited”. This company is located at Cuddalore RoadPondicherry. In this company there are 2600 employees including the staff members. For this study, I have choosen 100 as sample size. . This study helps to know the satisfaction level of employees with the motivational factors used by the company. This project had been undertaken by me to find out the needs and wants of the employees. Under this Study a questionnaire which constituted questions relating to the employees expectation. The gathered data had been critically analyzed relating to employee motivations. 2
  • 3. LIST OF TABLE TABLE NO TITLE PAGE NO 1 Motivation to employees 18 2 Satisfied with motivation 19 3 Interest towards job 20 for employees 4 Motivated employee 21 increase productivity 5 Recognition for 22 performance 6 Continuous feedback for 23 performance 7 Employees to measure 24 performance 8 Facilities to employees 25 9 Medical and insurance 26 facility is motivated 10 Satisfied with the basic 27 Needs 11 Monetary reward to 28 employees 3
  • 4. 12 Organisation provides 29 monetary reward 13 Activities motivates 30 Employees 14 Employee as part of team 31 15 Career development for 32 employees 16 Training programmed to 33 improve productivity 17 Encourage employee 34 to work 18 Organisation collects 35 employee opinion 19 Hygiene factor in job 36 satisfaction 20 Job enrichment provides 37 true motivation 21 Best performance of 38 employee in year 22 Proud to be member of 39 organisation . 4
  • 5. LIST OF CHART TABLE NO TITLE PAGE NO 1 Motivation to employees 18 2 Satisfied with motivation 19 3 Interest towards job 20 for employees 4 Motivated employee 21 increase productivity 5 Recognition for 22 performance 6 Continuous feedback for 23 performance 7 Employees to measure 24 performance 8 Facilities to employees 25 9 Medical and insurance 26 facility is motivated 10 Satisfied with the basic 27 needs 11 Monetary reward to 28 employees 5
  • 6. 12 Organisation provides 29 monetary reward 13 Activities motivates 30 employees 14 Employee as part of team 31 15 Career development for 32 employees 16 Training programmed to 33 improve productivity 17 Encourage employee 34 to work 18 Organisation collects 35 employee opinion 19 Hygiene factor in job 36 satisfaction 20 Job enrichment provides 37 true motivation 21 Best performance of 38 employee in year 22 Proud to be member of 39 organisation 6
  • 7. 1. INTRODUCTION 1.1 COMPANY PROFILE This project involves a study on “Employee Motivation” in Anglo French Textiles Limited. The main objective of this study is to know the level of satisfaction of each employee in the company. For this purpose 100samples are collected in relating to various motivational factors used by the company. The analysis includes finding out the needs and expectations from the employees to reinforce the motivational factors that they are already used by the Company. “A Motivation Scenario employed in Anglo French Textiles at Pondicherry”.Motivation is derived from the Word “Motive” means any idea,need, emotion or organic state prompts a man to action.Motive is an internal factor that integrates a behavior.As the motive is within theIndividual,it is necessary to study needs,emotions etc., in order to motivate him to work. Motivation is a process if getting the needs of the people realized with a view to induces them to work for the accomplishment of organization objectives.Indeed,Motivation is nothing but an action of inducement.Motivation is a behavioral concept. It seeks to understand why people behave as they do. HISTORY : The Anglo French Textiles is a unit of Pondicherry Textiles Corporation Limited. It is Government of Pondicherry undertaking and it is one of the largest composite textile mills in Southern India. It was started by Mr.RODIER in the year 1898 and was incorporated in England in the year 1898.It celebrated its centaury in 1998.In the beginning Africa,Australia,Europe 7
  • 8. were the prominent buyers from Anglo French Textile now it shows the main interest in the area of export and nearly local market. The company was managed by different and various agencies of different periods. The mill was expanded with additional machines and export of cloths received great attention unfortunately in 1983 the mill faced financial and labour problems. The management found it very difficult to run this situation gace way to selling of the mill it Shri.JATIA and SOMINA group of Bombay at that time the mill was sacing financial crisis due to mismanagement and some problems. This lead to stoppage of operation in the mills and ultimately the mill stopped its function from 1983 and was closed. Employee continues to work without wages for about six months loping prosperity but vain slowly the employees strength. It was not working for 3 years since 1983. This affected about 7000 families in the union territory of Pondicherry and also the economy of the state was affected the people and trade union. The press and the politicians voice at various forms to reopen the mill and the government of Pondicherry came forward to undertake the mill in the year 1986.At that time the formed Pondicherry textile corporation and from that time onwards their mill become government mill. In the beginning there were 6500 employees in all the units. PRESENT CONTEXT OF AFT: Now, there are 3 units with total employee‟s strength of 4000.The Company has planned to modernize and install new machinery. It plans to produce superfine quality fabric for export. The company has also set up a “quality term” in which key executive member. The main objectives of the “quality term” are to get qualification certificate like ISO 9002 or EN 29000with this dedicated team. The Anglo French Textile managementwould surelyenter 21stcentuary as the pride of Pondicherry.Since its development are manifold and materialistic. 8
  • 9. DEPARTMENT OF AFT: The Various Department of AFT are as follows (A)Production Department: 1. Spinning Department-Blow room, Carding& Spinning 2. Weaving Department-Loom Shed 3. Warehouse Department-Examining, Packing& Baling 4. Processing Department-Bleaching, Printing& Dyeing (B)Service Department: 1. Marketing Department 2. Finance & Accounts Department 3. Purchase & Stores 4. Quality Assurance 5. Engineering 6. Personnel (C) Service Sections: 1. EDP 2. Internal Audit 3. Costing 4. Canteen 5. Dispensary 6. Security 7. Transport & Automobile 8. Horticulture 9. Garment Factory 9
  • 10. (D) Raw Material: 1. Cotton 2. Polyester ABOUT THE PRODUCTS The following products are presently manufactured in Anglo French Textiles Limited.,(PTC)Pondicherry. 1. Cotton Clothes 2. Pant & Shirt Clothes 3. Towels 4. Screen Clothes 5. Uniforms 6. Bed Spread 7. Pillow Covers OBJECTIVES OF THE COMPANY: The main objective of the company can be generally started as the manufacturing and selling of cotton yarn & Cotton fabrics.  To manufacture and market cotton yarns.  To manufacture and market cotton fabrics.  To manufacture garments and uniforms for various agencies and service organization.  To protect the interest of the employees through welfare measures.  To modernize the mills and its systems including computerization. 10
  • 11. FUNCTIONS OF PERSONNEL MANAGEMENT AND HRD DEVELOPMENT:  Recruitment  Training & Development  Wage &Salary Administration  Labor Welfare Measures  Health & Safety Management  Industrial Relation Management  Compliance of Statutory Requirement  Disciplinary Proceedings  Carrier Planning & Development QUALITY POLICY OF AFT: Anglo French Textile is committed to meet the requirements of its customers and continually improve its products services by technological up gradation and enriching the resources with perpetual review of the quality system. SAFETY MEASURES: Anglo French Textiles has a full fledged safety department to monitor the safety in the factory, the company has been a recipient of the state. 11
  • 12. 1.2 NEED FOR THE STUDY The needs for the study are given below such as follows. To study and know the employee motivation scenario in “Anglo French Textiles Limited”. To know the employees satisfied level with the motivation factors undertaken by the company. To identify how the organization motivates the employees. To measure the level of performance before and after motivation to find out the improvement factors for motivating the employees. 12
  • 13. REVIEW OF LITERATURE: MOTIVATION: Some people perform the same type of job more efficiently then others some find it. More rewarding and interesting than others and some enjoy it more than others. At any given point of time people vary in the extent to which they are willing to direct their energies to the attainment of goals due to differences in motivation. DEFINITION: Motivation can be traced to be Latin word” Moves” which means “to move”. The term motivation means to accelerate to boost and to direct the behavior of a person for achieving success. __Bert son and Steiner (1984) state “A motive is inner state tear energies (or moves) and directs (or) channels behaviors towards goals”. ___Motivation is the inner state that causes an individual to behave in a way that ensures the accomplishment of some goal. __According to viteles “Motivation represents an unsatisfied need which creates a state of tension or disequilibrium, causing the individual to move in a goal directed pattern towards restoring a state of equilibrium, by satisfying the need”. TYPES OF NEEDS: There are three types of needs.  Primary Motives  General Motives  Secondary Motives 13
  • 14. 1.Primary Motives: The use of the term primary does not imply that this group of motives always takes precedence the general and secondary motives. Although the precedence of primary motives is implied in some motivation theories there are many situations in which the general and secondary predominate over primary motives. Examples are fasting for a religious social or political cause. In both cases learned secondary motives are stronger than unlearned primary motives. 2.General Motives: A separate classification for general motives is not always given. Yet such a category seems necessary because there are a number of motives which lie in the gray area between the primary and secondary classifications. To be included in the general category, a motive must be unlearned but not physiologically based. 3.Secondary motives: Secondary motives are most important. The motives of hunger and thirst are not dominant Amount people living – in the economically developed world. Some examples of secondary motives are power, achievement and status. Every person in a responsible position in business, education and act may exhibit a need for power. MOTIVATION AND MORALE: Motivation and morale in industry are often used interchangeably; though they are referred as two different kinds of phenomena. Motivation refers to the propensity toward a particular behavioral pattern to satisfy a need or deficiency. Morale describes an employee‟s attitudes, feelings and judgment about his work, peers, supervisors, subordinates and his organization. A highly motivated employee may not have high morale, through motivation to some degree provides potential for morale. 14
  • 15. THEORIES OF MOTIVATION: The importance of motivation to human life and work can be judged by the number of theories that have been propounded to explain people‟s behavior. They explain human motivation through human needs and human nature. Prominent among these Theories and particularly relevant to us are Maslows Need Hierarchy Theory, McGregor‟s Theory „x‟ and „y‟ and Hertzberg, Motivation Hygiene Theory. We shall discuss three important theories in detail as follows; 1. Maslows Need Hierarchy Theory 2. McGregor Theory „x‟ and „y‟ and 3. Hertzberg Two Factor Theory 1.MASLOW NEED HIERARCHY THEORY: Maslow theory is significant because it encompasses all human needs and classifies them into five neat all-inclusive categories. There are give need-clusters. (a)Physiological Needs: Physiological needs are basic to life viz.., thirst, and companionship among others. They are relatively independent of each other and in some areas can be identified with a specific location in the body. These needs are cyclic. In other words they are satisfied for a short period: then they reappear. Every human being wants to fulfill their basic needs that are survival needs like food, water and shelter and sex. once these basic needs are satisfied to the degree needed for the sufficient and comfortable operation of the body, then the other levels of needs become important and start acting as motivators. (b)Safety and Security needs: Safety needs also called security needs, find expression in such series as economies security and protection from physical dangers and a desire for an orderly and predictable world. Like physiological needs, these become in active once they are satisfied. 15
  • 16. These the physiological needs are gratified, the safety and security needs become predominant. These are the needs for self-preservation as against physiological needs which are for survival; these needs include those of security, stability, freedom from anxiety and a structured and ordered environment. (c)Love and Social needs: These needs include the desire for love companionship and friendship these needs reflect persons desire to be accepted by others. Social needs refer to belongingness. All individuals want to associate with others to gain acceptance and to give and receive friendship from them. People do not work for money alone but also for companionship. Cohesive informal groups indicate that employees have found an outlet for their social needs. (d)Esteem needs: Esteem needs refer to a desire for firmly-based high evaluation from others for self respect and self esteem. They include those needs which indicate self confidence, achievement, competence, knowledge and independence. The need for esteem is to attain recognition from others which would induce a feeling of self-worth and self-confidence in the individual. It is an urge for achievement, prestige, status and power, self-respect is the internal recognition. The respect from others is the external recognition. (e)Self –Actualization needs: Self Actualization needs refer to self-fulfillment. The term “Self-Actualization” was coined by a Kurt Goldstein and means to become actualized in what one is potentially good at. The last need is the need to develop fully and to realize ones capacities and potentialities to the fullest extent possible, whatever these capacities and potentialities may be. This is the highest level of need in maslow‟s hierarchy and is activated as a motivator when all other assignments that allow for creativity and opportunities for personal growth and Advancement. 16
  • 17. 2. THEORY X AND THEORY Y: Douglas McGregor proposed two distinct views of human beings. One basically Negative, labeled theory x and other basically positive, labeled theory y. Under theory x, the four negative assumptions held by managers are: 1. Employees inherently dislike work and whenever possible will attempt to avoid it. 2. Since employees dislike work, they must be coerced, controlled, or threatened with punishments to achieve goals. 3. Employees will avoid responsibilities and seek formal direction whenever possible. 4. Most workers place security about all other factors associated with work and will display little ambition. In contrast to these negative views about the nature of human beings, McGregor Listed the four positive assumptions that he called theory Y.: 1. Employees can view work as being as natural as rest or play. 2. People will exercise self-direction and self-control if they are committed to the objectives. 3. The average person can learn to accept even seek responsibility. 4. The ability to make innovative decisions is widely dispersed throughout the Population and is not the sole province of those in management positions. 3. HERZBERG TWO FACTOR THEORY: According to Hertzberg, man has two different: categories of needs, which are essentially independent of each other and affect behavior in different ways. When people feel happy about their job, there an extra-in job, and also it increase the job satisfaction. Fredrick Hertzberg two factor theories concludes that certain factors in the work place result in job satisfaction, while others do not, but if absent lead to dissatisfaction. 17
  • 18. He distinguished between: Hygiene Factors:  Wages  Salary  Company policies  Interpersonal Relation with Peers  Job Security  Supervisors Technical Hygiene factors present dissatisfaction in the organization. According to him, hygiene factors are very necessary to maintain the human resources of an organization. Motivational Factors:  Job itself  Recognition  Achievement  Responsibility  Growth and Advancement These factors are interrelated and are positively related to motivation. According To Hertzberg job promotions, higher responsibilities, participation in central decision making are all signals of growth and advancement of employee in the organization. 18
  • 19. 3. OBJECTIVES OF THE STUDY  To identify the different ways in the organization to motivate the employees.  To find out the factors that affect the employee‟s motivation provided by an organization.  To know how motivation creates job satisfaction among the Employees.  To identify the significance of motivation that has an impact on productivity.  To identify the factors which bring high level of satisfaction. 19
  • 20. 4.RESEARCH METHODOLOGY Research methodology is way to systematically solve the research problem. It is a plan of action for a research project and explains in detail how data are collected and analyzed. Research Methodology may be understood as a science of studying how research is done scientifically. It can cover a wide range of studies from simple description and investigation to the construction of sophisticated experiment. A clear objective provides the basis of design of the project. Since the main objective of this study is to identify the customers preference, expectation and perception. It was decided to use descriptive research design include, surveys and fact-findings enquires of different kinds, which found out to be the most suitable design in order to carry out the project. MEANING OF RESEARCH: Research is an art of scientific investigation. The advanced learner‟s dictionaries of current English lay are down the meaning of research as, “a careful investigation (or) inquiry especially through search for new facts in any branch of knowledge”. Redmen and Mary define research as a “systematic effort to gain knowledge”. RESEARCH DESIGN : A Research design is plan that specifies the objectives of the study, method to be adopted in the collection of the data, tools in analysis of data and helpful to frame hypothesis. “A research design is the arrangement of condition for collection and analysis of data in a manner that aims to combine relevance to research purpose with economy in procedure”. Research design is needed because it facilitates the smooth sailing of the various project operations, thereby making the project as efficient as possible yielding maximal information with minimal expenditure of effort time and money. Also it minimizes bias and maximizes the reliability of the data collected. 20
  • 21. NATURE AND SOURCE OF DATA : Primary data: The data which are collected afresh for the first time and thus happen to be original in character is called primary data. The primary data was collected from the employees of AFT Limited through a direct structured questionnaire. Respondent has filled the questionnaire. Secondary data: The data which have already been collected and analyzed by someone else is called secondary data. The secondary data was used mainly to support primary data. Company profiles, websites, magazines, articles were used widely. SAMPLING SIZE AND TECHNIQUE: Type of universe: The first step in developing any sample is clearly defining the set of objectives, technically called the universe, to be studied. Here the universe is the employees of AFT Limited Size of sample: It refers to the number if items to be selected from the universe to constitute a sample. Here 100 employees of AFT Limited in Pondicherry were selected as size of sample. Sample design: When population elements are selected for inclusion in the sample based on the case of access, it is called convenience sampling method for the convenience of the researcher. Questionnaire construction: In constructing questionnaire, care was taken to investigate the difficulties that the respondent may face while answering them. It was prepared keeping in view the objective of the study. During the constructing care was taken to avoid questions, which may lead 21
  • 22. misinterpretation. The question thus constructed was a structured one so as to collect al the relevant information. The questions were arranged in a logical order/sensible sequence. The Questionnaire consists of a variety of questions presented to the employees for their response. Dichotomous questions and multiple choice questions were used in constructing the questionnaire. STATISTICAL TOOLS USED: To arrange and interpret the collected data the following statistical tools were used. 1. Percentage Method. 2. Chi – square Analysis. Percentage Method: The percentage method was extensively used for findings various details. It is used for making comparison between two or more series of data. It can be generally calculated. Percentage of employees is given by (Number of employees favorable/total employees) × 100 Chi – Square Analysis: Chi –square analysis in statistics to test the goodness of fit to verify the distribution of observed data with assumed theoretical distribution. Therefore, it is a measure to study the divergence of actual and expected frequencies. It makes no assumptions about the population being sampled. The quantity χ2 (chi- square) describes the magnitude of discrepancy between theory and observation. If χ2 is zero, it means that the observed and expected frequency completely coincides. The greater the value of χ2, the greater would be the discrepancy between observed and expected frequencies. The formula for computing Chi – Square (χ2) is as follows χ2 = ε{(O-E)^2 /E} 22
  • 23. The calculated value of χ2 is compared with the table of χ2 for given degrees of freedom at specified level of significance. If the calculated value of χ2 is greater than the table value then the difference between theory and observation is considered to be significant. On the other hand, if the calculated value of χ2 les than the table value then the difference between theory and observation is not considered to be significant. The degrees of freedom is (n – 1) where „n‟ is number of observed frequencies. 23
  • 24. 5. DATA ANALYSIS AND INTERPRETATIONS Percentage Method Table 1: Motivation to Employees: Particulars No of Respondents Percentage Yes 75 75 No 25 25 Total 100 100 INFERENCES: From the above table shows that 75% of respondents say that the company provides motivation to the employees, only 25%of respondents say no that the company did not provide motivation to employees. Chart 1: 80 75 70 60 50 40 Motivation to Employees 30 25 20 10 0 Yes No 24
  • 25. Table 2:Satisfied with Motivation: Particulars No of Respondents Percentage Yes 68 68 No 32 32 Total 100 100 INFERENCES: From the above table shows that 68% of the respondents are satisfied with the motivation that the company provides, only 32% of respondents are not satisfied with the motivation Chart 2: 68 70 60 50 40 32 Satisfied with 30 the Motivation 20 10 0 Yes No 25
  • 26. Table 3: Interest towards Job for employees: Particulars No of Respondents Percentage Yes 56 56 No 44 44 Total 100 100 INFERENCES: From the above table show that 56% of respondents says that motivation creates Interest towards a job for employees & 44% of respondents says no that theMotivation does not create interest towards a job. Chart 3: 60 56 50 44 40 30 Motivation Creates Interest towards job 20 10 0 Yes No 26
  • 27. Table 4: Motivated employee increase productivity: Particulars No of Respondents Percentage To Large Extent 54 54 24 24 To Some Extent 22 22 Not at All Total 100 100 INFERENCES: From the above table shows that 54% of respondents say that motivated employee will increase the productivity level to large extent & 24% of respondents say it to some extent & 22% says that not at all the motivated employee will increase the Productivity level. Chart 4: 27
  • 28. 60 54 50 40 30 24 22 20 Highly Motivated 10 employee… 0 To To Not at Large some All Extend Extend 28
  • 29. Table 5: Recognition for Performance: Particulars No of Respondents Percentage Yes 54 54 No 46 46 Total 100 100 INFERENCE: From the above table shows that 54% of respondents say that organization provide Recognition for performance & 46% of respondents says no that organization does not provide recognition for performance. Chart 5: 54 52 50 48 Recognition for your performance 46 44 42 Yes No 29
  • 30. Table 6: Continuous feedback for Performance: Particulars No of Respondents Percentage To Large Extent 36 36 To Some Extent 34 34 Not at All 30 30 Total 100 100 INFERENCES: From the above table shows that 36% of respondents says that manager gives Continuous feedback about the performance to large extent, 34% of respondents Says to some extent, 30% of respondents says not at all. Chart 6: 36 35 34 33 32 31 Feedback about your 30 Performance 29 28 27 To Large To Some Not at All Extend Extend 30
  • 31. Table 7: Employees to Measure Performance: Particulars No of Respondents Percentage Yes 55 55 No 45 45 Total 100 100 INFERENCES: From the above table shows that 55% of respondents says yes that the company Teach employees to measure their own performance & 45% of respondents says no that the company does not teach employees to measure their own performance. Chart 7: 31
  • 32. 60 55 50 45 40 30 Employee to measure own performance 20 10 0 Yes No Table 8: Facilities to Employees: Particulars No of Respondents Percentage 32
  • 33. Insurance 43 43 Medical 25 25 Transport __ __ Canteen 32 32 Total 100 100 INFERENCES: From the above table shows that organization provides facilities to employees that 43% of respondents say Insurance, 25% of respondents says medical &32% of respondents says canteen & there is no transport for the employees. Chart 8: 45 43 40 35 32 30 25 25 Facilities to the 20 Employees 15 10 5 0 0 Insurance Medical Transport Canteen 33
  • 34. Table 9: Medical and Insurance facility is motivated: Particulars No of Respondents Percentage Yes 65 65 No 35 35 Total 100 100 INFERENCES: 34
  • 35. From the above table shows that 65% of respondents says yes that medical facility & Insurance provided by company is highly motivate & 35% of respondents says no that it is not motivate for them. Chart 9: 70 65 60 50 40 35 Medical & Insurance 30 20 10 0 Yes No Table 10: Satisfied with the basic needs: Particulars No of Respondents Percentage Highly Satisfied 34 34 Satisfied 26 26 No opinion 18 18 Dissatisfied 12 12 Highly Dissatisfied 10 10 35
  • 36. Total 100 100 INFERENCES: From the above table shows that 34% of respondents are highly satisfied with basic needs, 26% of respondents are satisfied, 18% of respondents says no opinion, 12% of Respondents are dissatisfied, 10% of respondents are highly dissatisfied with basic needs. Chart 10: 35 30 25 20 15 Basic Needs 10 5 0 Highly Satisfied No opinion Highly Dissatisfied 36
  • 37. Table 11: Monetary Reward to Employees: Particulars No of Respondents Percentage Yes 32 32 No 68 68 Total 100 100 INFERENCES: 37
  • 38. From the above table shoes that 32% of respondents says yes that company gives monetary reward to employees, 68% of respondents says no that company does not give monetary reward to employees. Chart 11: 68 70 60 50 40 32 Monetary reward to the 30 Employees 20 10 0 Yes No Table 12: Organisation provides Monetary Reward: Particulars No of Respondents Percentage Gifts 56 56 Cash Awards 25 25 Allowances 19 19 Total 100 100 38
  • 39. INFERENCES: From the above table shows that monetary reward the organization provides for the Employees is 56% of respondents say gifts, 25% of respondents say cash awards, and 19% of respondents say allowances. Chart 12: 60 56 50 40 30 25 19 Monetary Reward 20 10 0 Gifts Cash Allowances Awards 39
  • 40. Table 13: Activities motivates employees: Particulars No of Respondents Percentage Monetary Reward 15 15 Job Promotion 30 30 Job Security 55 55 Transfer __ __ Total 100 100 40
  • 41. INFERENCES: From the above table shows that the activities which motivates them is 15% of Respondents says monetary reward,30% of respondents says Job promotion &55% of respondents says Job security & the company does not provide transfer For them. Chart 13: 60 50 40 30 Activities Motivates 20 10 0 Monetary Job Job Security Transfer Reward Promotion 41
  • 42. Table 14: Employee as part of Team: Particulars No of Respondents Percentage Yes 54 54 No 46 46 Total 100 100 INFERENCES: From the above table shows that 54% of respondents say yes that the company makes the employee as part of team & 46% of respondents says no that the company does not make the employee as part of team. Chart 14: 42
  • 43. 54 54 52 50 48 Employee as a part of 46 Team 46 44 42 Yes No Table 15: Career Development for Employees: 43
  • 44. Particulars No of Respondents Percentage Yes 45 45 No 55 55 Total 100 100 INFERENCES: From the above table shows that 45% of respondents says yes organization gives Importance to career development for employees & 55% of respondents says no that The organization does not gives importance to career development for employees. Chart 15: 60 55 50 45 40 30 Career Development 20 10 0 Yes No Table 16:Training Programmed to improve Productivity: 44
  • 45. Particulars No of Respondents Percentage To Large Extent 54 54 To Some Extent 32 32 Not at All 14 14 Total 100 100 INFERENCES: From the above table shows that 54% of respondents say organization gives Training programmed to improve productivity to large extent, 32% of respondents Says to some extent & 14% of respondents says not at all. Chart 16: 60 54 50 40 32 30 Training Programmed to 20 improve Productivity 14 10 0 To Large To Some Not at All Extend Extend 45
  • 46. Table 17:Encourage employee to work: Particulars No of Respondents Percentage To Large Extent 55 55 To Some Extent 33 33 Not at All 12 12 Total 100 100 46
  • 47. INFERENCES: From the above table shows that 55% of respondents say that manager encourage Employee to work independently to large extent, 33% of respondents say to some Extent & 12% of respondents say not at all. Chart 17: 60 55 50 40 33 30 Manager Encourage 20 Employees 12 10 0 To Large To Some Not at All Extend Extend 47
  • 48. Table 18:Organization collect employee opinion: Particulars No of Respondents Percentage Suggestion Box 56 56 Weekly Meetings 25 25 Monthly Meetings 19 19 Total 100 100 INFERENCES: From the above table shows that organization collects the employee opinion through 56% of respondents says suggestion box, 25% of respondents says Weekly meetings & 19% of respondents says monthly meetings. Chart 18: 48
  • 49. 60 56 50 40 30 25 19 Organisation collect employee 20 opinion 10 0 Suggestion Weekly Monthly Box Meetings Meetings Table 19: Hygiene factor in Job Satisfaction: Particulars No of Respondents Percentage Job Security 27 27 Promotion 23 23 Working Conditions 38 38 Pay and Allowances 12 12 Total 100 100 INFERENCES: From the above that shows that hygiene factor will result in Job satisfaction through 27% of respondents says job security, 23% of respondent‟s saysPromotion, 38% of respondents says working conditions, 12% of respondents Says pay & allowances. Chart 19: 49
  • 50. 40 35 30 25 20 15 Job Satisfaction 10 5 0 Job Security Promotion Working Pay & Condition Allowance 50
  • 51. Table 20: Job Enrichment provides true motivation: Particulars No of Respondents Percentage Yes 53 53 No 47 47 Total 100 100 INFERENCES: From the above table shows that 53% of respondents say yes that job enrichment Provide true motivation & 47% of respondents say no that job enrichment does not provide true motivation. Chart 20: 53 53 52 51 50 49 48 Job Enrichment 47 47 46 45 44 Yes No 51
  • 52. Table 21: Best performance of employee in year: Particulars No of Respondents Percentage Yes 25 25 No 75 75 Total 100 100 INFERENCES: From the above table shows that 25% of respondents say yes organization Select best performance of employee in year & 75% of respondents says no that organization does not select best performance of employee in year. Chart 21: 52
  • 53. 80 75 70 60 50 40 Best Performance 30 25 20 10 0 Yes No 53
  • 54. Table 22: Proud to be member of organization: Particulars No of Respondents Percentage Yes 83 83 No 17 17 Total 100 100 INFERENCES: From the above table shows that 83% of respondents are proud to be the member of the organization & 17% of respondents are not proud to be the member of the Organization . Chart 22: 90 83 80 70 60 50 Proud to be the 40 member of the Organization 30 20 17 10 0 Yes No CHI-SQUARE TEST 54
  • 55. NULL HYPOTHESIS Ho: To find out there is significant links between Gender and activities motivated them in the organization. ALTERNATIVE HYPOTHESIS H1: To find out there is a significant links between Gender and activities motivated employees in the organization. PARTICULARS MONETARY JOB JOB TOTAL REWARD SECURITY PROMOTION MALE 10 35 20 65 FEMALE 5 20 10 35 15 55 30 100 O E (O-E)2 (O-E)2/E 55
  • 56. 10 9.75 0.0625 6.410 35 35.75 0.5625 0.015 20 19.5 0.25 0.012 5 5.25 0.0625 0.011 20 19.25 0.5625 0.029 10 10.5 0.25 0.023 TOTAL 6.5 Calculated value of Chi-square = 6.5 Degree of freedom = (c-1) (r-1) = (3-1) (2-1) =2 The table value of chi-square for four degree of freedom at 5 percent level of significance is 5.991 Interpretation: The calculated value of chi-square is much more than the table value. The result, thus, support the hypothesis and its can be concluded that the significant links between Gender and the activities which motivated the employees most. 56
  • 57. 6. FINDINGS OF THE STUDY  In overall employee in Anglo French Textiles Limited 75% of respondents say that the company provides motivation to the employees, only 25%of respondents says no that the company did not provide motivation to employees.  68% of the respondents are satisfied with the motivation that the company provides; only 32% of respondents are not satisfied with the motivation.  56% of respondents say that motivation creates interest towards a job for employees & 44% of respondents say no that the motivation does not create interest towards a job.  54% of respondents say that motivated employee will increase the productivity level to large extent & 24% of respondents say it to some extent & 22% says that not at all the motivated employee will increase the Productivity level.  54% of respondents says that organization provide Recognition for performance & 46% of respondents says no that organization does not provide recognition for performance.  36% of respondents say that manager gives Continuous feedback about the performance to large extent, 34% of respondents says to some extent, 30% of respondents say not at all.  55% of respondents say yes that the company teach employees to measure their own performance & 45% of respondents says no that the company does not teach employees to measure their own performance. 57
  • 58.  Organization provides facilities to employees that 43% of respondents say Insurance, 25% of respondents says Medical &32% of respondents says Canteen & there is no Transport for the employees.  65% of respondents say yes that Medical Facility &Insurance provided by company is highly motivate & 25% of respondents says no that it is not motivate for them.  34% of respondents are highly satisfied with basic needs, 26% of respondents are satisfied, 18% of respondents say no opinion, 12% of respondents are dissatisfied, and 10% of respondents are highly dissatisfied with basic needs.  32% of respondents say yes that company gives monetary reward to employees, 68% of respondents says no that company does not gives monetary reward to employees.  Monetary reward the organization provides for the employees are 56% of respondents says Gifts, 25% of respondents say Cash Awards, 19% of respondents say Allowances.  The activity which motivates them is 15% of respondents says Monetary Reward, 30% of respondents say Job Promotion &55% of respondents says Job Security & the company does not provide Transfer for them.  54% of respondents say yes that the company makes the employee as part of team & 46% of respondents say no that the company does not make the employee as part of team.  45% of respondents says yes organization gives importance to Career development for employees & 55% of respondents says no that the organization does not gives importance to Career development for employees. 58
  • 59.  54% of respondents say organization gives Training programmed to improve productivity to large extent, 32% of respondents Says to some extent & 14% of respondents says not at all.  55% of respondents say that manager encourages employee to work independently to large extent, 33% of respondents say to some extent & 12% of respondents say not at all.  Organization collects the employee opinion through 56% of respondents says Suggestion Box,25% of respondents says Weekly Meetings & 19% of respondents says Monthly Meetings.  Hygiene factor will result in Job Satisfaction through 27% of respondents says Job Security,23% of respondents says Promotion,38% of respondents says Working Conditions,12% of respondents Says Pay & Allowances.  53% of respondents say yes that Job Enrichment provide true motivation & 47% of respondents say no that Job Enrichment does not provide true motivation.  25% of respondents says yes organization select best performance of employee in year & 75% of respondents says no that organization does not select best performance of employee in year.  83% of respondents are proud to be the member of the organization & 17% of respondents are not proud to be the member of the organization. 59
  • 60. 7. SUGGESTIONS AND RECOMMENDATIONS  The company can provide transport facility to the employees. The management can invest certain amount in transport and fulfill employee needs. It improves productivity and on time on duty in the concern.  In AFT Limited the management can provide transfer for the employees in which they can go to some other places and work for a certain period.  In AFT Limited, the organization is not giving more importance to the career development for the employees, so it basically affects the employee‟s future. In that case the company should concentrates on career development for the Employees.  The organization can select the best performance for every year in which it will make the employee to perform well during the training period and during the work time.  The organization can give training programmed in systematic programmed for the employees to improve the productivity level in the concern.  In the company the manager can give feedback for the employee‟s regarding their performance in which the employees can correct their mistake and they can perform well during the work time.  In the organization the manager can encourage the employees to work independently in which they can do their job well, and it will be motivating aspects for them. 60
  • 62. The study conducted at Anglo French Textiles Limited deals with the “Employee Motivation ”. In this present situation, every organization should provide motivation to the employees. Employee motivation will help to increase performance standard of an employee as well as concern. In the duration of the project I have a lot of experience. There are various factors that influence motivational factors such as salary, working conditions, training and job satisfaction. Motivation is the ultimate function of so many individuals attitudes together. It is very complex, complicated and personal experience. It is difficult to determine the relative importance of the factors influencing motivation as the importance varies with time and individuals. The motivation is the continuous process of the organization have come to conclusion that the employee motivation plays a significant role in modern organization 8.LIMITATIONS AND SCOPE OF THE STUDY 62
  • 63. 8.1 LIMITATIONS:  Some employees were having little difficulty in expressing the views even though the answer to the questions.  Time period of this study is also very short.  As the workers are not literate enough, it was difficult to get the responses from them.  Employees of the company are not aware of whatis motivation means.  Most of the employees didn‟t come forward to give opinion about the management so only it didn‟t provide me to derive a concrete solution.  The study was limited only to one company i.e. AFT.  The study is based on only 100 samples.  The study only based on employs side. It is not covering the staffs. 8.2SCOPE:  The present study aims to find out the level of workers motivation.  The study explores the views expressed by the Respondents about the motivation and providing solutions in an attempt to develop a better system.  The study is conducted taking into consideration only the workers of Anglo French Textiles Limited.  The importance of studying employee motivation isto understand the internal satisfaction in the minds of every employee.  The study helps to know some employees satisfaction level and some employee‟s dissatisfaction level.  The findings of this study help the company to implement the expectations from the employees.  This study helps the company to know whether the motivation undertaken is strongly accepted and also to know the lacking in the employee motivation. 63
  • 65. A STUDY ON EMPLOYEE MOTIVATION SCENARIO IN ANGLO FRENCH TEXTILES LIMITED GENERAL INFORMATIONS: NAME: AGE: GENDER: MARITAL STATUS: QUALIFICATION: 1. Below SSLC 2.Higher Secondary 3.Diploma 4.Degree Holder EXPERIENCE: 1.5-10 Years 2.10-15 Years 3.15-20 Years 4.20-25 Years SALARY: 1. Below 5000 2.5000- 10000 3.10000-15000 4.15000 & above 1. Does the company provide any motivation to the employees? (a) Yes (b)No 65
  • 66. 2. Are you satisfied with the motivation that the company provides? (a)Yes (b) No 3. Does the motivation create any interest towards a job for employees? (a)Yes (b) No 4. Do you think that a highly motivated employee will increase the productivity level? (a)To Large Extent (b)To Some Extent (c)Not at All 5.Does the organisation provide recognition for your employees? (a) Yes (b)No 6. Does the manager give continuous feedback about your performance? (a)Yes (b) No 7. Does the company teach the employees how to measure their own performance? (a)Yes (b) No 8. Does the organization provide the following facilities to the employees? (a)Insurance (b) Medical (c) Transport (d) Canteen 9. Does the medical facility and the insurance provided by the company is highly motivate to you.? (a)Yes (b) No 66
  • 67. 10. Are you satisfied with the basic needs? (a)Highly Satisfied (b) Satisfied (c) No opinion (d) Dissatisfied (e) Highly Dissatisfied 11. Does the company give monetary reward to the employees? (a)Yes (b) No 12. What type of monetary reward does the organization provides for the employees?. (a) Gifts (b) Cash Awards (c) Allowances 13. Which activities motivate you the most? (a)Monetary Reward (b) Job promotion (c) Job security (d) Transfer 14. Does the company make the employee as part of team? (a)Yes (b) No 15. Do you think that the organization gives importance to the career development for employees? (a)Yes (b) No 16. Does the organization give training programmed in systematic manner to improve productivity? (a) To Large Extent (b) To Some Extent (c) Not at All 17. Does the manager encourage employees to do your work independently? 67
  • 68. (a) To Large Extent (b) To Some Extent (c) Not at All 18. In which way does the organization collect the employee’s opinion? (a) Suggestion Box (b) Weekly Meetings (c) Monthly Meetings 19. Which of the following hygiene factor will result in job satisfaction? (a)Job security (b) Promotion (c) Pay and Allowances (d) Working Conditions 20. Does the job enrichment provide true motivation? (a) Yes (b) No 21. Whether the organization select the best performance of employee in the year? (a)Yes (b) No 22. Are you proud to be the member of the organization? (a)Yes (b) No 9.2 BIBLIOGRAPHY 1. Stephen P. Robbins & Seema Sanghi (2005) ORGANISATIONAL BEHAVIOUR, Dorling Kindersley (Indian) Pvt Ltd., New Delhi. 2. Bhagoliwal, T.N. (1992) PERSONNEL MANAGEMENT AND INDUSTRIAL RELATIONS, Sathitya bawan, Agra. 68
  • 69. 3. HUMAN RESOURCE MANAGEMENT (2003), ICFAI center for management Research, Hyderabad. 4. Kothari, C.R.Research Methodology-Methods and Techniques. 69
  • 70. 70