Download to read offline
![Articles
18 www.thelancet.com Published online May 2, 2014 http://dx.doi.org/10.1016/S0140-6736(14)60497-9
findings of analyses by Feng and colleagues59
have shown
the important role that socioeconomic and health system
determinants have had in the reduction of child mortality
in China.
The reasons underlying these faster than expected
decreases in child mortality are undoubtedly
multifactorial and complex, and deserve further study,
but prominent among them is surely the introduction of
national policies that promote development and
increased access to essential child-care services among
the worst off and increased investments in health and
related sectors. The MDG declaration and subsequent
political momentum might have affected the health-
investment landscape, stimulating a more effective and
comprehensive response by bilateral donors, the Global
Alliance for Vaccines and Immunisation (GAVI), the US
President’s Emergency Plan for AIDS Relief (PEPFAR),
The Global Fund to Fight AIDS, Tuberculosis and
Malaria (GFATM), the World Bank, and other
development partners to ensure the more widespread
dissemination of new technologies and the remarkable
progress against HIV. The attention that has been paid
to achievement of the MDGs more broadly, and not
merely those directly concerned with health, has
undoubtedly helped with progress in reduction of child
mortality by improvement of broader development
indicators such as education, income, and the
environment, all of which are likely to lead to improved
child survival. By contrast, 17 countries had rates of
change in under-5 mortality much slower than expected.
A more detailed case study analysis of these countries
compared with those with faster than expected decreases
could provide further insights into bottlenecks and
circumstances that hinder progress.
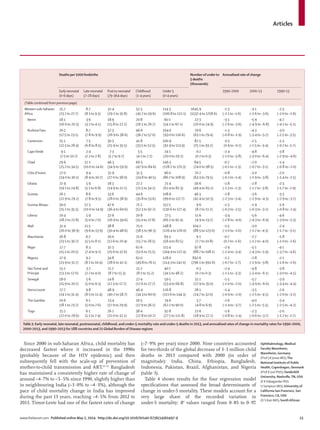
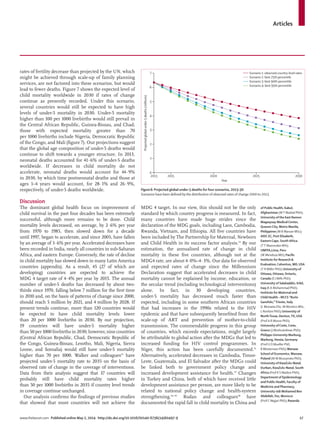
Our analysis of long-term trends in child mortality
provides some insight into the comparative contribution
of different factors. Worldwide, income growth
between 1990 and 2013 accounted for about 15·6% (95%
UI 14·2–16·9) of the change in the number of child
deaths. Although correlated (correlation coefficient 0·72)
with income, maternal education had a much larger
effect on decreases in child mortality (38·5% [35·5–41·2])
than did income, a finding that is consistent with
previous research, but provides a quantitative assessment
of just how important mothers’ education is in the
reduction of child mortality.31,60–65
These findings reinforce
the continued importance of investments in primary and
secondary schooling for girls in particular. Continued
high total fertility rates, especially in western sub-
Saharan Africa, have led to increased numbers of births,
which, all other things being equal, has led to
nearly 1 million more child deaths in 2013 than in 1990.
Therefore, the renewed focus on contraceptive
programmes for low-income countries66–68
is very timely
Persian GulfCaribbean LCA
Dominica
ATG
TTO
Grenada
VCT
TLS
Maldives
Barbados
Seychelles
Mauritius
Comoros
West Africa Eastern
Mediterranean
Malta
Singapore Balkan Peninsula Tonga
Samoa
FSM
Fiji
Solomon Isl
Marshall Isl
Vanuatu
Kiribati
0–2
3–4
5–9
10–15
15–20
20–30
30–50
50–70
70–100
100–120
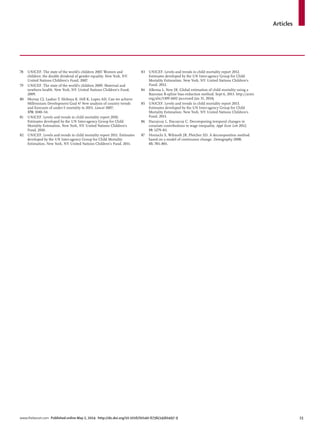
Under-5 mortality rate
(deaths per 1000)
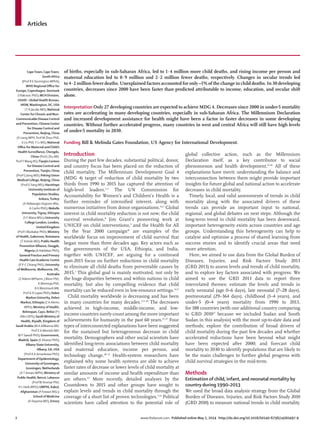
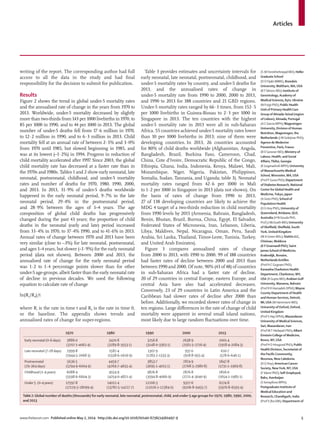
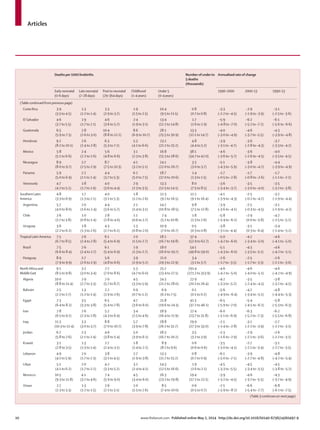
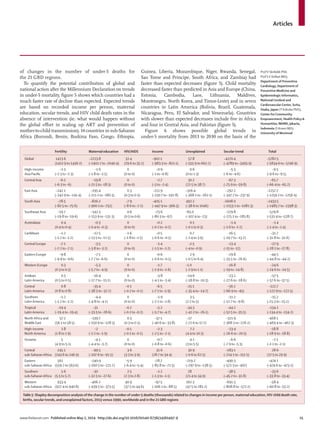
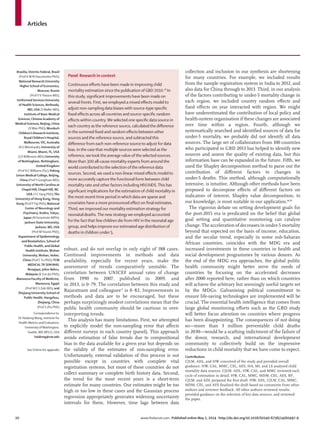
Figure 7: Projected under-5 mortality rate in 2030, on the basis of the observed rate of change for each country, 2000–13
ATG=Antigua and Barbuda. LCA=Saint Lucia.VCT=SaintVincent and the Grenadines.TTO=Trinidad andTobago.TLS=Timor-Leste. FSM=Federated States of Micronesia.
Biomedical Center, Kigali,
Rwanda (J d D Ngirabega PhD);
Centre of Research in
Environmental Epidemiology
(CREAL), Barcelona, Spain
(N J Nieuwenhuijsen PhD,
D Rojas-Rueda PhD); Makerere
University, Kampala, Uganda
(L Nyakarahuka MPH);Teikyo
University School of Medicine,
Tokyo, Japan
(ProfT Ohkubo MD);
Universidad de Cartagena,
Cartagena, Bolivar, Colombia
(A J Paternina Caicedo MSc);
Centre for Chronic Disease
Control, New Delhi, Delhi, India
(Prof D Prabhakaran MD);
Hamad Medical Corporation,
Doha, Qatar
(S U R Rahman FCPS);
Department of Public Health,
University of the Punjab,
Lahore, Punjab, Pakistan
(S M Rana PhD); Private
Consultant, Cairns, QLD,
Australia (R Q Reilly MPH);
Imperial College London,
London, United Kingdom
(L Rushton PhD); Marshall
University, Huntington,WV,
USA (M Sawhney PhD);
Zhongshan Hospital, Fudan,
University, Shanghai, China](https://image.slidesharecdn.com/mortalidadinfantil1990-2013-140517224355-phpapp02/85/Mortalidad-infantil-1990-2013-18-320.jpg)
![Articles
www.thelancet.com Published online May 2, 2014 http://dx.doi.org/10.1016/S0140-6736(14)60497-9 19
and a crucial component of national strategies to help
countries to reduce the number of child deaths.
In a series of analyses spanning four decades, Preston
and others32,69
have noted an upward shift of the
association between life expectancy, income, and
education—ie, the same level of income and education
today is associated with much lower levels of age-specific
mortality and higher life expectancy than before.
Investigators attribute this shift associated with time to
the advancement of technology and the diffusion of such
advancement; technology is defined in this case very
broadly to encompass both new methods but also new
ways in which societies are organised to deliver
programmes and interventions. We find the same major
shift in the association in our analysis of child mortality.
The way that the secular trend is estimated would also
capture systematic improvements in the average
efficiency of societies’ ability to convert improvements in
income and education into child mortality reductions,
such as improved efficiency of production. Overall, the
secular trend accounts for the largest share (72·1% 95%
UI 60·8–82·1]) of the change in child deaths
from 1990 with 2013. New drugs, vaccines, diagnostics,
procedures, and public health campaigns are part of this
shift. In the past 23 years, this shift included innovations
such as insecticide-treated bednets, technologies to
prevent mother-to-child transmission of HIV, ART,
rotavirus vaccine,70,71
pneumococcal72
and other vaccines,
and many other life-saving technologies. The dominant
role of new technologies and more efficient ways of
diffusing them in poor countries emphasises the
importance of continued innovation in drugs, vaccines,
public health programmes, and the delivery of health
care for continued declines in under-5 mortality. Our
assessment of the comparative role of health technologies
in bringing about the massive decreases in child
mortality in the past few decades provides indirect
evidence for donors, researchers, and countries alike of
the crucial effect that these investments have had.
The variation in child mortality around the income and
education curve at a given moment in time has been
interpreted as variation in country performance in the
production of better child health,31,73,74
a component of
which might be related to health systems. In our study,
we controlled for time invariant differences between
countries that might be related to the environment or
other fixed attributes. We noted unobserved factors
beyond income, maternal education, time, HIV, birth
and time-invariant country factors accounted for only
about –1·0% (95% UI –9·5 to 11·5) of the global change
in under-5 mortality between 1990 and 2013. Although
other factors quantitatively have a much greater role in
reductions in child deaths since 1990 than do the
unobserved factors, understanding the local policy
factors associated with this unobserved change could
provide important insights and opportunities for shared
learning. Nevertheless, the fact that our model can
explain 96·7% of the observed variation in
under-5 mortality rates provides strong evidence to
support the continued investment in the main
determinants of lower child mortality, namely maternal
education, income growth, and the development and
application of new technologies.
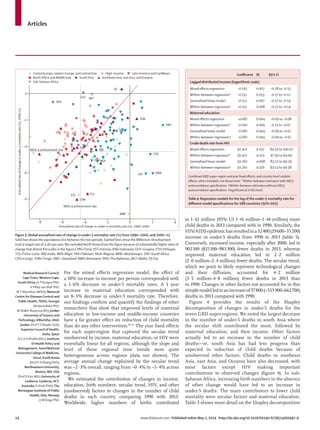
Although substantial progress has been made in
reduction of child mortality worldwide, our scenario
analysis of projected under-5 mortality in 2030 provides a
sobering reminder of the magnitude of the task ahead.
Even if present, rapid decreases in mortality in low-
income countries of sub-Saharan Africa persist, along
with decreases recorded elsewhere, almost 3·8 million
children will still die before their fifth birthday in 2030,
unless the speed of decrease can be accelerated. Progress
is being hindered partly by fertility patterns in which the
fraction of births worldwide is likely to increasingly shift
towards sub-Saharan Africa where mortality rates are
highest. This shift in the distribution of births means that
global progress in reducing child mortality, even if every
country maintains the same rate of decline, will slow. The
countries that will have the highest rates of child mortality
in 2030, on the basis of present trends are concentrated in
west and central Africa. Ambitious goals to reduce
under-5 mortality to 20 per 1000 livebirths as proposed by
the USA, Ethiopia, and India will need to strategically
focus on countries in these regions.1
Anticipation of the
pace of these decreases suggests that donors might want
to prioritise funding for some countries on the basis of
their probable future under-5 mortality. Conversely, the
pace of child mortality decrease in some countries (eg,
India) is accelerating, such that by 2030, according to our
base scenario, India will have an under-5 mortality rate
lower than 25 per 1000 livebirths.
During the past 6 years, many studies have been done
of country levels and trends in child mortality.1,13,14,75–83
Worldwide, the UN and the GBD estimates of the
number of child deaths have largely converged. The
appendix shows estimates from UNICEF and
independent academic studies, including the
GBD 2010 and this analysis. In their latest iteration, the
UN Inter-agency Group for Child Mortality Estimation
(IGME)84
changed their methods, which resulted in
increased mortality estimates for 1990, which has
substantially changed some of the estimates of
annualised rates of decrease. The UN has estimated
that high-income countries such as Spain are under-
reporting child deaths, although no direct evidence of
under-reporting exists. Overall, the association between
their estimates of the annualised rate of change
from 1990 to 2007, published in 2012, and 2013,
is 0·93.83,85
Likewise, the GBD effort has changed some
methods such that the association of the annualised
rate of change for the same period is 0·87 between
GBD iterations. However, the uncertainty intervals on
annualised rates of change between 2000 and 2010,
generated as part of the GBD collaboration seem to be
(J She PhD); University of
Tokyo,Tokyo, Japan
(K Shibuya PhD); Health Canada,
Ottawa, Ontario, Canada
(H H Shin PhD,
SWeichenthal PhD);
Washington State University,
Spokane,WA, USA
(K Shishani PhD); Heriot-Watt
University, Edinburgh,
Scotland, United Kingdom
(I Shiue PhD); Reykjavik
University, Reykjavik, Iceland
(I D Sigfusdottir PhD);
University of Alabama at
Birmingham, Birmingham, AL,
USA (J A Singh MD); Federal
Research Institute for Health
Organization and Informatics
of Ministry of Health of the
Russian Federation, Moscow,
Russia (S S Soshnikov PhD);
Department of Clinical
Neurological Sciences,Western
University, London, Ontario,
Canada (L A Sposato MD);
Centre Hospitalier Nord Deux-
Sevres, Bressuire, France
(V K Stathopoulou MD);
KEELPNO (Center for Disease
Control, Greece, dispatched to
“Alexandra” General Hospital
of Athens), Athens, Greece
(K Stroumpoulis PhD);
University of Illinois,
Champaign, IL, USA
(K MTabb PhD); Ministry of
Health,Yaounde, Centre,
Cameroon (RTTalongwa MD);
ARS Norte, Porto, Portugal
(C MTeixeira MD); Department
of Anesthesiology, University
ofVirginia, Charlottesville,VA,
USA, and Department of
Anesthesiology, King Fahad
Medical City, Riyadh, Saudi
Arabia (A STerkawi MD);
Adaptive Knowledge
Management,Victoria, BC,
Canada (A JThomson PhD);
Columbia University andThe
Earth Institute, NewYork, NY,
USA (A LThorne-Lyman ScD);
Health Care Center of Anjo
Kosei Hospital, Anjo City, Aichi
Prefecture, Japan
(HToyoshima MD);
Department of Population
Sciences and Development,
Faculty of Economics and
Management, University of
Kinshasa, Kinshasa, Democratic
Republic of the Congo
(ZTsala Dimbuene PhD);
Ministry of Health, Rwanda,
Kigali City, Rwanda
(P Uwaliraye MD); UKK Institute
for Health Promotion Research,
Tampere, Finland
(ProfT JVasankari PhD);
Universidade de Brasilia,](https://image.slidesharecdn.com/mortalidadinfantil1990-2013-140517224355-phpapp02/85/Mortalidad-infantil-1990-2013-19-320.jpg)

The document provides an analysis of neonatal, infant, and under-5 mortality rates globally from 1990 to 2013, highlighting significant decreases in child mortality and progress towards the Millennium Development Goal 4. An estimated 6.3 million children under-5 died in 2013, a 64% reduction since 1970, with factors such as income, maternal education, and healthcare access contributing to this decline. However, persistent high mortality rates remain in certain regions, particularly sub-Saharan Africa, indicating the need for continued efforts to address child mortality by 2030.


![INTRODUCTION AND VITAL STATISTICS [Autosaved].pptx](https://cdn.slidesharecdn.com/ss_thumbnails/introductionandvitalstatisticsautosaved-251220102737-b3440454-thumbnail.jpg?width=640&height=640&fit=bounds)


