Monthly Viewpoint from our CIO, Marco Pabst - August 2017: "Aging Bulls"
•
0 likes•238 views

• There is a new bull market in doomsayers predicting a market crash • Low volatility is partly structural and we have witnessed similarly extended periods without corrections before • Waiting for corrections is a futile and opportunistically expensive exercise • We would not throw in the towel on Trump as midterm elections are looming and the GOP needs some success stories • Equities are entering a slower period of year and hedging some exposure is advised

Recommended
Recommended
More Related Content
What's hot
What's hot (20)
Similar to Monthly Viewpoint from our CIO, Marco Pabst - August 2017: "Aging Bulls"
Similar to Monthly Viewpoint from our CIO, Marco Pabst - August 2017: "Aging Bulls" (20)
Recently uploaded
Recently uploaded (20)
Monthly Viewpoint from our CIO, Marco Pabst - August 2017: "Aging Bulls"
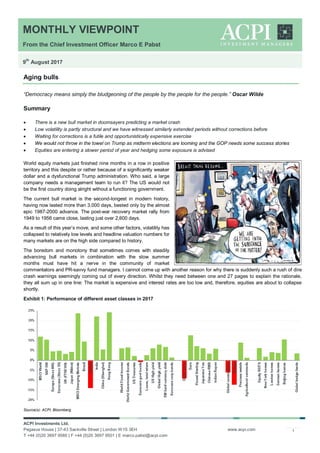
- 1. MONTHLY VIEWPOINT From the Chief Investment Officer Marco E Pabst 9 th August 2017 ACPI Investments Ltd. Pegasus House | 37-43 Sackville Street | London W1S 3EH T +44 (0)20 3697 9580 | F +44 (0)20 3697 9501 | E marco.pabst@acpi.com www.acpi.com 1 Aging bulls “Democracy means simply the bludgeoning of the people by the people for the people.” Oscar Wilde Summary There is a new bull market in doomsayers predicting a market crash Low volatility is partly structural and we have witnessed similarly extended periods without corrections before Waiting for corrections is a futile and opportunistically expensive exercise We would not throw in the towel on Trump as midterm elections are looming and the GOP needs some success stories Equities are entering a slower period of year and hedging some exposure is advised World equity markets just finished nine months in a row in positive territory and this despite or rather because of a significantly weaker dollar and a dysfunctional Trump administration. Who said, a large company needs a management team to run it? The US would not be the first country doing alright without a functioning government. The current bull market is the second-longest in modern history, having now lasted more than 3,000 days, bested only by the almost epic 1987-2000 advance. The post-war recovery market rally from 1949 to 1956 came close, lasting just over 2,600 days. As a result of this year’s move, and some other factors, volatility has collapsed to relatively low levels and headline valuation numbers for many markets are on the high side compared to history. The boredom and monotony that sometimes comes with steadily advancing bull markets in combination with the slow summer months must have hit a nerve in the community of market commentators and PR-savvy fund managers. I cannot come up with another reason for why there is suddenly such a rush of dire crash warnings seemingly coming out of every direction. Whilst they need between one and 27 pages to explain the rationale, they all sum up in one line: The market is expensive and interest rates are too low and, therefore, equities are about to collapse shortly. Exhibit 1: Performance of different asset classes in 2017 Source(s): ACPI, Bloomberg
- 2. MONTHLY VIEWPOINT From the Chief Investment Officer Marco E Pabst 9 th August 2017 ACPI Investments Ltd. Pegasus House | 37-43 Sackville Street | London W1S 3EH T +44 (0)20 3697 9580 | F +44 (0)20 3697 9501 | E marco.pabst@acpi.com www.acpi.com 2 As if most market participants ever cared about valuation levels whereby a magic gravitational force would always pull stocks back to some fair level. Do not get me wrong, we are not saying that markets are cheap and one should jump into stocks with no questions asked and we are certainly not overexposed to equities at this stage. However, markets are also not completely irrational all the time. So one has to ask why we are trading at these levels and not why the market is about the fall. After all, timing markets or trying to call tops is a pretty futile exercise that has already damaged many managers’ reputations. However, this does not stop people from trying. Exhibit 2: A selection of crash warnings from just one week Source(s): ACPI In each case, the rationale is sound and makes a lot of sense to us and we would probably agree to most of the issues raised. However, bull markets and economic booms do not die of old age. For them to end it requires at least one of two ingredients: central banks overdoing monetary tightening (or markets not being prepared for it) or an outright asset bubble was being burst by a catalyst. All severe market dislocations can be explained by this. The 1987 crash happened in the context of quickly accelerating inflation (from low levels) and the Fed beginning to raise rates in short order, on the back of a market rally of ~80% in less than two years as Reaganomics finally began to work (“Government's view of the economy could be summed up in a few short phrases: If it moves, tax it. If it keeps moving, regulate it. And if it stops moving, subsidize it.”, R. Reagan). What started as a small correction ended in a crash as recently-invented portfolio insurance accelerated the downside decline. The modern day equivalent to this is the concept of value at risk (VaR) but this is for another letter. The 2000/2001 correction was slightly more complex as broader markets were initially not too affected by the decline in tech stocks. The initial crash happened clearly in one particular, extremely overvalued area in the market whereby the catalyst was
- 3. MONTHLY VIEWPOINT From the Chief Investment Officer Marco E Pabst 9 th August 2017 ACPI Investments Ltd. Pegasus House | 37-43 Sackville Street | London W1S 3EH T +44 (0)20 3697 9580 | F +44 (0)20 3697 9501 | E marco.pabst@acpi.com www.acpi.com 3 the publication of Barron’s cash burn list. The decline in the wider stock market then accelerated and was extended as a result of the Sept 11 attacks in New York. What is now known as the Great Financial Crisis (GFC) of 2008, originated in the US real estate sector where a massive bubble of essentially worthless securities was created that threatened to bring down the financial sector. What tipped the lowest end of the property sector over the edge causing a chain reaction was the oil price that climbed past USD140 and caused significant problems for consumers. Exhibit 3: Underwater perspective for the US market since 1928 (duration of the market trading below the last high water mark) Source(s): ACPI As can be seen in the underwater chart above, the last two crashes were rather quite extreme in the history of markets. Corrections of 10-20% are far more normal and more frequent but much less damaging. I continue to believe that a repeat of 2000 or 2008 is far into the future despite many still feeling the muscle memory of these two events and thus driving their perceptions and creating in effect an anchoring bias. Moving forward to today, central banks have learnt their lessons and are uber-shy to tighten too quickly although, in our opinion, they would probably get away with somewhat higher rates in the current robust environment. So, this factor is not posing too much of a threat at this point which leaves us with bubbles and catalysts to prick them. As for the former, there is no real definition of what a bubble is other than the realisation in hindsight but to be meaningful, a mere 20-25% overvaluation compared to historic norms, and this is roughly where US stocks stand today, hardly qualifies. The one and only area, with the exception of digital currencies, that stands out today as looking extremely overvalued would be developed market government bonds. Unfortunately, this is not just an ordinary asset class; it is the asset from which the most important price is derived from – the price for money. This price is extremely low today and the reason why companies with no or low earnings are in high demand (as expected profits in the future are discounted at a very low rate only, hence growth is outperforming value as a style). It obviously affects almost all other assets too, from classic cars to real estate; interest rates play a critical role in determining the value for them. If I am not paid any interest in the bank, I might just as well buy this Ferrari and have some fun with it. With many other fellows having the same idea, prices for cars, contemporary art and many other things will rise. The difficulty with government bonds is that this market is now more or less cornered by central banks that own approximately one third of outstanding issuance (another 20% is owned by commercial banks). Add to this the willingness and ability of central banks to buy bonds on an almost unlimited scale if necessary and we have a perfect mechanism for them to control the price of money. Hence, at the present stage, it is difficult for us to conceive that this market would be allowed to get out of
- 4. MONTHLY VIEWPOINT From the Chief Investment Officer Marco E Pabst 9 th August 2017 ACPI Investments Ltd. Pegasus House | 37-43 Sackville Street | London W1S 3EH T +44 (0)20 3697 9580 | F +44 (0)20 3697 9501 | E marco.pabst@acpi.com www.acpi.com 4 control, i.e. bond yields spiking up in a disorderly fashion. Betting against it would also be doomed to fail, even if all hedge funds in the World were to combine their assets; none of them has the ability to print money to buy bonds. Furthermore, as outlined here before, inflation, productivity and growth in most countries are at levels that do not necessarily require higher interest rates. After all, leaving the conspiracy theories of central bank manipulation aside, current long-term interest rates fairly accurately reflect longer-term growth prospects on the one hand and the availability of huge amounts of liquidity in the market looking for interest income on the other hand. One only has to have a look at the relationship of US nominal GDP growth and 30-year Treasury bond yields to see that the mispricing of bond yields might not be as bad as generally perceived to be. Returning to the topic of bull market durations, whilst we have not experienced a meaningful correction for quite some time, the current period is also not too abnormal. Whilst the current bull market is the second-longest in history, this is only the 11th longest streak without a 10% correction for the S&P500. The longest streak without such decline lasted an astounding 2,553 days between October 1990 and October 1997. There were five instances in the past, when this period lasted at least twice as long as the current one, according to Bespoke Group. As for 5% corrections, this is now the 7th longest streak at just less than 400 days, with the longest observed between 1957 and 1959 for just under 600 days. Exhibit 4: Longest % rallies without a correction for the S&P500 since 1928 Source(s): Bespoke The currently observed record-low volatility is just a corollary of this development and not some separately priced asset class as many appear to believe. This measure dropped to similarly low levels before whenever equity markets were in a protracted bull run. This time, volatility is lower also because of new structural factors. Only about 10% of today’s stock market trading volumes are generated by so-called ‘active investors’. The remaining 90% is shared by algorithmic programmes, day traders and passive instruments such as exchange-traded funds (ETFs). This category is, by design, not really involved in one of the markets’ key tasks: price discovery. In other words, most of the volume is traded by various counterparties, irrespective of price, i.e. valuation. Price discovery is typically what causes volatility as stocks are fluctuating around until a ‘fair price’ is established at a certain point in time. When passive investors put money into ETFs, the ETF manager, or rather the software behind it, buys a certain amount of every stock in the particular index, irrespective of the stock being cheap or expensive, management being good or bad. Did you know that the average 10-K annual report gets downloaded from the SEC’s website fewer than 30 times between the day it is filed and the next, according to a study by the University of Notre Dame? This largely hampers the process of price discovery and with more and more passive funds creeping into the marketplace, the more and more difficult it will become for active managers to be impactful enough to move prices in the right direction from a fundamental point of view. I believe that the increasing trend towards passive investing is in large part responsible for the structurally lower volatility in markets.
- 5. MONTHLY VIEWPOINT From the Chief Investment Officer Marco E Pabst 9 th August 2017 ACPI Investments Ltd. Pegasus House | 37-43 Sackville Street | London W1S 3EH T +44 (0)20 3697 9580 | F +44 (0)20 3697 9501 | E marco.pabst@acpi.com www.acpi.com 5 Exhibit 5: Record-low volatility – we have been there before Source(s): ACPI, Bloomberg The reason for the benign market environment is very fundamental; it is our usual suspects of strong earnings growth, low interest rates and a healthy economy that is, overall, probably as good as it gets. Ironically, until April it was the unwinding of the Trump trade, i.e. falling bond yields and a weaker dollar that provided much of the tailwind. Despite the chaos in Washington, the economy was doing fine, exceeding expectations as can be seen in the Citi Economic surprise index. The dollar fell because of the market losing faith in Trump. Then, forward expectations were adjusted to good actual performance but, subsequently, they fell short of actual results between April and June which trounced the dollar to its current levels. At this stage the picture is somewhat mixed but the expectation level is reasonably low, which could help support the currency going forward. Exhibit 6: Citi economic surprise indices (lhs) and US ISM headline and ISM new orders-inventories sub index Source(s): ACPI, Bloomberg
- 6. MONTHLY VIEWPOINT From the Chief Investment Officer Marco E Pabst 9 th August 2017 ACPI Investments Ltd. Pegasus House | 37-43 Sackville Street | London W1S 3EH T +44 (0)20 3697 9580 | F +44 (0)20 3697 9501 | E marco.pabst@acpi.com www.acpi.com 6 Returning to my opening topic of this letter about seemingly widespread bearishness; there is also often a subtext to the negative case which is the willingness and hope to buy into the market after a say 10% or 20% correction. I hear this quite often that investors are prepared to buy the market at much lower levels because then it is obviously cheaper to buy and the risk is lower. This is undoubtedly true. However, once markets start falling, and I am talking about serious declines, they tend to continue to fall for an extended period of time. And as we all know, almost everyone starts buying too early and will sit on losses for some time and maybe capitulate and sell again. This is also the reason why markets crash at the end of a down move and not at the beginning. What may turn out as a severe market correction always starts out as a fairly orderly down move before it spirals into a capitulating drop. Exhibit 7: Typical sequence of an ‘orderly’ decline leading into a ‘crash’ Source(s): ACPI, Bloomberg The problem is that markets, over time, move higher and lower regularly like ebb and flow and, most of the time, do not crash. Therefore, it is very hard to conclude that any particular gentle and orderly downtrend will get out of control and result in such an outcome. Hence, selling down risk assets all the time the market turns south is also not really an option unless they are outright expensive, because most of the time one will find oneself out of the market and forced to buy back. The other option - waiting on the side lines with cash - sounds appealing but is more expensive than investors think at the outset. The reason is simple. Either the correction happens from a much higher level and one loses out on the gains in the meantime or it does not happen at all over any reasonable period of time. The result of this frustrating exercise, very often, is another form of capitulation. It happens when potential investors give in after a long time waiting and buy the market on the way up, not having had a chance to buy cheap. This typically leads to rising volumes on the way up and, ultimately, to a phase of distribution and sideways markets with higher-than-usual trading volumes, which concludes a stereotypical bull market. As for the exercise of waiting for a correction to happen, there is also a real opportunity cost to it. Elm Partners have done an interesting study recently, trying to quantify this cost. The question they asked was, during times when the market has been expensive, what has been the average cost or benefit of waiting for a correction of 10% from the starting price level, rather than investing right away? Elm Partners define expensive as a stock market that is trading one standard deviation above its historic average CAPE level (cyclically-adjusted price/earnings ratio). Assuming that a potential investor is prepared to wait for three years, hoping for a 10% correction, they found a 56% probability that the market had a 10% correction within three years, resulting in a 10% return benefit versus having invested immediately. However, they also found that in the 44% of cases where the correction did not happen, the average opportunity cost of waiting (profits not made) was about 30%, far outweighing the potential benefit from waiting. As a result, the mean expected cost of waiting was 8%. They then repeated the same exercise for different waiting periods, assumed overvaluation levels and expected correction ranges and in all cases the average cost of waiting was positive. This means that unless investors expect negative total returns from stock markets going
- 7. MONTHLY VIEWPOINT From the Chief Investment Officer Marco E Pabst 9 th August 2017 ACPI Investments Ltd. Pegasus House | 37-43 Sackville Street | London W1S 3EH T +44 (0)20 3697 9580 | F +44 (0)20 3697 9501 | E marco.pabst@acpi.com www.acpi.com 7 forward over a reasonable period of time, it is of no benefit to wait for a correction to happen. The opportunity cost of waiting always outweighs the benefits. Exhibit 8: Expected opportunity cost of waiting for a certain correction over a certain amount of time assuming different overvaluation levels for US stock markets Source(s): Elm Partners These findings are interesting and confirm quantitatively our more anecdotal evidence. Our preferred way of investing in markets that are not outright cheap is to maintain the desired exposure but apply varying degrees of hedges to the portfolio using index options until we get fundamentally and valuation-wise stopped out of our positions. Fortunately, as volatility is low in bull markets, the cost of hedging is also relatively low, albeit not negligible. Exhibit 9: Shape of the volatility term curve in the summer of 2013 and at present Source(s): ACPI, Bloomberg
- 8. MONTHLY VIEWPOINT From the Chief Investment Officer Marco E Pabst 9 th August 2017 ACPI Investments Ltd. Pegasus House | 37-43 Sackville Street | London W1S 3EH T +44 (0)20 3697 9580 | F +44 (0)20 3697 9501 | E marco.pabst@acpi.com www.acpi.com 8 The chart of the volatility term curve for the VIX index shows that hedging costs have come down by between 4 and 5 vol points compared to 2013 but are not as cheap as spot volatility might suggest as hedges are struck in the future. For instance, the cost of fully hedging an S&P500 stock portfolio today for one year is about 5%, hardly the free lunch that some suggest but cheaper than at most points in the past. Furthermore, by using slightly more complex option strategies and hedging only for a maximum drawdown move, this cost can be brought down substantially – a strategy that we typically deploy as we are in a late-cycle environment. July was a strong month for risk assets as the MSCI World equity index gained 2.3%, emerging markets gained 5.5% and US high-yield bonds 1.2%. Much of that was owed to a weak dollar, where the DXY dollar index lost another 2.9% in July, the steepest decline since March of last year. The currency lost more than 9% against a basket of its most important trading partners this year alone. The flipside of a stronger euro is a weaker performance of European stock markets that became more meaningful especially from May onwards. For the European or currency-hedged investor this underperformance versus the US amounts to almost 5% ytd. For the non-hedged dollar-based investor, the total return of holding assets in Europe has been great so far at almost 19%. Exhibit 10: US and European stock performance year-to-date and the euro (NB: the European index includes non- EUR countries) Source(s): ACPI, Bloomberg Trump‘s lack of progress on his reform agenda is the main culprit for the wavering confidence in the US currency in addition to continued low inflation and a Fed that is less hawkish than it used to be earlier in the year. Wage growth is back down to 2.5% yoy from 2.8% and the Fed’s favourite inflation gauge, PCE core inflation, was at 1.5% in June, down from as high as 1.9% at the end of last year. Global integrated markets are largely behind the tame wage inflation picture we are seeing across most developed countries, according to a recent BIS report, making it difficult for one country to stimulate wage growth without affecting unemployment numbers.
- 9. MONTHLY VIEWPOINT From the Chief Investment Officer Marco E Pabst 9 th August 2017 ACPI Investments Ltd. Pegasus House | 37-43 Sackville Street | London W1S 3EH T +44 (0)20 3697 9580 | F +44 (0)20 3697 9501 | E marco.pabst@acpi.com www.acpi.com 9 Exhibit 11: Market-implied probability of a Fed rate increase before the end of 2017 Source(s): ACPI, Bloomberg As for the euro zone and the UK, markets are currently expecting no outright tightening over the next 1 ½ years. What is more likely to happen in the US and Europe is rather an addressing of the central banks’ balance sheets whereas the ECB has already reduced the pace of asset purchases and the Fed has hinted at potentially reducing the amounts from coupon and redemption proceeds that are being re-invested in the bond market, thereby slowly reducing its balance sheet. Exhibit 12: Market-implied number of months until the first rate hike Source(s): ACPI, Bloomberg
- 10. MONTHLY VIEWPOINT From the Chief Investment Officer Marco E Pabst 9 th August 2017 ACPI Investments Ltd. Pegasus House | 37-43 Sackville Street | London W1S 3EH T +44 (0)20 3697 9580 | F +44 (0)20 3697 9501 | E marco.pabst@acpi.com www.acpi.com 10 The lack of outright hawkishness in combination with solid growth and tame inflation continues to underpin credit markets and equities. The next Fed funds’ increase is currently anticipated by market participants for March 2018. Nevertheless, as growth is picking up and synchronising around the World, other central banks are more actively pursuing a policy of ending uber-easy monetary conditions, although in a very slow fashion. This change in relative dynamics is what has been driving currencies this year compared to the immediate post US-election period. However, the dollar is now significantly oversold from a technical standpoint and the EUR is becoming increasingly strong, which makes a countermove in the short term very likely. Should this consolidation take place, recent trends in equity markets would also be affected, i.e. US equities and EM could start to underperform other markets. Exhibit 13: Unemployment in the US is declining while prime-age (25-54 years) labour force participation is rising with wage growth still in check Source(s): ACPI, Bloomberg The US labour market is still going strong as the June non-farm payrolls report came in at 209k, about 30k better than expected with upward revisions for the previous month. As a result, the unemployment rate fell back to 4.3%. Although the latest US ISM manufacturing PMI came in slightly below expectations at 56.3 and below the prior month’s figure, it still indicates that the economy is expanding relatively strongly. This backdrop makes it difficult for us to see continued dollar weakness going forward although a substantial part of this correction is owed to the dysfunctional Trump administration where markets by now have given up any hopes for a successful implementation of healthcare and tax reforms. PredictIt puts the probability of an ACA subsidy repeal this year at 21% while the likelihood of a successful tax reform implementation before year-end currently stands at 32%. However, despite the seemingly low odds of successfully passing legislation this year, we believe that one should not throw in the towel too early on the topic. Congressional Republicans cannot enter the upcoming midterm election season with no legislative win. They have a natural self-interest at this point to help lift Trump’s popularity and get at least one piece of significant legislation to pass. If they fail, midterm elections are likely to turn into a disaster and embarrassment for them, considering that they control both chambers of Congress and the executive. What is sometimes forgotten is that Trump has indeed made progress on the deregulatory front. Should the current momentum in this area continue, regulatory activity will be curtailed to levels not seen since the 1970s. This is clearly bullish
- 11. MONTHLY VIEWPOINT From the Chief Investment Officer Marco E Pabst 9 th August 2017 ACPI Investments Ltd. Pegasus House | 37-43 Sackville Street | London W1S 3EH T +44 (0)20 3697 9580 | F +44 (0)20 3697 9501 | E marco.pabst@acpi.com www.acpi.com 11 for US businesses as the cost of complying with regulations (estimated at USD2trn) exceeds the amount of taxes paid by corporations (USD1.9trn), according to the Competitive Enterprise Institute. Exhibit 14: Pages in the US Federal Register Source(s): Bianco Research Due to the dollar weakness, companies with international exposure, therefore, outperformed those with predominantly domestic revenues. As of the end of July, the Russell 2000 index of US small caps gained ‘only’ 5% ytd while the S&P500 rose twice as much. On a micro level, the current corporate reporting season is strong across the board; in the US, Europe and Asia. For the S&P500, average Q2 sales and earnings growth figures are currently at 5.4% and 10.1%, respectively, somewhat below the Q1 level but still strong. Corporate profits as a percentage of GDP have reached a 70-year high in the US. Looking at Japan, the picture is even more impressive with sales growing at 6% and earnings at a whopping 32%. Quarterly profits for oil&gas, basic materials, industrials, technology and consumer goods companies rose between 40% and 170% last quarter. Thanks to strong earnings growth, valuations of Japanese stocks have hardly expanded despite the strong market performance. We continue to like Japan as this fundamental momentum is likely to continue, albeit at a somewhat slower pace. Japan is the ultimate value investor’s haven: 41% of stocks in the country are currently trading below book value whereas this measure is at only 4% for the S&P500 and 14% for the European Stoxx600 index. Add to this the fact that 55% of Japanese small cap stocks have no analyst coverage at all whilst only 8% of smaller US companies are not covered by the sell-side and one has all the ingredients for a very asymmetrical investment opportunity. As the pressure on management boards for better corporate governance and shareholder value creation increases, this continues to be a fertile hunting ground for attractive investments. In Europe, quarterly reports are coming in equally impressive. For the top 500 companies, Q2 sales growth was registered at 7.1% with earnings growing at almost 25%. All figures above are year-on-year numbers and one should not forget that comparables were easy due to the weak Q1 and Q2 of last year as a result of collapsing oil prices. This effect will gradually wash out over the next two to three quarters. Aside from that, there are some short and medium-term concerns pertaining to certain market seasonalities. Typically, equity markets tend to trend sideways between August and October before they enter their most profitable window between November and May. Furthermore, and this is admittedly somewhat more esoteric and due to the low number of years in
- 12. MONTHLY VIEWPOINT From the Chief Investment Officer Marco E Pabst 9 th August 2017 ACPI Investments Ltd. Pegasus House | 37-43 Sackville Street | London W1S 3EH T +44 (0)20 3697 9580 | F +44 (0)20 3697 9501 | E marco.pabst@acpi.com www.acpi.com 12 question not statistically significant, markets appear to follow a fairly consistent pattern in years ending with a seven, as can be seen in the chart below. This is that typically around the third quarter there was some relatively strong down move that started between August and October and lasted for up to three months. Exhibit 15: Intra-year seasonal patterns for US stock markets since 1901 (lhs) and average market performance in years ending with a 7, since 1897 (rhs) Source(s): Stock Trader’s Almanac, Wellenreiter As always, these are technical factors that we have to keep in mind but are not driving investment decisions per se. On a more fundamental level, circling back to the beginning, discussing supposedly bubble-like conditions in US equity markets, I would highlight that the move higher in stocks over the last years was fairly controlled and valuations expanded steadily as opposed to parabolically. The latter was always the case in previous raging bull markets that ended with so-called blow off tops when valuations began to rise faster. Exhibit 16: Forward relative P/E by S&P500 high and low beta quintiles (lhs) and distribution of S&P500 rolling 5-year annualised total returns (Dec 1930-July 2017) Source(s): Richard Bernstein Advisors LLC What is also missing and can be seen in the chart above is that valuations for high-beta stocks (equities that move faster than the market in both directions) are not higher than the overall market itself. In fact, both high and low beta stocks are trading near average market multiples. What one would typically expect in a market that is becoming more irrational is that high beta names, which are by their nature riskier, would start to run faster and thus expand in valuation terms. This is not the case at the moment. This lack of momentum on the way up is also visible in the rolling five-year annualised return figures, currently at just under 15%, which are reasonably high but not consistent with previous bull market peaks. Thus, past bull markets peaked
- 13. MONTHLY VIEWPOINT From the Chief Investment Officer Marco E Pabst 9 th August 2017 ACPI Investments Ltd. Pegasus House | 37-43 Sackville Street | London W1S 3EH T +44 (0)20 3697 9580 | F +44 (0)20 3697 9501 | E marco.pabst@acpi.com www.acpi.com 13 after an average five-year return streak of 21.4% per annum. We are currently not even half-way there between this number and the median annual return of markets. In terms of our positioning, we see no reason to make any wholesale changes at this point. Equities and credit continue to be in a bull market and we continue to abstain from trying to time markets and calling tops. This can turn out to be an expensive as well as humiliating exercise. Instead, we stick with our hedges that, thanks to the low-volatility regime, do not cost very much to establish and maintain and keep our long exposure largely unchanged. Following such an extended streak of monthly gains, a correction is certainly overdue and welcome by us but we would like to remind investors that this would not be the time to get nervous as markets never correct just because of valuations. Under normal circumstances, i.e. in the absence of bubbles, it is central banks that kill the stock market by tightening the monetary screws too much. At the moment, this is not the case and as for bubbles, we leave it to other market commentators to debate where they are.
- 14. MONTHLY VIEWPOINT From the Chief Investment Officer Marco E Pabst 9 th August 2017 ACPI Investments Ltd. Pegasus House | 37-43 Sackville Street | London W1S 3EH T +44 (0)20 3697 9580 | F +44 (0)20 3697 9501 | E marco.pabst@acpi.com www.acpi.com 14 Global economic monitor Feb Mar Apr May Jun Jul Trend Citi Economic Surprise US 34.7 48.0 -4.8 -38.2 -72.6 -43.1 Citi Economic Surprise G10 41.9 41.8 26.1 2.0 -20.5 -11.1 Citi Economic Surprise Europe 71.1 54.1 70.4 40.6 30.3 19.1 Citi Economic Surprise EM 46.6 34.4 39.5 7.4 12.5 16.3 Citi Economic Surprise UK 92.3 60.8 0.4 -15.1 -15.8 -39.8 ISM manufacturing 57.7 57.2 54.8 54.9 57.8 56.3 ISM new orders 63.15 61.7 60.35 58.6 62 57.8 Global manufacturing PMI 53.6 53.8 53.7 53.8 53.7 53.5 China manufacturing PMI 51.6 51.8 51.2 51.2 51.7 51.4 Japan manufacturing PMI 53.3 52.4 52.7 53.1 52.4 52.1 US durable goods orders 1.4 2.4 -0.8 0.0 6.4 US initial jobless claims 227 235 238 255 250 240 US Industrial production 0.2 0.1 0.8 0.1 0.4 Euro Industrial production -0.1 0.4 0.3 1.3 Japan Industrial production 3.2 -1.9 4.0 -3.6 1.6 US retail sales -0.2 0.1 0.3 -0.1 -0.2 Euro retail sales 0.5 0.5 0.0 0.4 0.5 Japan retail sales 0.2 2.1 3.2 2.1 2.1 China retail sales 10.7 10.7 11.0 US consumer confidence 116.1 124.9 119.4 117.6 117.3 121.1 Euro consumer confidence -6.4 -5.1 -3.6 -3.3 -1.3 -1.7 ifo German business expectations 104.1 105.4 105.2 106.5 106.8 107.3 China export trade -1.9 16.0 7.5 8.3 11.3 South Korea export trade 20.2 13.6 24.1 13.3 13.6 19.5 German export trade 6.1 4.7 5.7 8.7 China monthly money supply 11.1 10.6 10.5 9.6 9.4 US personal income 0.5 0.3 0.2 0.3 0.0 Source(s): ACPI, Bloomberg
- 15. MONTHLY VIEWPOINT From the Chief Investment Officer Marco E Pabst 9 th August 2017 ACPI Investments Ltd. Pegasus House | 37-43 Sackville Street | London W1S 3EH T +44 (0)20 3697 9580 | F +44 (0)20 3697 9501 | E marco.pabst@acpi.com www.acpi.com 15 The Global PMI heatmap Country/RegionCategory/SectorJul-2017Jun-2017May-2017Apr-2017Mar-2017Feb-2017Jan-2017Dec-2016Nov-2016Oct-2016Sep-2016Aug-2016Jul-2016Jun-2016May-2016Apr-2016Mar-2016Feb-2016Jan-2016Dec-2015Nov-2015Oct-2015Sep-2015Aug-2015Jul-2015 AustriaManufacturing60.060.758.058.156.857.257.356.355.453.953.552.153.454.552.052.052.851.951.250.651.453.052.550.552.4 BrazilComposite49.448.550.450.448.746.644.745.245.344.946.144.446.442.338.339.040.839.045.143.944.542.742.744.840.8 BrazilManufacturing50.050.552.050.149.646.944.045.246.246.346.045.746.043.241.642.646.044.547.445.643.844.147.045.847.2 BrazilServices48.847.449.250.347.746.445.145.144.443.945.342.745.641.437.337.438.636.944.443.545.543.041.744.839.1 CanadaManufacturing55.554.755.155.955.554.753.551.851.551.150.351.151.951.852.152.251.549.449.347.548.648.048.649.450.8 ChinaComposite51.951.151.551.252.152.652.253.552.952.951.451.851.950.350.550.851.349.450.149.450.549.948.048.850.2 ChinaManufacturing51.150.449.650.351.251.751.051.950.951.250.150.050.648.649.249.449.748.048.448.248.648.347.247.347.8 ChinaServices51.551.652.851.552.252.653.153.453.152.452.052.151.752.751.251.852.251.252.450.251.252.050.551.553.8 CzechRepublicManufacturing55.356.456.457.557.557.655.753.852.253.352.050.149.351.853.353.654.355.556.955.654.254.055.556.657.5 DevelopedMarketsManufacturing54.053.954.154.153.954.154.253.853.052.651.551.351.551.250.450.550.950.852.152.052.352.551.751.952.2 DevelopedMarketsServices54.554.554.254.254.153.754.553.954.053.651.851.651.451.652.052.351.751.253.353.954.854.253.955.254.7 DevelopedMarketsComposite54.454.554.454.454.254.154.654.154.053.752.051.851.651.551.551.951.751.253.253.754.654.053.654.654.4 EgyptWholeEconomy48.647.247.347.445.946.743.342.841.842.046.347.048.947.547.646.944.548.148.048.245.047.250.251.249.2 EmergingMarketsComposite51.451.552.352.052.652.151.951.951.551.851.151.351.450.049.549.950.549.050.149.550.249.848.949.850.2 EmergingMarketsManufacturing50.950.850.650.951.651.350.851.150.851.050.350.150.349.349.549.650.248.949.449.049.249.048.448.649.1 EmergingMarketsServices51.251.652.952.252.351.952.151.650.951.151.051.251.350.749.149.950.048.950.849.550.250.449.950.751.1 EuropeanUnionComposite55.355.856.356.756.155.654.654.954.153.652.953.051.953.053.152.853.353.054.054.554.554.253.554.554.6 EuropeanUnionManufacturing56.256.856.756.755.955.355.254.953.553.452.951.951.452.851.451.451.751.452.452.952.852.652.052.352.6 EuropeanUnionServices55.055.055.756.355.755.053.954.454.153.352.352.851.552.753.452.953.353.254.154.554.654.353.654.754.8 EurozoneComposite55.756.356.856.856.456.054.454.453.953.352.652.953.253.153.153.053.153.053.654.354.253.953.654.353.9 EurozoneManufacturing56.657.457.056.756.255.455.254.953.753.552.651.752.052.851.551.751.651.252.353.252.852.352.052.352.4 EurozoneRetail51.053.252.052.749.549.950.150.448.648.649.651.048.948.550.647.949.250.148.949.048.551.351.951.454.2 EurozoneServices55.455.456.356.456.055.553.753.753.852.852.252.852.952.853.353.153.153.353.654.254.254.153.754.454.0 EurozoneConstruction#N/A53.253.252.553.552.250.752.351.449.449.148.648.346.548.447.549.051.350.349.448.747.848.847.247.1 FranceComposite55.656.656.956.656.855.954.153.151.451.652.751.950.149.650.950.250.049.350.250.151.052.651.950.251.5 FranceManufacturing54.954.853.855.153.352.253.653.551.751.849.748.348.648.348.448.049.650.250.051.450.650.650.648.349.6 FranceRetail54.156.353.351.849.451.753.150.447.347.549.153.051.651.050.648.245.548.148.946.647.851.949.649.552.9 FranceServices56.056.957.256.757.556.454.152.951.651.453.352.350.549.951.650.649.949.250.349.851.052.751.950.652.0 FranceConstruction52.352.353.552.753.251.550.150.650.347.547.845.344.842.343.841.642.744.643.042.244.843.844.242.340.6 GermanyComposite54.756.457.456.757.156.154.855.255.055.152.853.355.354.454.553.654.054.154.555.555.254.254.155.053.7 GermanyManufacturing58.159.659.558.258.356.856.455.654.355.054.353.653.854.552.151.850.750.552.353.252.952.152.353.351.8 GermanyRetail50.754.555.056.252.551.250.352.049.651.053.054.152.051.654.051.054.152.549.550.549.652.454.054.757.7 GermanyServices53.154.055.455.455.654.453.454.355.154.250.951.754.453.755.254.555.155.355.056.055.654.554.154.953.8 GermanyConstruction55.855.155.354.656.454.152.054.953.952.952.451.651.650.452.753.455.859.657.955.552.551.852.450.350.6 GreeceManufacturing50.550.549.648.246.747.746.649.348.348.649.250.448.750.448.449.749.048.450.050.248.147.343.339.130.2 HongKongWholeEconomy51.351.150.551.149.949.649.950.349.548.249.349.047.245.447.245.345.546.446.146.446.646.645.744.448.2 IndiaComposite46.052.752.551.352.350.749.447.649.155.452.454.652.451.150.952.854.351.253.351.650.252.651.552.652.0 IndiaManufacturing47.950.951.652.552.550.750.449.652.354.452.152.651.851.750.750.552.451.151.149.150.350.751.252.352.7 IndiaServices45.953.152.250.251.550.348.746.846.754.552.054.751.950.351.053.754.351.454.353.650.153.251.351.850.8 IndonesiaManufacturing48.649.550.651.250.549.350.449.049.748.750.950.448.451.950.650.950.648.748.947.846.947.847.448.447.3 IrelandComposite57.058.058.758.756.957.859.358.455.554.054.856.956.559.259.158.160.759.561.159.260.257.759.559.761.8 IrelandManufacturing54.656.055.955.053.653.855.555.753.752.151.351.750.253.051.552.654.952.954.354.253.353.653.853.656.7 IrelandServices58.357.659.561.159.160.661.059.156.054.656.259.759.561.261.759.862.862.164.061.863.660.162.462.163.4 IrelandConstruction#N/A58.263.661.360.857.955.758.959.862.358.758.461.059.755.956.462.368.863.658.655.556.355.856.559.1 ItalyComposite56.254.555.256.854.254.852.852.953.451.151.151.952.252.650.853.152.453.753.856.054.353.953.455.053.5 ItalyManufacturing55.155.255.156.255.755.053.053.252.250.951.049.851.253.552.453.953.552.253.255.654.954.152.753.855.3 ItalyRetail47.347.145.548.345.145.545.647.948.846.545.043.240.340.245.242.646.649.447.950.247.748.851.748.750.7 ItalyServices56.353.655.156.252.954.152.452.353.351.050.752.352.051.949.852.151.253.853.655.353.453.453.354.652.0 ItalyConstruction49.951.049.048.649.049.949.250.248.545.945.147.746.944.947.245.345.846.147.248.647.346.448.548.049.2 JapanComposite51.852.953.452.652.952.252.352.852.051.348.949.850.149.049.248.949.951.052.652.252.352.351.252.951.5 JapanManufacturing52.152.453.152.752.453.352.752.451.351.450.449.549.348.147.748.249.150.152.352.652.652.451.051.751.2 JapanServices52.053.353.052.252.951.351.952.351.850.548.249.650.449.450.449.350.051.252.451.551.652.251.453.751.2 LebanonWholeEconomy46.346.146.647.546.947.747.747.046.943.845.145.045.544.444.844.145.047.449.147.946.947.148.147.849.3 MexicoManufacturing51.252.351.250.751.550.650.850.251.151.851.950.950.651.153.652.453.253.152.252.453.053.052.152.452.9 NetherlandsManufacturing58.958.657.657.857.858.356.557.357.055.753.453.553.252.052.752.653.651.752.453.453.553.753.053.956.0 PolandManufacturing52.353.152.754.153.554.254.854.351.950.252.251.550.351.852.151.053.852.850.952.152.152.250.951.154.5 RussiaComposite53.454.856.055.356.355.458.356.655.853.753.152.953.553.551.251.350.850.648.447.850.549.050.949.350.9 RussiaManufacturing52.750.352.450.852.452.554.753.753.652.451.150.849.551.549.648.048.349.349.848.750.150.249.147.948.3 SaudiArabiaWholeEconomy55.754.355.356.556.457.056.755.555.053.255.356.656.054.454.854.254.554.453.954.456.355.756.558.757.7 SouthAfricaWholeEconomy50.149.050.250.350.750.551.351.650.850.550.749.849.949.650.247.947.049.149.649.149.647.547.949.348.9 SouthKoreaManufacturing49.150.149.249.448.449.249.049.448.048.047.648.650.150.550.150.049.548.749.550.749.149.149.247.947.6 SpainComposite56.757.757.257.356.857.054.755.555.254.454.154.853.755.754.855.255.154.555.355.256.255.054.658.858.3 SpainManufacturing54.054.755.454.553.954.855.655.354.553.352.351.051.052.251.853.553.454.155.453.053.151.351.753.253.6 SpainServices57.658.357.357.857.457.754.255.055.154.654.756.054.156.055.455.155.354.154.655.156.755.955.159.659.7 TaiwanManufacturing53.653.353.154.456.254.555.656.254.752.752.251.851.050.548.549.751.149.450.651.749.547.846.946.147.1 TurkeyManufacturing53.654.753.551.752.349.748.747.748.849.848.347.047.647.449.448.949.250.350.952.250.949.548.849.350.1 UnitedArabEmiratesWholeEconomy56.055.854.356.156.256.055.355.054.253.354.154.755.353.454.052.854.553.152.753.354.554.056.057.155.8 UnitedKingdomComposite54.153.854.356.154.953.755.256.655.354.853.853.547.552.653.252.053.752.755.755.155.755.253.455.356.8 UnitedKingdomManufacturing55.154.256.357.054.354.655.455.953.454.255.453.548.353.050.549.551.350.952.251.252.554.551.551.852.4 UnitedKingdomServices53.853.453.855.855.053.354.556.255.254.552.652.947.452.353.552.353.752.755.655.555.954.953.355.657.4 UnitedKingdomConstruction51.954.856.053.152.252.552.254.252.852.652.349.245.946.051.252.054.254.255.057.855.358.859.957.357.1 UnitedStatesManufacturing53.352.052.752.853.354.255.054.354.153.451.552.052.951.350.750.851.551.352.451.252.854.153.153.053.8 UnitedStatesServices54.754.253.653.152.853.855.653.954.654.852.351.051.451.451.352.851.349.753.254.356.154.855.156.155.7 UnitedStatesComposite54.653.953.653.253.054.155.854.154.954.952.351.551.851.250.952.451.350.053.254.055.955.055.055.755.7 VietnamManufacturing51.752.551.654.154.654.251.952.454.051.752.952.251.952.652.752.350.750.351.551.349.450.149.551.352.6 WorldComposite53.553.753.853.753.853.653.953.553.353.251.751.751.651.251.051.451.450.652.352.553.352.852.353.253.2 WorldManufacturing52.752.652.652.753.053.052.852.752.152.051.150.851.050.450.150.250.650.050.950.751.051.050.350.550.8 WorldServices53.753.853.953.753.753.353.953.353.353.051.651.551.451.451.351.751.350.752.752.853.753.353.054.153.9 Source(s): ACPI, Bloomberg The table shows monthly PMI statistics across countries and different sectors per country for the past two years. The latest data is next to the country/sector name at the bottom of the page. 2012 Eurozone crisis Brazil in recession Italy’s permanent recession Improving picture in the UK and US EM recovery
- 16. MONTHLY VIEWPOINT From the Chief Investment Officer Marco E Pabst 9 th August 2017 ACPI Investments Ltd. Pegasus House | 37-43 Sackville Street | London W1S 3EH T +44 (0)20 3697 9580 | F +44 (0)20 3697 9501 | E marco.pabst@acpi.com www.acpi.com 16 The World in Numbers Date PMI CPI (%) Disc rate % Ind Prodyoy% Exports ($M) Imports ($M) Trade bal ($M) M2 ($bn) M2 mom% Unempl % Date GDP yoy% 31/01/2017 50.3 2.5 0.75 -0.02 118,802 187,628 -68,826 13,265 4.8 30/09/2016 1.5 28/02/2017 57.4 2.70 0.75 0.42 119,827 170,966 -51,139 13,305 0.3% 4.7 31/12/2016 1.8 31/03/2017 57.7 2.4 1 1.26 136,035 196,378 -60,343 13,388 0.6% 4.5 31/03/2017 2 30/04/2017 58.3 2.2 1 1.77 124,054 187,853 -63,799 13,439 0.4% 4.4 30/06/2017 2.1 31/05/2017 59.4 1.9 1 1.95 128,536 202,096 -73,560 13,501 0.5% 4.3 30/06/2017 65.7 1.6 1.25 1.97 133,388 199,866 -66,478 13,525 0.2% 4.4 31/07/2017 58.9 1.25 4.3 Date PMI CPI (%) Disc rate % Ind Prodyoy% Exports ($bn) Imports ($bn) Trade bal ($bn) M2 (RMBbn) M2 mom% Date GDP yoy% 31/01/2017 51.3 2.5 1.50 7.6 181.83 131.56 50.3 157,595 30/09/2016 6.7 28/02/2017 51.6 0.8 1.50 6.5 119.42 129.17 -9.7 158,291 0.4% 31/12/2016 6.8 31/03/2017 51.8 0.9 1.50 6.5 179.92 156.19 23.7 159,961 1.1% 31/03/2017 6.9 30/04/2017 51.2 1.2 1.50 7.6 179.2 141.69 37.5 159,633 -0.2% 30/06/2017 6.9 31/05/2017 51.2 1.5 1.50 190.31 149.82 40.5 160,136 0.3% 30/06/2017 51.7 1.5 1.50 196.59 153.84 42.8 163,128 1.9% 31/07/2017 51.4 1.50 Date PMI CPI (%) Disc rate % Ind Prodyoy% Exports (€bn) Imports (€bn) Trade bal (€bn) M2 EZ (€bn) M2 EZ mom% Unempl % Date GDP yoy% 31/01/2017 56.4 1.9 0.00 -0.4 104 85.1 18.9 10,732,462 5.9 30/09/2016 1.7 28/02/2017 56.8 2.2 0.00 1.4 105 83.8 21.2 10,767,648 0.3% 5.9 31/12/2016 1.8 31/03/2017 58.3 1.6 0.00 2.1 105.4 85.5 19.9 10,857,242 0.8% 5.8 31/03/2017 1.7 30/04/2017 58.2 2 0.00 2.8 106.3 86.5 19.8 10,925,355 0.6% 5.8 31/05/2017 59.5 1.5 0.00 5.0 107.9 87.6 20.3 10,937,728 0.1% 5.7 30/06/2017 59.6 1.6 0.00 0.0 11,008,918 0.7% 5.7 31/07/2017 58.1 1.7 0.00 5.7 Date PMI CPI (%) Disc rate % Ind Prodyoy% Exports,GBPM Imports,GBPM Trade bal (GBPM) M2 (GBPM) M2 mom% Unempl % Date GDP yoy% 31/01/2017 55.4 1.8 0.25 3.0 49,142 51,778 -2,636 1,619,434 4.7 30/09/2016 2 28/02/2017 54.6 2.3 0.25 2.4 48,690 51,170 -2,480 1,620,112 0.0% 4.7 31/12/2016 1.9 31/03/2017 54.3 2.3 0.25 1.4 50,012 53,735 -3,723 1,645,414 1.6% 4.6 31/03/2017 2.0 30/04/2017 57 2.7 0.25 -0.8 49,235 51,351 -2,116 1,649,629 0.3% 4.6 30/06/2017 1.7 31/05/2017 56.3 2.9 0.25 -0.2 49,657 52,730 -3,073 1,651,339 0.1% 4.5 30/06/2017 54.2 2.6 0.25 0 1,664,621 0.8% 31/07/2017 55.1 0.25 Date CPI (%) Disc rate % Ind Prodyoy% Exports,JPYbn Imports,JPYbn Trade bal (JPYbn) M2 (JPY TRN) M2 mom% Unempl % Date GDP yoy% 31/01/2017 0.4 3.2 5,422 6,514 -1,092 961 3.0 30/09/2016 1.1 28/02/2017 0.3 4.7 6,347 5,536 811 958 -0.3% 2.8 31/12/2016 1.6 31/03/2017 0.2 3.5 7,230 6,619 610 962 0.4% 2.8 31/03/2017 1.3 30/04/2017 0.4 5.7 6,329 5,850 479 971 1.0% 2.8 31/05/2017 0.4 6.5 5,851 6,058 -206 972 0.1% 3.1 30/06/2017 0.4 4.9 6,608 6,169 440 977 0.4% 2.8 00/01/1900 4.5 Date CPI (%) Disc rate % Ind Prodyoy% Exports ($M) Imports ($M) Trade bal ($M) M3 (INR 10M) M2 mom% Date GDP yoy% 31/01/2017 3.2 6.25 3.0 22,115 31,956 -9,841 12,156,100 30/09/2016 6.8 28/02/2017 3.7 6.25 1.9 24,490 33,387 -8,896 12,308,280 1.3% 31/12/2016 6.7 31/03/2017 3.9 6.25 3.8 29,232 39,669 -10,437 12,839,080 4.3% 31/03/2017 5.6 28/04/2017 3.0 6.25 2.8 24,635 37,884 -13,249 12,620,590 -1.7% 31/05/2017 2.2 6.25 1.7 24,015 37,856 -13,842 12,722,948 0.8% 30/06/2017 1.5 6.25 23,563 36,522 -12,960 12,809,450 0.7% 31/07/2017 6.25 12,857,423 0.4% INDIA US CHINA GERMANY UK JAPAN Source(s): ACPI, Bloomberg
- 17. MONTHLY VIEWPOINT From the Chief Investment Officer Marco E Pabst 9 th August 2017 ACPI Investments Ltd. Pegasus House | 37-43 Sackville Street | London W1S 3EH T +44 (0)20 3697 9580 | F +44 (0)20 3697 9501 | E marco.pabst@acpi.com www.acpi.com 17 Performance of different asset classes EQUITIES Currency JULY 2017 2016 2015 2014 2013 2012 2011 MSCI World USD 1,961.1 2.3% 12.0% 5.3% -2.7% 2.9% 24.1% 13.2% -7.6% MSCI World (EUR hedged) EUR 148.8 1.2% 7.7% 5.6% -0.2% 7.4% 25.4% 12.0% -7.8% MSCI World (GBP hedged) GBP 769.0 1.3% 8.2% 6.0% -0.1% 7.9% 26.5% 12.6% -7.9% MSCI World (USD hedged) USD 513.0 1.4% 8.9% 7.2% 0.1% 7.6% 26.1% 13.1% -23.3% MSCI World local Local 548.4 1.7% 9.6% 6.8% -0.7% 7.2% 22.9% 13.2% -8.5% US (S&P500) USD 2,470.3 1.9% 10.3% 9.5% -0.7% 11.4% 29.6% 13.4% 0.0% Europe (Stoxx 600) EUR 377.9 -0.4% 4.5% -1.2% 6.8% 4.4% 17.4% 14.4% -11.3% Eurozone (Euro Stoxx 50) EUR 3,449.4 0.2% 4.8% 0.7% 3.8% 1.2% 17.9% 13.8% -17.0% Germany (DAX30) EUR 12,118.3 -1.7% 5.5% 6.9% 9.6% 2.7% 25.5% 29.0% -14.7% UK (FTSE 100) GBP 7,372.0 0.8% 3.2% 14.4% -4.9% -2.7% 14.4% 5.8% -5.5% France (CAC40) EUR 5,093.8 -0.5% 4.8% 4.9% 8.5% -0.5% 18.0% 15.2% -16.9% Greece (ASE) EUR 812.2 -1.4% 26.2% 1.9% -23.6% -28.9% 28.0% 33.4% -51.9% Spain (IBEX) EUR 10,502.2 0.6% 12.3% -2.0% -7.2% 3.7% 21.4% -4.7% -13.1% Italy (MIB) EUR 21,486.9 4.4% 11.7% -10.2% 12.7% 0.2% 16.6% 7.8% -25.2% Japan (Nikkei 225) JPY 19,925.2 -0.5% 4.2% 0.4% 9.1% 7.1% 56.7% 22.9% -17.9% MSCI Emerging Markets USD 1,066.2 5.5% 23.7% 8.6% -17.0% -4.6% -5.0% 15.1% -20.4% MSCI Emerging Markets local Local 56,555.3 4.4% 18.7% 7.1% -8.0% 2.5% 0.9% 13.9% -14.9% MSCI Asia ex Japan USD 656.0 4.9% 27.5% 2.9% -11.3% 2.2% 0.7% 19.4% -19.2% MSCI Eastern Europe USD 145.9 3.5% -0.6% 33.0% -8.1% -40.0% -2.9% 13.2% -23.3% MSCI Latin America USD 2,752.0 8.2% 17.6% 27.9% -32.9% -14.8% -15.7% 5.4% -21.9% Russia (MICEX) RUB 1,919.5 2.1% -14.0% 26.8% 26.1% -7.1% 2.0% 5.2% -16.9% India (Sensex) INR 32,514.9 5.2% 22.1% 1.9% -5.0% 29.9% 9.0% 25.7% -24.6% Brasil (Bovespa) BRL 65,920.4 4.8% 9.5% 38.9% -13.3% -2.9% -15.5% 7.4% -18.1% Hong Kong (Hang Seng) HKD 27,324.0 6.1% 24.2% 0.4% -7.2% 1.3% 2.9% 22.9% -20.0% China (Shanghai Comp) CNY 3,273.0 2.5% 5.5% -12.3% 9.4% 52.9% -6.8% 3.2% -21.7% South Korea (Kospi) KRW 2,402.7 0.5% 18.6% 3.3% 2.4% -4.8% 0.7% 9.4% -11.0% Israel (TA 25) ILS 1,447.1 0.9% -1.6% -3.8% 4.4% 10.2% 12.1% 9.2% -18.2% South Africa (Top 40) ZAR 48,873.1 7.6% 11.3% -4.1% 4.2% 6.0% 19.2% 22.2% -0.6% FIXED INCOME JULY 2017 2016 2015 2014 2013 2012 2011 Citigroup WorldBig USD 220.7 1.7% 6.1% 1.9% -3.2% 0.8% 24.1% 13.2% -7.6% Citigroup WorldBig local Local 221.6 0.3% 1.3% 3.3% 0.9% 7.9% -0.1% 5.6% 5.7% Citigroup WorldBig (EUR hedged) EUR 221.3 0.2% 0.7% 2.4% 0.6% 7.8% -0.2% 5.5% 6.2% Citigroup WorldBig (GBP hedged) GBP 272.1 0.3% 1.2% 3.6% 1.3% 8.2% 0.1% 5.8% 5.9% Citigroup WorldBig (USD hedged) USD 240.0 0.4% 1.7% 3.9% 0.9% 7.8% -0.1% 5.6% 5.5% World government bonds (Citi) USD 940.7 1.9% 6.4% 1.6% -3.6% -0.5% -4.0% 1.7% 6.4% US Treasuries, total return USD 223.8 0.1% 2.1% 1.1% 0.8% 6.1% -3.4% 2.1% 9.9% US 10-year yield USD 2.29% -0.01 -0.15 0.17 0.10 -0.86 1.27 -0.12 -1.42 US 10-year bond USD 125.9 0.3% 1.3% -1.3% -0.7% 3.0% -7.3% 1.3% 8.9% US 5y/5y forward inflation expectation USD 2.03% 0.17 -0.01 0.24 -0.33 -0.51 -0.32 0.58 -0.39 Eurozone government debt EUR 230.8 0.2% -0.8% 3.3% 1.6% 13.1% 2.2% 11.0% 3.4% Eurozone corporate bonds EUR 224.3 0.8% 1.4% 4.7% -0.7% 8.2% 2.2% 13.6% 1.7% EU high yield (BofAML) USD 299.7 1.0% 5.1% 9.1% 0.8% -7.4% 15.0% 29.2% -5.6% Germany 10-year yield EUR 0.54% 0.08 0.34 -0.42 0.09 -1.39 0.61 -0.51 -1.14 Germany 10-year bond EUR 162.0 0.0% -1.3% 3.9% 1.3% 12.0% -4.4% 4.8% 11.0% UK 10-year yield GBP 1.23% -0.03 -0.01 -0.72 0.20 -1.27 1.19 -0.15 -1.42 Japan 10-year yield JPY 0.08% -0.00 0.04 -0.22 -0.06 -0.41 -0.05 -0.20 -0.14 China 10-year yield CNY 3.63% 0.06 0.57 0.20 -0.79 -0.97 1.03 0.15 -0.47 India 10-year yield INR 6.47% -0.04 -0.05 -1.25 -0.10 -0.97 0.78 -0.52 0.65 Russia 10-year yield RUB 7.74% 0.05 -0.55 -1.10 -4.13 5.98 0.89 -1.65 0.61 Loans, total return (S&P LSTA) USD 2,760.2 0.7% 2.6% 10.2% -0.7% 1.6% 5.3% 9.7% 1.5% US High yield (BofAML) USD 1,246.2 1.2% 6.1% 17.5% -4.6% 2.5% 7.4% 15.6% 4.4% US investment grade (BofAML) USD 2,859.8 0.7% 4.7% 6.0% -0.6% 7.5% -1.5% 10.4% 7.5% US mortgages (BofAML) USD 2,060.2 0.5% 1.8% 1.7% 1.5% 6.1% -1.4% 2.6% 6.1% US municipals (BofAML) USD 548.6 0.7% 4.2% 0.4% 3.6% 9.8% -2.9% 7.3% 11.2% Global high yield (BBG) USD 172.9 1.7% 8.0% 14.8% -4.7% -0.3% 7.6% 18.6% 2.7% EM hard-currency debt (JPM EMBI+) USD 823.9 0.4% 6.7% 9.6% 1.8% 6.2% -8.3% 18.0% 9.2% EM external government debt (BofAML) USD 1,129.5 1.3% 8.4% 7.6% -1.0% 5.2% -3.3% 17.6% 5.8% EM investment grade (BofAML) USD 368.3 1.1% 5.8% 5.5% -1.0% 3.9% -1.3% 13.2% 5.6% Emerging market spreads USD 246.7 -0.79 -40.16 -218.44 81.55 113.54 43.24 US Investment-grade spreads USD 101.9 -5.34 -21.76 -44.55 49.98 22.95 -31.46 US high-yield spreads USD 375.3 -9.40 -54.40 -289.20 187.09 180.41 -74.78 CURRENCIES JULY 2017 2016 2015 2014 2013 2012 2011 Dollar index 92.9 -2.9% -9.1% 3.6% 9.3% 12.8% 0.3% -0.5% 1.5% Euro 1.2 3.6% 12.6% -3.2% -10.2% -12.0% 4.2% 1.8% -3.2% Pound Sterling 1.3 1.5% 7.1% -16.3% -5.4% -5.9% 1.9% 4.6% -0.4% Swiss Franc 1.0 -0.9% 5.4% -1.6% -0.8% -10.2% 2.5% 2.6% -0.4% Japanese Yen 110.3 1.9% 6.1% 2.8% -0.5% -12.1% -17.6% -11.3% 5.5% Renminbi 6.7 0.9% 3.4% -6.6% -4.4% -2.4% 2.9% 1.1% 4.8% Won 1,119.3 2.3% 7.9% -2.6% -7.0% -3.8% 1.0% 9.1% -3.2% Brasilian Real 3.1 5.8% 4.1% 21.7% -33.0% -11.1% -13.2% -9.1% -11.0% Indian Rupee 64.2 0.6% 5.8% -2.6% -4.5% -2.0% -11.0% -3.1% -15.8% USD real effective exchange rate (Barclays) 130.6 -1.7% -6.9% 4.2% 7.9% 7.7% 1.4% -2.7% 1.7% EUR real effective exchange rate (Barclays) 73.3 2.2% 5.7% -1.2% -4.9% -3.8% 4.4% -1.9% -1.2% JPY real effective exchange rate (Barclays) 127.8 0.0% 0.4% 3.6% 4.9% -7.1% -17.5% -15.1% 2.5% COMMODITIES JULY 2017 2016 2015 2014 2013 2012 2011 Global commodities, total return (S&P GSCI) USD 2,269.3 4.6% -6.1% 11.4% -32.9% -33.1% -1.2% 0.1% -1.2% Agriculture, spot return USD 294.6 -1.0% 1.2% 2.6% -12.1% -8.3% -22.1% 3.9% -14.9% Energy, total return USD 381.5 8.1% -12.2% 18.1% -41.5% -44.1% 5.1% -1.4% 4.9% Crude oil USD 410.5 8.6% -11.8% 8.0% -45.3% -42.6% 6.0% -11.5% -1.3% Industrial metals, total return USD 1,255.3 3.4% 11.8% 17.6% -24.5% -7.4% -12.9% 1.4% -22.3% Copper USD 3,869.1 7.1% 14.3% 17.3% -24.9% -12.7% -7.9% 4.3% -21.5% Livestock, total return USD 1,930.6 -4.2% 7.8% -7.3% -18.3% 14.2% -3.6% -4.0% -1.2% Precious metals USD 1,533.9 1.9% 8.9% 8.4% -11.1% -4.1% -29.8% 6.2% 6.6% Gold, total return USD 675.3 2.0% 9.5% 7.7% -10.9% -1.7% -28.7% 6.1% 9.6% REAL ESTATE JULY 2017 2016 2015 2014 2013 2012 2011 All Equity REITS total returns (FTSE NAREIT) USD 16,902.4 1.3% 6.2% 8.6% 2.8% 28.0% 2.9% 19.7% 8.3% FTSE EPRA NAREIT developed markets, total return USD 4,802.5 1.9% 7.3% 5.0% 0.1% 15.9% 4.4% 28.7% -5.8% FTSE EPRA NAREIT emerging markets USD 2,390.0 6.1% 21.4% 0.2% 2.5% 15.1% -20.0% 36.1% -28.9% New York home prices USD 188.7 0.0% 1.8% 2.8% 3.7% 2.8% 6.2% -0.3% -3.3% Greater London house price (£) GBP 641,338.0 1.1% 4.1% -0.1% 9.9% 11.7% 10.6% 6.8% 6.4% German house prices EUR 120.5 0.0% 3.8% 8.7% 1.7% 6.6% 3.5% 5.0% 8.4% Moscow prop prices (US$/sqm) USD 2,832.0 -4.0% 4.9% 3.6% -32.7% -24.8% -2.6% 6.0% 9.5% Beijing property prices (RMB/sqm) RMB 43,427.0 0.0% 10.5% 32.6% 14.7% -3.2% 30.7% -7.9% 7.9% HEDGE FUNDS JULY 2017 2016 2015 2014 2013 2012 2011 Global hedge funds USD 1,245.7 0.9% 3.5% 2.5% -3.6% -0.6% 6.7% 3.5% -8.9% Equity hedge funds USD 1,209.0 0.9% 4.6% 0.1% -2.3% 1.4% 11.1% 4.8% -19.1% Event-driven hedge funds USD 1,652.9 1.0% 5.7% 11.1% -6.9% -4.1% 13.9% 6.0% -4.9% CTA funds USD 1,137.4 0.9% 0.2% -2.9% -2.0% 5.2% -1.8% -1.0% -4.9% Credit hedge funds USD 2,035.5 0.8% 3.2% 5.0% -4.4% -1.8% 6.9% 7.7% -3.6% Activist hedge funds USD 2,424.6 0.0% 5.2% 9.1% 0.2% 8.5% 19.2% 9.3% -16.9% Source(s): ACPI, Bloomberg
- 18. MONTHLY VIEWPOINT From the Chief Investment Officer Marco E Pabst 9 th August 2017 ACPI Investments Ltd. Pegasus House | 37-43 Sackville Street | London W1S 3EH T +44 (0)20 3697 9580 | F +44 (0)20 3697 9501 | E marco.pabst@acpi.com www.acpi.com 18 Performance and valuations of international equity markets Year to Market Rolling 1-yr Rolling 2-yr Rolling 3-yr EPS growth Country date Cap (USDbn)* change change change 2016E 2017E 2017E 2016E 2017E WORLD All Country MSCI MXWD Index 13.6% 52,464 15.3% 13.5% 15.2% 16.9 15.4 10.2% 2.5% 2.7% Developed World MXWO Index 12.4% 43,035 14.6% 12.6% 16.8% 17.5 15.9 9.8% 2.5% 2.6% Emerging World MXEF Index 23.8% 9,430 20.5% 20.6% 1.5% 13.4 11.9 12.4% 2.5% 2.7% AMERICAS US (S&P500) SPX Index 10.6% 21,966 13.5% 19.2% 29.7% 19.0 17.0 11.4% 2.0% 2.1% US (Dow Jones Industrial) INDU Index 11.8% 6,103 19.1% 27.2% 35.0% 18.1 16.5 9.7% 2.4% 2.5% US mid/small cap RTY Index 4.1% 2,268 14.7% 17.0% 26.1% 29.8 22.8 30.5% 1.2% 1.3% Canada SPTSX Index -0.2% 1,834 4.2% 6.7% 0.9% 17.1 15.4 10.9% 2.9% 3.2% Mexico MEXBOL Index 12.5% 327 8.8% 14.4% 16.3% 18.9 17.0 11.4% 2.1% 2.2% Argentina MERVAL Index 28.3% 92 41.0% 94.3% 163.3% 12.8 9.2 39.9% 1.5% Brazil IBOV Index 11.1% 648 16.0% 37.7% 19.1% 12.9 11.4 12.6% 3.2% 3.7% EUROPE Europe SXXP Index 5.8% 11,820 12.1% -3.7% 17.0% 16.0 14.7 9.1% 3.4% 3.6% Germany DAX Index 7.1% 1,340 18.6% 7.0% 36.1% 13.6 12.6 7.3% 3.0% 3.2% France CAC Index 7.0% 1,699 18.0% 0.9% 25.4% 15.4 14.1 9.0% 3.2% 3.4% UK UKX Index 5.2% 2,665 10.6% 11.8% 13.9% 15.5 14.4 8.0% 4.1% 4.3% Spain IBEX Index 14.0% 783 24.8% -4.7% 5.8% 14.9 13.6 9.6% 3.6% 3.9% Italy FTSEMIB Index 14.0% 580 31.9% -7.5% 14.7% 15.0 13.0 15.6% 3.5% 3.8% Switzerland SMI Index 11.6% 1,143 12.0% -2.5% 10.5% 18.2 16.5 10.4% 3.3% 3.5% Norway OBX Index 7.7% 211 22.0% 16.1% 22.4% 15.9 14.8 7.6% 4.3% 4.6% Sweden OMX Index 3.7% 596 14.1% -2.4% 17.9% 16.6 15.1 9.9% 3.7% 3.9% Austria ATX Index 24.5% 106 46.2% 31.0% 45.6% 14.0 13.7 1.9% 2.8% 3.2% Greece ASE Index 28.9% 58 47.4% 22.6% -24.0% 16.3 16.4 -0.6% 2.6% 2.0% EMERGING EUROPE Hungary BUX Index 14.6% 28 34.3% 63.1% 114.0% 12.0 11.3 6.3% 2.5% 3.0% Kazakhstan KZKAK Index 34.0% 15 67.0% 129.0% 41.1% Ukraine PFTS Index 8.6% 2 29.8% -13.7% -36.5% 10.1 Russia RTSI$ Index -10.9% 476 9.8% 23.3% -11.3% 6.0 5.4 11.5% 5.5% 6.2% Poland WIG Index 20.7% 370 31.2% 19.2% 25.1% 12.8 12.1 6.0% 2.9% 3.4% Czech Rep PX Index 11.3% 51 20.8% -0.7% 7.8% 12.9 13.6 -5.1% 4.9% 4.8% Turkey XU100 Index 38.9% 192 42.7% 38.4% 37.7% 9.7 8.3 16.9% 3.2% 3.7% MIDDLE EAST & AFRICA South Africa TOP40 Index 12.8% 648 9.1% 6.6% 8.7% 14.1 11.8 18.7% 3.1% 3.3% Egypt Hermes Index 12.6% 66.8% 66.6% 36.6% 12.1 9.7 24.1% 2.9% 3.7% Namibia FTN098 Index 6.6% 132 7.8% 3.1% 1.7% 10.9 10.7 1.0% 4.4% 4.6% Nigeria NGSEINDX Index 39.3% 40 36.5% 19.0% -12.2% 18.1% Israel TA-25 Index -4.9% -5.0% -18.5% 1.0% 12.7 11.4 11.1% 1.9% 2.1% Saudi Arabia SASEIDX Index -1.6% 12.8% -18.0% -32.8% 14.4 13.2 8.6% 3.2% 3.5% Qatar DSMIndex -10.5% -13.4% -20.6% -28.5% 14.5 12.7 14.4% 3.4% 3.8% Dubai DFMGI Index 3.8% 4.4% -11.1% -22.6% 11.0 9.5 16.0% 4.1% 4.2% ASIA Asia MXAPEXA Index 33.1% 3,199 33.6% 33.4% 24.8% 13.6 12.3 11.2% 2.5% 2.7% Japan TPX Index 7.4% 5,496 27.5% -2.8% 29.7% 14.4 13.7 4.7% 2.0% 2.2% Japan NKY Index 4.4% 3,210 22.7% -3.7% 31.0% 17.1 15.8 8.2% 1.9% 2.0% Hong Kong HSI Index 25.3% 2,212 24.5% 12.3% 13.0% 13.1 12.0 9.0% 3.7% 3.9% China domestic shashr Index 5.1% 4,696 9.6% -12.9% 49.2% 14.5 12.9 12.5% 2.0% 2.2% China offshore HSCEI Index 17.1% 628 20.5% -2.0% 1.2% 8.7 8.0 8.8% 3.5% 3.8% Taiwan TWSE Index 13.5% 1,021 15.6% 24.5% 15.1% 14.9 13.9 7.6% 3.8% 4.0% South Korea KOSPI Index 18.2% 1,337 18.7% 19.2% 16.6% 1.6% 1.8% New Zealand NZSE Index 10.5% 90 2.5% 23.2% 35.9% 20.0 17.6 13.6% 4.2% 4.4% Australia AS30 Index 0.9% 1,427 3.4% 5.5% 5.0% 16.1 14.7 9.8% 4.3% 4.5% Pakistan KSE100 Index -1.9% 75 19.0% 29.4% 58.7% 9.8 8.5 14.8% 5.4% 6.1% Thailand SET50 Index 3.9% 310 4.1% 7.1% -1.9% 15.2 13.9 8.7% 3.1% 3.3% Indonesia JCI Index 9.1% 482 6.6% 21.1% 14.0% 16.6 14.5 14.6% 2.1% 2.5% India NIFTY Index 23.0% 1,102 15.9% 17.5% 31.6% 19.6 16.0 22.5% 1.5% 1.7% Singapore FSSTI Index 15.5% 389 17.6% 4.1% 0.4% 15.1 14.0 7.3% 3.3% 3.5% Malaysia FBMKLCI Index 8.1% 248 6.6% 5.5% -5.0% 16.4 15.5 5.6% 3.2% 3.4% Philippines PCOMP Index 16.0% 192 -0.5% 5.3% 14.1% 19.2 17.2 11.7% 1.6% 1.7% Vietnam VNINDEX Index 18.6% 85 25.7% 30.6% 29.8% 15.7 13.6 15.4% 2.4% 2.5% Source(s): ACPI, Bloomberg Data as of: 31-Jul-2017 * Market cap for the main index PER Dividend yield
- 19. MONTHLY VIEWPOINT From the Chief Investment Officer Marco E Pabst 9 th August 2017 ACPI Investments Ltd. Pegasus House | 37-43 Sackville Street | London W1S 3EH T +44 (0)20 3697 9580 | F +44 (0)20 3697 9501 | E marco.pabst@acpi.com www.acpi.com 19 Three-month outlook Highly indebted major World economies are characterised by low GDP growth, low inflation and de-synchronised growth patterns whilst the lack of fiscal stimulus puts the burden on the central banks, keeping interest rates low for a long time to come. Weight Cash We are slightly overweight cash from reductions in fixed income. Equities US Valuations are high but US equities benefit from a weaker dollar and strong earnings. Rising wages and a stronger dollar could provide EPS headwinds. Positive sentiment was the missing ingredient to push stocks closer to the tops in this cycle. Europe With most elections in Europe behind us and growth picking up, the outlook has improved for the Eurozone. Potential ECB tapering is likely to support the euro and the financial sector. Earnings growth continues to be robust. Japan Japanese equity markets are still amongst the cheapest globally and for as long as yields remain anchored, the market remains attractive, although currency volatility induces substantial equity volatility in the country. China H shares are attractive but onshore markets are still overvalued with the country undergoing a major transition. The domestic consumer is becoming stronger and savings are rising, helped by pro-growth fiscal support. EM The weaker dollar and the dysfunctional Trump administration are positive for EM. Earnings growth is solid and valuations reasonable although political risks are present and the outlook for a stronger dollar is not priced into EM equities. Central Banks Aggregate central bank balance sheets are still expanding on a global level although the Fed started tightening already and the ECB is expected to announce similar steps soon. FixedIncome DM govt After the correction in DM government bonds in the second half of 2016, yield levels look more attractive than before, especially in the US. In the medium term, yields can rise further as expectations for growth and inflation improve. EM govt Dollar bonds of countries with low external debt levels and low/no trade and budget deficits are interesting. Should the dollar strengthen again, risks within EM would increase. DM credit Spreads have been tightening, supported by recovering commodity prices. Spreads in the US and the UK are more attractive than in the Eurozone where rates are extremely low but likely to rise. EM credit We avoid issuers with substantial hard-currency debt relative to the underlying revenue mix. We would stress-test balance sheets against any EM FX deterioration. Spreads for fundamentally strong issuers in hard currency are attractive. Alt FI We like alternative areas of fixed income such as peer-to-peer lending (P2P) and structured credit. P2P lending offers diversified and uncorrelated low double-digit return streams and returns in structured credit are still attractive. Currencies USD It appears unlikely that the Fed will be able to raise policy rates substantially in the near future. Wage growth and inflation are low in the US and there is no imminent risk of an inflationary overshoot. GDP growth is solid, which is positive for the USD. EUR Following several elections in Europe, the risk premium for European assets should decline and the euro should benefit accordingly. Any further tapering by the ECB would also be bullish for the euro and Eurozone assets. Short term overbought. JPY The BoJ has turned less aggressive recently with regards to providing additional monetary stimulus. The market is trying to find a new direction for the yen. Inflation is positive but stable and GDP growth is also robust, which is positive for the currency. EM The weaker dollar has provided tailwinds for EM currencies this year. We prefer commodity exporters over commodity importers. We like RUB, MXN, INR and avoid TRY. GBP The GBP cheapened substantially as a result of the Brexit vote. Due to the long timeline of the Brexit process and unpredictable political noise, uncertainty will continue, adding a substantial risk premium to the currency. Commodities Oil It appears that the rebalancing of the oil market will take longer than expected with Saudi Arabia drawing down its reserves and the outlook hinges on demand growth as well as OPEC’s ability to control output. Metals Industrial metals have been supported by the outlook of more reflationary policies and fiscal stimulus, especially in the US. General We believe that after its five-year (2011-2015) streak of high negative returns, the commodity complex in general could become more attractive again, especially energy and agricultural commodities but also precious metals as a hedge against tail risks.
- 20. MONTHLY VIEWPOINT From the Chief Investment Officer Marco E Pabst 9 th August 2017 ACPI Investments Ltd. Pegasus House | 37-43 Sackville Street | London W1S 3EH T +44 (0)20 3697 9580 | F +44 (0)20 3697 9501 | E marco.pabst@acpi.com www.acpi.com 20 DISCLAIMER This document is provided for informational purposes only. It does not constitute an offer to sell or a solicitation to buy any security or other financial instrument. While based on information believed to be reliable, no guarantee is given that it is accurate or complete. Any investments referred to may not be suitable for the specific investment objectives, financial situation or individual needs of recipients. Reliance should not be placed on the views and information expressed herein when making any individual investment and/or strategic decisions. You should also be aware that the value of investments and any income from them can go down as well as up, and you may not receive back the amount you originally invested. There can be no assurances that appreciation in value of investments will occur, or that currency fluctuations will not affect the outcomes of any investment adversely. Past performance of the index or individual funds is not a guide to future performance. Certain funds invest in emerging markets which by their nature are higher risk and potentially more volatile than those inherent in established markets. This material is for the use of intended recipients only and the contents may not be reproduced, redistributed, or copied in whole or in part for any purpose without the consent of the issuer of this document. Where foreign securities are included in collective investment schemes, there may be additional risks that arise because of events in different jurisdictions. These may include but are not limited to; potential constraints on liquidity and the repatriation of funds, macroeconomic risks, political risks, foreign exchange risks, tax risks, settlement risks and potential limitations on the availability of market information. Issued by ACPI Investment Ltd (Registered in England - Number 03781549, at 37-43 Sackville Street, London, W1S 3EH), which is authorised and regulated by the Financial Conduct Authority (Register Number 192403). Details can be found on the following link www.fca.org.uk/register. © 2017 ACPI Investments Limited. All rights reserved. No part of the website may be reproduced by any means, whether graphically, electronically, mechanically or otherwise howsoever, including without limitation photocopying and recording on magnetic tape, or included in any information store and/or retrieval system without the prior written permission of ACPI Investments Limited. UK – London Pegasus House 37-43 Sackville Street London W1S 3EH United Kingdom T +44 20 3697 9501 Channel Islands – Jersey Third Floor 7 The Esplanade St Helier JE2 3QA T +44 (0)1534 716444 South Africa – Johannesburg Block B Ground floor Riviera Road Office Park 6-10 Riviera Road Killarney 2193 T +27 11 771 5315