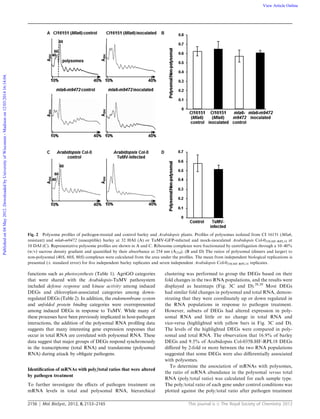
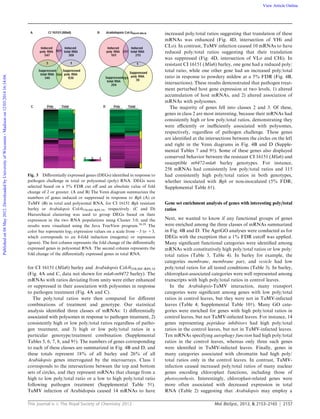
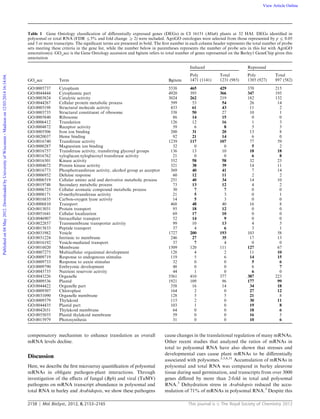
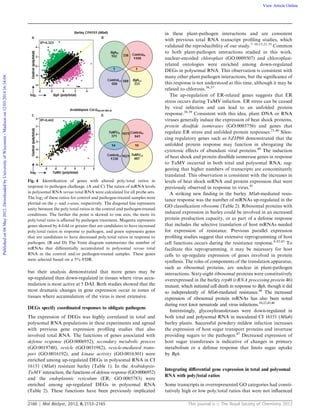
This document summarizes a study that analyzed gene expression in barley and Arabidopsis plants infected with powdery mildew and Turnip mosaic virus, respectively. The researchers extracted total RNA and polysome-associated (actively translated) RNA from infected and uninfected plants. Microarray analysis identified genes differentially expressed in total and polysomal RNA in response to infection. In barley, 3505 genes were differentially expressed in resistant plants infected with powdery mildew, but no genes were differentially expressed in susceptible plants. In Arabidopsis, 958 genes were differentially expressed in response to Turnip mosaic virus infection. Gene ontology analysis showed that differentially expressed genes were enriched for specific biological functions.

![This journal is c The Royal Society of Chemistry 2012 Mol. BioSyst., 2012, 8, 2153–2165 2161
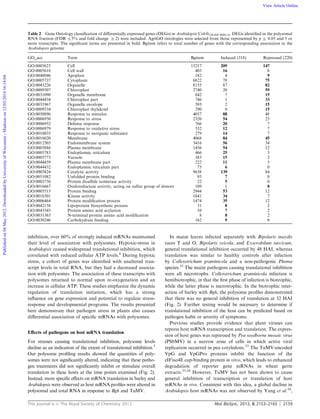
by pathogen treatment at the time points examined. In
barley, the terms cytoplasm (GO:0005737), cytoplasmic part
(GO:0044444), vesicle (GO:0031982), intrinsic to membrane
(GO:0031224), and membrane (GO:0016020) were enriched
among genes that had low poly/total ratios in inoculated
and control leaves from both genotypes. These GO categories
were also significant among induced DEGs during the barley
resistance response. Interestingly, the terms endoplasmic
reticulum (GO:0005783) and Golgi apparatus (GO:0005794),
which is associated with vesicles and membrane functions,
also have a relatively low poly/total ratio although they are
not enriched in the barley DEG list. In barley, genes encoding
SNARE proteins that mediate vesicle transport are associated
with resistance through the delivery of antimicrobial com-
pounds at the sites of attempted fungal penetration.48
The
expression of genes, such as these, with consistent poly/total
ratios is expected to be controlled more at the transcriptional
level than at the translational level during plant defense
responses.
DEGs annotated with chloroplast-related terms were mostly
down-regulated in response to pathogen stress in these hosts. In
barley, genes with chloroplast function had a high poly/total
ratio in control leaves. The decreased mRNA in both RNA
populations coupled with a shift of these transcripts away from a
relatively high poly/total ratio (Table 3) would be expected to
lead to a sharp decrease in nuclear-encoded chloroplast proteins.
This response correlates with reduced photosynthetic activity
during the resistance response.49
The decreased accumulation
of transcripts encoding chloroplast functions was also apparent
in the Arabidopsis-TuMV interaction. Interestingly in that inter-
action, a significant number of chloroplast associated transcripts,
including those specifying photosynthesis (GO:0015979)
responded to TuMV infection by becoming more highly asso-
ciated with polysomal RNA. This suggests the host attempted to
compensate for the decreased accumulation of transcripts from
these genes during viral infection. Thus, the expression of genes
with chloroplast functions appears to be regulated at multiple
levels and in different ways depending on the interaction.
Table 3 Gene Ontology classification of differentially associated barley mRNAs among the different treatment and genotype combinations.
mRNAs showing differential transcript accumulation in the polysomal and total RNA fractions (FDR r5%) were selected for analysis. AgriGO
ontologies are included if represented by a r1% FDR and 5 or more genes. The first number in each column header represents the total number of
probe sets meeting these criteria in the gene list, while the number below in parentheses represents the number of probe sets in this list with AgriGO
annotation(s). GO term is the Gene Ontology accession, bgitem refers to total number of genes represented on the Barley1 GeneChip given this
annotation, and p/t is the polysomal/total ratio
GO_acc Term Bgitem
Susceptible (mla6-m9472) Resistant [CI 16151 (Mla6)]
Control Inoculated Control Inoculated
High p/t Low p/t High p/t Low p/t High p/t Low p/t High p/t Low p/t
1178
(897)
1204
(911)
424
(358)
458
(322)
1505
(1256)
1098
(797)
529
(445)
923
(717)
GO:0009536 Plastid 1921 195 52 80 19 288 38 100 34
GO:0009507 Chloroplast 164 25 2 7 0 37 2 13 0
GO:0009579 Thylakoid 115 20 0 7 0 36 0 10 0
GO:0042651 Thylakoid membrane 64 14 0 0 0 23 0 7 0
GO:0044422 Organelle part 358 42 9 10 0 56 4 15 0
GO:0044435 Plastid part 103 19 1 5 0 28 1 9 0
GO:0031090 Organelle membrane 128 16 5 5 0 28 0 8 0
GO:0043234 Protein complex 223 19 7 10 0 34 3 15 0
GO:0005996 Monosaccharide metabolic process 12 3 1 2 0 6 0 5 2
GO:0006006 glucose metabolic process 10 3 0 2 0 6 0 5 0
GO:0006066 Alcohol metabolic process 16 3 3 2 0 6 0 5 0
GO:0044262 Cellular carbohydrate metabolic process 25 5 3 2 0 7 0 6 0
GO:0016469 Proton-transporting two-sector ATPase
complex
33 6 2 3 0 11 0 6 0
GO:0033178 Proton-transporting two-sector ATPase
complex, catalytic domain
19 5 1 2 0 7 0 5 0
GO:0045259 Proton-transporting ATP synthase
complex
24 5 0 3 0 9 0 6 0
GO:0045261 Proton-transporting ATP synthase
complex, catalytic core F(1)
14 4 0 2 0 6 0 5 0
GO:0016020 Membrane 1509 78 175 21 74 107 176 32 199
GO:0031224 Intrinsic to membrane 246 8 32 1 18 11 33 1 31
GO:0044425 Membrane part 318 15 38 5 18 24 33 7 32
GO:0031982 Vesicle 1727 44 252 13 89 54 221 15 194
GO:0005623 Cell 7408 432 580 190 198 615 496 221 476
GO:0044444 Cytoplasmic part 4920 294 383 137 133 429 318 152 290
GO:0005737 Cytoplasm 5538 322 427 161 139 483 348 178 321
GO:0016757 Transferase activity, transferring glycosyl
groups
136 5 12 3 13 6 20 1 18
GO:0016762 xyloglucan:xyloglucosyl transferase
activity
21 0 7 0 7 0 8 0 5
GO:0006810 Transport 468 14 41 8 16 27 39 8 42
GO:0005215 Transporter activity 362 15 36 6 17 20 31 3 42
GO:0005783 Endoplasmic reticulum 68 0 19 1 5 1 10 0 12
GO:0005794 Golgi apparatus 75 2 11 2 4 4 13 0 10
Publishedon04May2012.DownloadedbyUniversityofWisconsin-Madisonon12/03/201416:14:04. View Article Online](https://image.slidesharecdn.com/74277b7f-10a6-487f-b94a-6050ce328d89-151105123937-lva1-app6891/85/Moeller-2012pub-9-320.jpg)