Module 2: Learningobjectives
Understand the definition and purpose of data
analysis
Define statistical and M&E key concepts in data
analysis
3.
Data Analysis
Turningraw data into useful information
Purpose is to provide answers to questions being
asked at a program site or research questions
Even the greatest amount and best quality data
mean nothing if not properly analyzed – or if not
analyzed at all
4.
Data Analysis
Analysisdoes not mean using computer software
package
Analysis is looking at the data in light of the
questions you need to answer:
How would you analyze data to determine, “Is
my program meeting its objectives?”
5.
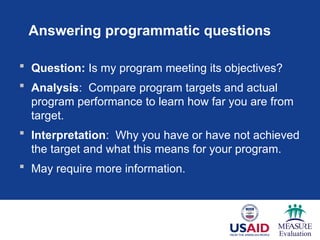
Answering programmatic questions
Question: Is my program meeting its objectives?
Analysis: Compare program targets and actual
program performance to learn how far you are from
target.
Interpretation: Why you have or have not achieved
the target and what this means for your program.
May require more information.
6.
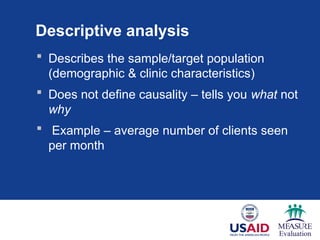
Descriptive analysis
Describesthe sample/target population
(demographic & clinic characteristics)
Does not define causality – tells you what not
why
Example – average number of clients seen
per month
7.
Basic terminology andconcepts
Statistical terms
Ratio
Proportion
Percentage
Rate
Mean
Median
8.
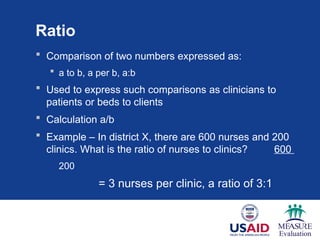
Ratio
Comparison oftwo numbers expressed as:
a to b, a per b, a:b
Used to express such comparisons as clinicians to
patients or beds to clients
Calculation a/b
Example – In district X, there are 600 nurses and 200
clinics. What is the ratio of nurses to clinics? 600
200
= 3 nurses per clinic, a ratio of 3:1
9.
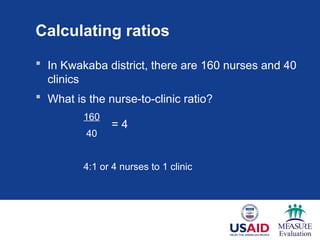
Calculating ratios
InKwakaba district, there are 160 nurses and 40
clinics
What is the nurse-to-clinic ratio?
160
40
4:1 or 4 nurses to 1 clinic
= 4
10.
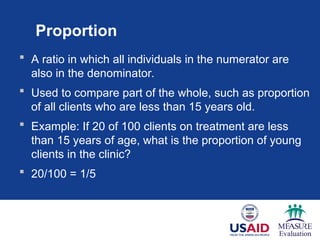
Proportion
A ratioin which all individuals in the numerator are
also in the denominator.
Used to compare part of the whole, such as proportion
of all clients who are less than 15 years old.
Example: If 20 of 100 clients on treatment are less
than 15 years of age, what is the proportion of young
clients in the clinic?
20/100 = 1/5
11.
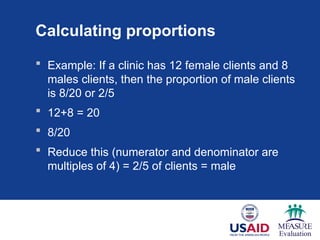
Calculating proportions
Example:If a clinic has 12 female clients and 8
males clients, then the proportion of male clients
is 8/20 or 2/5
12+8 = 20
8/20
Reduce this (numerator and denominator are
multiples of 4) = 2/5 of clients = male
12.
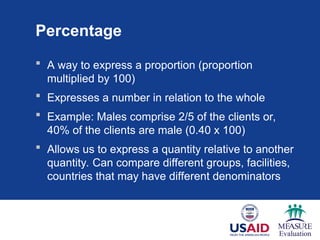
Percentage
A wayto express a proportion (proportion
multiplied by 100)
Expresses a number in relation to the whole
Example: Males comprise 2/5 of the clients or,
40% of the clients are male (0.40 x 100)
Allows us to express a quantity relative to another
quantity. Can compare different groups, facilities,
countries that may have different denominators
13.
Rate
Measured withrespect to another measured
quantity during the same time period
Used to express the frequency of specific events
in a certain time period (fertility rate, mortality
rate)
Numerator and denominator must be from same
time period
Often expressed as a ratio (per 1,000)
Source: U.S. Census Bureau, International Database.
14.
Mortality rate
Calculation
# of deaths ÷ population at risk in same time
period x 1,000
Example – 600 women delivered. Of these, 10
died of obstructed labor
10/600 = .016 x 1,000 = 16.6
17 women died of obstructed labor per 1,000 live
births
15.
Calculating mortality rate
In2009, Mondello Clinic had 31,155 patients on
ART. During that same time period, 1,536 ART
clients died.
1,536
31,155
=
49 clients died
(mortality rate) per
1,000 clients on
ART
.049 x 1000 = 49
16.
Rate of increase
Calculation
Total number of increase ÷ time of increase
Used to calculate monthly, quarterly, yearly
increase in health service delivery. Example:
increase in # of new clients, commodities distributed
Example: Condom distribution in Jan. = 200; as of
June = 1,100. What is the rate of increase?
1,100 – 200 = 900/6 = 150 condoms per mo
17.
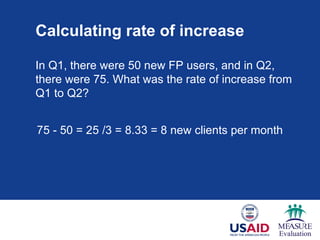
Calculating rate ofincrease
In Q1, there were 50 new FP users, and in Q2,
there were 75. What was the rate of increase from
Q1 to Q2?
75 - 50 = 25 /3 = 8.33 = 8 new clients per month
Mean
The averageof your dataset
The value obtained by dividing the sum of a set
of quantities by the number of quantities in the
set.
Example: (22+18+30+19+37+33) = 159 ÷ 6 =
26.5
The mean is sensitive to extreme values
20.
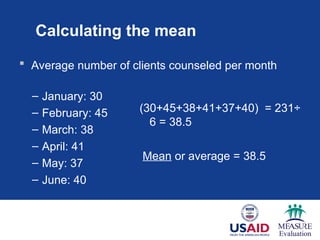
Calculating the mean
Average number of clients counseled per month
– January: 30
– February: 45
– March: 38
– April: 41
– May: 37
– June: 40
(30+45+38+41+37+40) = 231÷
6 = 38.5
Mean or average = 38.5
21.
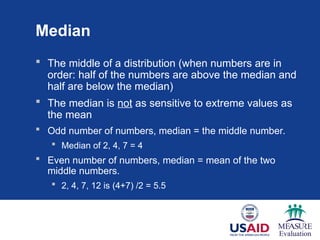
Median
The middleof a distribution (when numbers are in
order: half of the numbers are above the median and
half are below the median)
The median is not as sensitive to extreme values as
the mean
Odd number of numbers, median = the middle number.
Median of 2, 4, 7 = 4
Even number of numbers, median = mean of the two
middle numbers.
2, 4, 7, 12 is (4+7) /2 = 5.5
Key messages
Purposeof analysis is to provide answers to
programmatic questions
Descriptive analyses describe the sample/target
population.
Descriptive analyses do not define causality – tell
you what not why
Editor's Notes
#1 Now that we have discussed:
The value of data to program improvement
The role of the provider in the decision-making process
The context of decision making…
It is time to move on to some key concepts in data analysis. In this session, we’ll review the most common data analysis terms and techniques used for descriptive data analysis. Then, in the next session, we’ll apply these techniques to the monitoring of health service delivery.
#2 At the end of the session the learner will:
Note to facilitator: Read slide.
#3 It is important to note that while the terms data and information often are used interchangeably, there is a distinction.
The term ‘data’ refers to raw, unprocessed numbers, measurements, or text.
The term ‘information’ refers to data that are processed, organized, structured, or presented in a specific context. The process of transforming data into information is data analysis.
Note to facilitator: Read slide.
#4 Data analysis does not necessarily mean using a complicated computer analysis package. It means taking the data that you collect and looking at them in comparison to the questions that you need to answer.
For example, if you need to know whether your program is meeting its objectives – or if it’s on track – you would look at your program targets and compare them to the actual program performance. This is analysis.
Later, we will take this one step further and talk about interpretation. (Example: through analysis, you find that your program achieved only 10% of its target; now you have to figure out why.)
#5 In this course, we talk a lot about answering programmatic questions. Let’s take a minute to discuss what that means.
Suppose you need to know if your program is on track; in this case, you would probably look at your program targets and compare them to the actual program performance. This is analysis.
Interpretation is using the analysis to further understand your findings and the implications for your program. In many cases, this means using additional information, such as vital statistics, population-based surveys, and qualitative data to supplement the routine service statistics. We will talk more about this later in the workshop.
Note to facilitator: Read slide.
#6 The world of data analysis is vast and can be complex. In this course, we focus on descriptive analyses that will be most helpful in the health facility setting. This module reviews the most common data analysis terms and techniques used for descriptive analysis. In the next session, we’ll apply these techniques to M&E.
Note to facilitator: Read slide.
#7 This slide lists the basic statistical terms used in data analysis that we will cover in this session.
#8 A ratio is a comparison of two numbers and is expressed as “a to b” or “a per b.” In the health sector, we commonly use ratios to look at the number of clinicians to patients, or beds to clients.
To calculate a ratio, divide the first item you are looking at by the second. So, if you were to say that there are 3 staff per clinic, the ratio is expressed numerically as 3:1. It is not the same as saying 1 to 3 or 1:3. The order of the numbers matters.
Note the example here where we see that district X has 600 nurses and 200 clinics. To find the ratio of nurses to clinics, we divide 600 by 200. The answer is 3, or 3 nurses per clinic.
#9 Now let’s try one together. Let say in the Kwakaba district, there are 160 nurses and 40 clinics. Who wants to volunteer to calculate the nurse-to-clinic ratio?
Note to facilitator: Wait for a participant to answer before responding.
4
4:1
4 nurses per clinic
#10 A proportion is a ratio in which all individuals included in the numerator must also be included in the denominator.
We frequently use a proportion to compare part of the whole, such as proportion of all clients who stop taking their drugs.
For example: If 20 of 100 clients on treatment stop taking their drugs, what is the proportion of treatment failures to all treated?
20/100 = 1/5
#11 Let’s try one together. Who wants to volunteer to answer this? If a clinic has 12 female clients and 8 male clients, what is the proportion of male clients?
Note to facilitator: Wait for a participant to answer before responding.
Add males to females to get the total number of clients. That is, 12+8 = 20. Now you know that 20 is your total, so it is the denominator. The number of males, 8, is your numerator, so you have eight-twentieths (8/20) who are male. But then you reduce this proportion by dividing both the numerator and denominator by 4 (both numbers are multiples of 4) to get 2/5. So you know that 2/5 of clients are male.
#12 A percentage is a way to express a proportion multiplied by 100. It expresses a number in relation to the whole.
Using the previous example, we saw that two-fifths of the clients are male. To make this a percentage, we convert the fraction to a decimal (2/5 = 0.40) and multiply by 100 (0.40 x 100 = 40%).
A percentage allows us to express a quantity relative to another quantity. It allows us to compare different groups, facilities, or countries that may have different denominators because they represent a fraction of 100.
#14 Let’s look specifically at mortality rate. The calculation for a mortality rate is the number of deaths in the population at risk divided by the population at risk in same time period, and then multiplied times 1,000. Mortality rate is always expressed in units of death per 1,000 individuals.
Example: During June – August 2009, 600 women delivered live babies. Of these women, 10 died of obstructed labor (during the same time period).
To calculate the mortality rate, you divide 10 by 600 = 0.016 x 1,000 = 16.6.
The maternal mortality rate due to obstructed labor is nearly 17.
#15 Let’s try one together. In 2009, Mondello Clinic had 31,155 patients on ART. During that same time period, 1,536 ART clients died. How many clients (per 1,000 clients on ART) died? Who wants to volunteer to calculate mortality rate?
Note to facilitator: Wait for a participant to answer before responding.
Divide the number of clients who have died by the cumulative number of clients on ART. In this case, we can see that the mortality rate is 49 deaths per 1,000 clients on ART.
#16 Now let’s look at the rate of increase. Calculating the rate of increase in health service delivery can be a helpful way to assess progress. You can look at the rate of increase for many things, such as the increase in new clients to your service or the increase in commodities distributed.
For example, Mondello clinic distributed 200 condoms in January and by June, they had distributed 1,100. You calculate the rate of increase this way: Subtract the January number from the higher number in June (1,100 – 200 = 900). This number is then divided by 6, the number of months (900 ÷ 6 = 150). So, 150 more condoms were distributed per month.
#17 Let’s do an example together. Who wants to volunteer to calculate the rate of increase from quarter one to quarter 2?
In Mondello family planning clinic there were 50 new FP users in quarter 1 (January through March) and 75 in quarter 2 (April through June). What was the rate of increase?
Note to facilitator: Wait for a participant to answer before responding.
Determine the # of new users from quarter 1 to quarter 2 (75 – 50 = 25), then divide by 3 (the number of months that the increase happened, or April – June).
8.33 new, or approximately 8 new clients per month.
#18 Now let’s talk about central tendency.
The most commonly investigated characteristic of a collection of data (or dataset) is its center, or the point around which the observations tend to cluster. Measures of central tendency measure the middle or center of a distribution of data.
We will discuss the mean and the median.
#19 The mean is the most frequently used measure to look at the central values of a dataset.
The mean takes into consideration the magnitude of every value, which makes it sensitive to extreme values. If there are data in the dataset with extreme values – extremely low or high compared to most other values in the dataset – the mean may not be the most accurate method to use in assessing the point around which the observations tend to cluster.
Use the mean when the data are normally distributed (symmetric).
To calculate the mean, you add up all your figures (total is 159) and divide by the total number of figures (6), like in the example here.
#20 Let’s do one together. Who wants to volunteer to answer to calculate the average number of clients counseled per month?
Note to facilitator: Wait for a participant to answer before responding.
On this slide, you see the number of total clients counseled per month from Jan. through June.
You add them together to get 231 and divide by 6 (the number of months). So 231 ÷ 6 = 38.5. This is the average number of clients counseled per month, or the mean.
#21 The median is another measurement of central tendency but it is not as sensitive to extreme values as the mean because it takes into consideration the ordering and relative magnitude of the values. We therefore use the median when data are not symmetric or skewed.
If a list of values is ranked from smallest to largest, then half of the values are greater than or equal to the median and the other half are less than or equal to it.
When there is an odd number of values, the median is the middle value.
For example, for the first list on the slide (2, 4, 7), the median is 4.
When there is an even number of values, the median is the average of the two mid-point values.
For example, in the second list (2, 4, 7, 12), you add the two middle numbers, 4+7, to get 11, and then divide that by 2. For this list, the median is 5.5.
Remember, with the median you have to rank (or order) the figures before you can calculate it.
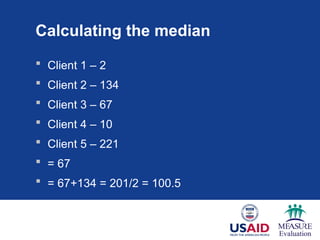
#22 Let’s do one together. Who wants to volunteer to find the median number of clients?
Note to facilitator: Wait for a participant to answer before responding.
Here, we have an odd number of clients, so we re-order the numbers and select the middle number = 67.
What if we have an even number? (Facilitator – click for the first client to disappear.) In this case, we reorder the numbers from smallest to largest, add the two middle figures 67+134, and divide by 2 to get 100.5.
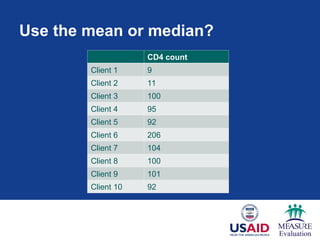
#23 Now, let’s look at this example. Do we use the mean or the median?
Note to facilitator: Wait for a participant to answer before responding.
We can see that there are a few outliers that may skew the data, so we want to use the median.
If we rank the values in the table, we get: 9.0, 11.0, 92, 92, 95, 100, 100, 101, 104, 206.
Since there is an even number of observations, the median is calculated as 95+100 = 195/2 = 97.5
#24 We have come to the end of Module 2 on the key concepts in data analysis. The key messages of this module include:
Note to facilitator: Read slide.