The Modern Guideto
Container Monitoring
and Orchestration
Since the introduction of the concept in 2013, containers
have become the buzz of the IT world. It’s easy to see why:
Application container technology is revolutionizing app
development, bringing previously unimagined flexibility and
efficiency to the development process.
Businesses are embracing containers in droves. According
to Gartner, more than 85% of global enterprises will be
running containerized applications in production by 2025,
up from less than 35% in 2019. Mass adoption makes it
clear that organizations need to adopt a container-based
development approach to stay competitive.
Let’s look at what’s involved with containerization and how
your organization can gain an edge.
2
3
What is a container?
The easiest way to understand the concept of a container is to
consider its namesake. A physical container is a receptacle used to
hold and transport goods from one location to another.
A software container performs a similar function. It allows you to
package up an application’s code, configuration files, libraries, system
tools and everything else needed to execute that app into a self-
contained unit, so you can move and run it anywhere.
Containers are a key component of a “microservices” approach. This
approach breaks applications down into single-function modules
that are accessed only when they’re needed. A developer can modify
and redeploy a particular service — not the whole application —
whenever changes are required.
4
A VM abstracts hardware to turn a physical server into several
virtual ones. It does so by running on top of a hypervisor, which
itself runs on a physical computer called the “host machine.” The
hypervisor is essentially a coordination system that arbitrates access
to the host machine’s resources — CPU, RAM, etc. — making them
available to the VM or “guest machine.” The apps and everything
required to run them, including libraries and system binaries, are
contained in the guest machine. Each guest machine also includes
a complete operating system of its own. So a server running four
VMs, for example, would have four operating systems in addition to
the hypervisor coordinating them all. That’s a lot of demand on one
machine’s resources, and things can bog down in a hurry, ultimately
limiting how many VMs a single server can operate.
Containers, on the other hand, abstract at the operating system
level. A single host operating system runs on the host (this can be
a physical server, VM or cloud host), and the containers — using a
containerization engine like the Docker Engine — share that OS’s
kernel with other containers, each with its own isolated user space.
There’s much less overhead here than with a virtual machine, and as a
result, containers are far more lightweight and resource-efficient than
VMs — allowing for much greater utilization of server resources.
Why are containers
such a big deal?
Containers remedy an all-too-common problem in operations: getting
software to run reliably and uniformly no matter where it is deployed.
As an app moves from one computing environment to another — from
staging to production, for example — it can run into problems if the
operating system, network topology, security policies or other aspects
of the environment are different. Containers isolate the app from its
environment, abstracting away these environmental differences.
Containers also prevent issues due to different components requiring
different versions of the same shared library or other dependency, by
including all the dependencies within the container.
Prior to containers, virtual machines (VMs) were the primary method
for running many isolated applications on a single server. Like
containers, VMs abstract away a machine’s underlying infrastructure
so that hardware and software changes won’t affect app performance.
But there are significant differences to how each does this.
5
5 benefits
of deploying
containers
A container-based infrastructure offers a host of benefits.
Here are the five biggest.
1. Speed of delivery — Applications installed on a virtual machine
typically take several minutes to launch. Containers don’t have
to wait for an operating system boot, so they can start up in
a fraction of a second. They also run faster since they use
fewer host OS resources, and they only take a few seconds to
create, clone or destroy. All of this has a dramatic impact on the
development process, allowing organizations to more quickly get
software to market, fix bugs and add new features.
2. DevOps-first approach — The speed, small footprint and resource
efficiency of microservice-based containers make them ideal for a
DevOps environment. A microservice-based infrastructure enables
developers to own specific parts of the application end-to-end,
making sure that they can fully understand how it works, optimize
its performance, and troubleshoot any issues more efficiently than
with monolithic applications.
3. Portability — Containers pack up the app and all of its
dependencies. That makes it easy to move and reliably run
containers on Windows, Linux or Mac hardware. Containers can
run on bare metal or on virtual servers, and within public or private
clouds. This also helps avoid vendor lock-in should you need to
move your apps from one public cloud environment to another.
4. Increased scalability — Containers tend to be small because
they don’t require a separate OS the way that VMs do. One
container is typically sized on the order of tens of megabytes,
whereas a single VM can be tens of gigabytes — roughly 1,000
times the size of a container. That efficiency allows you to
store many more containers on a single host operating system,
increasing scalability.
5. Consistency — Because containers retain all dependencies and
configuration internally, they ensure developers are able to work
in a consistent environment regardless of where the containers
are deployed. That means developers won’t have to waste time
troubleshooting environmental differences and can focus on
addressing new app functionality. It also means you can take
the same container from development to production when it’s
time to go live. Finally, because containers are immutable once
created, developers don’t have to worry about configuration
differences across the deployment or other sources of
troubleshooting difficulty.
6
Orchestration 101:
using Kubernetes
To get started with container orchestration, you need specialized
software to deploy, manage and scale containerized applications. One
of the most well-established and popular choices today is Kubernetes,
an open-source automation platform developed by Google and now
managed by the Cloud Native Computing Foundation.
Kubernetes can dramatically enhance the development process by
simplifying container management, automating updates and scaling,
and minimizing downtime so developers can focus on improving and
adding new features to applications. To better understand how, let’s
look at Kubernetes’ basic components and how they work together.
Kubernetes uses multiple layers of abstraction defined within its own
unique language. There are many parts to Kubernetes. This list isn’t
exhaustive, but it provides a simplified look at how hardware and
software is represented in the system.
Nodes: In Kubernetes lingo, any single “worker machine” is a node. It
can be a physical server or virtual machine on a cloud provider such
as AWS or Microsoft Azure. Nodes were originally called “minions,”
which gives you an idea of their purpose. They receive and perform
tasks assigned from the master node and contain all the services
required to manage and assign resources to containers.
Master node: This is the machine that orchestrates all the worker
nodes and is your point of interaction with Kubernetes. All assigned
tasks originate here.
Cluster: A cluster represents a master node and several worker
nodes. Clusters consolidate all of these machines into a single,
powerful unit. Containerized applications are deployed to a cluster,
and the cluster distributes the workload to various nodes, shifting
work around as nodes are added or removed.
Pods: A pod represents a collection of containers packaged together
and deployed to a node. All containers within a pod share a local
network and other resources. They can talk to each other as if
they were on the same machine, but they remain isolated from one
another. At the same time, pods isolate network and storage away
from the underlying container.
A single worker node can contain multiple pods. If a node goes down,
Kubernetes can deploy a replacement pod to a functioning node.
Despite a pod being able to hold many containers, it’s recommended
they wrap up only as many as needed: a main process and its helper
containers, which are called “sidecars.” Pods scale as a unit no matter
what their individual needs are and overstuffed pods can be a drain
on resources.
Deployments: Instead of directly deploying pods to a cluster,
Kubernetes uses an additional abstraction layer called a “deployment.”
A deployment enables you to designate how many replicas of a pod
you want running simultaneously. Once it deploys that number of pods
to a cluster, it will continue to monitor them and automatically recreate
and redeploy a pod if it fails.
Ingress: Kubernetes isolates pods from the outside world, so you
need to open a communication channel to any service you want to
expose. This is another abstraction layer called “ingress.” There are a
few ways to add ingress to a cluster, including adding a LoadBalancer,
NodePort or Ingress controller. Think of this as the internet-facing
web server you may have used in traditional architecture.
7
What challenges
do Kubernetes and
containerization
present for
monitoring?
For all the benefits that containers and orchestration frameworks
bring to organizations, they can also make cloud-based application
management more complex. Some of the challenges they present
include:
• Significant blind spots — Containers are designed to be
disposable. Because of this, they introduce several layers
of abstraction between the application and the underlying
hardware to ensure portability and scalability. This all
contributes to a significant blind spot when it comes to
conventional monitoring. Traditional monitoring tools aren’t
capable of understanding these abstractions.
• Increased volume of data — The easy portability of so many
interdependent components creates an increased need
to maintain telemetry data to ensure observability into the
performance and reliability of the application, container and
orchestration platform. Many microservice architectures are
built to scale up microservices when needed and destroy them
when not. This ephemerality also increases the need to have data
streamed into an observability system. Additional components
added to the system also increase how many things must be
monitored and checked when things go wrong.
• The importance of visualizations — The scale and complexity
introduced by microservices, containers and container
orchestration requires the ability to both visualize the environment
to gain immediate insight into your infrastructure health and to
determine how traffic is flowing within your environment. You also
need to be able to zoom in and view the health and performance of
containers, nodes and pods. The right monitoring solution should
provide this workflow.
• Pacing for DevOps — Containers can be scaled and modified
with lightning speed. This accelerated deployment pace makes
it more challenging for DevOps teams to track how application
performance is impacted across deployments, or even to
understand when new service dependencies are added.
8
How to implement
containers
A good container monitoring solution will enable you to stay on
top of your dynamic container-based environment by unifying
container data with other infrastructure data to provide better
contextualization and root cause analysis. Let’s look at ways you can
provide several layers of monitoring for Docker, the most popular
implementation.
Hosts: The physical and virtual machines in your clusters can be
monitored for availability and performance. Key metrics to track
include memory, CPU usage, swap space used and storage utilization.
This should be a core capability of any container monitoring tool.
Containers: Visibility into your containers in aggregate and
individually is critical. A monitoring tool can provide information on
the number of currently running containers, the containers using the
most memory and the most recently started container. It can also
provide insight into each container’s CPU and memory utilization,
and the health of its network I/O.
Orchestration framework: Kubernetes itself also needs to be
monitored. How many available nodes are there? What’s the health
of the master node? Are there any pods pending reassignment
for long periods? What volume of traffic is moving through your
ingress? You need to be able to answer all of these questions quickly
to continue operating reliable services. Additionally, the nature of
Kubernetes means that pods are scheduled to optimize resource
utilization. This increases efficiency, but also adds unpredictability
about where pods are deployed and run.
Application endpoints: Determining when your service is able to
handle user requests and the performance and latency of these
requests is also vital. Your monitoring solution must also perform
health checks on the application itself and determine latency and
other performance metrics.
9
What features are
necessary to monitor
these applications?
As we’ve discussed, containerization of applications and use of
orchestration frameworks like Kubernetes create many benefits
for modern development and deployment workflows. However,
monitoring these environments and applications is far more
complicated than using legacy tools. A monitoring solution that’s
ready for containers and orchestration workflows must be able to
provide these features.
Collection of key metrics
Pod metrics: Number of desired pods, number of available pods, pods
by phase (failed, pending, running), desired pods per deployment
Resource utilization metrics: Docker Socket-collected metrics
(container and node-level resource metrics, e.g., CPU and memory
usage)
Application metrics: RED metrics (rate, error, duration); application
health; database availability and performance
Consolidation, correlation, and analysis features
Easy deployment: Deployment of collectors must be easy and cloud-
native. Ideally, a helm chart is available. Deployment can be as easy as:
helm repo add splunk-otel-collector-chart https://
signalfx.github.io/splunk-otel-collector-chart
helm repo update
helm install --set splunkAccessToken=’xxx’ --set
clusterName=’sample’ --set splunkRealm=’us0’ --set
otelCollector.enabled=’true’ --generate-name splunk-
otel-collector-chart/splunk-otel-collector
Avoidance of lock-in: OpenTelemetry is the future of monitoring
technology, and instrumentation of your environment must account
for the fact that you may decide to change monitoring or observability
providers. It’s essential that the solution you adopt supports
OpenTelemetry so that you aren’t required to redo instrumentation
work if you move.
Real-time, streaming platform: In a world where downtime can cost
hundreds of thousands of dollars per hour, seconds count. A modern
monitoring and observability platform must be able to provide alerts
and analyze data in real time to minimize MTTD and to make sure
that the conclusions you’re drawing from the data are based on the
current state of the system.
Predictive analytics: Based on AI and ML, predictive analytics
tools can tell you things are about to fail before they fail. Given the
complexity of modern environments, this can prevent issues from
even happening and help you detect potential performance and
availability issues before they impact your customers.
10
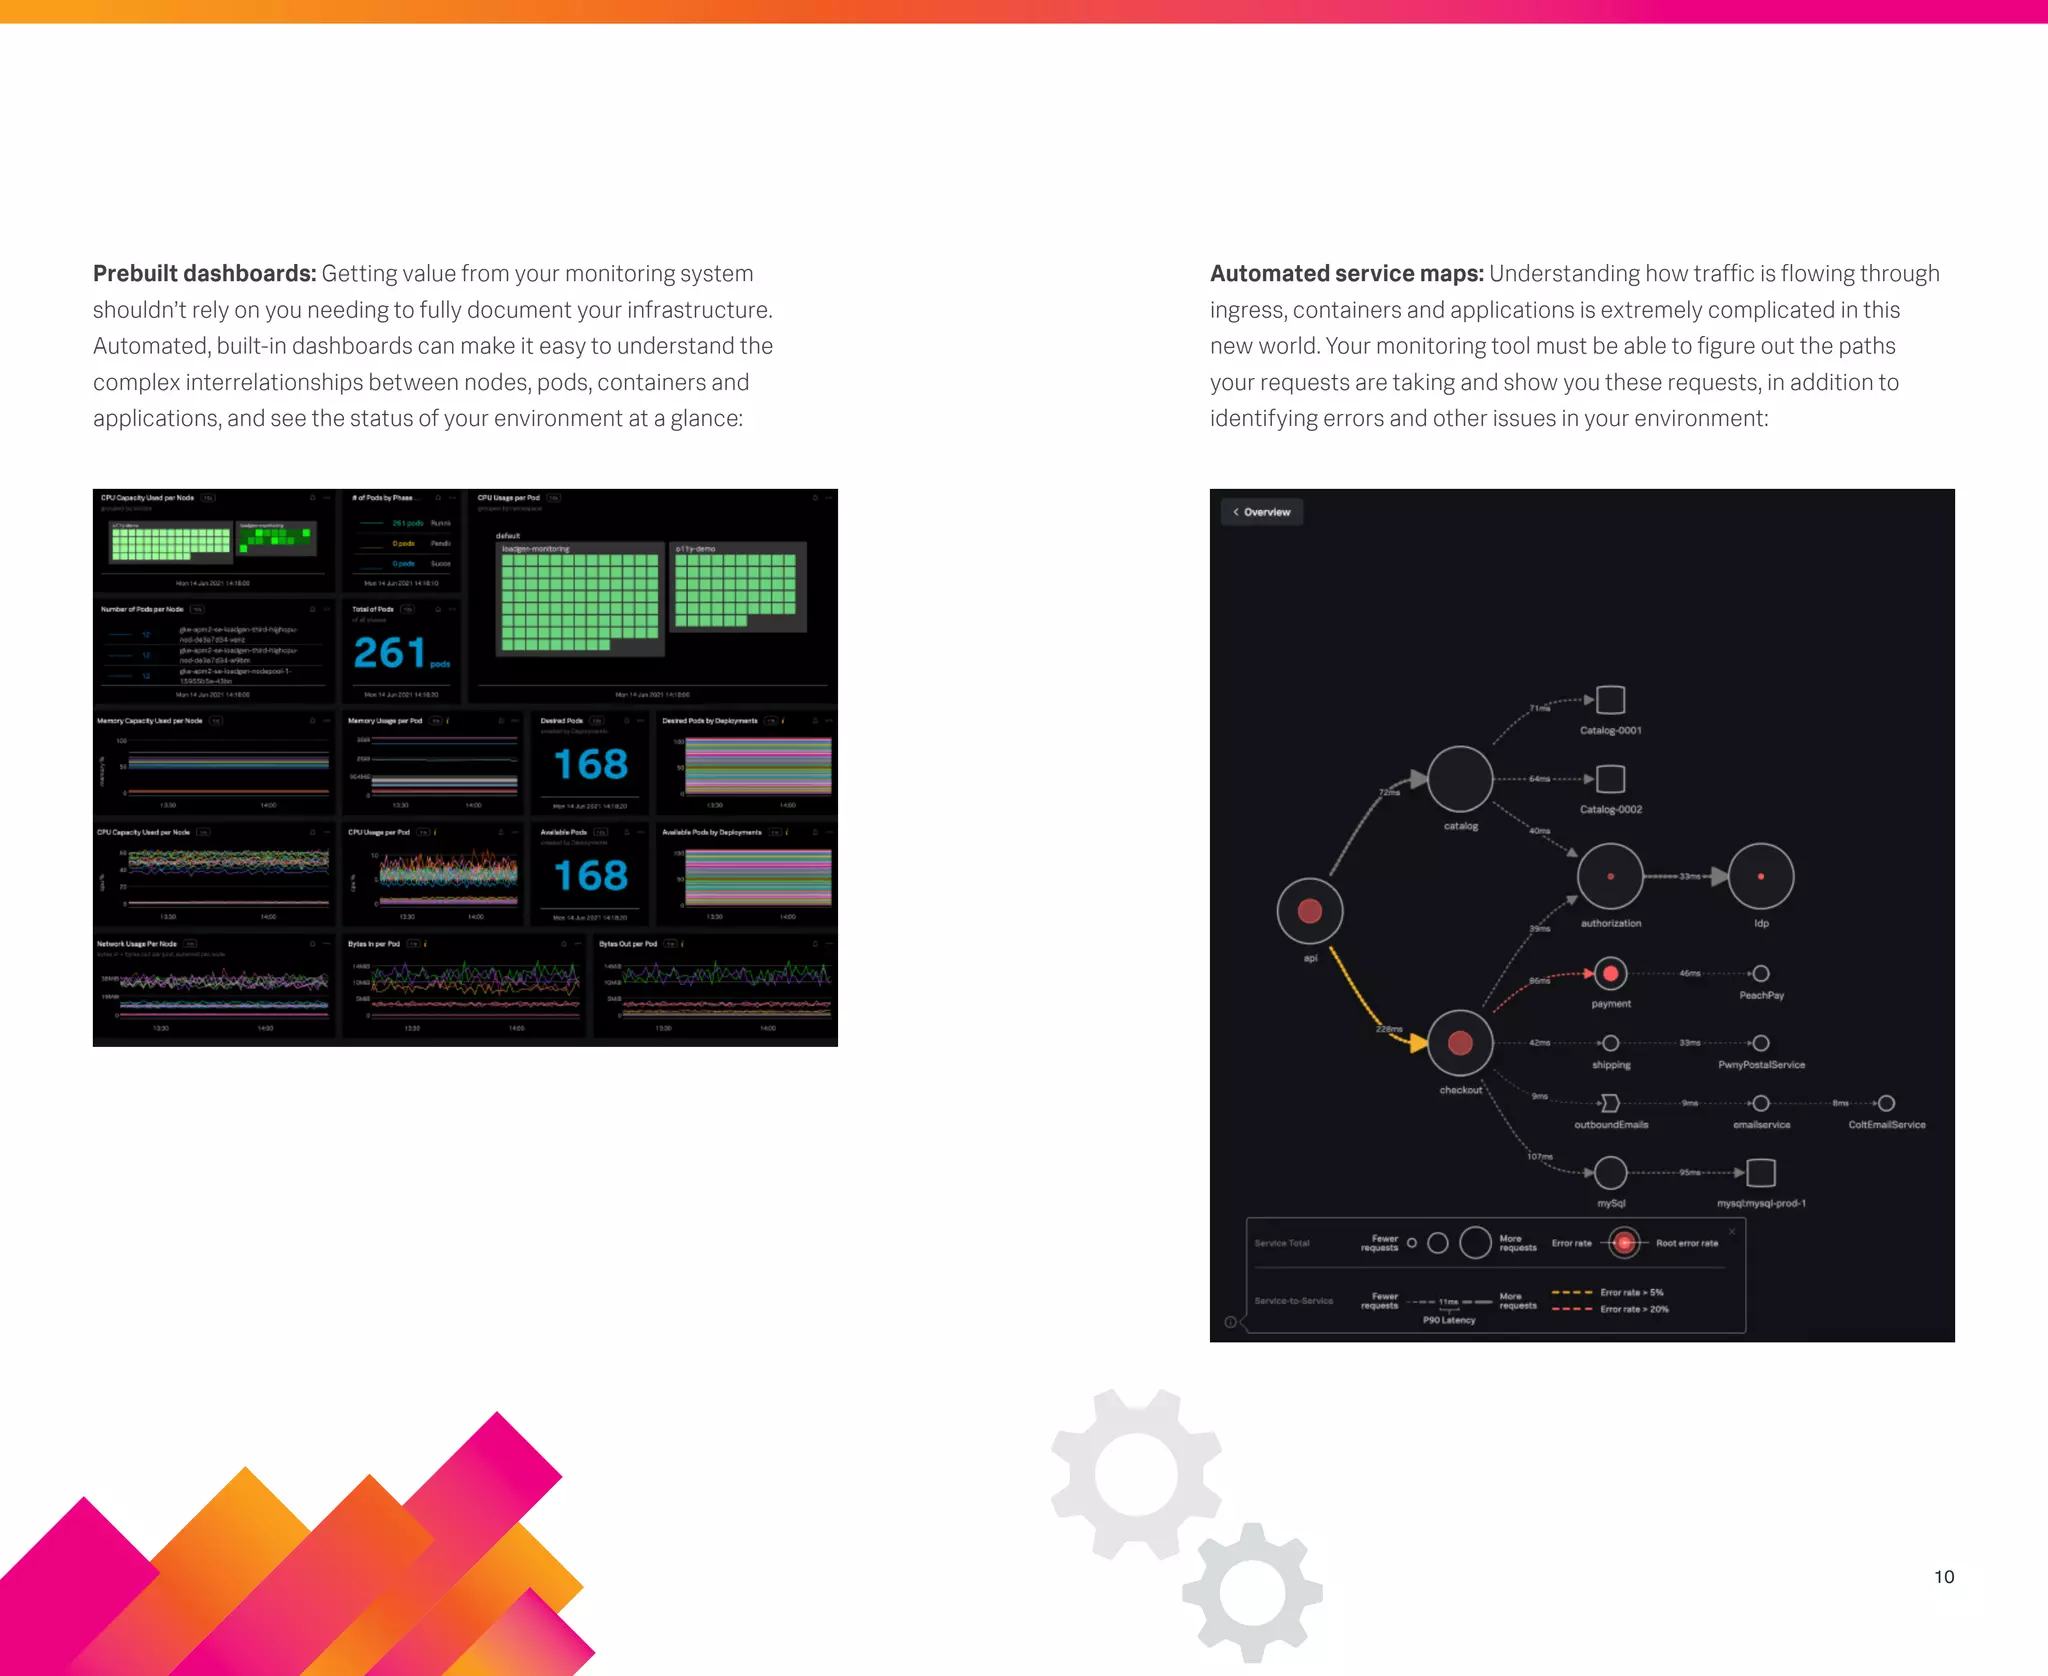
Prebuilt dashboards: Getting value from your monitoring system
shouldn’t rely on you needing to fully document your infrastructure.
Automated, built-in dashboards can make it easy to understand the
complex interrelationships between nodes, pods, containers and
applications, and see the status of your environment at a glance:
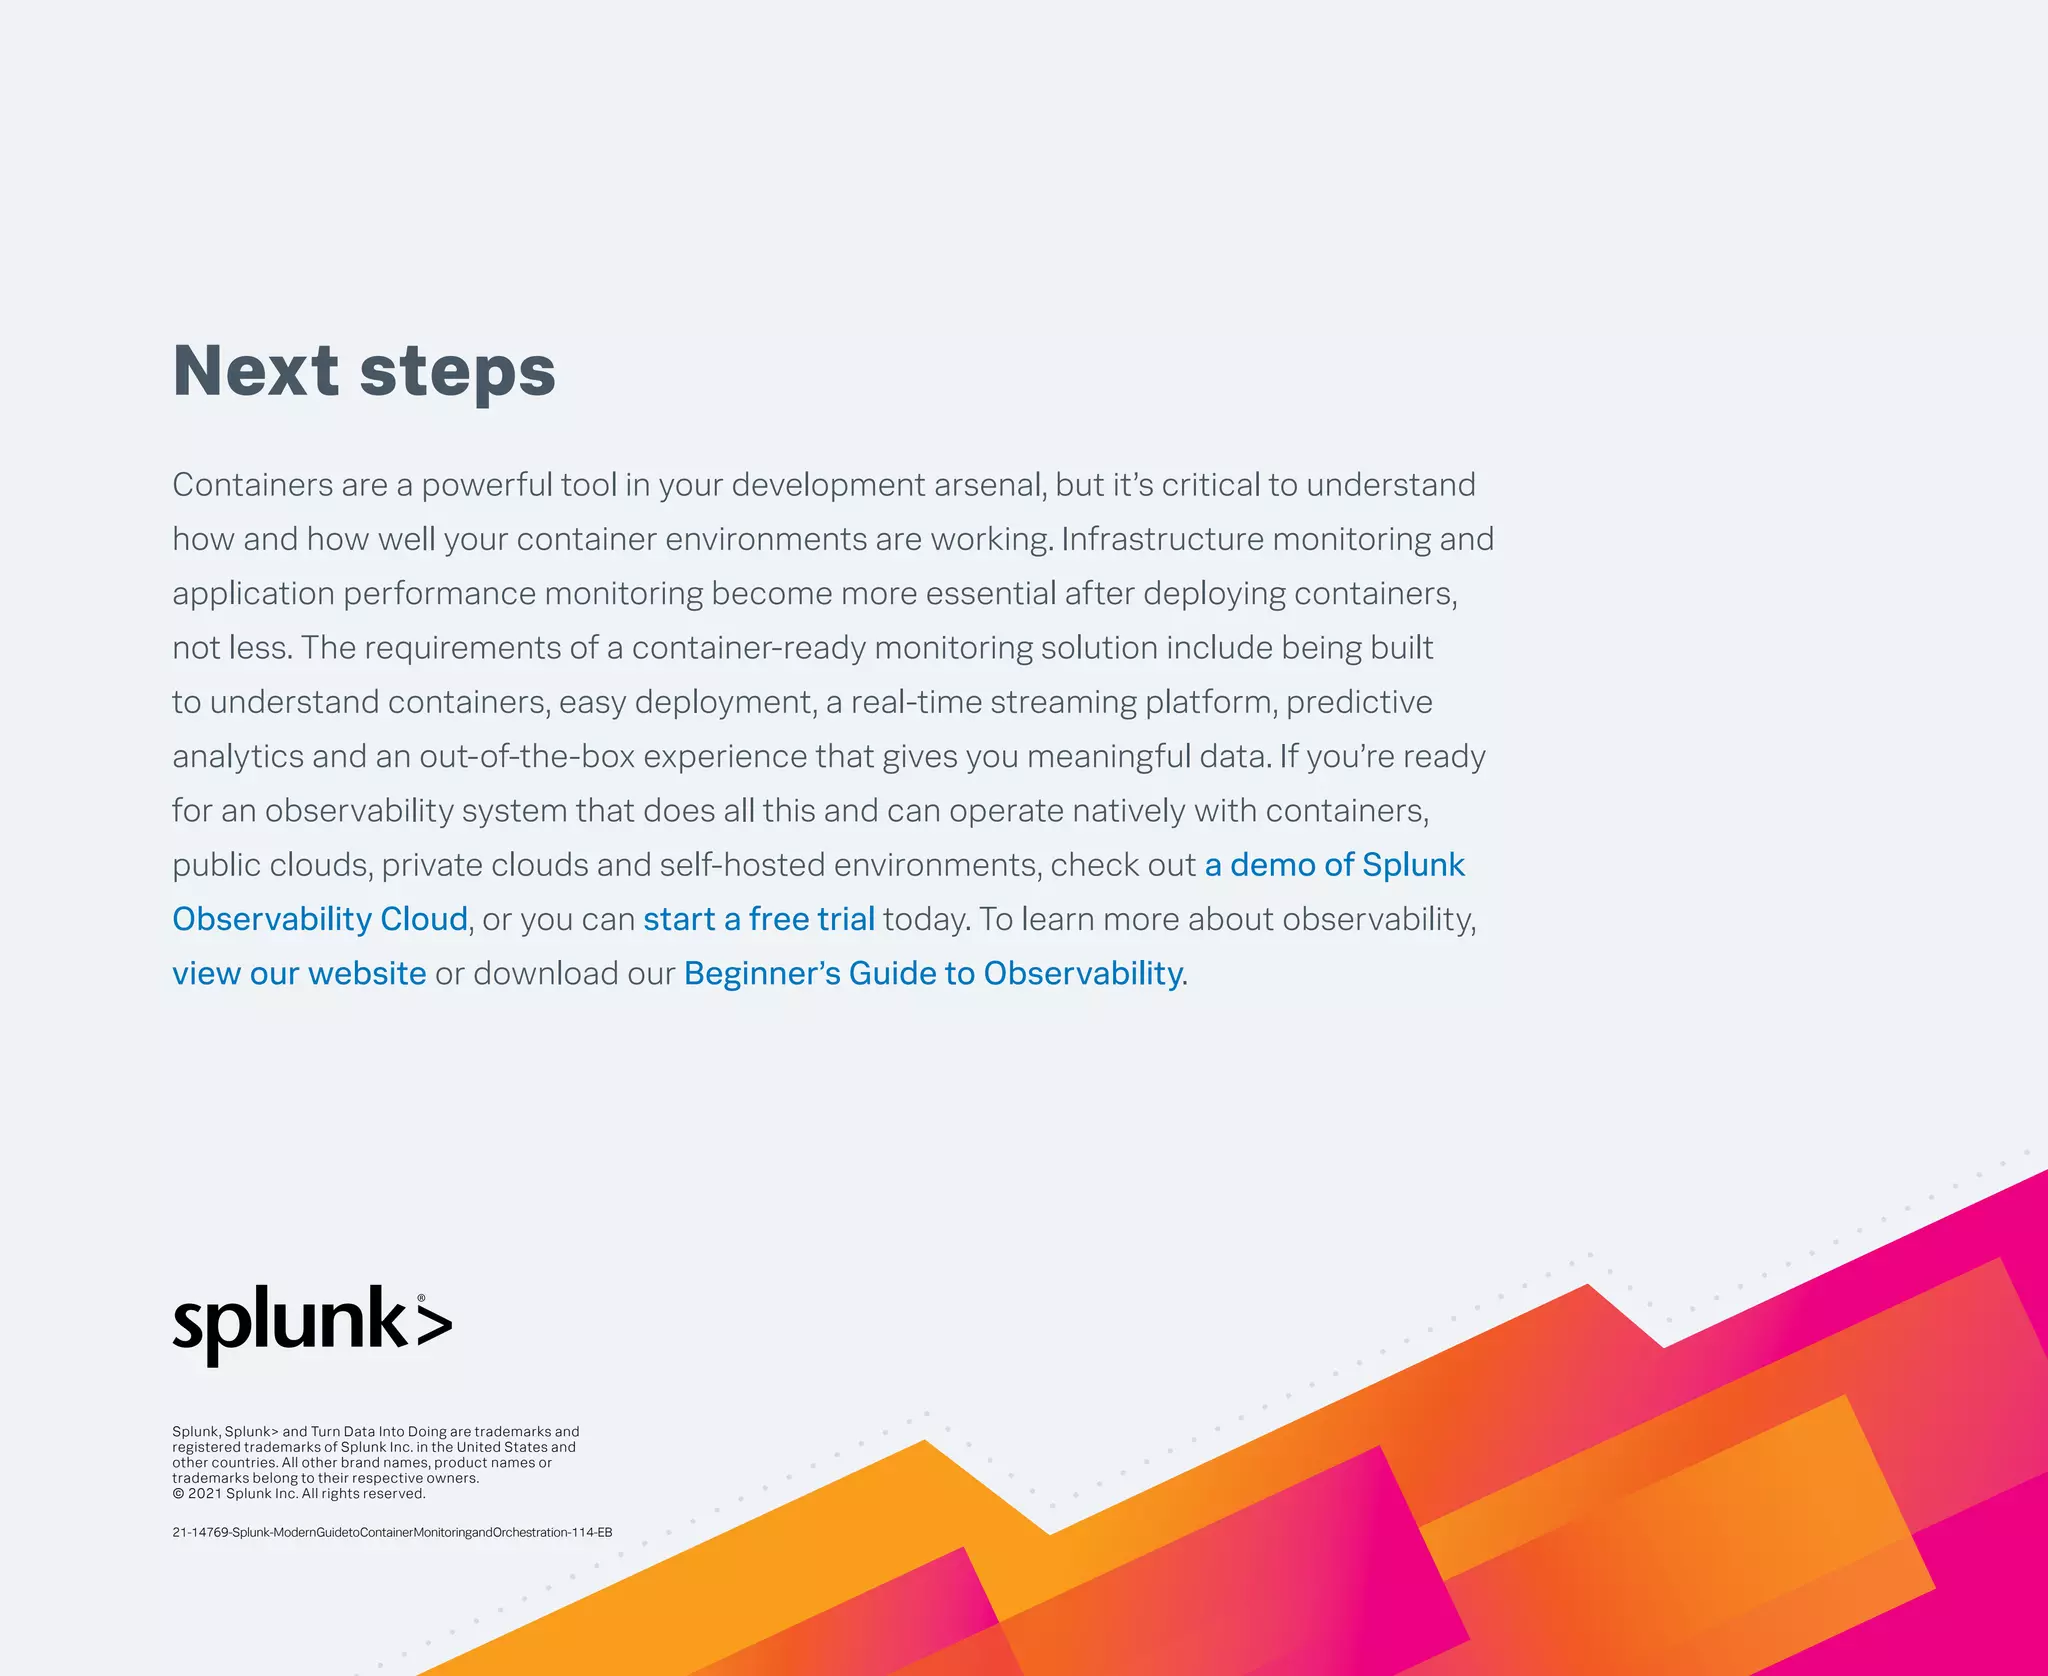
Automated service maps: Understanding how traffic is flowing through
ingress, containers and applications is extremely complicated in this
new world. Your monitoring tool must be able to figure out the paths
your requests are taking and show you these requests, in addition to
identifying errors and other issues in your environment:
Next steps
Containers are a powerful tool in your development arsenal, but it’s critical to understand
how and how well your container environments are working. Infrastructure monitoring and
application performance monitoring become more essential after deploying containers,
not less. The requirements of a container-ready monitoring solution include being built
to understand containers, easy deployment, a real-time streaming platform, predictive
analytics and an out-of-the-box experience that gives you meaningful data. If you’re ready
for an observability system that does all this and can operate natively with containers,
public clouds, private clouds and self-hosted environments, check out a demo of Splunk
Observability Cloud, or you can start a free trial today. To learn more about observability,
view our website or download our Beginner’s Guide to Observability.
Splunk, Splunk> and Turn Data Into Doing are trademarks and
registered trademarks of Splunk Inc. in the United States and
other countries. All other brand names, product names or
trademarks belong to their respective owners.
© 2021 Splunk Inc. All rights reserved.
21-14769-Splunk-ModernGuidetoContainerMonitoringandOrchestration-114-EB

modern-guide-to-container-monitoring-and-orchestration.pdf

  • 1.
    The Modern Guideto ContainerMonitoring and Orchestration
  • 2.
    Since the introductionof the concept in 2013, containers have become the buzz of the IT world. It’s easy to see why: Application container technology is revolutionizing app development, bringing previously unimagined flexibility and efficiency to the development process. Businesses are embracing containers in droves. According to Gartner, more than 85% of global enterprises will be running containerized applications in production by 2025, up from less than 35% in 2019. Mass adoption makes it clear that organizations need to adopt a container-based development approach to stay competitive. Let’s look at what’s involved with containerization and how your organization can gain an edge. 2
  • 3.
    3 What is acontainer? The easiest way to understand the concept of a container is to consider its namesake. A physical container is a receptacle used to hold and transport goods from one location to another. A software container performs a similar function. It allows you to package up an application’s code, configuration files, libraries, system tools and everything else needed to execute that app into a self- contained unit, so you can move and run it anywhere. Containers are a key component of a “microservices” approach. This approach breaks applications down into single-function modules that are accessed only when they’re needed. A developer can modify and redeploy a particular service — not the whole application — whenever changes are required.
  • 4.
    4 A VM abstractshardware to turn a physical server into several virtual ones. It does so by running on top of a hypervisor, which itself runs on a physical computer called the “host machine.” The hypervisor is essentially a coordination system that arbitrates access to the host machine’s resources — CPU, RAM, etc. — making them available to the VM or “guest machine.” The apps and everything required to run them, including libraries and system binaries, are contained in the guest machine. Each guest machine also includes a complete operating system of its own. So a server running four VMs, for example, would have four operating systems in addition to the hypervisor coordinating them all. That’s a lot of demand on one machine’s resources, and things can bog down in a hurry, ultimately limiting how many VMs a single server can operate. Containers, on the other hand, abstract at the operating system level. A single host operating system runs on the host (this can be a physical server, VM or cloud host), and the containers — using a containerization engine like the Docker Engine — share that OS’s kernel with other containers, each with its own isolated user space. There’s much less overhead here than with a virtual machine, and as a result, containers are far more lightweight and resource-efficient than VMs — allowing for much greater utilization of server resources. Why are containers such a big deal? Containers remedy an all-too-common problem in operations: getting software to run reliably and uniformly no matter where it is deployed. As an app moves from one computing environment to another — from staging to production, for example — it can run into problems if the operating system, network topology, security policies or other aspects of the environment are different. Containers isolate the app from its environment, abstracting away these environmental differences. Containers also prevent issues due to different components requiring different versions of the same shared library or other dependency, by including all the dependencies within the container. Prior to containers, virtual machines (VMs) were the primary method for running many isolated applications on a single server. Like containers, VMs abstract away a machine’s underlying infrastructure so that hardware and software changes won’t affect app performance. But there are significant differences to how each does this.
  • 5.
    5 5 benefits of deploying containers Acontainer-based infrastructure offers a host of benefits. Here are the five biggest. 1. Speed of delivery — Applications installed on a virtual machine typically take several minutes to launch. Containers don’t have to wait for an operating system boot, so they can start up in a fraction of a second. They also run faster since they use fewer host OS resources, and they only take a few seconds to create, clone or destroy. All of this has a dramatic impact on the development process, allowing organizations to more quickly get software to market, fix bugs and add new features. 2. DevOps-first approach — The speed, small footprint and resource efficiency of microservice-based containers make them ideal for a DevOps environment. A microservice-based infrastructure enables developers to own specific parts of the application end-to-end, making sure that they can fully understand how it works, optimize its performance, and troubleshoot any issues more efficiently than with monolithic applications. 3. Portability — Containers pack up the app and all of its dependencies. That makes it easy to move and reliably run containers on Windows, Linux or Mac hardware. Containers can run on bare metal or on virtual servers, and within public or private clouds. This also helps avoid vendor lock-in should you need to move your apps from one public cloud environment to another. 4. Increased scalability — Containers tend to be small because they don’t require a separate OS the way that VMs do. One container is typically sized on the order of tens of megabytes, whereas a single VM can be tens of gigabytes — roughly 1,000 times the size of a container. That efficiency allows you to store many more containers on a single host operating system, increasing scalability. 5. Consistency — Because containers retain all dependencies and configuration internally, they ensure developers are able to work in a consistent environment regardless of where the containers are deployed. That means developers won’t have to waste time troubleshooting environmental differences and can focus on addressing new app functionality. It also means you can take the same container from development to production when it’s time to go live. Finally, because containers are immutable once created, developers don’t have to worry about configuration differences across the deployment or other sources of troubleshooting difficulty.
  • 6.
    6 Orchestration 101: using Kubernetes Toget started with container orchestration, you need specialized software to deploy, manage and scale containerized applications. One of the most well-established and popular choices today is Kubernetes, an open-source automation platform developed by Google and now managed by the Cloud Native Computing Foundation. Kubernetes can dramatically enhance the development process by simplifying container management, automating updates and scaling, and minimizing downtime so developers can focus on improving and adding new features to applications. To better understand how, let’s look at Kubernetes’ basic components and how they work together. Kubernetes uses multiple layers of abstraction defined within its own unique language. There are many parts to Kubernetes. This list isn’t exhaustive, but it provides a simplified look at how hardware and software is represented in the system. Nodes: In Kubernetes lingo, any single “worker machine” is a node. It can be a physical server or virtual machine on a cloud provider such as AWS or Microsoft Azure. Nodes were originally called “minions,” which gives you an idea of their purpose. They receive and perform tasks assigned from the master node and contain all the services required to manage and assign resources to containers. Master node: This is the machine that orchestrates all the worker nodes and is your point of interaction with Kubernetes. All assigned tasks originate here. Cluster: A cluster represents a master node and several worker nodes. Clusters consolidate all of these machines into a single, powerful unit. Containerized applications are deployed to a cluster, and the cluster distributes the workload to various nodes, shifting work around as nodes are added or removed. Pods: A pod represents a collection of containers packaged together and deployed to a node. All containers within a pod share a local network and other resources. They can talk to each other as if they were on the same machine, but they remain isolated from one another. At the same time, pods isolate network and storage away from the underlying container. A single worker node can contain multiple pods. If a node goes down, Kubernetes can deploy a replacement pod to a functioning node. Despite a pod being able to hold many containers, it’s recommended they wrap up only as many as needed: a main process and its helper containers, which are called “sidecars.” Pods scale as a unit no matter what their individual needs are and overstuffed pods can be a drain on resources. Deployments: Instead of directly deploying pods to a cluster, Kubernetes uses an additional abstraction layer called a “deployment.” A deployment enables you to designate how many replicas of a pod you want running simultaneously. Once it deploys that number of pods to a cluster, it will continue to monitor them and automatically recreate and redeploy a pod if it fails. Ingress: Kubernetes isolates pods from the outside world, so you need to open a communication channel to any service you want to expose. This is another abstraction layer called “ingress.” There are a few ways to add ingress to a cluster, including adding a LoadBalancer, NodePort or Ingress controller. Think of this as the internet-facing web server you may have used in traditional architecture.
  • 7.
    7 What challenges do Kubernetesand containerization present for monitoring? For all the benefits that containers and orchestration frameworks bring to organizations, they can also make cloud-based application management more complex. Some of the challenges they present include: • Significant blind spots — Containers are designed to be disposable. Because of this, they introduce several layers of abstraction between the application and the underlying hardware to ensure portability and scalability. This all contributes to a significant blind spot when it comes to conventional monitoring. Traditional monitoring tools aren’t capable of understanding these abstractions. • Increased volume of data — The easy portability of so many interdependent components creates an increased need to maintain telemetry data to ensure observability into the performance and reliability of the application, container and orchestration platform. Many microservice architectures are built to scale up microservices when needed and destroy them when not. This ephemerality also increases the need to have data streamed into an observability system. Additional components added to the system also increase how many things must be monitored and checked when things go wrong. • The importance of visualizations — The scale and complexity introduced by microservices, containers and container orchestration requires the ability to both visualize the environment to gain immediate insight into your infrastructure health and to determine how traffic is flowing within your environment. You also need to be able to zoom in and view the health and performance of containers, nodes and pods. The right monitoring solution should provide this workflow. • Pacing for DevOps — Containers can be scaled and modified with lightning speed. This accelerated deployment pace makes it more challenging for DevOps teams to track how application performance is impacted across deployments, or even to understand when new service dependencies are added.
  • 8.
    8 How to implement containers Agood container monitoring solution will enable you to stay on top of your dynamic container-based environment by unifying container data with other infrastructure data to provide better contextualization and root cause analysis. Let’s look at ways you can provide several layers of monitoring for Docker, the most popular implementation. Hosts: The physical and virtual machines in your clusters can be monitored for availability and performance. Key metrics to track include memory, CPU usage, swap space used and storage utilization. This should be a core capability of any container monitoring tool. Containers: Visibility into your containers in aggregate and individually is critical. A monitoring tool can provide information on the number of currently running containers, the containers using the most memory and the most recently started container. It can also provide insight into each container’s CPU and memory utilization, and the health of its network I/O. Orchestration framework: Kubernetes itself also needs to be monitored. How many available nodes are there? What’s the health of the master node? Are there any pods pending reassignment for long periods? What volume of traffic is moving through your ingress? You need to be able to answer all of these questions quickly to continue operating reliable services. Additionally, the nature of Kubernetes means that pods are scheduled to optimize resource utilization. This increases efficiency, but also adds unpredictability about where pods are deployed and run. Application endpoints: Determining when your service is able to handle user requests and the performance and latency of these requests is also vital. Your monitoring solution must also perform health checks on the application itself and determine latency and other performance metrics.
  • 9.
    9 What features are necessaryto monitor these applications? As we’ve discussed, containerization of applications and use of orchestration frameworks like Kubernetes create many benefits for modern development and deployment workflows. However, monitoring these environments and applications is far more complicated than using legacy tools. A monitoring solution that’s ready for containers and orchestration workflows must be able to provide these features. Collection of key metrics Pod metrics: Number of desired pods, number of available pods, pods by phase (failed, pending, running), desired pods per deployment Resource utilization metrics: Docker Socket-collected metrics (container and node-level resource metrics, e.g., CPU and memory usage) Application metrics: RED metrics (rate, error, duration); application health; database availability and performance Consolidation, correlation, and analysis features Easy deployment: Deployment of collectors must be easy and cloud- native. Ideally, a helm chart is available. Deployment can be as easy as: helm repo add splunk-otel-collector-chart https:// signalfx.github.io/splunk-otel-collector-chart helm repo update helm install --set splunkAccessToken=’xxx’ --set clusterName=’sample’ --set splunkRealm=’us0’ --set otelCollector.enabled=’true’ --generate-name splunk- otel-collector-chart/splunk-otel-collector Avoidance of lock-in: OpenTelemetry is the future of monitoring technology, and instrumentation of your environment must account for the fact that you may decide to change monitoring or observability providers. It’s essential that the solution you adopt supports OpenTelemetry so that you aren’t required to redo instrumentation work if you move. Real-time, streaming platform: In a world where downtime can cost hundreds of thousands of dollars per hour, seconds count. A modern monitoring and observability platform must be able to provide alerts and analyze data in real time to minimize MTTD and to make sure that the conclusions you’re drawing from the data are based on the current state of the system. Predictive analytics: Based on AI and ML, predictive analytics tools can tell you things are about to fail before they fail. Given the complexity of modern environments, this can prevent issues from even happening and help you detect potential performance and availability issues before they impact your customers.
  • 10.
    10 Prebuilt dashboards: Gettingvalue from your monitoring system shouldn’t rely on you needing to fully document your infrastructure. Automated, built-in dashboards can make it easy to understand the complex interrelationships between nodes, pods, containers and applications, and see the status of your environment at a glance: Automated service maps: Understanding how traffic is flowing through ingress, containers and applications is extremely complicated in this new world. Your monitoring tool must be able to figure out the paths your requests are taking and show you these requests, in addition to identifying errors and other issues in your environment:
  • 11.
    Next steps Containers area powerful tool in your development arsenal, but it’s critical to understand how and how well your container environments are working. Infrastructure monitoring and application performance monitoring become more essential after deploying containers, not less. The requirements of a container-ready monitoring solution include being built to understand containers, easy deployment, a real-time streaming platform, predictive analytics and an out-of-the-box experience that gives you meaningful data. If you’re ready for an observability system that does all this and can operate natively with containers, public clouds, private clouds and self-hosted environments, check out a demo of Splunk Observability Cloud, or you can start a free trial today. To learn more about observability, view our website or download our Beginner’s Guide to Observability. Splunk, Splunk> and Turn Data Into Doing are trademarks and registered trademarks of Splunk Inc. in the United States and other countries. All other brand names, product names or trademarks belong to their respective owners. © 2021 Splunk Inc. All rights reserved. 21-14769-Splunk-ModernGuidetoContainerMonitoringandOrchestration-114-EB