Download as PDF, PPTX


![65
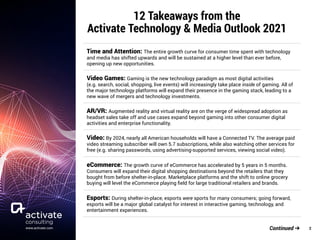
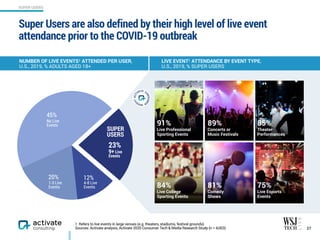
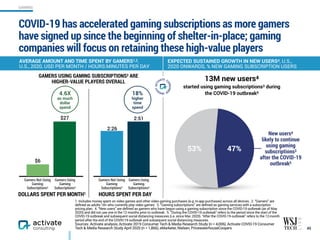
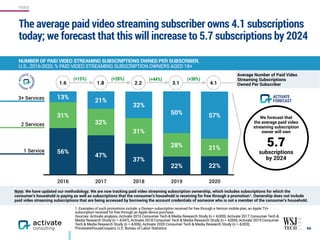
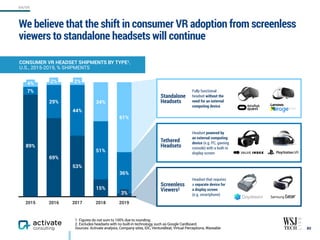
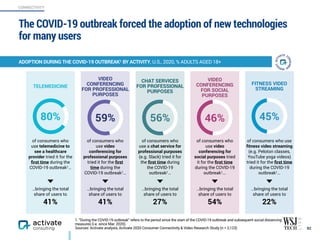
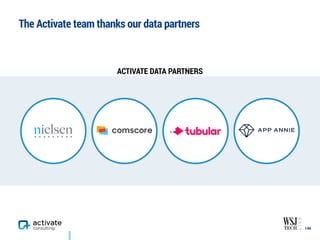
ESTIMATED NUMBER OF SUBSCRIBERS / USERS FOR SELECT MAJOR VIDEO STREAMING SERVICES,
GLOBAL, 2020 OR MOST RECENT, MILLIONS SUBSCRIBERS / MILLIONS MONTHLY ACTIVE USERS
1. Reflects estimated monthly active users as no recent official numbers have been reported. 2. Reflects average monthly active users for 2019.
3. Reflects the most recently reported number of monthly active users as of Apr. 2019. 4. Subscriber count as of Q4 2019. 5. Reflects self-reporting that
The Roku Channel reached active accounts with approximately 43 million people in Q2 2020. 6. Reflects U.S. monthly active users as reported in Sept.
2020. Although Xumo is also available internationally, global users were not reported. 7. Reflects the number of sign-ups for Peacock across the free and
paid subscription tiers. 9. Reflects monthly active users as of Mar. 2019. 8. Does not include consumers subscribing to HBO / HBO Max through a Pay TV
provider (e.g. purchasing the HBO add-on to a cable/satellite TV package and receiving HBO Max at no additional cost). Includes consumers subscribing to
the HBO Max or HBO (formerly HBO Now) OTT service directly (e.g. subscribing to HBO Max through the service website) or through a non-Pay TV third
party (e.g. subscribing to HBO through Amazon Prime Video Channels). 9. Represents estimated sign-ups for Apple TV+ as Apple has not released official
subscriber counts. Does not represent all Apple device customers eligible for the 12-month free trial of the service. 10. Reflects the number of registered
users on MUBI.
Sources: Activate analysis, Bloomberg, Business Insider, Business Wire, CNBC, Company filings, Company press releases, Company sites, Cord Cutters
News, Deadline, Digiday, Digital TV News, eMarketer, FierceVideo, Media Play News, MediaPost, Multichannel News, nScreenMedia, TechCrunch, Variety,
The Verge, The Washington Post
476M
150M
43M
36M 34M 33M 33M
15M
11M
24M
10M 9M 9M 9M 7M
13M
4
(including
Prim
e
Video)
(form
erly Hotstar)
The streaming wars will be fought locally and globally
Paid video streaming subscription [SVOD]
(Millions subscribers)
Free video streaming service with ads [AVOD, FAST]
(Millions monthly active users)
Video streaming service with a paid subscription
tier and a free tier with ads (Millions monthly active users)
41M
8M
61M
500M
193M
300M
3 5 6 7 98 101 2
VIDEO
+](https://image.slidesharecdn.com/activateoutlook2021final-201021221856/85/Activate-Technology-Media-Outlook-2021-65-320.jpg)


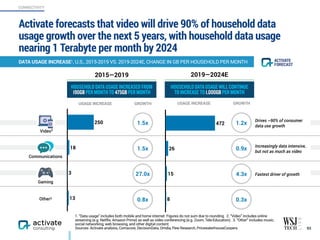
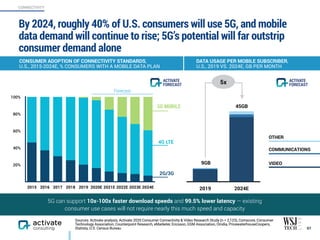


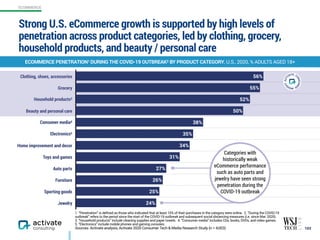
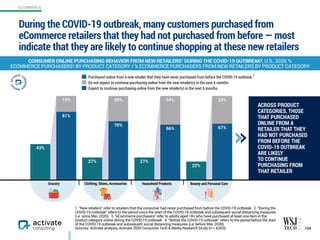
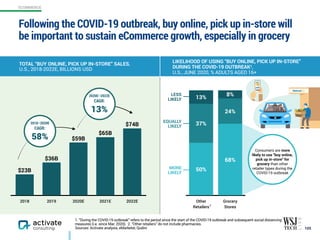

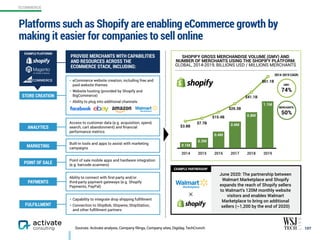
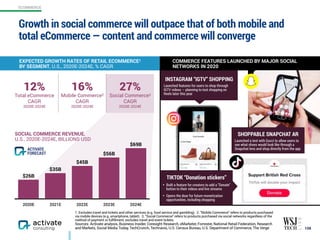


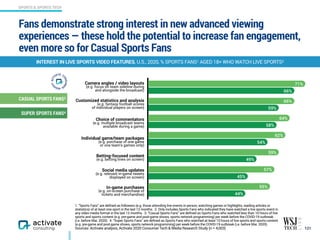


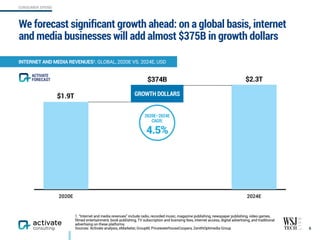
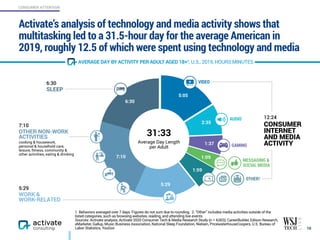
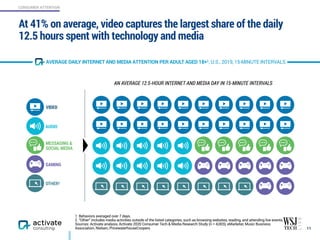
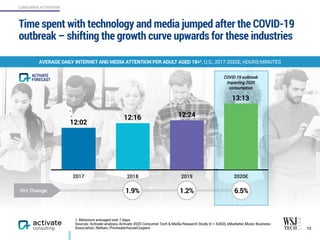
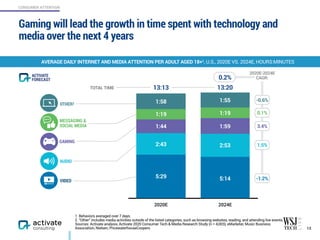
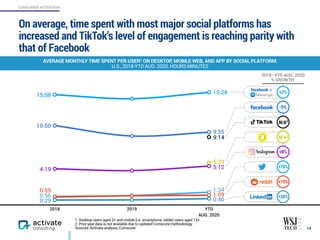
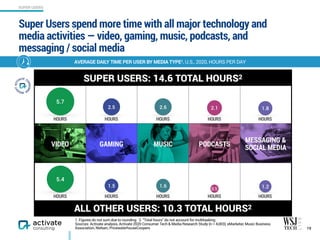
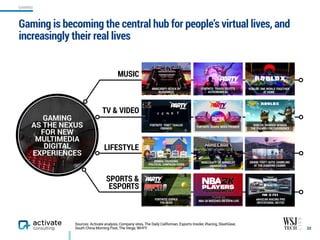
The Activate Technology & Media Outlook 2021 reveals a significant shift in consumer engagement with technology and media, with gaming now at the forefront and augmented/virtual reality on the rise. Key trends include the acceleration of e-commerce, substantial growth in video streaming, and an increase in sports betting revenues, expected to reach $24 billion by 2024. Companies are advised to focus on 'super users', a small segment contributing to a majority of consumption and spending across platforms.