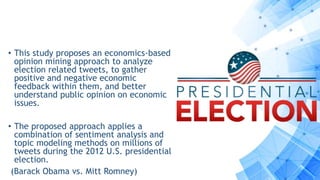
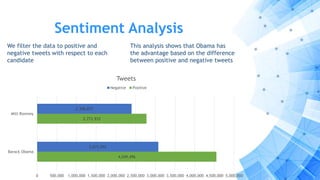
Mining public opinion about
economic issues
Twitter and the U.S Presidential Election
Ivan Abboud – Wajdy Al-Jaber
Source : https://arxiv.org/pdf/1804.03540.pdf
Introduction
• Opinion polls have been the bridge between public
opinion and politicians in elections
• Social media has provided a platform for collecting
a large amount of social media data
• This paper proposes a computational public
opinion mining approach to explore the discussion
of economic issues in social media during an
election
Opinion Mining
• An “opinion poll is a
type of survey or inquiry
designed to measure the
public’s views regarding
a particular topic or
series of topics”
• face-to-face interviews
• phone interviews
• surveys sent by mail or email or
available online
Opinion Mining
• Opinion polls encourages
political campaigns to track
polls and surveys for possible
changes in public relation
strategies
• Among different technologies,
social media plays the role of
a big focus group in providing
feedback during an election
cycle
Opinion Mining
• Before 2016, the 2012 presidential campaigns of Barack
Obama and Mitt Romney represented the most data-driven
election cycle in history
• The Obama and Romney campaigns spent $52 million and
$26 million on advertising in modern social media,
respectively
• In that election, 40% of U.S. adults engaged politically with
social media.
• 38% of social media users shared and followed political
news
• 20% of the users followed politicians on social media
Opinion Mining
• People share their feelings and
opinions on Twitter on such a
large scale that it can be used
for research
• collecting and analyzing
Twitter data is a cost-effective
way to survey a large number
of participants in a short
period of time.
• This study proposes an economics-based
opinion mining approach to analyze
election related tweets, to gather
positive and negative economic
feedback within them, and better
understand public opinion on economic
issues.
• The proposed approach applies a
combination of sentiment analysis and
topic modeling methods on millions of
tweets during the 2012 U.S. presidential
election.
(Barack Obama vs. Mitt Romney)
Methodology
This paper proposes an economic-based public
opinion mining approach with four components:
Sentiment
Analysis
Data
Collection
Topic
Discovery
Analysis
Data Collection
Twitter data can be collected with
APIs (Application Programming
Interfaces).
APIs collect different forms of
Twitter data for a user such as tweets, number of followers,
and favorite tweets…..
To access a large number of tweets, some related terms are
needed to retrieve the relevant ones
Data Collection
This step comes with a data cleaning step to remove
stopwords, such as “the,” that do not have any semantic
value.
Queries Raw Tweets Cleaned Tweets
This analysis shows that Obama has the advantage based
on the difference between positive and negative tweets
Data Collection
Queries Used for filtering tweets
Candidate Queries
Barack Obama
barack obama
@barackobama
#barackobama
#obama
Mitt Romney
mitt romney
@mittromney
#mittromney
#romney
The data for this research was collected from September 29, 2012,
to November 16, 2012
This dataset has 24 million tweets related to the candidates for
president, Barack Obama and Mitt Romney
Sentiment Analysis
Second step in the proposed approach is Sentiment analysis
Sentiment analysis is basically concerned with analysis of
emotions and opinions from text
Two main methods can be used for this step:
Learning-based
approaches
Lexicon-based
approaches
Sentiment Analysis
Machine Learning Approach
Sentiment Analysis
The problem with machine learning approaches is that it
needs a training data set which mean it need a data that is
labeled with humans raters
Also it need a prior knowledge about the data categories
Sentiment Analysis
Lexicon-based Approaches
finds the frequency of a predefined dictionary of positive
and negative terms to disclose sentiment in the data when
there is no prior knowledge about its categories
In this study they used the second approach
because there is no prior knowledge about the
data categories
Sentiment Analysis
Lexicon-based Approaches
Linguistic Inquiry and Word Count (LIWC) is the most common tool for text
analysis
Basically, it reads a given text and counts the percentage of words that reflect
different emotions, thinking styles, social concerns, and even parts of speech.
After the processing module has read and accounted for all words in a given
text, it calculates the percentage of total words that match each of the
dictionary categories.
For example, if LIWC analyzed a single speech that was 2,000 words and
compared them to the built-in dictionary, it might find that there were 150
pronouns and 84 positive emotion words used. It would convert these numbers
to percentages, 7.5% pronouns and 4.2% positive emotion words.
Sentiment Analysis
Lexicon-based Approaches
Dictionary is composed of
almost 6,400 words, word
stems, and selected
emoticons. For each
dictionary word, there is a
corresponding dictionary
entry that defines one or
more word categories.
Cried
Sadness
Negative
Emotion
Overall
Affect
Verb
Past
Focus
Sentiment Analysis
We filter the data to positive and
negative tweets with respect to each
candidate
4,549,496
2,773,933
3,075,592
2,396,873
0 500,000 1,000,000 1,500,000 2,000,000 2,500,000 3,000,000 3,500,000 4,000,000 4,500,000 5,000,000
Barack Obama
Mitt Romney
Tweets
Negative Positive
This analysis shows that Obama has
the advantage based on the difference
between positive and negative tweets
Topic Modeling
Topic modeling is a type of statistical modeling for
discovering the abstract “topics” that occur in a
collection of documents.
Topic Modeling
LDA or latent Dirichlet allocation is a “generative probabilistic
model” of a collection of documents made up of words.
The probabilistic topic model estimated by LDA consists of two
tables (matrices):
1 - The first table describes the probability or chance of selecting
a particular word when sampling a particular topic (category).
2- The second table describes the chance of selecting a
particular topic when sampling a particular document or
composite.
Topic Modeling
Example: bag-of-words
Budget Tax Employee
Tweet 0 10 0 0
Tweet 1 0 10 0
Tweet 2 0 0 10
Tweet 3 10 10 10
After running the LDA we end up with two tables:
Topic1 Topic2 Topic3
Budget 0 0 0.999
Tax 0.999 0 0
Employee 0 0.999 0
Topic1 Topic2 Topic3
Tweet0 0 0 0.93
Tweet1 0.93 0 0
Tweet2 0 0.93 0
Tweet3 0.333 0.333 0.333
Word vs Topic probabilistic model Tweet vs Topic probabilistic model
Topic Modeling
LDA is a generative model that have
two hyper-parameters to be tuned:
Α and β
Topic Modeling
The alpha controls
the mixture of topics
for any given
document. Turn it
down and the
documents will likely
have less of a
mixture of topics.
Turn it up and the
documents will likely
have more of a
mixture of topics
Topic Modeling
People posted tweets about different issues (topics)
during the 2012 election, but the focus of this research is
on the main economic issues including:
• Economy in General
• Job
• Budget Deficit
• Healthcare
• Tax
DPNT : the difference between the number of positive topics
and the number of negative topics
DPNT indicates the overall feedback status
Results
After applying topic modeling on positive and negative tweets , filtering out
topics based on the five economic issues, and calculating the DPNT value for
each topic for both candidates we got these results
13
34
4
11
8
18
24
3
4
13
0 5 10 15 20 25 30 35 40
Economy
Jobs
Budget Deficit
Healthcare
Tax
Obama’s Results
Negative Positive
19
22
3
18
21
25
31
9
14
31
0 5 10 15 20 25 30 35
Romney’s Results
Negative Positive
Results
-5
10
7
1
-5
-6
-9
-6
4
-10
-15 -10 -5 0 5 10 15
Economy
Jobs
Budget Deficit
Healthcare
Tax
Obama Vs. Romney (DPNT)
Romney Obama
Obama has three positive DPNTs with the highest DPNT for the job issue
Romney has just one positive DPNT for the healthcare issue.
Although Obama has two negative DPNTs for the economy in general and tax issues, he
has the advantage on all the economic issues based on DPNT value
Conclusion
The final election results show
that Obama had a big victory
with more than 3 million popular
votes and a more than 120
electoral vote advantage over
Romney
In line with the final results, our
analysis indicates that the winner
had the advantage on the most
important issues (economic
issues) in the election
Conclusion
The results show that jobs and
taxes were the most and the
least important issues,
respectively, for the followers of
the two candidates. Although the
overall ranking of the issues for
each candidate is very close,
DPNT values show Obama having
the advantage on all the
economic issues
Category
Category
Category
Category
Thank you!
Ivan Abboud – Wajdy Al-Jaber Questions??
The End
Thanks for listening
Source : https://arxiv.org/pdf/1804.03540.pdf

Mining public opinion about economic issues

  • 1.
    Mining public opinionabout economic issues Twitter and the U.S Presidential Election Ivan Abboud – Wajdy Al-Jaber Source : https://arxiv.org/pdf/1804.03540.pdf
  • 2.
    Introduction • Opinion pollshave been the bridge between public opinion and politicians in elections • Social media has provided a platform for collecting a large amount of social media data • This paper proposes a computational public opinion mining approach to explore the discussion of economic issues in social media during an election
  • 3.
    Opinion Mining • An“opinion poll is a type of survey or inquiry designed to measure the public’s views regarding a particular topic or series of topics” • face-to-face interviews • phone interviews • surveys sent by mail or email or available online
  • 4.
    Opinion Mining • Opinionpolls encourages political campaigns to track polls and surveys for possible changes in public relation strategies • Among different technologies, social media plays the role of a big focus group in providing feedback during an election cycle
  • 5.
    Opinion Mining • Before2016, the 2012 presidential campaigns of Barack Obama and Mitt Romney represented the most data-driven election cycle in history • The Obama and Romney campaigns spent $52 million and $26 million on advertising in modern social media, respectively • In that election, 40% of U.S. adults engaged politically with social media. • 38% of social media users shared and followed political news • 20% of the users followed politicians on social media
  • 6.
    Opinion Mining • Peopleshare their feelings and opinions on Twitter on such a large scale that it can be used for research • collecting and analyzing Twitter data is a cost-effective way to survey a large number of participants in a short period of time.
  • 7.
    • This studyproposes an economics-based opinion mining approach to analyze election related tweets, to gather positive and negative economic feedback within them, and better understand public opinion on economic issues. • The proposed approach applies a combination of sentiment analysis and topic modeling methods on millions of tweets during the 2012 U.S. presidential election. (Barack Obama vs. Mitt Romney)
  • 8.
    Methodology This paper proposesan economic-based public opinion mining approach with four components: Sentiment Analysis Data Collection Topic Discovery Analysis
  • 9.
    Data Collection Twitter datacan be collected with APIs (Application Programming Interfaces). APIs collect different forms of Twitter data for a user such as tweets, number of followers, and favorite tweets….. To access a large number of tweets, some related terms are needed to retrieve the relevant ones
  • 10.
    Data Collection This stepcomes with a data cleaning step to remove stopwords, such as “the,” that do not have any semantic value. Queries Raw Tweets Cleaned Tweets This analysis shows that Obama has the advantage based on the difference between positive and negative tweets
  • 11.
    Data Collection Queries Usedfor filtering tweets Candidate Queries Barack Obama barack obama @barackobama #barackobama #obama Mitt Romney mitt romney @mittromney #mittromney #romney The data for this research was collected from September 29, 2012, to November 16, 2012 This dataset has 24 million tweets related to the candidates for president, Barack Obama and Mitt Romney
  • 12.
    Sentiment Analysis Second stepin the proposed approach is Sentiment analysis Sentiment analysis is basically concerned with analysis of emotions and opinions from text Two main methods can be used for this step: Learning-based approaches Lexicon-based approaches
  • 13.
  • 14.
    Sentiment Analysis The problemwith machine learning approaches is that it needs a training data set which mean it need a data that is labeled with humans raters Also it need a prior knowledge about the data categories
  • 15.
    Sentiment Analysis Lexicon-based Approaches findsthe frequency of a predefined dictionary of positive and negative terms to disclose sentiment in the data when there is no prior knowledge about its categories In this study they used the second approach because there is no prior knowledge about the data categories
  • 16.
    Sentiment Analysis Lexicon-based Approaches LinguisticInquiry and Word Count (LIWC) is the most common tool for text analysis Basically, it reads a given text and counts the percentage of words that reflect different emotions, thinking styles, social concerns, and even parts of speech. After the processing module has read and accounted for all words in a given text, it calculates the percentage of total words that match each of the dictionary categories. For example, if LIWC analyzed a single speech that was 2,000 words and compared them to the built-in dictionary, it might find that there were 150 pronouns and 84 positive emotion words used. It would convert these numbers to percentages, 7.5% pronouns and 4.2% positive emotion words.
  • 17.
    Sentiment Analysis Lexicon-based Approaches Dictionaryis composed of almost 6,400 words, word stems, and selected emoticons. For each dictionary word, there is a corresponding dictionary entry that defines one or more word categories. Cried Sadness Negative Emotion Overall Affect Verb Past Focus
  • 18.
    Sentiment Analysis We filterthe data to positive and negative tweets with respect to each candidate 4,549,496 2,773,933 3,075,592 2,396,873 0 500,000 1,000,000 1,500,000 2,000,000 2,500,000 3,000,000 3,500,000 4,000,000 4,500,000 5,000,000 Barack Obama Mitt Romney Tweets Negative Positive This analysis shows that Obama has the advantage based on the difference between positive and negative tweets
  • 19.
    Topic Modeling Topic modelingis a type of statistical modeling for discovering the abstract “topics” that occur in a collection of documents.
  • 20.
    Topic Modeling LDA orlatent Dirichlet allocation is a “generative probabilistic model” of a collection of documents made up of words. The probabilistic topic model estimated by LDA consists of two tables (matrices): 1 - The first table describes the probability or chance of selecting a particular word when sampling a particular topic (category). 2- The second table describes the chance of selecting a particular topic when sampling a particular document or composite.
  • 21.
    Topic Modeling Example: bag-of-words BudgetTax Employee Tweet 0 10 0 0 Tweet 1 0 10 0 Tweet 2 0 0 10 Tweet 3 10 10 10 After running the LDA we end up with two tables: Topic1 Topic2 Topic3 Budget 0 0 0.999 Tax 0.999 0 0 Employee 0 0.999 0 Topic1 Topic2 Topic3 Tweet0 0 0 0.93 Tweet1 0.93 0 0 Tweet2 0 0.93 0 Tweet3 0.333 0.333 0.333 Word vs Topic probabilistic model Tweet vs Topic probabilistic model
  • 22.
    Topic Modeling LDA isa generative model that have two hyper-parameters to be tuned: Α and β
  • 23.
    Topic Modeling The alphacontrols the mixture of topics for any given document. Turn it down and the documents will likely have less of a mixture of topics. Turn it up and the documents will likely have more of a mixture of topics
  • 24.
    Topic Modeling People postedtweets about different issues (topics) during the 2012 election, but the focus of this research is on the main economic issues including: • Economy in General • Job • Budget Deficit • Healthcare • Tax DPNT : the difference between the number of positive topics and the number of negative topics DPNT indicates the overall feedback status
  • 25.
    Results After applying topicmodeling on positive and negative tweets , filtering out topics based on the five economic issues, and calculating the DPNT value for each topic for both candidates we got these results 13 34 4 11 8 18 24 3 4 13 0 5 10 15 20 25 30 35 40 Economy Jobs Budget Deficit Healthcare Tax Obama’s Results Negative Positive 19 22 3 18 21 25 31 9 14 31 0 5 10 15 20 25 30 35 Romney’s Results Negative Positive
  • 26.
    Results -5 10 7 1 -5 -6 -9 -6 4 -10 -15 -10 -50 5 10 15 Economy Jobs Budget Deficit Healthcare Tax Obama Vs. Romney (DPNT) Romney Obama Obama has three positive DPNTs with the highest DPNT for the job issue Romney has just one positive DPNT for the healthcare issue. Although Obama has two negative DPNTs for the economy in general and tax issues, he has the advantage on all the economic issues based on DPNT value
  • 27.
    Conclusion The final electionresults show that Obama had a big victory with more than 3 million popular votes and a more than 120 electoral vote advantage over Romney In line with the final results, our analysis indicates that the winner had the advantage on the most important issues (economic issues) in the election
  • 28.
    Conclusion The results showthat jobs and taxes were the most and the least important issues, respectively, for the followers of the two candidates. Although the overall ranking of the issues for each candidate is very close, DPNT values show Obama having the advantage on all the economic issues
  • 29.
  • 30.
    The End Thanks forlistening Source : https://arxiv.org/pdf/1804.03540.pdf