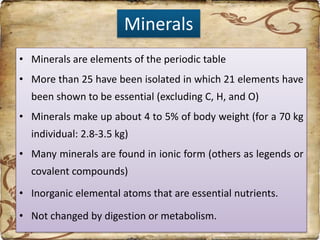
Micro Minerals
Presented by : Kavita Kachhawa
Minerals
• Minerals are elements of the periodic table
• More than 25 have been isolated in which 21 elements have
been shown to be essential (excluding C, H, and O)
• Minerals make up about 4 to 5% of body weight (for a 70 kg
individual: 2.8-3.5 kg)
• Many minerals are found in ionic form (others as legends or
covalent compounds)
• Inorganic elemental atoms that are essential nutrients.
• Not changed by digestion or metabolism.
Minerals
• Two categories:
• Macrominerals > 0.005%
• Microminerals < 0.005%
• Macrominerals are essential at levels of 100mg or more
per day for human adults
• Microminerals are often referred to as trace elements
required <15mg/day. (Mahan et al 2012)
Classification
• Macro or Major minerals
– Sodium, potassium,
magnesium, calcium,
phosphorus, sulfur, chloride
• Present in body tissues at
concentrations >50 mg/kg
(50 ppm)
• Micro or Trace minerals
(body needs relatively less)
– Chromium, manganese, iron,
cobalt, molybdenum, copper,
zinc, fluoride, iodine,
selenium, silicon, tin, arsenic,
nickel…
• Present in body tissues at
concentrations <50 mg/kg
(50 ppm)
Nutritionally Important Minerals
Macro Trace
Element g/kg Element mg/kg
Ca
P
K
Na
Cl
S
Mg
15
10
2
1.6
1.1
1.5
0.4
Fe
Zn
Cu
Mo
Se
I
Mn
Co
20-50
10-50
1-5
1-4
1-2
0.3-0.6
0.2-0.5
0.02-0.1
Macro minerals
Body concentration:
Ca calcium 1200 grams
P phosphorus 860 grams
S sulfur 300 grams
K potassium 180 grams
Cl chloride 74 grams
Na sodium 64 grams
Mg magnesium 25 grams
Needed in > 100 mg/d
Bioavailability, & Regulation of Major
Minerals
• Bioavailability
– Influenced by genetics, aging, nutritional status & other
food compounds
• Absorption
– Small intestine & large intestine
• Regulation
– Kidneys & small intestine
Micro minerals
Body concentration:
F fluorine 2.6g
V vanadium 0.018
Zn zinc 2.0
Sn tin 0.017
Cu copper 0.1
Se selenium 0.013
I iodine 0.025
Mn manganese 0.012
Cr chromium 0.006
Ni nickel 0.010
Co cobalt 0.0015
Mo molybdenum 0.009
Si silicon 0.024
Micro Minerals (11)
• Iron
• Zinc
• Iodide
• Selenium
• Copper
• Manganese
• Fluoride
• Chromium
• Molybdenum
• Selenium
• Cobalt
• Boron
Ultra trace elemnets
• Aresenic
• Aluminium
• Tin
• Nickel
• Vanadium
• Silicon
Other micro minerals found in humans
Sr (strontium)
Br (bromine)
Au (gold)
Ag (silver)
Al (aluminum)
Bi (bismuth)
As (arsenic)
B (boron)
The function of these minerals has not been established as of to date
Minerals in Foods
• Found in all food groups.
• More reliably found in animal products.
• Often other substances in foods decrease absorption
(bioavailability) of minerals
– Oxalate, found in spinach, prevents absorption of most calcium in
spinach.
– Phytate, form of phosphorous in most plants makes it poorly
available
Factors Affecting Requirements
• Physiological state/level of production
• Tissue storage
• Interactions with other minerals
Scientific development which have contributed
to trace element knowledge
• Design of highly purified and specially constituted diets
• Advances in analytical measurements
• Colorimetry
• Fluorimetry
• Flame photometry
• Neutron activation analysis
• Atomic absorption spectroscopy
• Microwave excitation emission spectroscopy
• Isolation and study of metallo enzymes
Functions of minerals
• Provide a suitable medium for cellular activity
– permeability of membranes
– irritability of muscles and nerve cells
• Play a primary role in osmotic phenomenon
• Involved in acid base-balance
• Confer rigidity and hardness to certain tissues (bones and
teeth)
• Become part of specialized compounds
Metallo enzymes
• metal is firmly bound
• metal to protein ratio is constant
• metal to enzyme activity ratio is constant
• metal is unique
• no enzyme activity without metal
• Examples of metalloenzymes:
– superoxide dismutase (Zn and Cu)
– carboxypeptidase A (Zn)
– carbonic anhydrase (Zn)
– cytochrome oxidase (Fe and Cu)
– xanthine oxidase (Co and Fe)
Metal-activated enzymes
• metal is reversibly bound
• metal to protein ratio is variable
• metal to enzyme activity ratio is variable
• metal is not necessarily unique
• enzyme activity may exit without metal
• Examples of metal-activated enzymes
– creatine kinase (Mg, Mn, Ca or Co)
– glycogen phosphorylase kinase (Ca)
– salivary and pancreatic alpha-amylases (Ca)
Iron
• Iron was first identified as constituent of the body by Lernery in
1713.
• In 1800, Lecanu identified iron in metallo protein Hb
• The body contains about 2.5 to 4 g iron in body
• The precise amount of iron in any individual depends on gender,
age, size, nutritional status, general health and level of iron
stores.
Iron (Fe)
• 2 types of body iron
– heme iron 60-70%
• Hemoglobin (60-70%),
• myoglobin (3-4%),
• enzymes (5-15%,) catalases, peroxidases, cytochromes (a, b and c –
involved in electron transport), cytochrome P450 (involved in drug
metabolism)
– non-heme iron
• storage iron (15-30%) ferritin, hemosiderin, hemofuscin,
• transport iron (0.1%) transferrin, ferroflavoproteins, aromatic amino
acid hydroxylases
• food iron is also classified as heme and non-heme
Food iron
heme iron
– meats
– poultry
– fish
20-23% of heme-iron is
absorbable
non-heme iron
– vegetables
– fruits
– legumes
– nuts
– breads and cereals
only ~ 3% on non heme
iron is absorbed
Functions
• Transport and storage of O2
• The functions of iron relate to its ability to
participate in oxidation and reductions
reactions. Chemically, iron is a highly reactive
element that can interact with O2 to form
intermediates with the potential of damaging
cell membrane or degrading DNA.
• Iron must be tightly bound to proteins to
prevent these potentially destructive oxidative
effects.
Cofactor of coenzyme and other
proteins
• Conversion of beta carotene to active vitamin
A
• Synthesis of purines
• Synthesis of carnitine
• Synthesis of collagen
• Detoxification of drugs
• Synthesis of neuratransmittors like dopamin,
serotonin and norepinephrine
• Essential for catecholamine metabolism
• Ribonucleotide reductase, the rate limiting
enzyme involved in DNA synthesis, is also
an Iron enzyme
• Other enzymes, including several in brain
requires Fe
Formation of RBC
Proerythroblast
Basophill erythroblast
Polychromotophill erythroblast
Orthochromic erythroblast
Reticulocyte
Erythrocyte
Iron and immunity
Iron deficiency compromises humoral immune
responses to a much lesser extend than
functional changes in cell mediated immunity.
• T lymphocyte functions are impaired along
with the depression of T lymphocyte number.
There is a reduction in the proportion and
absolute number of T cells. There is also
defective T lymphocyte induced proliferation
response.
• Humoral immune response is generally unaltered.
• Immunoglobulin production and function are
normal.
• Serum concentration of complement is normal.
• Phagocytic function is normal but there is reduced
bactericidal activity of neutrophil, which is
reversed with iron therapy.
• NK cell activity is decreased.
• Impaired IL 2 production by lymphocytes.
• Reduced production of macrophage migration
inhibition factor.
Thymus weight
cytotoxity
Total
lymphocytes
CD4+
CD8+
ratio
CELL MEDIATED IMMUNITY HUMORAL IMMUNITY
B cell proliferation
B lymphocytes
Immunoglobulin
Macrophages
Phagocytosis
Neutrophil migration
Neutrophil phagocytosis
Neutrophil bactericidal
activity
NK cell activity
TNF secretion
complement
OTHER IMMUNE FUNCTIONS
• Numerous water soluble drugs and endogenous
organic molecules are transformed by the iron
containing cytochrome P-450 system in liver into more
water soluble molecules that can be secreted in the
bile and eliminated
• Two iron binding proteins- transferrin (in blood)
and lactoferrin (in breast milk)- seem to protect
the body against infection by withholding iron
from microorganisms that it need for
proliferation.
Iron in oxidative production of ATP
• The cytochromes, present in nearly all
cells, function in the mitochondrial
respiratory chain in the transfer of el- and
the storage of energy through alternate
oxidation and reduction of Fe.
Iron absorption
• Occurs in upper part of small intestine
• About 10% of food iron is absorbed
• Requires gastric HCl (releases ionic iron)
also requires copper
• Ferrous is better absorbed than ferric form
• Fe++ forms chelates with ascobic acid, certain sugars
and amino acid
• Broadly, two types of methods - chemical balance
and isotopic method, were used in determining the
absorption and retention of iron in human body for
requirement of iron in India
• In the very first chemical balance studies carried out
on Indians, absorption of iron from various Indian
diets was found to vary from 7-20% (median-10%)
• in pregnancy, iron absorption increased from a mean
of 7 % to 30 % and to 33 % at gestational weeks 8 -
16, 27 - 32 and 36 - 39 respectively.
• The absorption of iron was better among those with
low per cent transferrin saturation than in women
with high per cent transferrin saturation.
• As much as 58% of 30 mg of dietary iron ingested per
day could be absorbed (17.5 mg) by an iron deficient
full-term pregnant woman.
Iron absorption
• The iron density of Indian diet is around 8.5 mg/1000 kcal based on
diet survey records and is around 9 mg/1000 kcal based on chemical
analyses which are lower than previously estimated figures due to
30% contaminant iron (14.2 mg/1000 kcal). a normal person absorbs
5 -10% of this iron or 0.5 - 1.0 mg daily
• iron absorption increases in response to low iron stores
menstruating women: 1 - 2 mg per day
pregnant women: 3 - 4 mg per day
• absorption is via active process
Deferoxamine mesylate (DFOM)
(CH2)5
H2N N
C
(CH2)2
C
N
(CH2)5
N
O O
OH H C
(CH2)2
C
O
N
O
OH (CH2)5
N
C
CH3
O
OH
H
A chelating agent which reacts with ferric ion to form
a 1:1 chelate known as ferrioxamine Marketed as
Desferal Injection (Ciba) Produced by Streptomyces
pilosus
• In the Indian context, absorption of iron from a
cereal-pulse based diet in adult male is 5% and a
conservative figure of 8% is considered in women
who are expected to have better absorption due to
iron deficient store. However in infants 6- 12
months, an absorption of 15% is derived based on
stable isotopic studies carried out recently.
• Indian diet contains ~ 7-9 mg/1000 kcal
(recalculated based on revised iron values from
Nutritive Value of Indian Foods). It is recommended
that the density of ascorbic acid should be at least
20 mg/1000 kcal (3 times by weight to achieve 1:2
molar ratio of iron to ascorbic acid) to ensure 5%
iron absorption .
Iron distribution and storage
• carried in blood stream via transferrin (a b globulin)
• stored in 2 forms:
• ferritin (a water soluble complex consisting of a core of ferric
hydroxide and a protein shell (apoferritin)
• hemosiderin (a particulate substance consisting of aggregates of
ferric core crystals)
• stored in liver, spleen, bone marrow, intestinal
mucosal cells and plasma
FOOD IRON
Fe++
Fe+++
APOFERRITIN
FERRITIN
mucosal cell
(upper small
intestine)
gastric HCl, ascorbic acid
intestinal
secretion
1-2 mg/day
Fe+++ - transferrin
plasma
apotransferin
Fe++ - hemoproteins
(hemoglobin, myoglobin
Fe+++ - ferritin
Fe+++ - hemosiderin
bone marrow
muscle
liver
unabsorbed Fe
(fecal excretion)
Body iron stores
• During growth spurt, it is necessary to consider allowances for iron
store. In males, during adolescence, about 6 mg/kg of iron is stored,
which increases to around 12-15 mg/kg subsequently.
• A 60 kg man would have about 810 mg of iron as storage iron;
therefore, an additional requirement of 0.4 mg of iron/d (810 mg
spread over a period of 5 y) is required during 13-18 years of age to
build up this store.
• In women, the stores are very low and is about 1/8th of that found in
males. Considering that there is constant drain of the nutrient, an
allowance of 5 mg/kg had been added for maintenance of stores
throughout adolescence in girls.
• However, no separate allowance for building up of stores is being
considered while deriving the RDA in adults due to reclaiming of RBC
iron and its re-utilization.
Iron elimination
• there is no mechanism for excretion of iron
• iron is normally lost by exfoliation of intestinal
mucosal cells into the stools
• trace amounts are lost in bile, urine and sweat
(no more than 1 mg per day)
• bleeding (vaginal, intestinal) is a more serious
mechanism of elimination
IRON REQUIREMENT
• Basis for deriving iron requirements
• Basal loss: The iron requirement for adults is equivalent
to bioavailable iron sufficient to replace daily
endogenous losses referred to as obligatory or basal
loss.
• Body iron loss and excretion in man have been
determined by turnover studies. The basal loss is
proportional to the body size or surface area and thus
in a 60 kg man it accounts for about 0.86 mg/day
Obligatory loss/Basal loss of
iron
• in a 60 kg man Basal loss
Amount mg/day
• Sweat/exfoliated skin 0.17
• Desquamated gastrointestinal cells 0.43
• Bile 0.17
• Urine 0.09
• Total loss 0.86
• From the data furnished above, the basal loss of iron
estimated is 14 g/kg/day (rounded off) and is used to
compute the basal iron requirement of Indians belonging to
different age groups, employing the actual body weights.
• The basal loss of iron in an adult man is around 14
μg/kg body weight/ day and therefore, an adult
male weighing 60 kg requires 0.84 mg of iron/ day.
Optimum haemoglobin: For calculating requirement of
iron needed for blood volume expansion during growth
phase and menstrual loss, normal haemoglobin
concentration of the particular group is used.
Group Haemoglobin g/L
Children 0.5-5 y >110
Children aged 5-11 y >115
Children aged 12-13 y >120
Men >130
Non-pregnant women >120
Pregnant women >110
Requirement for an adult woman (55 kg)
• In pre-menopausal women, besides basal loss of 14
μg/kg body weight, iron is required to replace blood
lost in menstruation.
• Menstrual loss is computed from the reported range
of blood loss (20-62 ml per cycle). A blood loss of 30
ml results in a loss of 12.5 mg iron per 28 day
menstrual cycle which is equivalent to 0.45 mg iron/d.
The range of iron loss is 0.3 – 0.9 mg or 8 μg/kg body
weights during the adolescent period and 16 μg/kg
after 18y of age (9.15, 9.16).
• Considering the basal loss and loss due to
menstruation, the requirement for an adult woman
works out to 14+16 =30 μg/kg or 1.65 mg/day.
PREGNANCY
• Iron requirements during pregnancy can be calculated taking into
consideration the iron needs for foetal growth, expansion of maternal
tissue including the red cell mass, iron in the placental tissue and the
blood loss during parturition.
• These additional requirements should be added to the basal
requirement. However, there is a saving of menstrual loss during
pregnancy
• Based on the available data for Indian and Western women, an
additional 760 mg of iron is required during the entire pregnancy
period (includes requirement for foetus + expansion of maternal red
cell mass + placenta and cord + obligatory loss) for Indian women
having a pre-pregnancy body weight of 55 kg and considering a
gestational weight gain of around 10 kg and 12 kg
Lactation
• Iron requirement during lactation is the sum of the requirement of
the mother and that required for making up the iron lost in breast
milk. Since there is amenorrhea during lactation, the basal
requirement will be the same as in the adult woman, i.e, 14 μg/ kg/d
or 0.77 mg/d.
• According to a recent study in India, iron content of breast milk is
around 14 moles/L or 0.78 mg/ L.
• Assuming that the average milk volume is around 650 ml/d, the
amount of iron needed works out to about 0.5 mg/d corresponding
to 9 μg/kg/d. The total requirement during lactation is about 1.27
mg/d, which works out to be lesser by about 0.4 mg/d, compared to
non-pregnant, non-lactating woman.
Requirement during Infancy
• There is not enough evidence available to establish RDA for iron
for infants from birth through 6 months of age.
• Recommended iron intake for this age group is based on the
average iron intake of healthy infants fed breast milk.
• Iron in human breast milk is well absorbed by infants. It is
recommended that infants be exclusively breast fed for the first six
months of life.
• It is estimated that infants can use greater than 50% of the iron in
breast milk and healthy full-term infants are born with a supply of
iron that lasts for 4 to 6 months.
• Considering the breast milk intake to be around 600
ml during this period with an iron content of 0.78
mg/L, the iron intake per day is about 0.47 mg/d.
• During this period small change occurs in storage
iron and haemoglobin levels. Thus, a full term infant
of 3.2 kg body weight needs only 0.23 mg/d to
maintain his/her haemoglobin at the normal
concentration of 110 g/L and to replace excretory
loss.
• Iron requirements increase markedly, especially in
relation to body size and energy intake during later 6
months of life; therefore, iron-enriched solid foods
should complement breast milk from 7 to 12 months
of age.
Iron requirement during infancy
Age of
infant
Wt (kg) Basal loss
(mg/d)
Blood
volume
expansion
(mg/d)
Skeletal
mass
Total
mg/d
Requirem
ent
μg/kg/d
0-6 m 5.4 Equal to milk iron 0.23 46
6-12 m 8.4 0.12 0.4 0.21 0.73 87
Iron requirement in preschool age
• During pre-school years (1-3 y), when growth rate slows
down and the body mass increases by 1.9 kg/y, there is
virtually no reserve store of iron between the ages 6
months and 2 years. Added to basal losses, the total
requirement during this period is about 0.434 mg/d.
• Body wt 12.9 kg
• Basal loss 0.181 mg/d
• For growth 0.270 mg/d
• Total 0.451 mg/d
Iron requirement in school age
• In childhood, the mean increase in body
weight is 2.8 kg/y, which necessitates an
iron requirement of 0.7 mg/d (Table 9.6).
The average iron requirement for growth
would be about 17 μg/kg/d. During
childhood (4-9+y) body store of iron builds
up to 5 mg/kg, which is maintained in girls
until menarche
Group age Requirement
mg/d
Adult men 0.84
Adult women 1.65
Pregnant women 2.80
Lactating women
0-6 months
1.27
Infants
0-6m
6-12m
46µg/kg/d
87µg/kg/d
Boys 10-12 1.05
13-15 1.60
16-17 1.37
Girls 10-12 1.33
13-15 1.36
16-17 1.30
IRON DEFICIENCY
Initial symptoms are vague and ill-defined
• easy fatigability
• lack of appetite
• headache
• dizziness
• palpitations
then: hypochromic-microcytic anemia
• microcytosis (small RBCs)
• hypochromia (poor fill of hemoglobin)
• poikilocytosis (bizarre shapes)
• anisocytosis (variable sizes)
IRON DEFICIENCY
Causes:
– excessive blood loss (parasitic, accidental, menstrual): is
most common cause
– rapid growth in children with limited intake of iron
– malabsorption
• gastric resection
• sprue
– increased metabolic requirement
• pregnancy, lactation or neoplasia
Diagnosis of iron deficiency
• hematology (microcytic hypochromic cells)
• low serum iron
• low serum ferritin( indicates low body stores)
• in some conditions (inflammation, hepatitis) ferritin
may be high
• low hemosiderin
• high total iron binding capacity (TIBC)
Treatment of iron deficiency
• give 200 - 400 mg of iron per day
• up to 25% of the iron preparation may be
absorbed
• 50 - 100 mg of iron may be utilized in case of
deficiency
• give on an empty stomach
• enteric coated iron tablet should not be used
since we want absorption to occur in the
stomach and proximal duodenum
Treatment of iron deficiency
• parenteral iron is used in patients who
have had bowel resections or in cases of
inflammatory bowel disease
– normally given IM (painful) Z-track minimizes
tatoo
• oral iron causes black stools, constipation,
cramping
• do not administer with antacids or metal
chelators (tetracyclines)
Acute iron toxicity
common in small children ingesting large doses
of soluble iron compounds toxicity is usually
divided into 4 phases:
1. 30 - 60 min. following ingestion
• abdominal pain
• nausea and vomiting
• signs of acidosis and cardiovascular collapse may be
seen
Acute iron toxicity
2. Period of improvement - last about 8 to 16
hours
3. Period of progressive cardiovascular collapse
(about 24 hrs after ingestion)
• convulsions
• coma
• high mortality
4. Gastrointestinal obstruction from scarring of
stomach and small intestine
Chronic iron toxicity
• causes
• hereditary hemochromatosis
• hemosiderosis
• symptoms
• cirrhosis: iron deposition in the liver
• diabetes: iron deposit in the pancreas (damage to beta
cells)
• skin pigmentation
• cardiac failure
• treatment: phlebotomy ( 1 unit of blood removes about 250
mg of iron
Iron toxicity
• Iron toxicity may be due to
hereditary hemochromatosis
blood transfusion
• hereditary hemochromatosis : Iron overload
is linked to a distinct gene that favors
excessive iron absorption if the iron is
available in the diet
• Frequent blood transfusions or long term
ingestion of large amounts of iron can lead to
abnormal accumulation of iron in the liver
• Saturation of tissue apoferritin with iron is
followed by the appearance of hemosiderin,
which is similer to ferritin but contains more iron
and is very insoluble and leads to pathological
iron storage condition known as hemosiderosis.
• If the hemosiderosis. Is associated with tissue
demage, it is called hemochromatosis
• Increased oxidation of LDL is also seen in
hemosiderosis.
Iodine
• Consumption of crops/plants grown on
iodine deficient soil leads to iodine
deficiency in population.
• Nutrient needed in a
minute quantity daily.
Recommended daily intake:
150 μg (Micronutrient)
• Total quantity present in body is (20 -
30mg)
in which mostly 75% in thyroid gland
• Iodine: Essential component of
thyroid hormones (T3 & T4),
which are needed for:
- Optimal mental & physical development
- Regulation of body metabolism
(Generation & utilization of body energy)
• Selenium is important in iodine metabolism because of its
presence in one enzyme responsible for forming active T3
from thyroglobulin stored in thyroid gland
Iodine : Daily requirements
Age/ Physiological group Upper limit
(g/kg/d)
RDA of iodine
(µg/d)
Adult 100-150
Infant Breast milk 90
Young children (1+ to 5+yrs) 50 90
School age children (6+ to 11+ y) 50 120
Adolescents and adults ( 12 y) 30 150
Pregnant & Lactating women 40 200
Upper limit of iodine
• Excess of iodine ingestion can be harmful, which
may inhibit the synthesis of thyroid hormones by
the thyroid. This iodine-induced hypothyroidism
is known as ‗Wolff-Chaikoff‖ effect, the
manifestation of which depends on level of iodine
intake before exposure to iodine excess. This is
generally encountered among newborns as
neonatal chemical hypothyroidism when women
during pregnancy receive high doses of iodine, in
the form of iodized oil injections
Iodized salt
• The average daily salt intake in India is 10 g.
Consumption levels are within the 5-15 g/day
range for children and adults. From the average
daily intake of 10 g iodine fortified salt, the
estimated availability of iodine from iodized salt
would be 150 g, of which about 30% is lost during
cooking. The remaining 105 g is ingested and
about 70% of it is absorbed by the body. This
means approximately only 73.5 g is absorbed per
day from iodine fortified salt. This quantity, when
added to the iodine daily consumed through
food, will be broadly comparable to the daily
physiological need of the body
Sources of iodine
• Food is the main source of iodine(appox. 90%)
– Meat, fish & dairy products
– Vegetables, cereals
• High amounts in sea fish & seaweeds
• Sea salt is a poor source of iodine
• Also obtained through drinking water.
• Daily intake of 10 g of iodized salt having iodine at a minimum
level of 15 ppm provides about 150 g per day, in addition to
iodine present in foods consumed
Iodine deficiency – Disease of the soil
Melting of Glaciers
Floods
Rivers changing course
Gradual leaching of iodine from soil due to:
Iodine deficiency : A disease of the soil
SOIL EROSION : WATER, SOIL Environmental iodine
deficiency
Low Availability : PLANTS Iodine poor feeds &
of iodine fodders, goitrogens
Effect on animals : LIVESTOCK Clinical & Reproductive
disorders,
Decreased productivity
Effect on people : HUMANS Health &
Socio - economic
impact
iodine deficiency disorder
Iodine deficiency leads to enlargement
of thyroid gland, known as endemic
goitre, as well as a wide spectrum of
disorders, which are termed as iodine
deficiency disorders (IDD) which include
abortion, stillbirths, low birth weight,
cretinism, neonatal chemical
hypothyroidism, psycho-motor defects,
impaired coordination, mental
retardation and hypothyroidism.
Goiter has been known since the days of Lord
Buddha and before
Earliest evidence of goiter: 3000 BC
Importance of iodine in
brain development
• 50,000 brain cells
produced/second
in developing
fetal brain
• 100 billion brain cells in
adult
• One million billion
connections between
these brain cells:
Determine IQ
Brain cell branching
• Diminished brain cell branching due to iodine deficiency
• Diminished branching  Less connections  Lower IQ
Importance of iodine in
brain development
90 % of human brain development occurs between 3rd month of
pregnancy & 3rd year of life
(Critical period)
CONTINUED……………
• Deficiency of iodine during this critical period of
development results in permanent brain damage
• This brain damage can primarily be prevented by correcting
iodine deficiency before & during pregnancy
• This makes it vital that all expectant & lactating mothers
get their daily requirement of iodine
CONTINUED……………
• Iodine deficiency is single
most common cause of
mental handicap
worldwide
• It is totally preventable
Spectrum of IDD
Goiter
Loss of 13 IQ points,
Leading Cause of Mental handicap
Cretinism
Spontaneous Abortions,
Stillbirths,
Birth Defects
Defects of Speech & Hearing,
Squint,
Psychomotor defects
Iceberg of IDD
Spectrum of Iodine Deficiency
Disorders
• Foetus Abortion
Still births
Congenital Anomalies
Increased Perinatal Mortality
Increased Infant Mortality
CONTINUED……………
Neurological Cretinism
–Mental Deficiency
–Deaf Mutism
–Spastic Diplegia
–Squint
• Foetus
CONTINUED……………
• Foetus Myxedematolous Cretinism
– Dwarfism
– Mental Deficiency
Psychomotor defects
CONTINUED……………
• Neonate Neonatal Goitre
Neonatal Hypothyroidism
Goitre
Juvenile Hypothyroidism
Impaired Mental Function
Retarded Physical Development
Child and
Adolescent
CONTINUED……………
• Adult Goitre with its complications
Hypothyroidism
Impaired Mental Function
Effects on all age groups:
Iodine deficiency & nuclear radiation
• Iodine deficiency leads to
increased susceptibility to
nuclear radiation
• When there is iodine sufficiency,
the thyroid gland does not take up
radioactive iodine
• Therefore, in iodine deficient populations,
it is critical to have effective universal salt
iodization
Effects on livestock
• Goiter
• Hypothyroidism
• Reproductive disorders
• Decreased productivity
(Milk, meat, wool, eggs)
• Lower work output
Goiter in animal
Iodine deficiency disorders:
A public health problem
Worldwide distribution
CONTINUED……………
• High risk groups:
- Pregnant & lactating women
- Pre-school children
• Elimination of IDD:
- is an important developmental &
social goal for governments
(UNGASS 2002; MDG – 2015)
- is possible
UNGASS: United Nations General Assembly Special Session on Children
MDG: Millennium Development Goals
Government’s Primary Concern
To ensure that:
• Every population should
&
• Every mother & child must
Get their daily supply of iodine
Iodine consumption on daily basis for all
times to come
• Daily requirement of iodine per person
is 150 µg – fits on the tip of hair !
• Lifetime requirement for 70 years is 5 gms – one
teaspoonful !
• However, this daily requirement
has to be met daily, for all times to come
• “Daily consumption of adequately
iodized salt is a healthy habit”
Vehicle for iodine : Salt
• One food item consumed every day,
by everybody in fixed quantities
• Rich or poor, urban or rural area,
man or woman, child or adult
• Average daily consumption in India
per person is 10 gm
• Iodization of salt is a simple process
• Cost of salt iodization is :
10 paise/person/year
Iodized salt – The panacea for iodine
deficiency
Salt production and iodization
(Supply)
Promotion of Iodized Salt Consumption
(Demand)
Classification of Goiter
• As per World Health Organization
Grade-0 No palpable or visible
Grade-1 Mass in the neck consistent with
enlarged thyroid
Palpable but not visible.
Moves upward in the neck as the
subject swallows
Grade -2 Swelling in the neck - visible
Consistent with enlarged thyroid when
the neck is palpated.
Iodine Deficiency Disorders prevalence & criteria for A
classification as a significant.
Indicator Mild Mod Severe
Goiter Grade
>0
5.0-19.9% 20-29.9% >= 30%
Median U.I.E.
(microgms/ltr.)
50-99 20-49 < 20
Iodine Deficiency = Goiter =
Visible Swelling
No Pain, Cosmetic problem
Cretinism: A rare event
= LOW PRIORITY
Brain Damage
Lack of Energy - hypothyroidism
Learning Disability, ↑Deaths
 Child Development & Child Survival
 Human Resource Development
= HIGH PRIORITY
The hourglass of IDD
Historic
view
1962-1983
Current
view
Universal Salt Iodization
• In India, the classical endemic belt of IDD extends from the State of Jammu
and Kashmir in the North, through parts of Punjab, Haryana, Himachal
Pradesh, Uttar Pradesh, Northern part of Bihar, and West Bengal to North-
Eastern states. Encouraged by the results of iodized salt supplementation
experiment in Kangra valley of Himachal Pradesh, Government of India
(GOI), in the year 1962, launched the National Goitre Control Programme
(NGCP).
• In 1983, Government of India took policy decision to iodize all salt meant
for human consumption
– Universal Salt Iodization (USI)
• Private sector was permitted and encouraged to produce iodized salt
• “Elimination of goiter” was included in Prime Minister’s 20-point National
Development Program
• In 1988, PFA Act was amended to specify that iodized salt should have
iodine in the concentration of at least 30 ppm at production level and at
least 15 ppm at the consumer level.
Changing status of
legislation
Changing status of legislation
Iodized Salt brought under revised PFA Act
1987
Sale & storage of non-iodized salt banned
1997
Central Government decides to lift ban on
sale of non-iodized salt
May 2000
Ban on sale of non-iodized salt lifted
September
2000
Policy decision taken for Universal Salt Iodization
1983
Iodized salt brought under PFA Act
1968
Withdrawal of the ban
• Government of India withdraws ban on sale
of non – iodized salt for human consumption
(13th September 2000)
• Reason given by Government of India:
“Matters of public health should be left to the
informed choice, and not enforced through
compulsion”
Before May 2000:
All States (29) & UT (6) had the ban in place except
Andhra Pradesh & Maharashtra (Partial ban)
Kerala (No ban)
Key issues in IDD
Key issues in IDD
• National vs. Multinational
• Consequences of excess iodine
• Cost of iodine
• Cost of iodized salt
IDD control program is a national effort
 Contribution Made For Assessment &
Tracking Progress:
- By national institutions
- With national support
- By national scientists
- Using national laboratories & equipments
Issue 1:
National vs Multinational
CONTINUED……………
• India is self-sufficient in production of
common salt
• High quality salt iodization plants
- manufactured in India,
- exported to other countries
• Technical assistance by national agencies
CONTINUED……………
• Conversion of iodine to potassium iodate
done in India
• Iodine imported:
- Less than 0.005% of all imports
- Only 20% of total iodine imported
is used for iodizing salt
- Rest (80%) goes to industries
(pharmaceuticals, medicare, dyes)
• Reason for import:
No natural source of iodine in India
• Japan: - Average intake is 3,000 g/day
- Seaweed soup
- 20 times the required amount
- No side effects reported
• Pharmacological dose of iodine:
- 200,000 g/day
- 1300 times required amounts
- can cause iodide goiter.
Issue 2:
Consequences of excess iodine – 1
Iodide goiter has not been
reported from salt iodization programs
CONTINUED……………
• Increased incidence of IIH
(Iodine Induced Hyperthyroidism)
– Place: Severe iodine deficiency of long duration
– Intervention: Introduction of salt with high iodine content
(100 ppm) in a short period of time
– Predisposing conditions: Pre-existing autonomous
thyroid nodule or latent Graves Disease
– People: Commonly affects older age group (>40 years)
Increased incidence of IIH is
transient, minimal and self limiting
Issue 3:
Cost of iodine for salt iodization
Total annual requirement of iodized salt in India
for 1,000 million population @5kg/person/year
5 million tons
Iodine required for salt iodisation@30ppm
(30gm/ton)
150,000 kg
(150 tons)
Price of iodine @ Rs. 666/Kg,
Therefore total price for 150 tons
Rs. 10 million
Cost of iodine/person/year 10 paise
Cost of iodine for salt iodization is 10 paise/person/year
(¼ cents/person/year)
Issue 4:
Price of iodized salt
Acts and Rules for Salt
• “Salt” is declared as an item of food under
Essential Commodities Act, 1955
• State governments have been authorized to
administer the Act for
– Fixing the prices of salt
– Its movement within their States,
if necessary
Community perception about iodized salt
Iodized Salt
Refined Salt
Packaged Salt
Branded Salt
High Priced Salt
Iodized Salt =
The reality
Phoda salt 0.25 – 1.00 Rs./Kg
Crystal salt 1.50 – 2.00 Rs./Kg
Powdered salt 2.00 – 4.00 Rs./Kg
Refined salt > 4.00 Rs./Kg
I
O
D
I
Z
A
T
I
O
N
Price of iodized salt through
Public Distribution System (PDS)
in some Indian states - 1
State / UT •PDS selling price/ kg.
Chhattisgarh •Rs. 0.25
Gujarat •Rs. 0.50
Tamilnadu •Rs. 2.50
Rajasthan •Rs. 2.50
Sikkim •Rs. 2.90 (Loose iodized)
Source: Annual Report (2003-2004), Salt Department, Govt. of India
Price of iodized salt through
Public Distribution System (PDS)
in some Indian states - 2
State / UT PDS selling price/ kg.
Arunachal Pradesh Rs. 3.15
Tripura Rs. 3.50
Orissa Rs. 2.00 – 7.00
Goa Rs. 6.00 – 7.00
Himachal Pradesh Rs. 7.50
Source: Annual Report (2003-2004), Salt Department, Govt. of India
Total Monthly Per Capita Consumer Expenditure
(MPCE) on salt per person *
*Reference period of 30 days
Source: National Sample Survey Round 55; NSS Report No. 545,
Household Consumer Expenditure in India: 1999-2000 – Key Results
Variable Rural Urban (In Rs.)
Salt Rs. 1.09 Rs. 1.38
All Food items Rs. 289 Rs. 411
Salt as a % of
All Food Items
0.37% 0.34%
Total Consumer
Expenditure
Rs. 486 Rs. 855
Salt as a % of Total
Consumer Expenditure
0.22% 0.16%
Consumer expenditure on salt is negligible : <0.5%
Universal salt iodization – Myths &
facts -1
Issues Myth Fact
Multinational
Multinational
companies have a
stronghold on
iodized salt
• All the salt in India is
produced, iodized, packaged
and sold by national
companies
• All research on iodine and
iodized salt is done by
national scientists
in national institutions
Monopoly
The large companies
have a monopoly over
the salt production
Most of the salt in India is
produced by the medium
and small-scale producers
Universal salt iodization – Myths &
facts - 2
Issues Myth Fact
Price
Iodization has lead to
an increase in the price
of salt
• Cost of iodine per person
per year is 10 paise!
• Iodization increases the
price by about 50 paise!
• Increased price is due to
costs of packaging, branding
& advertisement etc.
Packaged vs
non-packaged
salt
Iodized salt sold loose
is not effective
• Loose iodized salt is
equally effective
• Over 70 percent of total
iodized salt produced is sold
loose
“I would be hard-hearted enough to let the
sick die if you can tell me how to prevent
others from falling sick”
- Mahatma Gandhi
Why did consumption of
adequately iodized salt decrease?
Government of India lifts ban
on sale of Non-iodized salt :
13 Sept., 2000
As a result, sense of complacency
at State level
Increase in Rail Tariff –
1st April 2002
• Consequently,
increase in movement of
iodized salt by road
(especially from Rajasthan)
• Currently,
No mechanism in place for monitoring quality
of iodized salt transported by road
CONTINUED……………
TRANSPORT OF SALT
RAIL
BY ROAD
BY RLY.
22%
25%
53%
Disappearance of most common
visible effect of iodine deficiency i.e. goiter
Perception in people that :
- iodized salt consumption is
NOT required anymore
CONTINUED……………
CONTINUED……………
Communication strategy
– DID NOT focus on
mental handicap as a
consequence of iodine deficiency
–WAS NOT commensurate with
seriousness of problem
both in terms of scale & frequency
The Dandi March
FREEDOM FROM
PREVENTABLE BRAIN DAMAGE
THROUGH
DAILY CONSUMPTION OF
ADEQUATELY IODIZED SALT
Platinum jubilee of Dandi March
(12th March – 6th April 1930-2005)
Towards the Elimination of
Iodine Deficiency Disorders in India
• Continue with Priority for
Rail movement for Iodized Salt
• Reduce rail tariff for iodized salt
Supply (Push) – Government - 1
CONTINUED……………
• Exempt Iodine for iodized salt
from import duty and sales tax
“Vaccine for optimum brain development”
Iodized salt exempted from VAT :
Empowered Committee taken decision
Final notification to be issued
•Efforts to reduce price
differentials between iodized &
non-iodized salt
•More cost effective targeting of
the PDS to address macro and
micronutrient deficiencies
…Iodized Salt
CONTINUED……………
Supply (Push) – Salt Industry
• Alliance with salt producers
– Good Manufacturing Practices
– Low Price , High Quality
– Active Assistance in obtaining International ISO
9002 accreditation
• External Independent Quality Assurance
Program
Supply (Push) – Salt Industry
Support Small scale salt producers
• Need to focus on small scale salt producers
(Suppliers to Low Socio-economic Status)
• Potassium iodate subsidy in kind for 3 yrs
- Form revolving fund for purchase of
potassium iodate within this time
• Initial assistance for repair and maintenance of salt
iodization plants
• Technical & training support for:
- Improving quantity & quality of common salt
- Maintenance of salt iodization plants
- Establishing iodine monitoring laboratories
• Ongoing external quality assurance for
iodized salt
Demand (Pull)
• Renewed focus on
iodine & brain development :
Iodine Quota & Intelligence Quotient
• Education for All : Knowledge Power
• India as a developed country
• Regular Partnership with Media
Action
1) Engage the services of a professional communication
agency
2) Consortium of Private iodized salt manufacturers to
participate actively in this campaign
“Simple Goitre is the easiest of all known diseases to prevent…
It may be excluded from the list of human diseases
as soon as the society determines to make the effort.”
- Dr. David Marine, 1920
(Pioneer in mass prophylaxis of endemic goiter)
Thus, The Story of iodine deficiency continues…
Prevalence (%) of
goiter in 6-<12 years children by
type of survey
0
1
2
3
4
5
6
NNMB-MND ICMR 2001
percent
percent
Iodized salt production and
supply (Salt Department) (in lakh
tonnes)
State/UT
banned
Year No. of Iodisation Units Capacity Requirements Production Supplies Full - Partial
1983 13 3.86 9.16 2.13 1.41 7 4
1986 115 16.08 11.27 7.27 5.98 10 6
1989 353 48.71 27.24 22.74 21.34 17 6
1992 529 65.33 29.62 27.13 26.87 22 6
1993 519 65.67 33.31 28.23 27.23 24 5
1994 572 75.04 35.84 29.45 28.01 25 4
1995 657 82.33 42.81 36.96 34.88 27 2
1996 699 87.28 51.70 40.95 40.92 27 2
1997 784 107.50 52.00 40.41 39.07 29 2
1998 809* 115.21* 52.00 39.70 37.42 29 2
2000 926 143.48 - 46.89 - - -
*As on 31st March, 1998
Source Reference 7.11.3.7
Percent distribution of
households, by level of iodine in
salt
0 10 20 30 40 50
15PPM
<15PPM
Not Iodised
NFHS 2005-06
Percent distribution of
household heads by degree of
iodization
0 50 100 150 200
RURAL
URBAN
LOW
MEDIUM
HIGH
NOT IODISED
7ppm
15ppm
NFSH 3
Daily consumption of adequately iodized salt
is a healthy habit
Towards Sustainable Elimination of IDD
Zinc (Zn)
• Functions
– Structural, catalytic and regulatory functions in the cell, primarily as an
intracellular ion
– Structural role: as component of several proteins
– Have association with more than 300 enzymes involving synthesis and
degradation of macro nutrients
– As an intracellualar signal in brain cells where it is stored in specific
synaptic vesicals and is fundamental to normal CNS function
– Involved in the stabilization of protein and nucleic acid structure and the
integrity of subcellular organelles
– Component of metalloenzymes
• Includes DNA and RNA synthases
– Synthesis of skin keratin and collagen
– Role in transport processes, immune function and expression of genetic
information
– Present in nucleus – stabilize RNA and DNA structure, required for
activity of RNA polymerase, important in cell division
• Zn also functions inchromatin particles involved in
transcription and replication, and it protects against age-
related macular degeneration
• Prevent common cold, Zn gluconate lozenges or nasal
sprays are not very effective
• Zn present in bone, bone enzymesand at the zone of
demaracation
• Required for adequate osteoblastic activity, formation of
bone enzymes such as alkaline phosphotase, and
calcification
• Beta alanyihistidine (carnosine) is a Zn compound that
stimulated bone formation intensively and restores bone
loss from aging, skeletal unloading, aluminium bone
toxacity, Ca and vitamin D deficiency, adjuvant arthritis,
estrogen deficiency, diabetes and fracture healing
Metallothionine
• Metallothionine is the most abundant, non
enzymatic zinc containing protein
• It have role in Zn absorption
• It may act as an intracellular reservoir that can
donate Zn ions to other proteons, or it may have a
redox role that reduce oxidative stress, especially in
cells with high stress
• It may have role in detoxification of minerals as well
as in their absorption
• The intestinal absorption found in one of the
above studies with a typical cereal and lentil-
based diet is 36%, while in the second study using
typical diets consumed in the four regions of the
country, absorption was found to vary between
10-25%, with a mean value around 20%.
• diets with higher Zn (>12 mg/d) had lower
absorption (<16%) and those with lower Zn had
better absorption (increasing from 14% to 38%
with decreasing intakes from 12 to 6 mg/d)
• It is estimated that the endogenous loss is about
1.67 mg, integumental loss of 0.43 mg and
urinary excretion of 0.56 mg, accounting for 2.7
mg of absorbed Zn as the requirement for 51 kg
average male.
RDA
• Adult men 12mg/day
• NPNL Women 10mg/day
• Pregnant 12mg/day
• Lactating 12mg/day
• Children (1-9yrs) 5, 7, 8 mg/day
• Children (10-12yrs) 9mg/day
• Children (13-15yrs) 11mg/day
• Children (16-17yrs) 12 mg/day
Zinc (Zn): Dietary Sources & Bioavailability
• Bioavailability influenced by:
– Phytates
– Iron
– Calcium
– Animal sources
– Acidic substances
• In general, the dietary intake appears to range from 7-12
mg/d , which is low as compared to the intakes reported
from the Western countries.
• It is well known that intestinal absorption of zinc is
markedly inhibited by the phytate and tannin content of
diet.
• Habitual Indian vegetarian (mixed cereal/ pulse) diets are
rich in phytate and thus the bio-availability of Zn is
expected to be poor
• In general, the higher Zn-Phytate molar ratio of >15
occurring in Indian diets is supposed to cause low bio-
availability (less than 15% absorption) as against 20-25%
seen with low phytate/ animal food rich diets.
• Thus more than the total content of zinc, bio-available
zinc is important to maintain adequate Zn status.
Zinc Deficiency & Toxicity
• Deficiency
– Decreases appetite
– Increases morbidity
– Decreases growth
– Skin irritations, diarrhea,
delayed sexual
maturation
• Toxicity
– Supplements
– Poor immune function
– Depressed levels of HDL
– Impaired copper status
– Nausea, vomiting, loss of
appetite
Zinc deficiency
• Clinical sign
– Impaired reproduction, delayed puberty, hypoganadism
– Growth retardation, short stature
– Low insulin and high ammonia in blood
– Low white blood cell count; susceptibility to infections
– Anorexia
– Night blindness
– Mild anaemia
Additional symptoms
Hypogusia (decreased taste acuity)
Delayed wound healing
Alopecia
Lesions of skin, disorders of hair, feathers, etc.
• Parakeratosis
• Immunologic defects
thymic atrophy
Lymphopenia
Reduced lymphocyte proliferative response to
mitogens
A selective decrease in T helper cells
Decreased NK cellsactivity
Allergy
Deficient thymic hormone activity
Impaired IL2 production
anergy
Acrodermatitis enteropathica
• An autosomal recessive disease, characterized
by Zn malabsorption, result in eczematoid skin
lesions, alopecia, diarrohoea, bacterial and
yeast infections and even death if left untreated
• Symptoms develop during weaning
• hZIP4 gene is involved in this disease
Zinc (Zn) Toxicity
• Toxicity (100-300mg/day), UL= 40mg/day
– Relatively non-toxic in excess
– Anemia
– Fever and CNS disturbances
– GI irritation
– Higher LDL and lower HDL levels
– High white blood cell count
– Renal failure
Chromium
• Involved in carbohydrate, lipid, and protein metabolism
– Regulation of gene expression
– Component of “glucose tolerance factor” when chelated with
niacin and several amino acids
• Increased insulin binding to receptor
• Increased numbers of insulin receptors
• Alleviates gestational diabetes in some cases
• Established as an essential mineral in swine
• However, requirement is not known
– In the ppb range
• Hard to show a deficiency
• Absorption: carried by transferrin, absorption is 2% or
less
Manganese (Mn): Dietary Sources & Regulation
• Whole grains, pineapples, nuts, legumes, dark
green leafy vegetables, water
• <10% absorbed
• Excess incorporated into bile & excreted in
feces
Functions of Manganese
• Cofactor for metalloenzymes
– Gluconeogenesis
– Bone formation
• Energy metabolism
• Cofactor for superoxide dismutase
Manganese (Mn)
• 10-20mg in adult human body
• Functions
– Cofactor for enzyme systems
Glutamine synthase
Pyruvate carboxylase
mitochondrial SOD
– Synthesis of chondroitin sulfate in bone matrix
• Deficiency
– Defective bone formation
– Affect reproductive capacity, pancreatic function, and aspects of CHO
metabolism
– Perosis – slipped tendon
• Poultry
• Diet is adequate for most species
Mn toxicity
• The excess, which accumulated in the liver and CNS
produces Parkinson like syndrome
• Neurotoxicity
• Impaired energy metabolism
• Cause cell death
• Symptoms:
Headache, dizziness, hepatic dysfunction
Cobalt
• In 1930s, a wasting
disease was first
associated with cobalt
deficiency in plants and
soils
• Vitamin B12 was found to
contain cobalt
Cobalt and Vitamin B12
• Injection of cobalt-deficient sheep and
cattle with vitamin B12 was as effective as
feeding cobalt in curing the disease
• Injection of cobalt has no effect
• Microbial synthesis of vitamin B12 was the
key!
Cobalt (Co) – Trace Mineral
• Blood level: 1mcg of Co per 100 ml
• Functions
– Required only as a component of vitamin B12
• Ruminant animals require for microbes
– Vitamin B12 is an essential cofactor for enzymes involved in:
• Propionate metabolism
– methylmalonyl CoA to succinyl CoA
DNA synthesis
Bacterial synthesis of methionine
• Deficiency
– Mimics B12 deficiency in ruminants (microcytic anaemia)
• Anemia
• Emaciation
• Toxicity : polycythemia, hyperplasia of reticulocytes
and increased blood volume
Chromium (Cr): Dietary Sources, Bioavailability,
& Regulation
• Food content depends on soil
• Whole grains, fruits/veg, processed meats, beer,
wine
• Bioavailability affected by:
– Vitamin C
– Acidic medications
– Antacids
• Transported in blood to liver
• Excess excreted in urine & feces
• Deficiency:
• Insulin resistance
• Lipid abnormalities
• Toxicity
• Skin lesions
• Increased risk of cancer
• Cr picolinate improves strength, body
composition, endurance or other characteristics
or physical fitness are controversial
Selenium
• Component of glutathione peroxidase (GSH-Px)
– Free radical scavenger that catalyzes removal of hydrogen peroxide from cell
membranes
– 40mcg Se is required to main GSH –Px activity
– Interrelated with vitamin E
• Can partially spare vitamin E (makes up for slight deficiencies)
• Improves killing ability of neutrophils
– Reduces the prevalence and severity of mastitis
• Conversion of T4 (thyroxine) to T3 (4x more active)
- Type-I iodothyronine 5’-deiodinase an enzyme capable of converting T4 to
T3 is as a selanoprotein
GSH = reduced glutathione
GSSG = oxidized glutathione
GSH + H2O2 GSSG + H2O
• Selanoprotein P may act as a free radical
scavenger or a transporter of Se
• As Selonomethionine and selanocysteine, exists
in several protein s that are widely distributed in
the body
• Phospholipid hydroperoxide GSH-Px is found in
lipid soluble fractions of the cell and has roles in
lipid and eicosonoid metabolism
• Absorption: upper segment of the small
intestine
• Selenium status is assessed by measuring Se or
GSH-Px in serum, platelets and erythrocytes or
in white blood
• Erythrocyte Se measurement is an indicator of
long term intake
• Se is transported bound to albumin initially and
subsequently to α2 -globulin
Selenium - Deficiencies
• Keshan disease is a cardiomyppathy of humans,
characterized by heart enlargement replacing the muscle
tissue with fibrous tissues
mainly affect children and women
• Kashan back disease : common in preadolescent and
adolescent children
• Involves symmetric stiffness, swelling and often pain in
interphalangeal joints of the fingers followed by generalized
osteoarthritis
• White muscle disease in lambs and calves
– Skeletal and cardiac myopathies
• Exudative diathesis (hemorrhagic disease) in chicks
• Liver necrosis
• Concentration in feeds is soil dependent
– Toxicity/deficiency related to geographic area
White Muscle Disease
• Results from a
deficiency of
selenium or vitamin E
• Characterized by
white streaks in
striated muscle
• Prevented by
injection of vitamin E
and selenium
Selenium
• Selenosis include skin and nail changes, tooth decay and
nonspecific GI and neurologic abnormalities
• Toxicity causes blind staggers or alkali disease
• Range between minimum requirement and maximum
tolerable level is narrow
– Supplementation must be done with care
• FDA regulations allow only two forms of inorganic selenium
(sodium selenite and sodium selenate) to be used
– 0.3 mg of supplemental selenium/kg of dietary DM is maximum
Molybdenum (Mo)
• Absorbed in intestine
• Circulated to liver via blood
• Sources
– Legumes, cereals, organ meats
Functions of Molybdenum
• Redox reactions
• Cofactor for several enzymes
• Metabolism of:
– Sulfur-containing amino acids
– DNA & RNA
• Detoxifying drugs in liver
Molybdenum Deficiency & Toxicity
• Deficiency
– Rare
• Toxicity
– No known effects in humans
– Animals – disrupts reproduction
Tin
• produces accelerated growth in deficient
rats
• tin is similar to carbon in its tendency to
form covalent bonds
• may have a role with heme-containing
enzymes:heme oxygenase and
cytochrome P-450
• largest quantities are found in kidneys and
skin
• human intake: ~ 1.5 - 3.5mg/day
Vanadium
• essentiality established in rats and
chicks
• human daily intake has been estimated
at 2 mg
• plays a role in lipid metabolism
(deficient chicks have a high plasma
cholesterol and triglyceride levels)
• may also function as an oxidation-
reduction catalyst
Chlorine
• Functions
– Acid-base and osmotic regulation
– HCl and chloride salts in gastric secretions
• Deficiencies
– Metabolic alkalosis
• Increased bicarbonate compensates for decreased
Cl
– Growth retardation
Copper (Cu): Dietary Sources &
Bioavailability
• Forms
– Cupric
– Cuprous
• Organ meats, shellfish, whole-grain
products, mushrooms, nuts, legumes
• Bioavailability decreases with
– Antacids
– Iron
Absorption, Metabolism, & Regulation of
Copper
• Absorbed in small intestine & stomach
• Influenced by Cu status
• Ceruloplasmin
• Excess incorporated into bile & eliminated
in feces
Functions of Copper
• Cofactor for metalloenzymes in redox
reactions:
– ATP production
• Cytochrome c oxidase
– Iron metabolism
– Neural function
– Antioxidant function
• Superoxide dismutase
– Connective tissue synthesis
Copper Deficiency & Toxicity
• Deficiency
– Hospitalized patients & preterm infants
– Antacids
• Signs & Symptoms
– Defective connective tissue, anemia, neural
problems
• Toxicity
– Rare
Copper Deficiency
• Anemia
• Depigmentation of hair or wool
– Black sheep are sometimes kept as indicators
of marginal Cu deficiency
• Loss of wool crimp (“steely” wool)
• Bone disorders
• Central nervous lesions with muscular
incoordination
Induced Copper Deficiency
• Caused by relatively high levels of Mo
and/or S
• Site of interaction is in the rumen
– Formation of insoluble Cu salts including
sulfides and thiomolybdates
• Net effect is decreased Cu absorption
Induced Copper Toxicity
• Occurs with “normal” dietary levels of Cu
and “low” levels of Mo and S
• Accumulates in liver
• Sheep are more susceptible than cattle or
pigs
Fluoride (F-): Dietary Sources, Bioavailability, &
Regulation
• Not an essential nutrient
• Potatoes, tea, legumes, fish w/bones, toothpaste,
added to drinking water
• American Dental Association
– Fluoridation 1-2 ppm
• Absorbed via small intestine
• Circulates in blood to liver & then teeth & bone
• Excess excreted in urine
Functions of Fluoride
• Part of bone & teeth matrix
• Stimulates maturation of osteoblasts
• Topical application decreases bacteria in
mouth
– Fewer cavities
Fluoride Deficiency & Toxicity
• Deficiency
– None known
• Toxicity
– GI upset, excessive production of saliva, watery
eyes, heart problems, coma
– Dental fluorosis
– Skeletal fluorosis

minerals.pptx

  • 1.
    Micro Minerals Presented by: Kavita Kachhawa
  • 2.
    Minerals • Minerals areelements of the periodic table • More than 25 have been isolated in which 21 elements have been shown to be essential (excluding C, H, and O) • Minerals make up about 4 to 5% of body weight (for a 70 kg individual: 2.8-3.5 kg) • Many minerals are found in ionic form (others as legends or covalent compounds) • Inorganic elemental atoms that are essential nutrients. • Not changed by digestion or metabolism.
  • 3.
    Minerals • Two categories: •Macrominerals > 0.005% • Microminerals < 0.005% • Macrominerals are essential at levels of 100mg or more per day for human adults • Microminerals are often referred to as trace elements required <15mg/day. (Mahan et al 2012)
  • 4.
    Classification • Macro orMajor minerals – Sodium, potassium, magnesium, calcium, phosphorus, sulfur, chloride • Present in body tissues at concentrations >50 mg/kg (50 ppm) • Micro or Trace minerals (body needs relatively less) – Chromium, manganese, iron, cobalt, molybdenum, copper, zinc, fluoride, iodine, selenium, silicon, tin, arsenic, nickel… • Present in body tissues at concentrations <50 mg/kg (50 ppm)
  • 5.
    Nutritionally Important Minerals MacroTrace Element g/kg Element mg/kg Ca P K Na Cl S Mg 15 10 2 1.6 1.1 1.5 0.4 Fe Zn Cu Mo Se I Mn Co 20-50 10-50 1-5 1-4 1-2 0.3-0.6 0.2-0.5 0.02-0.1
  • 6.
    Macro minerals Body concentration: Cacalcium 1200 grams P phosphorus 860 grams S sulfur 300 grams K potassium 180 grams Cl chloride 74 grams Na sodium 64 grams Mg magnesium 25 grams Needed in > 100 mg/d
  • 7.
    Bioavailability, & Regulationof Major Minerals • Bioavailability – Influenced by genetics, aging, nutritional status & other food compounds • Absorption – Small intestine & large intestine • Regulation – Kidneys & small intestine
  • 8.
    Micro minerals Body concentration: Ffluorine 2.6g V vanadium 0.018 Zn zinc 2.0 Sn tin 0.017 Cu copper 0.1 Se selenium 0.013 I iodine 0.025 Mn manganese 0.012 Cr chromium 0.006 Ni nickel 0.010 Co cobalt 0.0015 Mo molybdenum 0.009 Si silicon 0.024
  • 9.
    Micro Minerals (11) •Iron • Zinc • Iodide • Selenium • Copper • Manganese • Fluoride • Chromium • Molybdenum • Selenium • Cobalt • Boron
  • 10.
    Ultra trace elemnets •Aresenic • Aluminium • Tin • Nickel • Vanadium • Silicon
  • 11.
    Other micro mineralsfound in humans Sr (strontium) Br (bromine) Au (gold) Ag (silver) Al (aluminum) Bi (bismuth) As (arsenic) B (boron) The function of these minerals has not been established as of to date
  • 12.
    Minerals in Foods •Found in all food groups. • More reliably found in animal products. • Often other substances in foods decrease absorption (bioavailability) of minerals – Oxalate, found in spinach, prevents absorption of most calcium in spinach. – Phytate, form of phosphorous in most plants makes it poorly available
  • 13.
    Factors Affecting Requirements •Physiological state/level of production • Tissue storage • Interactions with other minerals
  • 14.
    Scientific development whichhave contributed to trace element knowledge • Design of highly purified and specially constituted diets • Advances in analytical measurements • Colorimetry • Fluorimetry • Flame photometry • Neutron activation analysis • Atomic absorption spectroscopy • Microwave excitation emission spectroscopy • Isolation and study of metallo enzymes
  • 15.
    Functions of minerals •Provide a suitable medium for cellular activity – permeability of membranes – irritability of muscles and nerve cells • Play a primary role in osmotic phenomenon • Involved in acid base-balance • Confer rigidity and hardness to certain tissues (bones and teeth) • Become part of specialized compounds
  • 16.
    Metallo enzymes • metalis firmly bound • metal to protein ratio is constant • metal to enzyme activity ratio is constant • metal is unique • no enzyme activity without metal • Examples of metalloenzymes: – superoxide dismutase (Zn and Cu) – carboxypeptidase A (Zn) – carbonic anhydrase (Zn) – cytochrome oxidase (Fe and Cu) – xanthine oxidase (Co and Fe)
  • 17.
    Metal-activated enzymes • metalis reversibly bound • metal to protein ratio is variable • metal to enzyme activity ratio is variable • metal is not necessarily unique • enzyme activity may exit without metal • Examples of metal-activated enzymes – creatine kinase (Mg, Mn, Ca or Co) – glycogen phosphorylase kinase (Ca) – salivary and pancreatic alpha-amylases (Ca)
  • 18.
    Iron • Iron wasfirst identified as constituent of the body by Lernery in 1713. • In 1800, Lecanu identified iron in metallo protein Hb • The body contains about 2.5 to 4 g iron in body • The precise amount of iron in any individual depends on gender, age, size, nutritional status, general health and level of iron stores.
  • 19.
    Iron (Fe) • 2types of body iron – heme iron 60-70% • Hemoglobin (60-70%), • myoglobin (3-4%), • enzymes (5-15%,) catalases, peroxidases, cytochromes (a, b and c – involved in electron transport), cytochrome P450 (involved in drug metabolism) – non-heme iron • storage iron (15-30%) ferritin, hemosiderin, hemofuscin, • transport iron (0.1%) transferrin, ferroflavoproteins, aromatic amino acid hydroxylases • food iron is also classified as heme and non-heme
  • 20.
    Food iron heme iron –meats – poultry – fish 20-23% of heme-iron is absorbable non-heme iron – vegetables – fruits – legumes – nuts – breads and cereals only ~ 3% on non heme iron is absorbed
  • 21.
  • 22.
    • The functionsof iron relate to its ability to participate in oxidation and reductions reactions. Chemically, iron is a highly reactive element that can interact with O2 to form intermediates with the potential of damaging cell membrane or degrading DNA. • Iron must be tightly bound to proteins to prevent these potentially destructive oxidative effects.
  • 23.
    Cofactor of coenzymeand other proteins • Conversion of beta carotene to active vitamin A • Synthesis of purines • Synthesis of carnitine • Synthesis of collagen • Detoxification of drugs • Synthesis of neuratransmittors like dopamin, serotonin and norepinephrine • Essential for catecholamine metabolism
  • 24.
    • Ribonucleotide reductase,the rate limiting enzyme involved in DNA synthesis, is also an Iron enzyme • Other enzymes, including several in brain requires Fe
  • 25.
    Formation of RBC Proerythroblast Basophillerythroblast Polychromotophill erythroblast Orthochromic erythroblast Reticulocyte Erythrocyte
  • 26.
    Iron and immunity Irondeficiency compromises humoral immune responses to a much lesser extend than functional changes in cell mediated immunity. • T lymphocyte functions are impaired along with the depression of T lymphocyte number. There is a reduction in the proportion and absolute number of T cells. There is also defective T lymphocyte induced proliferation response.
  • 27.
    • Humoral immuneresponse is generally unaltered. • Immunoglobulin production and function are normal. • Serum concentration of complement is normal. • Phagocytic function is normal but there is reduced bactericidal activity of neutrophil, which is reversed with iron therapy. • NK cell activity is decreased. • Impaired IL 2 production by lymphocytes. • Reduced production of macrophage migration inhibition factor.
  • 28.
    Thymus weight cytotoxity Total lymphocytes CD4+ CD8+ ratio CELL MEDIATEDIMMUNITY HUMORAL IMMUNITY B cell proliferation B lymphocytes Immunoglobulin
  • 29.
    Macrophages Phagocytosis Neutrophil migration Neutrophil phagocytosis Neutrophilbactericidal activity NK cell activity TNF secretion complement OTHER IMMUNE FUNCTIONS
  • 30.
    • Numerous watersoluble drugs and endogenous organic molecules are transformed by the iron containing cytochrome P-450 system in liver into more water soluble molecules that can be secreted in the bile and eliminated • Two iron binding proteins- transferrin (in blood) and lactoferrin (in breast milk)- seem to protect the body against infection by withholding iron from microorganisms that it need for proliferation.
  • 31.
    Iron in oxidativeproduction of ATP • The cytochromes, present in nearly all cells, function in the mitochondrial respiratory chain in the transfer of el- and the storage of energy through alternate oxidation and reduction of Fe.
  • 32.
    Iron absorption • Occursin upper part of small intestine • About 10% of food iron is absorbed • Requires gastric HCl (releases ionic iron) also requires copper • Ferrous is better absorbed than ferric form • Fe++ forms chelates with ascobic acid, certain sugars and amino acid
  • 33.
    • Broadly, twotypes of methods - chemical balance and isotopic method, were used in determining the absorption and retention of iron in human body for requirement of iron in India • In the very first chemical balance studies carried out on Indians, absorption of iron from various Indian diets was found to vary from 7-20% (median-10%) • in pregnancy, iron absorption increased from a mean of 7 % to 30 % and to 33 % at gestational weeks 8 - 16, 27 - 32 and 36 - 39 respectively. • The absorption of iron was better among those with low per cent transferrin saturation than in women with high per cent transferrin saturation. • As much as 58% of 30 mg of dietary iron ingested per day could be absorbed (17.5 mg) by an iron deficient full-term pregnant woman.
  • 34.
    Iron absorption • Theiron density of Indian diet is around 8.5 mg/1000 kcal based on diet survey records and is around 9 mg/1000 kcal based on chemical analyses which are lower than previously estimated figures due to 30% contaminant iron (14.2 mg/1000 kcal). a normal person absorbs 5 -10% of this iron or 0.5 - 1.0 mg daily • iron absorption increases in response to low iron stores menstruating women: 1 - 2 mg per day pregnant women: 3 - 4 mg per day • absorption is via active process
  • 35.
    Deferoxamine mesylate (DFOM) (CH2)5 H2NN C (CH2)2 C N (CH2)5 N O O OH H C (CH2)2 C O N O OH (CH2)5 N C CH3 O OH H A chelating agent which reacts with ferric ion to form a 1:1 chelate known as ferrioxamine Marketed as Desferal Injection (Ciba) Produced by Streptomyces pilosus
  • 36.
    • In theIndian context, absorption of iron from a cereal-pulse based diet in adult male is 5% and a conservative figure of 8% is considered in women who are expected to have better absorption due to iron deficient store. However in infants 6- 12 months, an absorption of 15% is derived based on stable isotopic studies carried out recently. • Indian diet contains ~ 7-9 mg/1000 kcal (recalculated based on revised iron values from Nutritive Value of Indian Foods). It is recommended that the density of ascorbic acid should be at least 20 mg/1000 kcal (3 times by weight to achieve 1:2 molar ratio of iron to ascorbic acid) to ensure 5% iron absorption .
  • 37.
    Iron distribution andstorage • carried in blood stream via transferrin (a b globulin) • stored in 2 forms: • ferritin (a water soluble complex consisting of a core of ferric hydroxide and a protein shell (apoferritin) • hemosiderin (a particulate substance consisting of aggregates of ferric core crystals) • stored in liver, spleen, bone marrow, intestinal mucosal cells and plasma
  • 38.
    FOOD IRON Fe++ Fe+++ APOFERRITIN FERRITIN mucosal cell (uppersmall intestine) gastric HCl, ascorbic acid intestinal secretion 1-2 mg/day Fe+++ - transferrin plasma apotransferin Fe++ - hemoproteins (hemoglobin, myoglobin Fe+++ - ferritin Fe+++ - hemosiderin bone marrow muscle liver unabsorbed Fe (fecal excretion)
  • 39.
    Body iron stores •During growth spurt, it is necessary to consider allowances for iron store. In males, during adolescence, about 6 mg/kg of iron is stored, which increases to around 12-15 mg/kg subsequently. • A 60 kg man would have about 810 mg of iron as storage iron; therefore, an additional requirement of 0.4 mg of iron/d (810 mg spread over a period of 5 y) is required during 13-18 years of age to build up this store. • In women, the stores are very low and is about 1/8th of that found in males. Considering that there is constant drain of the nutrient, an allowance of 5 mg/kg had been added for maintenance of stores throughout adolescence in girls. • However, no separate allowance for building up of stores is being considered while deriving the RDA in adults due to reclaiming of RBC iron and its re-utilization.
  • 40.
    Iron elimination • thereis no mechanism for excretion of iron • iron is normally lost by exfoliation of intestinal mucosal cells into the stools • trace amounts are lost in bile, urine and sweat (no more than 1 mg per day) • bleeding (vaginal, intestinal) is a more serious mechanism of elimination
  • 41.
    IRON REQUIREMENT • Basisfor deriving iron requirements • Basal loss: The iron requirement for adults is equivalent to bioavailable iron sufficient to replace daily endogenous losses referred to as obligatory or basal loss. • Body iron loss and excretion in man have been determined by turnover studies. The basal loss is proportional to the body size or surface area and thus in a 60 kg man it accounts for about 0.86 mg/day
  • 42.
    Obligatory loss/Basal lossof iron • in a 60 kg man Basal loss Amount mg/day • Sweat/exfoliated skin 0.17 • Desquamated gastrointestinal cells 0.43 • Bile 0.17 • Urine 0.09 • Total loss 0.86
  • 43.
    • From thedata furnished above, the basal loss of iron estimated is 14 g/kg/day (rounded off) and is used to compute the basal iron requirement of Indians belonging to different age groups, employing the actual body weights. • The basal loss of iron in an adult man is around 14 μg/kg body weight/ day and therefore, an adult male weighing 60 kg requires 0.84 mg of iron/ day.
  • 44.
    Optimum haemoglobin: Forcalculating requirement of iron needed for blood volume expansion during growth phase and menstrual loss, normal haemoglobin concentration of the particular group is used. Group Haemoglobin g/L Children 0.5-5 y >110 Children aged 5-11 y >115 Children aged 12-13 y >120 Men >130 Non-pregnant women >120 Pregnant women >110
  • 45.
    Requirement for anadult woman (55 kg) • In pre-menopausal women, besides basal loss of 14 μg/kg body weight, iron is required to replace blood lost in menstruation. • Menstrual loss is computed from the reported range of blood loss (20-62 ml per cycle). A blood loss of 30 ml results in a loss of 12.5 mg iron per 28 day menstrual cycle which is equivalent to 0.45 mg iron/d. The range of iron loss is 0.3 – 0.9 mg or 8 μg/kg body weights during the adolescent period and 16 μg/kg after 18y of age (9.15, 9.16). • Considering the basal loss and loss due to menstruation, the requirement for an adult woman works out to 14+16 =30 μg/kg or 1.65 mg/day.
  • 46.
    PREGNANCY • Iron requirementsduring pregnancy can be calculated taking into consideration the iron needs for foetal growth, expansion of maternal tissue including the red cell mass, iron in the placental tissue and the blood loss during parturition. • These additional requirements should be added to the basal requirement. However, there is a saving of menstrual loss during pregnancy • Based on the available data for Indian and Western women, an additional 760 mg of iron is required during the entire pregnancy period (includes requirement for foetus + expansion of maternal red cell mass + placenta and cord + obligatory loss) for Indian women having a pre-pregnancy body weight of 55 kg and considering a gestational weight gain of around 10 kg and 12 kg
  • 47.
    Lactation • Iron requirementduring lactation is the sum of the requirement of the mother and that required for making up the iron lost in breast milk. Since there is amenorrhea during lactation, the basal requirement will be the same as in the adult woman, i.e, 14 μg/ kg/d or 0.77 mg/d. • According to a recent study in India, iron content of breast milk is around 14 moles/L or 0.78 mg/ L. • Assuming that the average milk volume is around 650 ml/d, the amount of iron needed works out to about 0.5 mg/d corresponding to 9 μg/kg/d. The total requirement during lactation is about 1.27 mg/d, which works out to be lesser by about 0.4 mg/d, compared to non-pregnant, non-lactating woman.
  • 48.
    Requirement during Infancy •There is not enough evidence available to establish RDA for iron for infants from birth through 6 months of age. • Recommended iron intake for this age group is based on the average iron intake of healthy infants fed breast milk. • Iron in human breast milk is well absorbed by infants. It is recommended that infants be exclusively breast fed for the first six months of life. • It is estimated that infants can use greater than 50% of the iron in breast milk and healthy full-term infants are born with a supply of iron that lasts for 4 to 6 months.
  • 49.
    • Considering thebreast milk intake to be around 600 ml during this period with an iron content of 0.78 mg/L, the iron intake per day is about 0.47 mg/d. • During this period small change occurs in storage iron and haemoglobin levels. Thus, a full term infant of 3.2 kg body weight needs only 0.23 mg/d to maintain his/her haemoglobin at the normal concentration of 110 g/L and to replace excretory loss. • Iron requirements increase markedly, especially in relation to body size and energy intake during later 6 months of life; therefore, iron-enriched solid foods should complement breast milk from 7 to 12 months of age.
  • 50.
    Iron requirement duringinfancy Age of infant Wt (kg) Basal loss (mg/d) Blood volume expansion (mg/d) Skeletal mass Total mg/d Requirem ent μg/kg/d 0-6 m 5.4 Equal to milk iron 0.23 46 6-12 m 8.4 0.12 0.4 0.21 0.73 87
  • 51.
    Iron requirement inpreschool age • During pre-school years (1-3 y), when growth rate slows down and the body mass increases by 1.9 kg/y, there is virtually no reserve store of iron between the ages 6 months and 2 years. Added to basal losses, the total requirement during this period is about 0.434 mg/d. • Body wt 12.9 kg • Basal loss 0.181 mg/d • For growth 0.270 mg/d • Total 0.451 mg/d
  • 52.
    Iron requirement inschool age • In childhood, the mean increase in body weight is 2.8 kg/y, which necessitates an iron requirement of 0.7 mg/d (Table 9.6). The average iron requirement for growth would be about 17 μg/kg/d. During childhood (4-9+y) body store of iron builds up to 5 mg/kg, which is maintained in girls until menarche
  • 53.
    Group age Requirement mg/d Adultmen 0.84 Adult women 1.65 Pregnant women 2.80 Lactating women 0-6 months 1.27 Infants 0-6m 6-12m 46µg/kg/d 87µg/kg/d Boys 10-12 1.05 13-15 1.60 16-17 1.37 Girls 10-12 1.33 13-15 1.36 16-17 1.30
  • 54.
    IRON DEFICIENCY Initial symptomsare vague and ill-defined • easy fatigability • lack of appetite • headache • dizziness • palpitations then: hypochromic-microcytic anemia • microcytosis (small RBCs) • hypochromia (poor fill of hemoglobin) • poikilocytosis (bizarre shapes) • anisocytosis (variable sizes)
  • 55.
    IRON DEFICIENCY Causes: – excessiveblood loss (parasitic, accidental, menstrual): is most common cause – rapid growth in children with limited intake of iron – malabsorption • gastric resection • sprue – increased metabolic requirement • pregnancy, lactation or neoplasia
  • 56.
    Diagnosis of irondeficiency • hematology (microcytic hypochromic cells) • low serum iron • low serum ferritin( indicates low body stores) • in some conditions (inflammation, hepatitis) ferritin may be high • low hemosiderin • high total iron binding capacity (TIBC)
  • 57.
    Treatment of irondeficiency • give 200 - 400 mg of iron per day • up to 25% of the iron preparation may be absorbed • 50 - 100 mg of iron may be utilized in case of deficiency • give on an empty stomach • enteric coated iron tablet should not be used since we want absorption to occur in the stomach and proximal duodenum
  • 58.
    Treatment of irondeficiency • parenteral iron is used in patients who have had bowel resections or in cases of inflammatory bowel disease – normally given IM (painful) Z-track minimizes tatoo • oral iron causes black stools, constipation, cramping • do not administer with antacids or metal chelators (tetracyclines)
  • 59.
    Acute iron toxicity commonin small children ingesting large doses of soluble iron compounds toxicity is usually divided into 4 phases: 1. 30 - 60 min. following ingestion • abdominal pain • nausea and vomiting • signs of acidosis and cardiovascular collapse may be seen
  • 60.
    Acute iron toxicity 2.Period of improvement - last about 8 to 16 hours 3. Period of progressive cardiovascular collapse (about 24 hrs after ingestion) • convulsions • coma • high mortality 4. Gastrointestinal obstruction from scarring of stomach and small intestine
  • 61.
    Chronic iron toxicity •causes • hereditary hemochromatosis • hemosiderosis • symptoms • cirrhosis: iron deposition in the liver • diabetes: iron deposit in the pancreas (damage to beta cells) • skin pigmentation • cardiac failure • treatment: phlebotomy ( 1 unit of blood removes about 250 mg of iron
  • 62.
    Iron toxicity • Irontoxicity may be due to hereditary hemochromatosis blood transfusion • hereditary hemochromatosis : Iron overload is linked to a distinct gene that favors excessive iron absorption if the iron is available in the diet • Frequent blood transfusions or long term ingestion of large amounts of iron can lead to abnormal accumulation of iron in the liver
  • 63.
    • Saturation oftissue apoferritin with iron is followed by the appearance of hemosiderin, which is similer to ferritin but contains more iron and is very insoluble and leads to pathological iron storage condition known as hemosiderosis. • If the hemosiderosis. Is associated with tissue demage, it is called hemochromatosis • Increased oxidation of LDL is also seen in hemosiderosis.
  • 64.
    Iodine • Consumption ofcrops/plants grown on iodine deficient soil leads to iodine deficiency in population. • Nutrient needed in a minute quantity daily. Recommended daily intake: 150 μg (Micronutrient) • Total quantity present in body is (20 - 30mg) in which mostly 75% in thyroid gland
  • 65.
    • Iodine: Essentialcomponent of thyroid hormones (T3 & T4), which are needed for: - Optimal mental & physical development - Regulation of body metabolism (Generation & utilization of body energy) • Selenium is important in iodine metabolism because of its presence in one enzyme responsible for forming active T3 from thyroglobulin stored in thyroid gland
  • 66.
    Iodine : Dailyrequirements Age/ Physiological group Upper limit (g/kg/d) RDA of iodine (µg/d) Adult 100-150 Infant Breast milk 90 Young children (1+ to 5+yrs) 50 90 School age children (6+ to 11+ y) 50 120 Adolescents and adults ( 12 y) 30 150 Pregnant & Lactating women 40 200
  • 67.
    Upper limit ofiodine • Excess of iodine ingestion can be harmful, which may inhibit the synthesis of thyroid hormones by the thyroid. This iodine-induced hypothyroidism is known as ‗Wolff-Chaikoff‖ effect, the manifestation of which depends on level of iodine intake before exposure to iodine excess. This is generally encountered among newborns as neonatal chemical hypothyroidism when women during pregnancy receive high doses of iodine, in the form of iodized oil injections
  • 68.
    Iodized salt • Theaverage daily salt intake in India is 10 g. Consumption levels are within the 5-15 g/day range for children and adults. From the average daily intake of 10 g iodine fortified salt, the estimated availability of iodine from iodized salt would be 150 g, of which about 30% is lost during cooking. The remaining 105 g is ingested and about 70% of it is absorbed by the body. This means approximately only 73.5 g is absorbed per day from iodine fortified salt. This quantity, when added to the iodine daily consumed through food, will be broadly comparable to the daily physiological need of the body
  • 69.
    Sources of iodine •Food is the main source of iodine(appox. 90%) – Meat, fish & dairy products – Vegetables, cereals • High amounts in sea fish & seaweeds • Sea salt is a poor source of iodine • Also obtained through drinking water. • Daily intake of 10 g of iodized salt having iodine at a minimum level of 15 ppm provides about 150 g per day, in addition to iodine present in foods consumed
  • 70.
    Iodine deficiency –Disease of the soil Melting of Glaciers Floods Rivers changing course Gradual leaching of iodine from soil due to:
  • 71.
    Iodine deficiency :A disease of the soil SOIL EROSION : WATER, SOIL Environmental iodine deficiency Low Availability : PLANTS Iodine poor feeds & of iodine fodders, goitrogens Effect on animals : LIVESTOCK Clinical & Reproductive disorders, Decreased productivity Effect on people : HUMANS Health & Socio - economic impact
  • 72.
    iodine deficiency disorder Iodinedeficiency leads to enlargement of thyroid gland, known as endemic goitre, as well as a wide spectrum of disorders, which are termed as iodine deficiency disorders (IDD) which include abortion, stillbirths, low birth weight, cretinism, neonatal chemical hypothyroidism, psycho-motor defects, impaired coordination, mental retardation and hypothyroidism.
  • 73.
    Goiter has beenknown since the days of Lord Buddha and before Earliest evidence of goiter: 3000 BC
  • 74.
    Importance of iodinein brain development • 50,000 brain cells produced/second in developing fetal brain • 100 billion brain cells in adult • One million billion connections between these brain cells: Determine IQ
  • 75.
    Brain cell branching •Diminished brain cell branching due to iodine deficiency • Diminished branching  Less connections  Lower IQ
  • 76.
    Importance of iodinein brain development 90 % of human brain development occurs between 3rd month of pregnancy & 3rd year of life (Critical period)
  • 77.
    CONTINUED…………… • Deficiency ofiodine during this critical period of development results in permanent brain damage • This brain damage can primarily be prevented by correcting iodine deficiency before & during pregnancy • This makes it vital that all expectant & lactating mothers get their daily requirement of iodine
  • 78.
    CONTINUED…………… • Iodine deficiencyis single most common cause of mental handicap worldwide • It is totally preventable
  • 79.
    Spectrum of IDD Goiter Lossof 13 IQ points, Leading Cause of Mental handicap Cretinism Spontaneous Abortions, Stillbirths, Birth Defects Defects of Speech & Hearing, Squint, Psychomotor defects
  • 80.
  • 81.
    Spectrum of IodineDeficiency Disorders • Foetus Abortion Still births Congenital Anomalies Increased Perinatal Mortality Increased Infant Mortality
  • 82.
  • 83.
    CONTINUED…………… • Foetus MyxedematolousCretinism – Dwarfism – Mental Deficiency Psychomotor defects
  • 84.
    CONTINUED…………… • Neonate NeonatalGoitre Neonatal Hypothyroidism
  • 85.
    Goitre Juvenile Hypothyroidism Impaired MentalFunction Retarded Physical Development Child and Adolescent
  • 86.
    CONTINUED…………… • Adult Goitrewith its complications Hypothyroidism Impaired Mental Function
  • 87.
    Effects on allage groups: Iodine deficiency & nuclear radiation • Iodine deficiency leads to increased susceptibility to nuclear radiation • When there is iodine sufficiency, the thyroid gland does not take up radioactive iodine • Therefore, in iodine deficient populations, it is critical to have effective universal salt iodization
  • 88.
    Effects on livestock •Goiter • Hypothyroidism • Reproductive disorders • Decreased productivity (Milk, meat, wool, eggs) • Lower work output Goiter in animal
  • 89.
    Iodine deficiency disorders: Apublic health problem Worldwide distribution
  • 90.
    CONTINUED…………… • High riskgroups: - Pregnant & lactating women - Pre-school children • Elimination of IDD: - is an important developmental & social goal for governments (UNGASS 2002; MDG – 2015) - is possible UNGASS: United Nations General Assembly Special Session on Children MDG: Millennium Development Goals
  • 91.
    Government’s Primary Concern Toensure that: • Every population should & • Every mother & child must Get their daily supply of iodine
  • 92.
    Iodine consumption ondaily basis for all times to come • Daily requirement of iodine per person is 150 µg – fits on the tip of hair ! • Lifetime requirement for 70 years is 5 gms – one teaspoonful ! • However, this daily requirement has to be met daily, for all times to come • “Daily consumption of adequately iodized salt is a healthy habit”
  • 93.
    Vehicle for iodine: Salt • One food item consumed every day, by everybody in fixed quantities • Rich or poor, urban or rural area, man or woman, child or adult • Average daily consumption in India per person is 10 gm • Iodization of salt is a simple process • Cost of salt iodization is : 10 paise/person/year
  • 94.
    Iodized salt –The panacea for iodine deficiency Salt production and iodization (Supply) Promotion of Iodized Salt Consumption (Demand)
  • 95.
    Classification of Goiter •As per World Health Organization Grade-0 No palpable or visible Grade-1 Mass in the neck consistent with enlarged thyroid Palpable but not visible. Moves upward in the neck as the subject swallows Grade -2 Swelling in the neck - visible Consistent with enlarged thyroid when the neck is palpated.
  • 96.
    Iodine Deficiency Disordersprevalence & criteria for A classification as a significant. Indicator Mild Mod Severe Goiter Grade >0 5.0-19.9% 20-29.9% >= 30% Median U.I.E. (microgms/ltr.) 50-99 20-49 < 20
  • 97.
    Iodine Deficiency =Goiter = Visible Swelling No Pain, Cosmetic problem Cretinism: A rare event = LOW PRIORITY Brain Damage Lack of Energy - hypothyroidism Learning Disability, ↑Deaths  Child Development & Child Survival  Human Resource Development = HIGH PRIORITY The hourglass of IDD Historic view 1962-1983 Current view
  • 98.
    Universal Salt Iodization •In India, the classical endemic belt of IDD extends from the State of Jammu and Kashmir in the North, through parts of Punjab, Haryana, Himachal Pradesh, Uttar Pradesh, Northern part of Bihar, and West Bengal to North- Eastern states. Encouraged by the results of iodized salt supplementation experiment in Kangra valley of Himachal Pradesh, Government of India (GOI), in the year 1962, launched the National Goitre Control Programme (NGCP). • In 1983, Government of India took policy decision to iodize all salt meant for human consumption – Universal Salt Iodization (USI) • Private sector was permitted and encouraged to produce iodized salt • “Elimination of goiter” was included in Prime Minister’s 20-point National Development Program • In 1988, PFA Act was amended to specify that iodized salt should have iodine in the concentration of at least 30 ppm at production level and at least 15 ppm at the consumer level.
  • 99.
  • 100.
    Changing status oflegislation Iodized Salt brought under revised PFA Act 1987 Sale & storage of non-iodized salt banned 1997 Central Government decides to lift ban on sale of non-iodized salt May 2000 Ban on sale of non-iodized salt lifted September 2000 Policy decision taken for Universal Salt Iodization 1983 Iodized salt brought under PFA Act 1968
  • 101.
    Withdrawal of theban • Government of India withdraws ban on sale of non – iodized salt for human consumption (13th September 2000) • Reason given by Government of India: “Matters of public health should be left to the informed choice, and not enforced through compulsion” Before May 2000: All States (29) & UT (6) had the ban in place except Andhra Pradesh & Maharashtra (Partial ban) Kerala (No ban)
  • 102.
  • 103.
    Key issues inIDD • National vs. Multinational • Consequences of excess iodine • Cost of iodine • Cost of iodized salt
  • 104.
    IDD control programis a national effort  Contribution Made For Assessment & Tracking Progress: - By national institutions - With national support - By national scientists - Using national laboratories & equipments Issue 1: National vs Multinational
  • 105.
    CONTINUED…………… • India isself-sufficient in production of common salt • High quality salt iodization plants - manufactured in India, - exported to other countries • Technical assistance by national agencies
  • 106.
    CONTINUED…………… • Conversion ofiodine to potassium iodate done in India • Iodine imported: - Less than 0.005% of all imports - Only 20% of total iodine imported is used for iodizing salt - Rest (80%) goes to industries (pharmaceuticals, medicare, dyes) • Reason for import: No natural source of iodine in India
  • 107.
    • Japan: -Average intake is 3,000 g/day - Seaweed soup - 20 times the required amount - No side effects reported • Pharmacological dose of iodine: - 200,000 g/day - 1300 times required amounts - can cause iodide goiter. Issue 2: Consequences of excess iodine – 1 Iodide goiter has not been reported from salt iodization programs
  • 108.
    CONTINUED…………… • Increased incidenceof IIH (Iodine Induced Hyperthyroidism) – Place: Severe iodine deficiency of long duration – Intervention: Introduction of salt with high iodine content (100 ppm) in a short period of time – Predisposing conditions: Pre-existing autonomous thyroid nodule or latent Graves Disease – People: Commonly affects older age group (>40 years) Increased incidence of IIH is transient, minimal and self limiting
  • 109.
    Issue 3: Cost ofiodine for salt iodization Total annual requirement of iodized salt in India for 1,000 million population @5kg/person/year 5 million tons Iodine required for salt iodisation@30ppm (30gm/ton) 150,000 kg (150 tons) Price of iodine @ Rs. 666/Kg, Therefore total price for 150 tons Rs. 10 million Cost of iodine/person/year 10 paise Cost of iodine for salt iodization is 10 paise/person/year (¼ cents/person/year)
  • 110.
    Issue 4: Price ofiodized salt Acts and Rules for Salt • “Salt” is declared as an item of food under Essential Commodities Act, 1955 • State governments have been authorized to administer the Act for – Fixing the prices of salt – Its movement within their States, if necessary
  • 111.
    Community perception aboutiodized salt Iodized Salt Refined Salt Packaged Salt Branded Salt High Priced Salt Iodized Salt =
  • 112.
    The reality Phoda salt0.25 – 1.00 Rs./Kg Crystal salt 1.50 – 2.00 Rs./Kg Powdered salt 2.00 – 4.00 Rs./Kg Refined salt > 4.00 Rs./Kg I O D I Z A T I O N
  • 113.
    Price of iodizedsalt through Public Distribution System (PDS) in some Indian states - 1 State / UT •PDS selling price/ kg. Chhattisgarh •Rs. 0.25 Gujarat •Rs. 0.50 Tamilnadu •Rs. 2.50 Rajasthan •Rs. 2.50 Sikkim •Rs. 2.90 (Loose iodized) Source: Annual Report (2003-2004), Salt Department, Govt. of India
  • 114.
    Price of iodizedsalt through Public Distribution System (PDS) in some Indian states - 2 State / UT PDS selling price/ kg. Arunachal Pradesh Rs. 3.15 Tripura Rs. 3.50 Orissa Rs. 2.00 – 7.00 Goa Rs. 6.00 – 7.00 Himachal Pradesh Rs. 7.50 Source: Annual Report (2003-2004), Salt Department, Govt. of India
  • 115.
    Total Monthly PerCapita Consumer Expenditure (MPCE) on salt per person * *Reference period of 30 days Source: National Sample Survey Round 55; NSS Report No. 545, Household Consumer Expenditure in India: 1999-2000 – Key Results Variable Rural Urban (In Rs.) Salt Rs. 1.09 Rs. 1.38 All Food items Rs. 289 Rs. 411 Salt as a % of All Food Items 0.37% 0.34% Total Consumer Expenditure Rs. 486 Rs. 855 Salt as a % of Total Consumer Expenditure 0.22% 0.16% Consumer expenditure on salt is negligible : <0.5%
  • 116.
    Universal salt iodization– Myths & facts -1 Issues Myth Fact Multinational Multinational companies have a stronghold on iodized salt • All the salt in India is produced, iodized, packaged and sold by national companies • All research on iodine and iodized salt is done by national scientists in national institutions Monopoly The large companies have a monopoly over the salt production Most of the salt in India is produced by the medium and small-scale producers
  • 117.
    Universal salt iodization– Myths & facts - 2 Issues Myth Fact Price Iodization has lead to an increase in the price of salt • Cost of iodine per person per year is 10 paise! • Iodization increases the price by about 50 paise! • Increased price is due to costs of packaging, branding & advertisement etc. Packaged vs non-packaged salt Iodized salt sold loose is not effective • Loose iodized salt is equally effective • Over 70 percent of total iodized salt produced is sold loose
  • 118.
    “I would behard-hearted enough to let the sick die if you can tell me how to prevent others from falling sick” - Mahatma Gandhi
  • 119.
    Why did consumptionof adequately iodized salt decrease? Government of India lifts ban on sale of Non-iodized salt : 13 Sept., 2000 As a result, sense of complacency at State level
  • 120.
    Increase in RailTariff – 1st April 2002 • Consequently, increase in movement of iodized salt by road (especially from Rajasthan) • Currently, No mechanism in place for monitoring quality of iodized salt transported by road CONTINUED……………
  • 121.
    TRANSPORT OF SALT RAIL BYROAD BY RLY. 22% 25% 53%
  • 122.
    Disappearance of mostcommon visible effect of iodine deficiency i.e. goiter Perception in people that : - iodized salt consumption is NOT required anymore CONTINUED……………
  • 123.
    CONTINUED…………… Communication strategy – DIDNOT focus on mental handicap as a consequence of iodine deficiency –WAS NOT commensurate with seriousness of problem both in terms of scale & frequency
  • 124.
  • 125.
    FREEDOM FROM PREVENTABLE BRAINDAMAGE THROUGH DAILY CONSUMPTION OF ADEQUATELY IODIZED SALT Platinum jubilee of Dandi March (12th March – 6th April 1930-2005) Towards the Elimination of Iodine Deficiency Disorders in India
  • 126.
    • Continue withPriority for Rail movement for Iodized Salt • Reduce rail tariff for iodized salt Supply (Push) – Government - 1
  • 127.
    CONTINUED…………… • Exempt Iodinefor iodized salt from import duty and sales tax “Vaccine for optimum brain development” Iodized salt exempted from VAT : Empowered Committee taken decision Final notification to be issued
  • 128.
    •Efforts to reduceprice differentials between iodized & non-iodized salt •More cost effective targeting of the PDS to address macro and micronutrient deficiencies …Iodized Salt CONTINUED……………
  • 129.
    Supply (Push) –Salt Industry • Alliance with salt producers – Good Manufacturing Practices – Low Price , High Quality – Active Assistance in obtaining International ISO 9002 accreditation • External Independent Quality Assurance Program
  • 130.
    Supply (Push) –Salt Industry Support Small scale salt producers • Need to focus on small scale salt producers (Suppliers to Low Socio-economic Status) • Potassium iodate subsidy in kind for 3 yrs - Form revolving fund for purchase of potassium iodate within this time • Initial assistance for repair and maintenance of salt iodization plants • Technical & training support for: - Improving quantity & quality of common salt - Maintenance of salt iodization plants - Establishing iodine monitoring laboratories • Ongoing external quality assurance for iodized salt
  • 131.
    Demand (Pull) • Renewedfocus on iodine & brain development : Iodine Quota & Intelligence Quotient • Education for All : Knowledge Power • India as a developed country • Regular Partnership with Media Action 1) Engage the services of a professional communication agency 2) Consortium of Private iodized salt manufacturers to participate actively in this campaign
  • 132.
    “Simple Goitre isthe easiest of all known diseases to prevent… It may be excluded from the list of human diseases as soon as the society determines to make the effort.” - Dr. David Marine, 1920 (Pioneer in mass prophylaxis of endemic goiter) Thus, The Story of iodine deficiency continues…
  • 133.
    Prevalence (%) of goiterin 6-<12 years children by type of survey 0 1 2 3 4 5 6 NNMB-MND ICMR 2001 percent percent
  • 134.
    Iodized salt productionand supply (Salt Department) (in lakh tonnes) State/UT banned Year No. of Iodisation Units Capacity Requirements Production Supplies Full - Partial 1983 13 3.86 9.16 2.13 1.41 7 4 1986 115 16.08 11.27 7.27 5.98 10 6 1989 353 48.71 27.24 22.74 21.34 17 6 1992 529 65.33 29.62 27.13 26.87 22 6 1993 519 65.67 33.31 28.23 27.23 24 5 1994 572 75.04 35.84 29.45 28.01 25 4 1995 657 82.33 42.81 36.96 34.88 27 2 1996 699 87.28 51.70 40.95 40.92 27 2 1997 784 107.50 52.00 40.41 39.07 29 2 1998 809* 115.21* 52.00 39.70 37.42 29 2 2000 926 143.48 - 46.89 - - - *As on 31st March, 1998 Source Reference 7.11.3.7
  • 135.
    Percent distribution of households,by level of iodine in salt 0 10 20 30 40 50 15PPM <15PPM Not Iodised NFHS 2005-06
  • 136.
    Percent distribution of householdheads by degree of iodization 0 50 100 150 200 RURAL URBAN LOW MEDIUM HIGH NOT IODISED 7ppm 15ppm NFSH 3
  • 137.
    Daily consumption ofadequately iodized salt is a healthy habit Towards Sustainable Elimination of IDD
  • 138.
    Zinc (Zn) • Functions –Structural, catalytic and regulatory functions in the cell, primarily as an intracellular ion – Structural role: as component of several proteins – Have association with more than 300 enzymes involving synthesis and degradation of macro nutrients – As an intracellualar signal in brain cells where it is stored in specific synaptic vesicals and is fundamental to normal CNS function – Involved in the stabilization of protein and nucleic acid structure and the integrity of subcellular organelles – Component of metalloenzymes • Includes DNA and RNA synthases – Synthesis of skin keratin and collagen – Role in transport processes, immune function and expression of genetic information – Present in nucleus – stabilize RNA and DNA structure, required for activity of RNA polymerase, important in cell division
  • 139.
    • Zn alsofunctions inchromatin particles involved in transcription and replication, and it protects against age- related macular degeneration • Prevent common cold, Zn gluconate lozenges or nasal sprays are not very effective • Zn present in bone, bone enzymesand at the zone of demaracation • Required for adequate osteoblastic activity, formation of bone enzymes such as alkaline phosphotase, and calcification • Beta alanyihistidine (carnosine) is a Zn compound that stimulated bone formation intensively and restores bone loss from aging, skeletal unloading, aluminium bone toxacity, Ca and vitamin D deficiency, adjuvant arthritis, estrogen deficiency, diabetes and fracture healing
  • 140.
    Metallothionine • Metallothionine isthe most abundant, non enzymatic zinc containing protein • It have role in Zn absorption • It may act as an intracellular reservoir that can donate Zn ions to other proteons, or it may have a redox role that reduce oxidative stress, especially in cells with high stress • It may have role in detoxification of minerals as well as in their absorption
  • 141.
    • The intestinalabsorption found in one of the above studies with a typical cereal and lentil- based diet is 36%, while in the second study using typical diets consumed in the four regions of the country, absorption was found to vary between 10-25%, with a mean value around 20%. • diets with higher Zn (>12 mg/d) had lower absorption (<16%) and those with lower Zn had better absorption (increasing from 14% to 38% with decreasing intakes from 12 to 6 mg/d) • It is estimated that the endogenous loss is about 1.67 mg, integumental loss of 0.43 mg and urinary excretion of 0.56 mg, accounting for 2.7 mg of absorbed Zn as the requirement for 51 kg average male.
  • 142.
    RDA • Adult men12mg/day • NPNL Women 10mg/day • Pregnant 12mg/day • Lactating 12mg/day • Children (1-9yrs) 5, 7, 8 mg/day • Children (10-12yrs) 9mg/day • Children (13-15yrs) 11mg/day • Children (16-17yrs) 12 mg/day
  • 143.
    Zinc (Zn): DietarySources & Bioavailability • Bioavailability influenced by: – Phytates – Iron – Calcium – Animal sources – Acidic substances
  • 144.
    • In general,the dietary intake appears to range from 7-12 mg/d , which is low as compared to the intakes reported from the Western countries. • It is well known that intestinal absorption of zinc is markedly inhibited by the phytate and tannin content of diet. • Habitual Indian vegetarian (mixed cereal/ pulse) diets are rich in phytate and thus the bio-availability of Zn is expected to be poor • In general, the higher Zn-Phytate molar ratio of >15 occurring in Indian diets is supposed to cause low bio- availability (less than 15% absorption) as against 20-25% seen with low phytate/ animal food rich diets. • Thus more than the total content of zinc, bio-available zinc is important to maintain adequate Zn status.
  • 145.
    Zinc Deficiency &Toxicity • Deficiency – Decreases appetite – Increases morbidity – Decreases growth – Skin irritations, diarrhea, delayed sexual maturation • Toxicity – Supplements – Poor immune function – Depressed levels of HDL – Impaired copper status – Nausea, vomiting, loss of appetite
  • 146.
    Zinc deficiency • Clinicalsign – Impaired reproduction, delayed puberty, hypoganadism – Growth retardation, short stature – Low insulin and high ammonia in blood – Low white blood cell count; susceptibility to infections – Anorexia – Night blindness – Mild anaemia Additional symptoms Hypogusia (decreased taste acuity) Delayed wound healing Alopecia Lesions of skin, disorders of hair, feathers, etc. • Parakeratosis
  • 147.
    • Immunologic defects thymicatrophy Lymphopenia Reduced lymphocyte proliferative response to mitogens A selective decrease in T helper cells Decreased NK cellsactivity Allergy Deficient thymic hormone activity Impaired IL2 production anergy
  • 148.
    Acrodermatitis enteropathica • Anautosomal recessive disease, characterized by Zn malabsorption, result in eczematoid skin lesions, alopecia, diarrohoea, bacterial and yeast infections and even death if left untreated • Symptoms develop during weaning • hZIP4 gene is involved in this disease
  • 149.
    Zinc (Zn) Toxicity •Toxicity (100-300mg/day), UL= 40mg/day – Relatively non-toxic in excess – Anemia – Fever and CNS disturbances – GI irritation – Higher LDL and lower HDL levels – High white blood cell count – Renal failure
  • 150.
    Chromium • Involved incarbohydrate, lipid, and protein metabolism – Regulation of gene expression – Component of “glucose tolerance factor” when chelated with niacin and several amino acids • Increased insulin binding to receptor • Increased numbers of insulin receptors • Alleviates gestational diabetes in some cases • Established as an essential mineral in swine • However, requirement is not known – In the ppb range • Hard to show a deficiency • Absorption: carried by transferrin, absorption is 2% or less
  • 151.
    Manganese (Mn): DietarySources & Regulation • Whole grains, pineapples, nuts, legumes, dark green leafy vegetables, water • <10% absorbed • Excess incorporated into bile & excreted in feces
  • 152.
    Functions of Manganese •Cofactor for metalloenzymes – Gluconeogenesis – Bone formation • Energy metabolism • Cofactor for superoxide dismutase
  • 153.
    Manganese (Mn) • 10-20mgin adult human body • Functions – Cofactor for enzyme systems Glutamine synthase Pyruvate carboxylase mitochondrial SOD – Synthesis of chondroitin sulfate in bone matrix • Deficiency – Defective bone formation – Affect reproductive capacity, pancreatic function, and aspects of CHO metabolism – Perosis – slipped tendon • Poultry • Diet is adequate for most species
  • 154.
    Mn toxicity • Theexcess, which accumulated in the liver and CNS produces Parkinson like syndrome • Neurotoxicity • Impaired energy metabolism • Cause cell death • Symptoms: Headache, dizziness, hepatic dysfunction
  • 155.
    Cobalt • In 1930s,a wasting disease was first associated with cobalt deficiency in plants and soils • Vitamin B12 was found to contain cobalt
  • 156.
    Cobalt and VitaminB12 • Injection of cobalt-deficient sheep and cattle with vitamin B12 was as effective as feeding cobalt in curing the disease • Injection of cobalt has no effect • Microbial synthesis of vitamin B12 was the key!
  • 157.
    Cobalt (Co) –Trace Mineral • Blood level: 1mcg of Co per 100 ml • Functions – Required only as a component of vitamin B12 • Ruminant animals require for microbes – Vitamin B12 is an essential cofactor for enzymes involved in: • Propionate metabolism – methylmalonyl CoA to succinyl CoA DNA synthesis Bacterial synthesis of methionine • Deficiency – Mimics B12 deficiency in ruminants (microcytic anaemia) • Anemia • Emaciation • Toxicity : polycythemia, hyperplasia of reticulocytes and increased blood volume
  • 158.
    Chromium (Cr): DietarySources, Bioavailability, & Regulation • Food content depends on soil • Whole grains, fruits/veg, processed meats, beer, wine • Bioavailability affected by: – Vitamin C – Acidic medications – Antacids • Transported in blood to liver • Excess excreted in urine & feces
  • 159.
    • Deficiency: • Insulinresistance • Lipid abnormalities • Toxicity • Skin lesions • Increased risk of cancer • Cr picolinate improves strength, body composition, endurance or other characteristics or physical fitness are controversial
  • 160.
    Selenium • Component ofglutathione peroxidase (GSH-Px) – Free radical scavenger that catalyzes removal of hydrogen peroxide from cell membranes – 40mcg Se is required to main GSH –Px activity – Interrelated with vitamin E • Can partially spare vitamin E (makes up for slight deficiencies) • Improves killing ability of neutrophils – Reduces the prevalence and severity of mastitis • Conversion of T4 (thyroxine) to T3 (4x more active) - Type-I iodothyronine 5’-deiodinase an enzyme capable of converting T4 to T3 is as a selanoprotein GSH = reduced glutathione GSSG = oxidized glutathione GSH + H2O2 GSSG + H2O
  • 161.
    • Selanoprotein Pmay act as a free radical scavenger or a transporter of Se • As Selonomethionine and selanocysteine, exists in several protein s that are widely distributed in the body • Phospholipid hydroperoxide GSH-Px is found in lipid soluble fractions of the cell and has roles in lipid and eicosonoid metabolism
  • 162.
    • Absorption: uppersegment of the small intestine • Selenium status is assessed by measuring Se or GSH-Px in serum, platelets and erythrocytes or in white blood • Erythrocyte Se measurement is an indicator of long term intake • Se is transported bound to albumin initially and subsequently to α2 -globulin
  • 163.
    Selenium - Deficiencies •Keshan disease is a cardiomyppathy of humans, characterized by heart enlargement replacing the muscle tissue with fibrous tissues mainly affect children and women • Kashan back disease : common in preadolescent and adolescent children • Involves symmetric stiffness, swelling and often pain in interphalangeal joints of the fingers followed by generalized osteoarthritis • White muscle disease in lambs and calves – Skeletal and cardiac myopathies • Exudative diathesis (hemorrhagic disease) in chicks • Liver necrosis • Concentration in feeds is soil dependent – Toxicity/deficiency related to geographic area
  • 164.
    White Muscle Disease •Results from a deficiency of selenium or vitamin E • Characterized by white streaks in striated muscle • Prevented by injection of vitamin E and selenium
  • 165.
    Selenium • Selenosis includeskin and nail changes, tooth decay and nonspecific GI and neurologic abnormalities • Toxicity causes blind staggers or alkali disease • Range between minimum requirement and maximum tolerable level is narrow – Supplementation must be done with care • FDA regulations allow only two forms of inorganic selenium (sodium selenite and sodium selenate) to be used – 0.3 mg of supplemental selenium/kg of dietary DM is maximum
  • 166.
    Molybdenum (Mo) • Absorbedin intestine • Circulated to liver via blood • Sources – Legumes, cereals, organ meats
  • 167.
    Functions of Molybdenum •Redox reactions • Cofactor for several enzymes • Metabolism of: – Sulfur-containing amino acids – DNA & RNA • Detoxifying drugs in liver
  • 168.
    Molybdenum Deficiency &Toxicity • Deficiency – Rare • Toxicity – No known effects in humans – Animals – disrupts reproduction
  • 169.
    Tin • produces acceleratedgrowth in deficient rats • tin is similar to carbon in its tendency to form covalent bonds • may have a role with heme-containing enzymes:heme oxygenase and cytochrome P-450 • largest quantities are found in kidneys and skin • human intake: ~ 1.5 - 3.5mg/day
  • 170.
    Vanadium • essentiality establishedin rats and chicks • human daily intake has been estimated at 2 mg • plays a role in lipid metabolism (deficient chicks have a high plasma cholesterol and triglyceride levels) • may also function as an oxidation- reduction catalyst
  • 171.
    Chlorine • Functions – Acid-baseand osmotic regulation – HCl and chloride salts in gastric secretions • Deficiencies – Metabolic alkalosis • Increased bicarbonate compensates for decreased Cl – Growth retardation
  • 172.
    Copper (Cu): DietarySources & Bioavailability • Forms – Cupric – Cuprous • Organ meats, shellfish, whole-grain products, mushrooms, nuts, legumes • Bioavailability decreases with – Antacids – Iron
  • 173.
    Absorption, Metabolism, &Regulation of Copper • Absorbed in small intestine & stomach • Influenced by Cu status • Ceruloplasmin • Excess incorporated into bile & eliminated in feces
  • 174.
    Functions of Copper •Cofactor for metalloenzymes in redox reactions: – ATP production • Cytochrome c oxidase – Iron metabolism – Neural function – Antioxidant function • Superoxide dismutase – Connective tissue synthesis
  • 175.
    Copper Deficiency &Toxicity • Deficiency – Hospitalized patients & preterm infants – Antacids • Signs & Symptoms – Defective connective tissue, anemia, neural problems • Toxicity – Rare
  • 176.
    Copper Deficiency • Anemia •Depigmentation of hair or wool – Black sheep are sometimes kept as indicators of marginal Cu deficiency • Loss of wool crimp (“steely” wool) • Bone disorders • Central nervous lesions with muscular incoordination
  • 177.
    Induced Copper Deficiency •Caused by relatively high levels of Mo and/or S • Site of interaction is in the rumen – Formation of insoluble Cu salts including sulfides and thiomolybdates • Net effect is decreased Cu absorption
  • 178.
    Induced Copper Toxicity •Occurs with “normal” dietary levels of Cu and “low” levels of Mo and S • Accumulates in liver • Sheep are more susceptible than cattle or pigs
  • 179.
    Fluoride (F-): DietarySources, Bioavailability, & Regulation • Not an essential nutrient • Potatoes, tea, legumes, fish w/bones, toothpaste, added to drinking water • American Dental Association – Fluoridation 1-2 ppm • Absorbed via small intestine • Circulates in blood to liver & then teeth & bone • Excess excreted in urine
  • 180.
    Functions of Fluoride •Part of bone & teeth matrix • Stimulates maturation of osteoblasts • Topical application decreases bacteria in mouth – Fewer cavities
  • 181.
    Fluoride Deficiency &Toxicity • Deficiency – None known • Toxicity – GI upset, excessive production of saliva, watery eyes, heart problems, coma – Dental fluorosis – Skeletal fluorosis