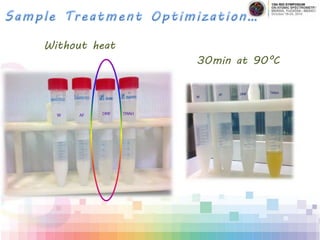
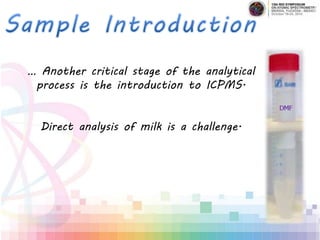
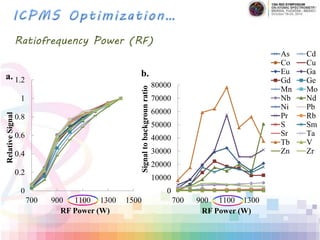
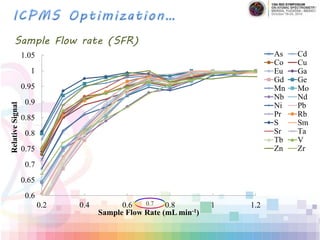
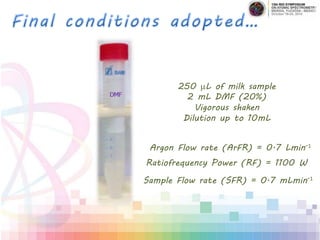
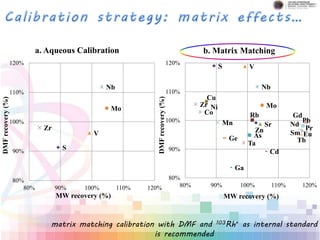
This document presents the results of a study analyzing the elemental composition of various milk samples using inductively coupled plasma mass spectrometry (ICP-MS). Milk samples from different brands and targeted at different age groups were solubilized using N,N-dimethylformamide (DMF) and analyzed for various elements. Optimal instrument parameters like argon flow rate, radio frequency power, and sample flow rate were determined. Concentrations of elements like As, Co, Cu, Mn, Mo, Ni, Rb, S, Sr, V, Zn were measured and compared across milk samples. Reference materials were also analyzed to validate the method, which demonstrated accurate recovery of elements within certified ranges.
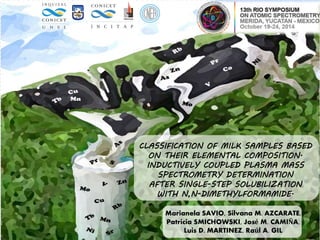
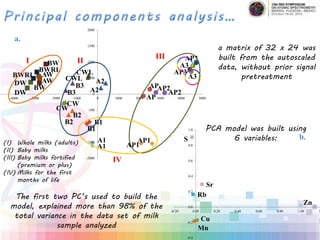
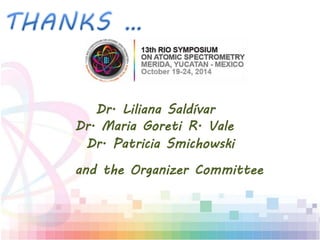
![Analyte A1 A2 A3 AP1 AP2 AP3 AP AW
[mg L-1] Baby 1 Baby 2 Baby 3 Baby
Premium 1
Baby
Premium 2
Baby
Premium 3
Baby
Plus 3
Whole milk
0-6 months 6-12 months 1-3 years 0-6 months 6-12 months 1-3 years 1-3 years adults
As <LD <LD 2.58±0.51 <LD 1.44±0.14 1.44±0.03 <LD 2.80±0.03
Co 2.16 ±0.17 2.74±0.31 3.88±0.57 3.94±0.93 2.92±0.01 3.76±0.34 5.58±0.54 6.90±0.36
Cu 367.1±7.6 517.7±2.5 27.1±0.7 400.8±1.3 515.5±19.4 26.58±0.48 21.22±0.31 31.64±0.39
Eu <LD <LD <LD 1.34±0.19 <LD <LD <LD <LD
Gd 0.74±0.17 <LD <LD 0.96±0.25 <LD <LD 1.18±0.01 0.9±0.1
Mn 194.2±1.47 59.8±1.5 37.1±0.2 219.3±7.8 55.0±2.4 39.12±0.28 38.94±4.21 27.86±1.89
Mo 21.14±1.13 17.8±3.6 31.5±0.1 12.38±0.79 11.6±0.02 16.38±0.84 12.18±0.51 27.6±0.31
Nb 1.74±0.42 <LD <LD <LD <LD <LD 3.40±0.39 <LD
Nd <LD <LD 1.28±0.1 2.12±0.08 <LD <LD 1.12±0.08 <LD
Ni 26.12±0.96 54.6±1.8 61.9±1.9 66.26±11.62 55.9±0.9 70.8±1.1 129.8±4.1 157.7±0.25
Pb 7.36±1.05 <LD <LD <LD 0.98±0.17 <LD <LD <LD
Rb 176.82±7.38 449.2±23.4 478.9±4.3 124.0±2.8 387.7±5.6 478.6±16.3 319.5±3.4 555.0±13.04
Sm <LD <LD <LD 1.36±0.06 <LD <LD 1.18±0.02 1.24±0.11
S 1099±51 2852±97 3159±123 1112±15 2605±5 3246±134 2498±158 3194±47
Sr 403.4±24.5 1077±42 1316±51 377.7±3.2 939±19 1343±49 1047±1 720.4±6.0
Tb <LD <LD <LD 0.84±0.14 <LD <LD 0.88±0.03 <LD
V 4.96±0.65 6.26±0.85 7.48±0.31 18.04±1.89 5.84±0.08 6.36±0.36 6.86±0.57 17.08±0.37
Zn 5295±6 5838±162 10101±61 7888±375 8569±300 10148±217 7907±227 2815±30
In all cases the concentrations of Cd, Ga, Ge, Pr, Ta and Zr were lower than their respective detection limits.](https://image.slidesharecdn.com/milksamplesclassificationicpms-marianelasavio-151006215058-lva1-app6891/85/Clasificacion-de-leches-a-traves-del-analisis-elemental-por-ICPMS-17-320.jpg)
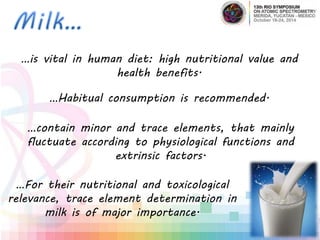
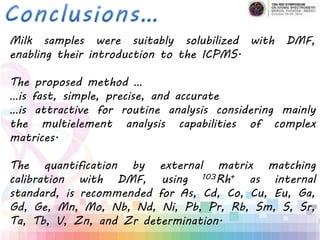
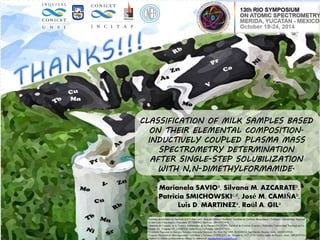
![Analyte B1 B2 B3 BW BWRL CW CWL DW
[mg L-1]
Baby 1 Baby 2 Baby 3 Whole milk Whole milk
Lactose
Reduced
Powder
milk
Light powder milk Whole milk
0-6 months 6-12 months 1-3 years adults adults kids kids adults
As 2.86±0.45 1.82±0.22 <LD <LD 3.22±0.19 3.83±0.09 2.92±0.44 <LD
Co 5.72±0.45 7.96±0.91 7.92±0.06 7.1±0.03 5.53±0.34 4.3±0.09 5.92±0.24 5.86±0.19
Cu 391.3±10.6 573.8±20.9 219.2±4.5 31.88±3.17 25.5±0.44 18.2±0.3 29.33±0.37 25.16±0.22
Eu <LD 0.88±0.17 <LD <LD <LD <LD <LD <LD
Gd <LD <LD <LD <LD <LD <LD <LD <LD
Mn 967.4±17.5 708.1±41.4 469.0±20.5 28.8±7.4 17.07±0.49 17.3±0.1 38.23±1.62 23.26±2.91
Mo 7.60±1.50 11.48±1.44 20.16±6.64 24.0±6.9 33.50±0.08 32.16±0.12 27.6±0.8 18.1±0.9
Nb <LD <LD <LD <LD <LD <LD <LD <LD
Nd <LD <LD 1.28±0.37 <LD <LD <LD <LD <LD
Ni 54.74±5.34 123.1±7.38 153.1±11.7 162.5±28.7 121.9±6.8 101.1±2.2 131.6±5.6 141.5±7.5
Pb <LD <LD <LD <LD <LD <LD <LD <LD
Rb 387.3±13.5 354.2±22.3 602.9±22.7 691.8±72.1 697.8±14.4 433.7±0.6 497.5±10.5 437.8±8.0
Sm <LD <LD <LD <LD <LD <LD <LD <LD
S 1967±40 2260.2±90.6 2973±161 3288±413 3230±139 2374±22 3181±42 2881±132
Sr 415.6±15.0 588.2±30.5 647.9±35.6 757.2±86.8 761.5±30.1 562.4±9.7 749.3±14.8 958.7±23.8
Tb <LD <LD <LD <LD <LD <LD <LD <LD
V 9.0±0.6 12.1±1.9 11.16±0.71 13.44±3.31 11.30±0.31 11.12±0.67 8.80±0.22 10.1±0.5
Zn 5129±95 4282±132 4251±232 2981±229 2621±119 3994±68 5158±23 2293±117.7
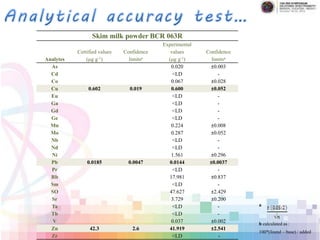
In the case of As, Cd and Pb, they complied with the maximum limits established by the Codex Alimentarius Commission,
being <0.05; <0.05; < 0.02 mg Kg-1 respectively.](https://image.slidesharecdn.com/milksamplesclassificationicpms-marianelasavio-151006215058-lva1-app6891/85/Clasificacion-de-leches-a-traves-del-analisis-elemental-por-ICPMS-18-320.jpg)


![谷歌留痕技术 [ 𝙩𝙤𝙥 𝟮𝟯𝟯. 𝙘 𝙤𝙢 ]](https://cdn.slidesharecdn.com/ss_thumbnails/top233-260130174328-3833018c-thumbnail.jpg?width=640&height=640&fit=bounds)
