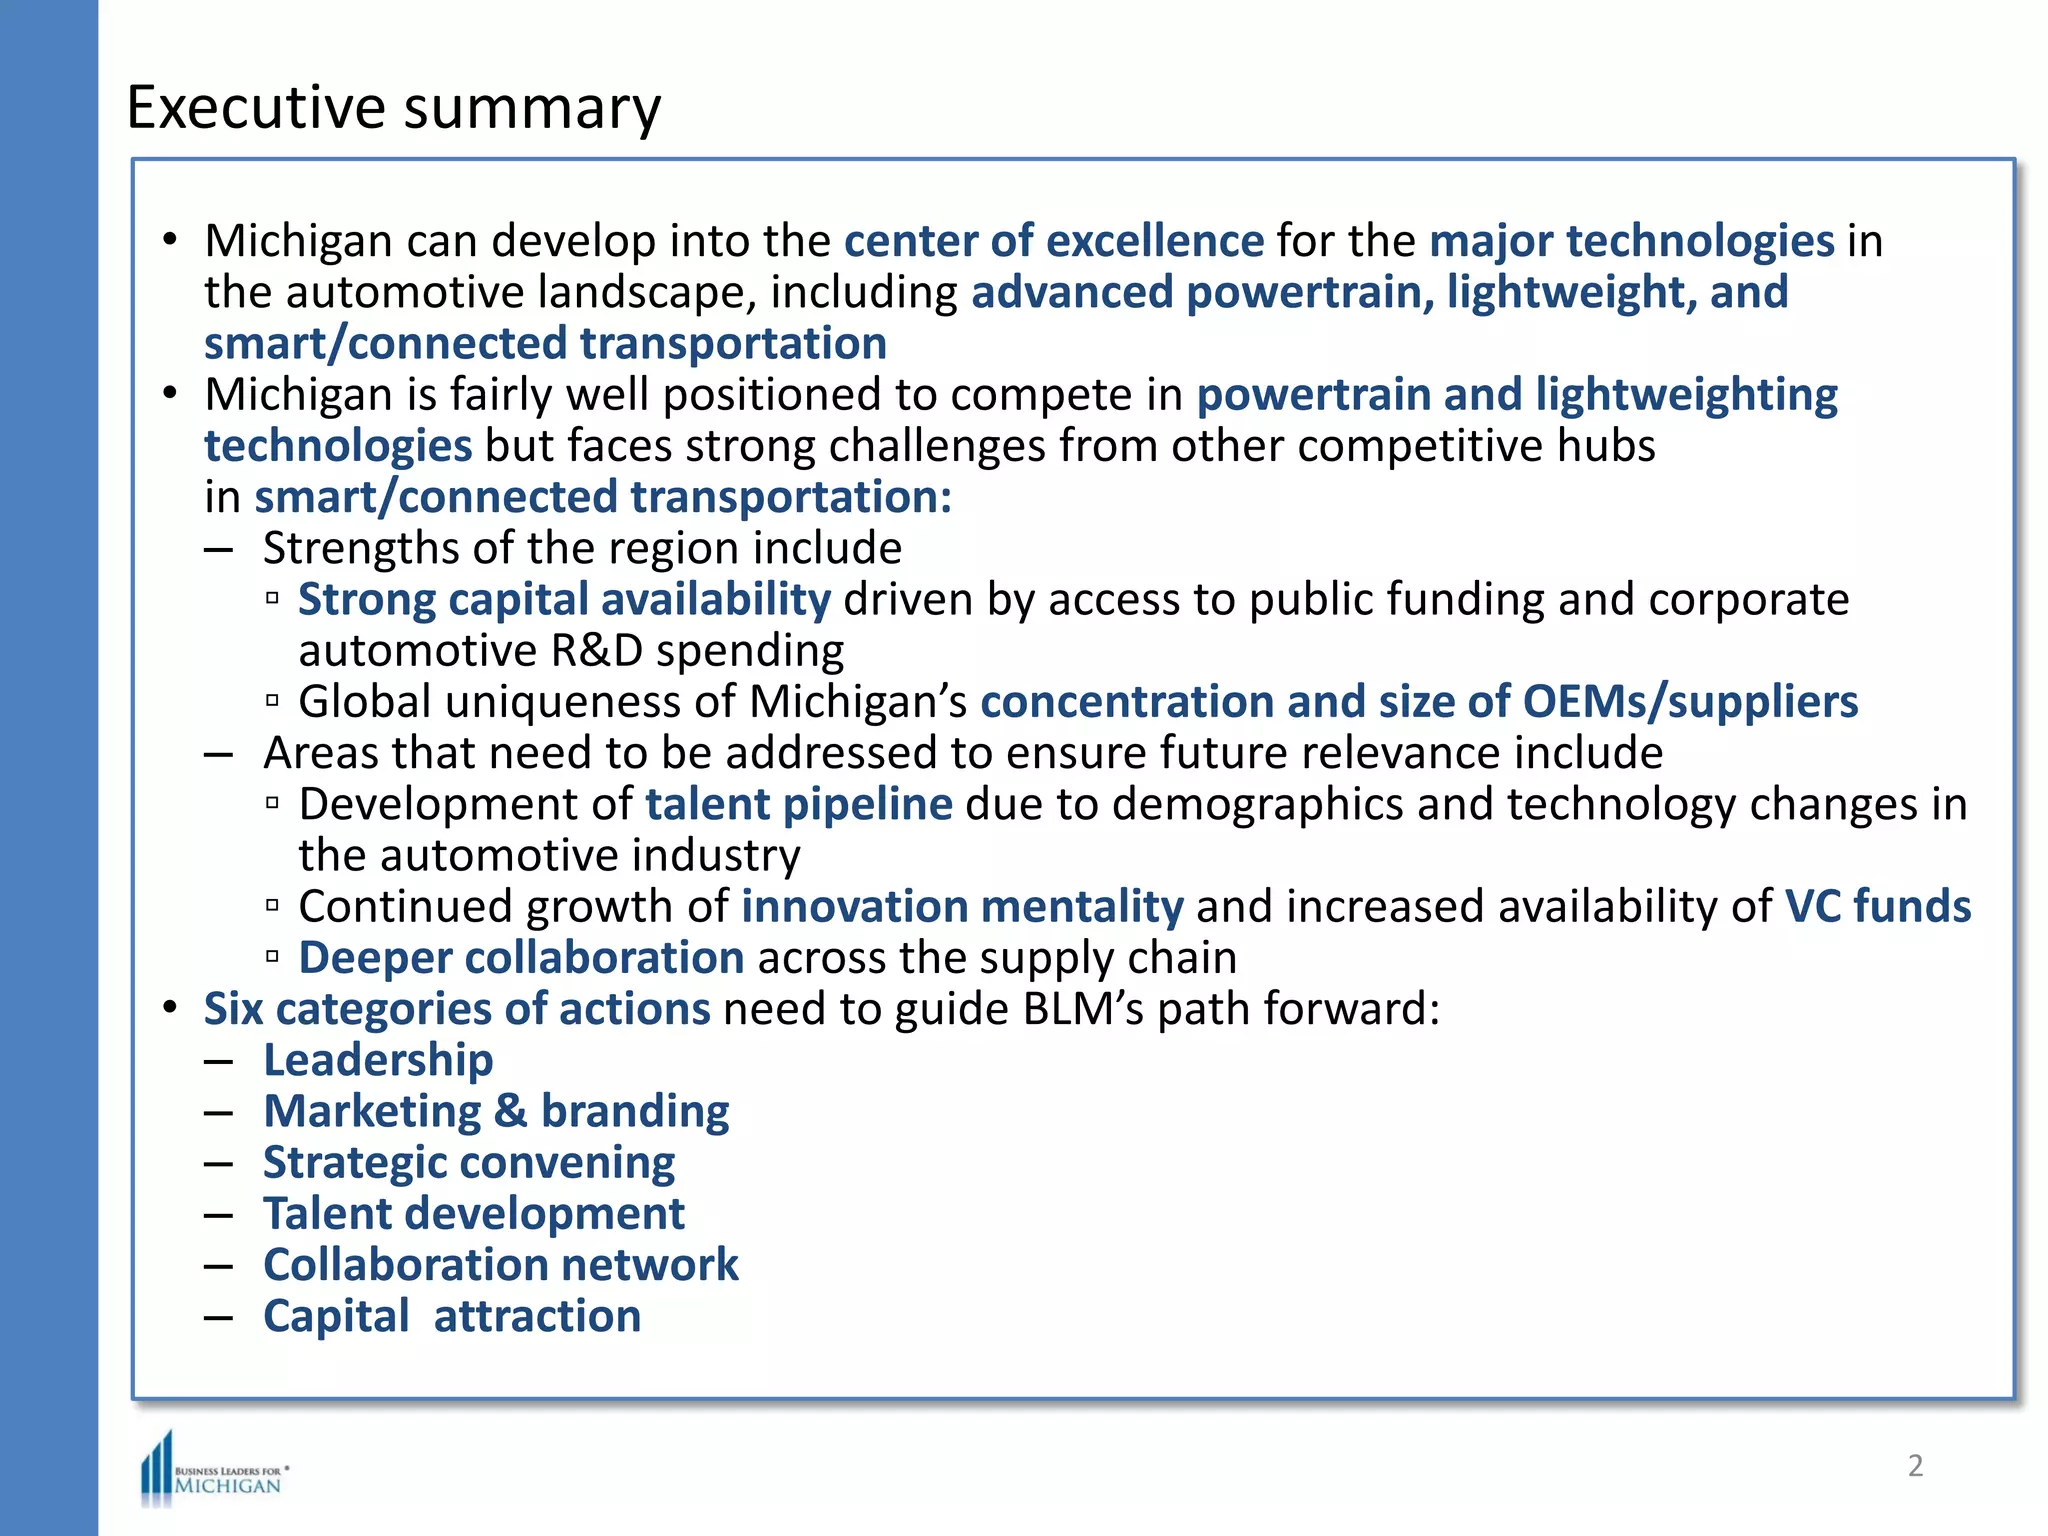
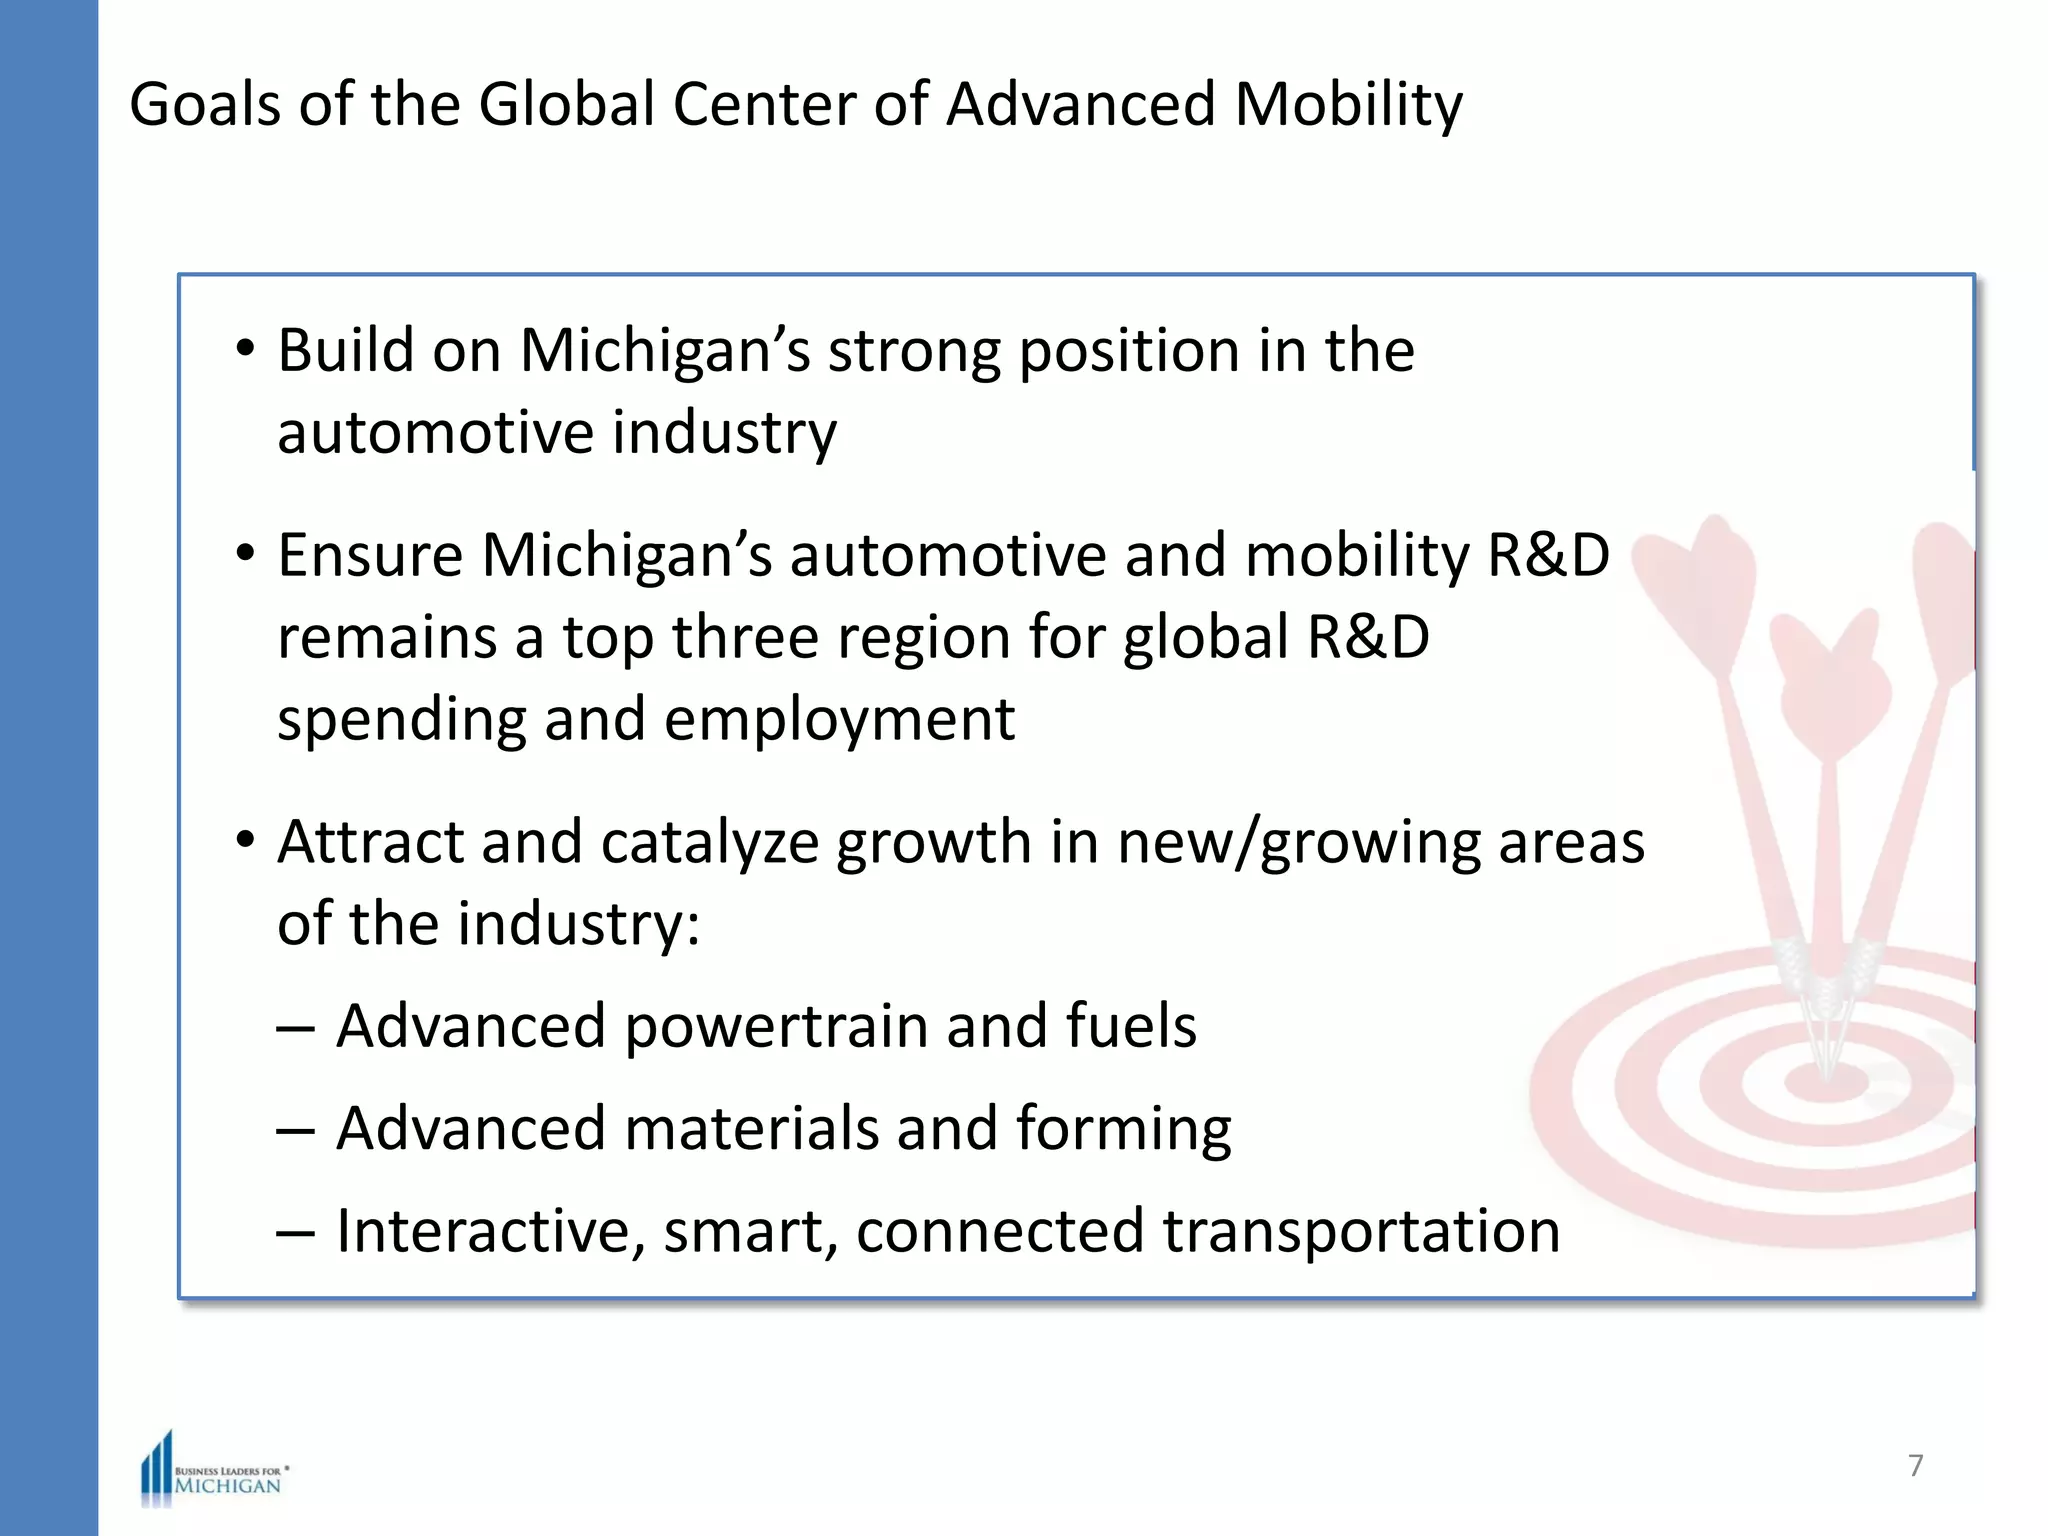
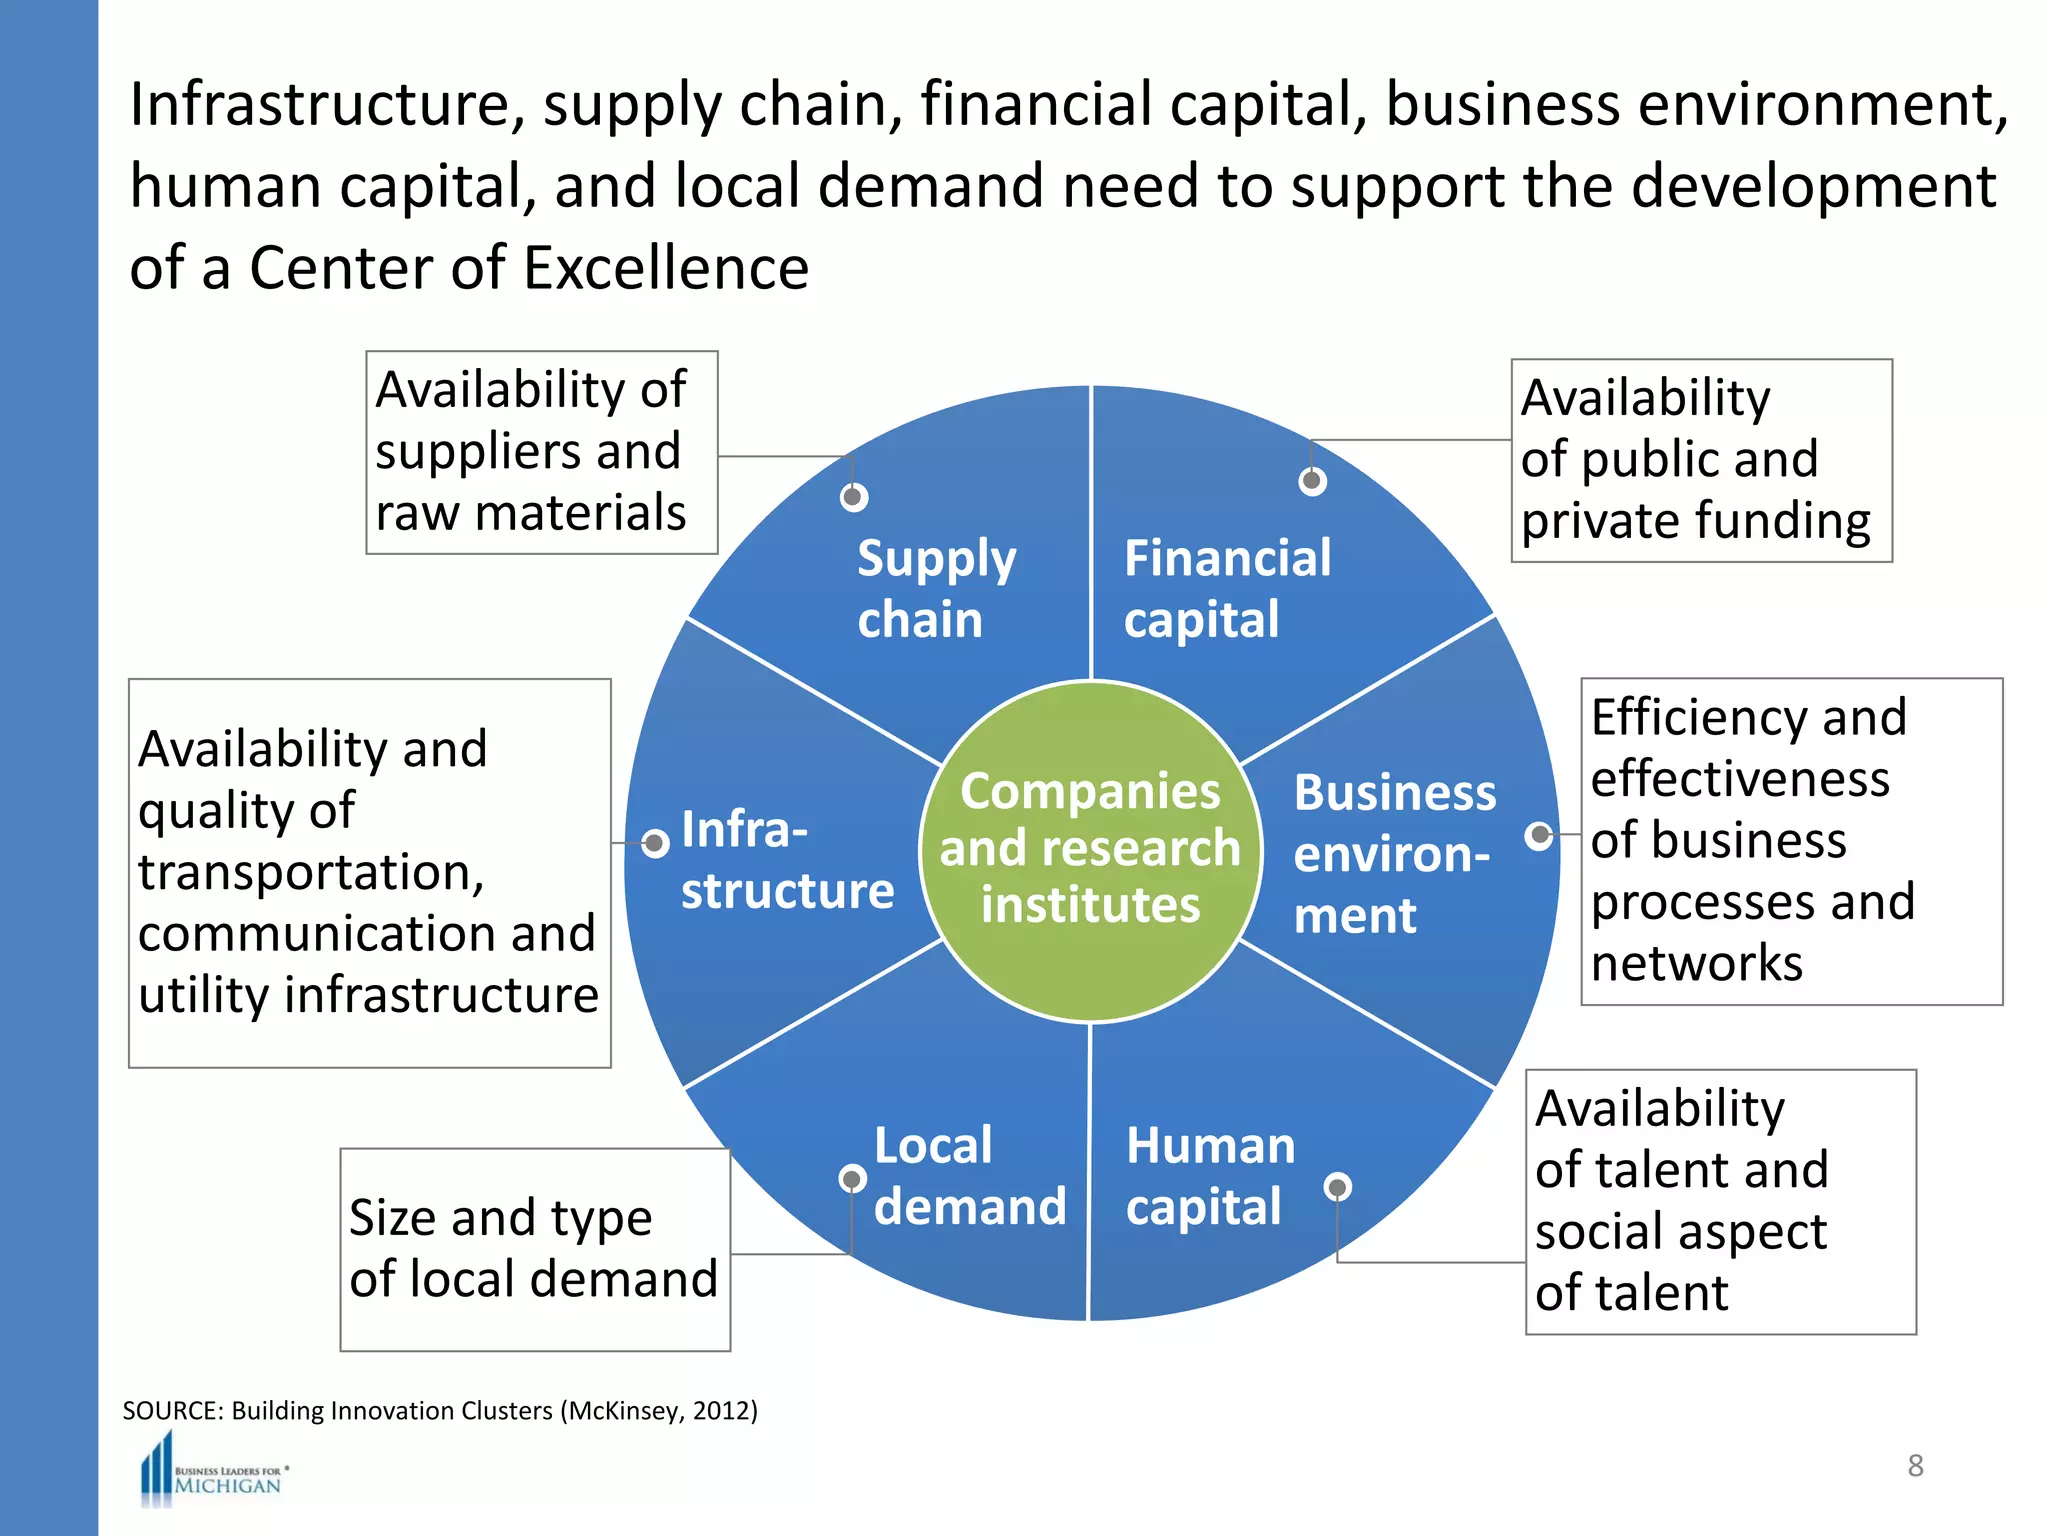
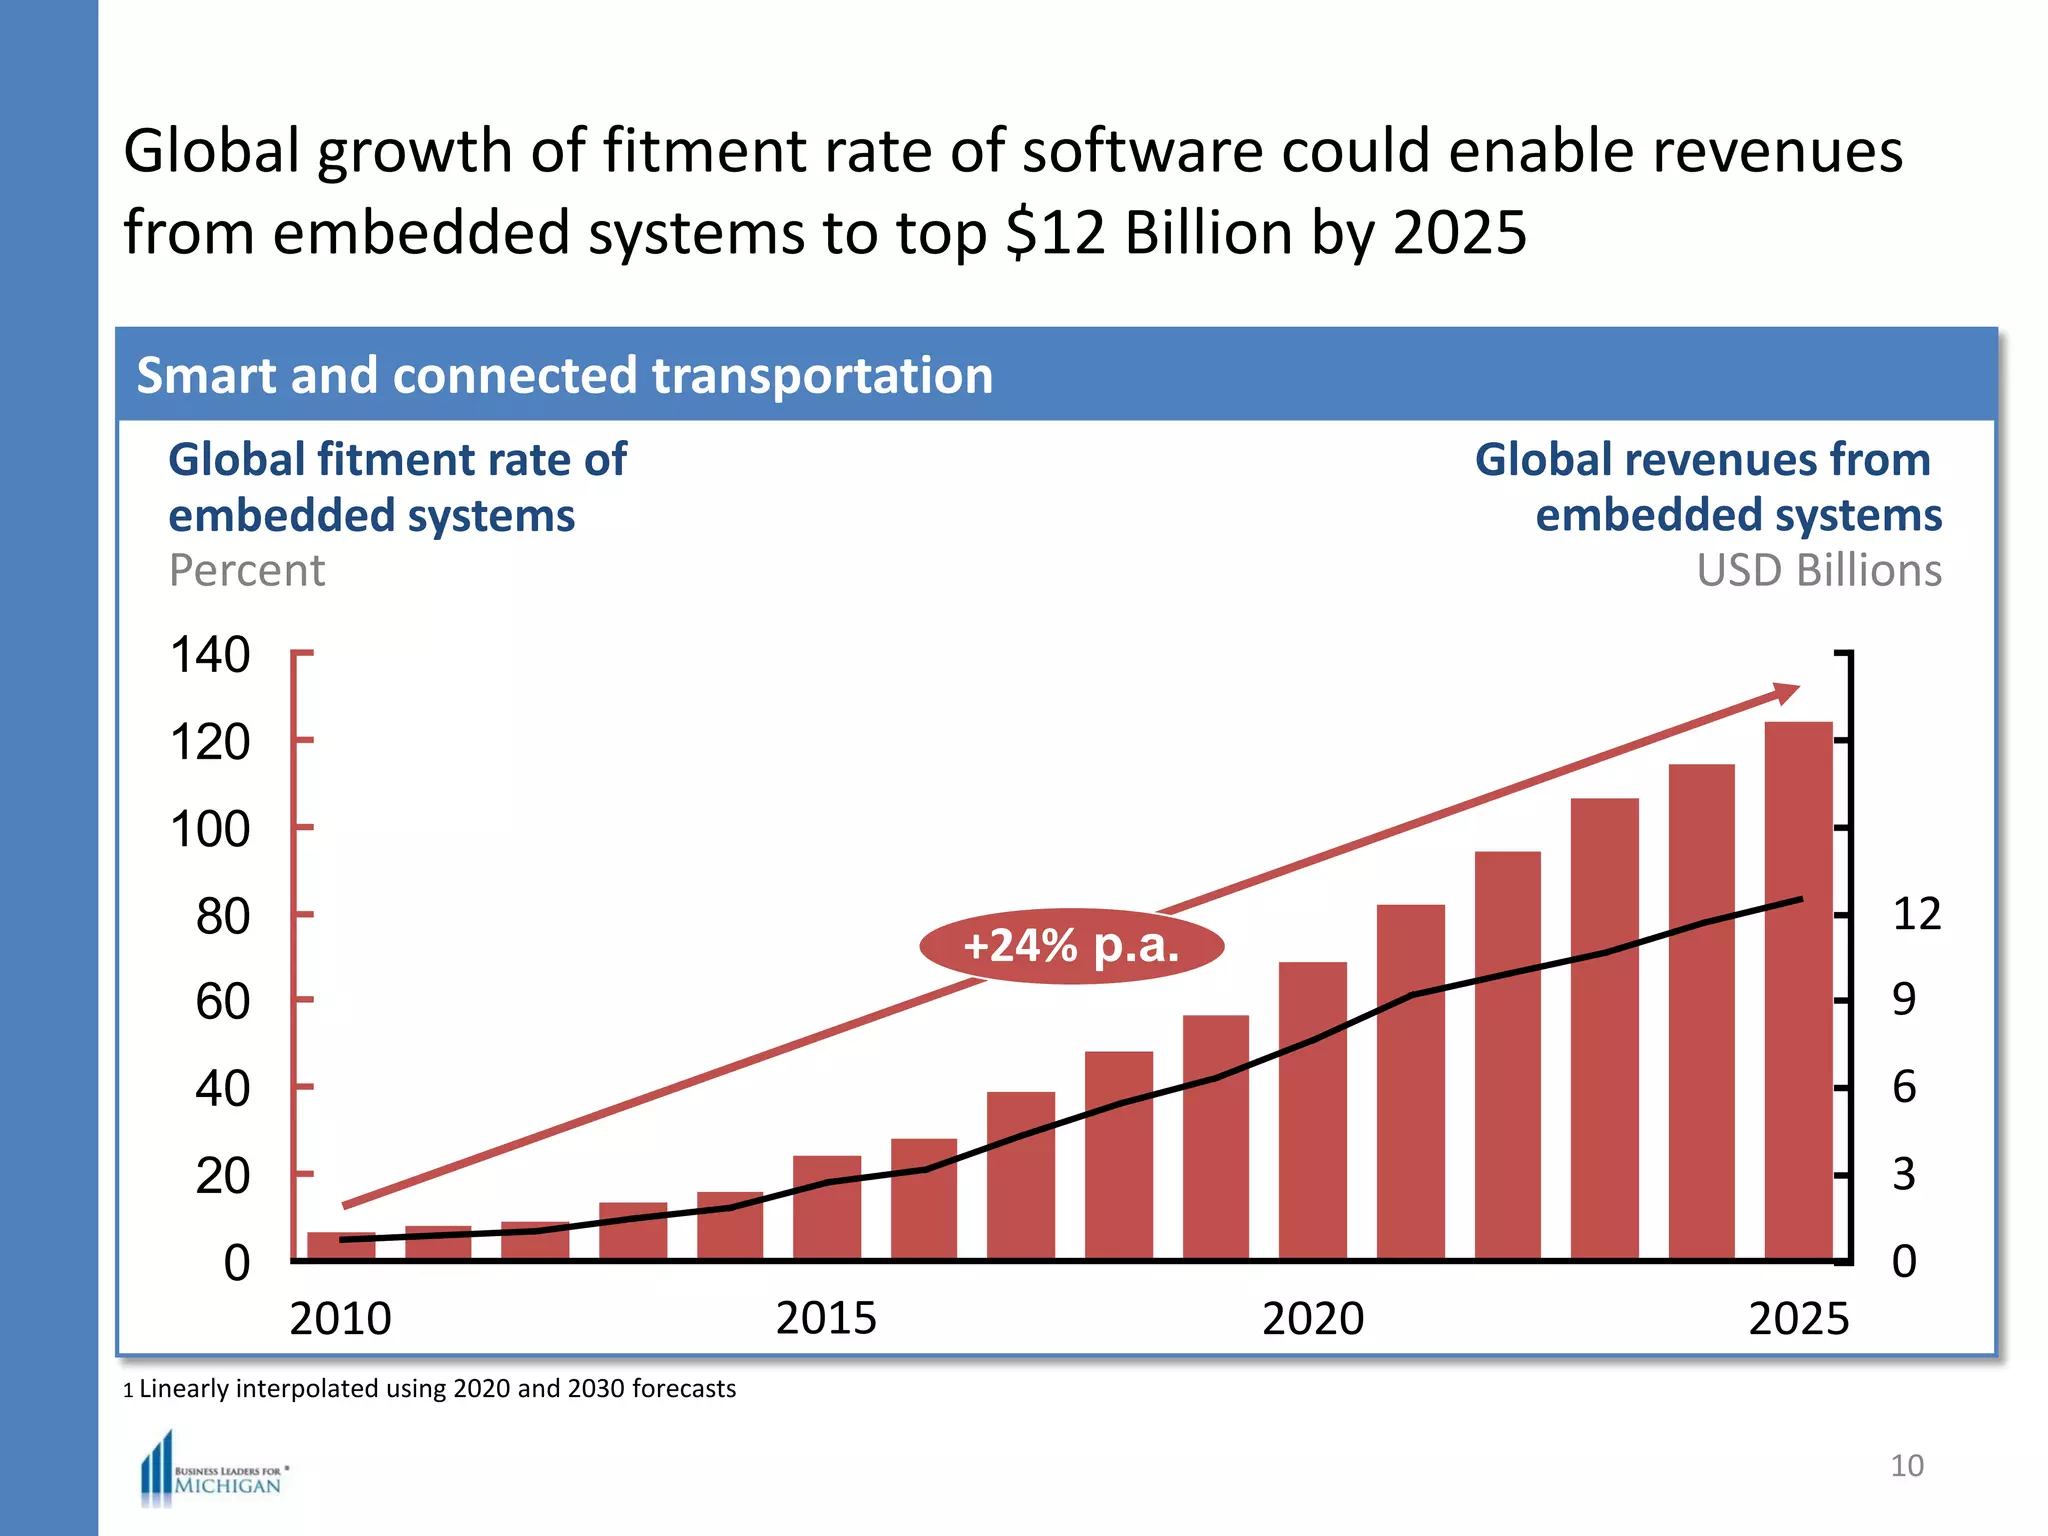
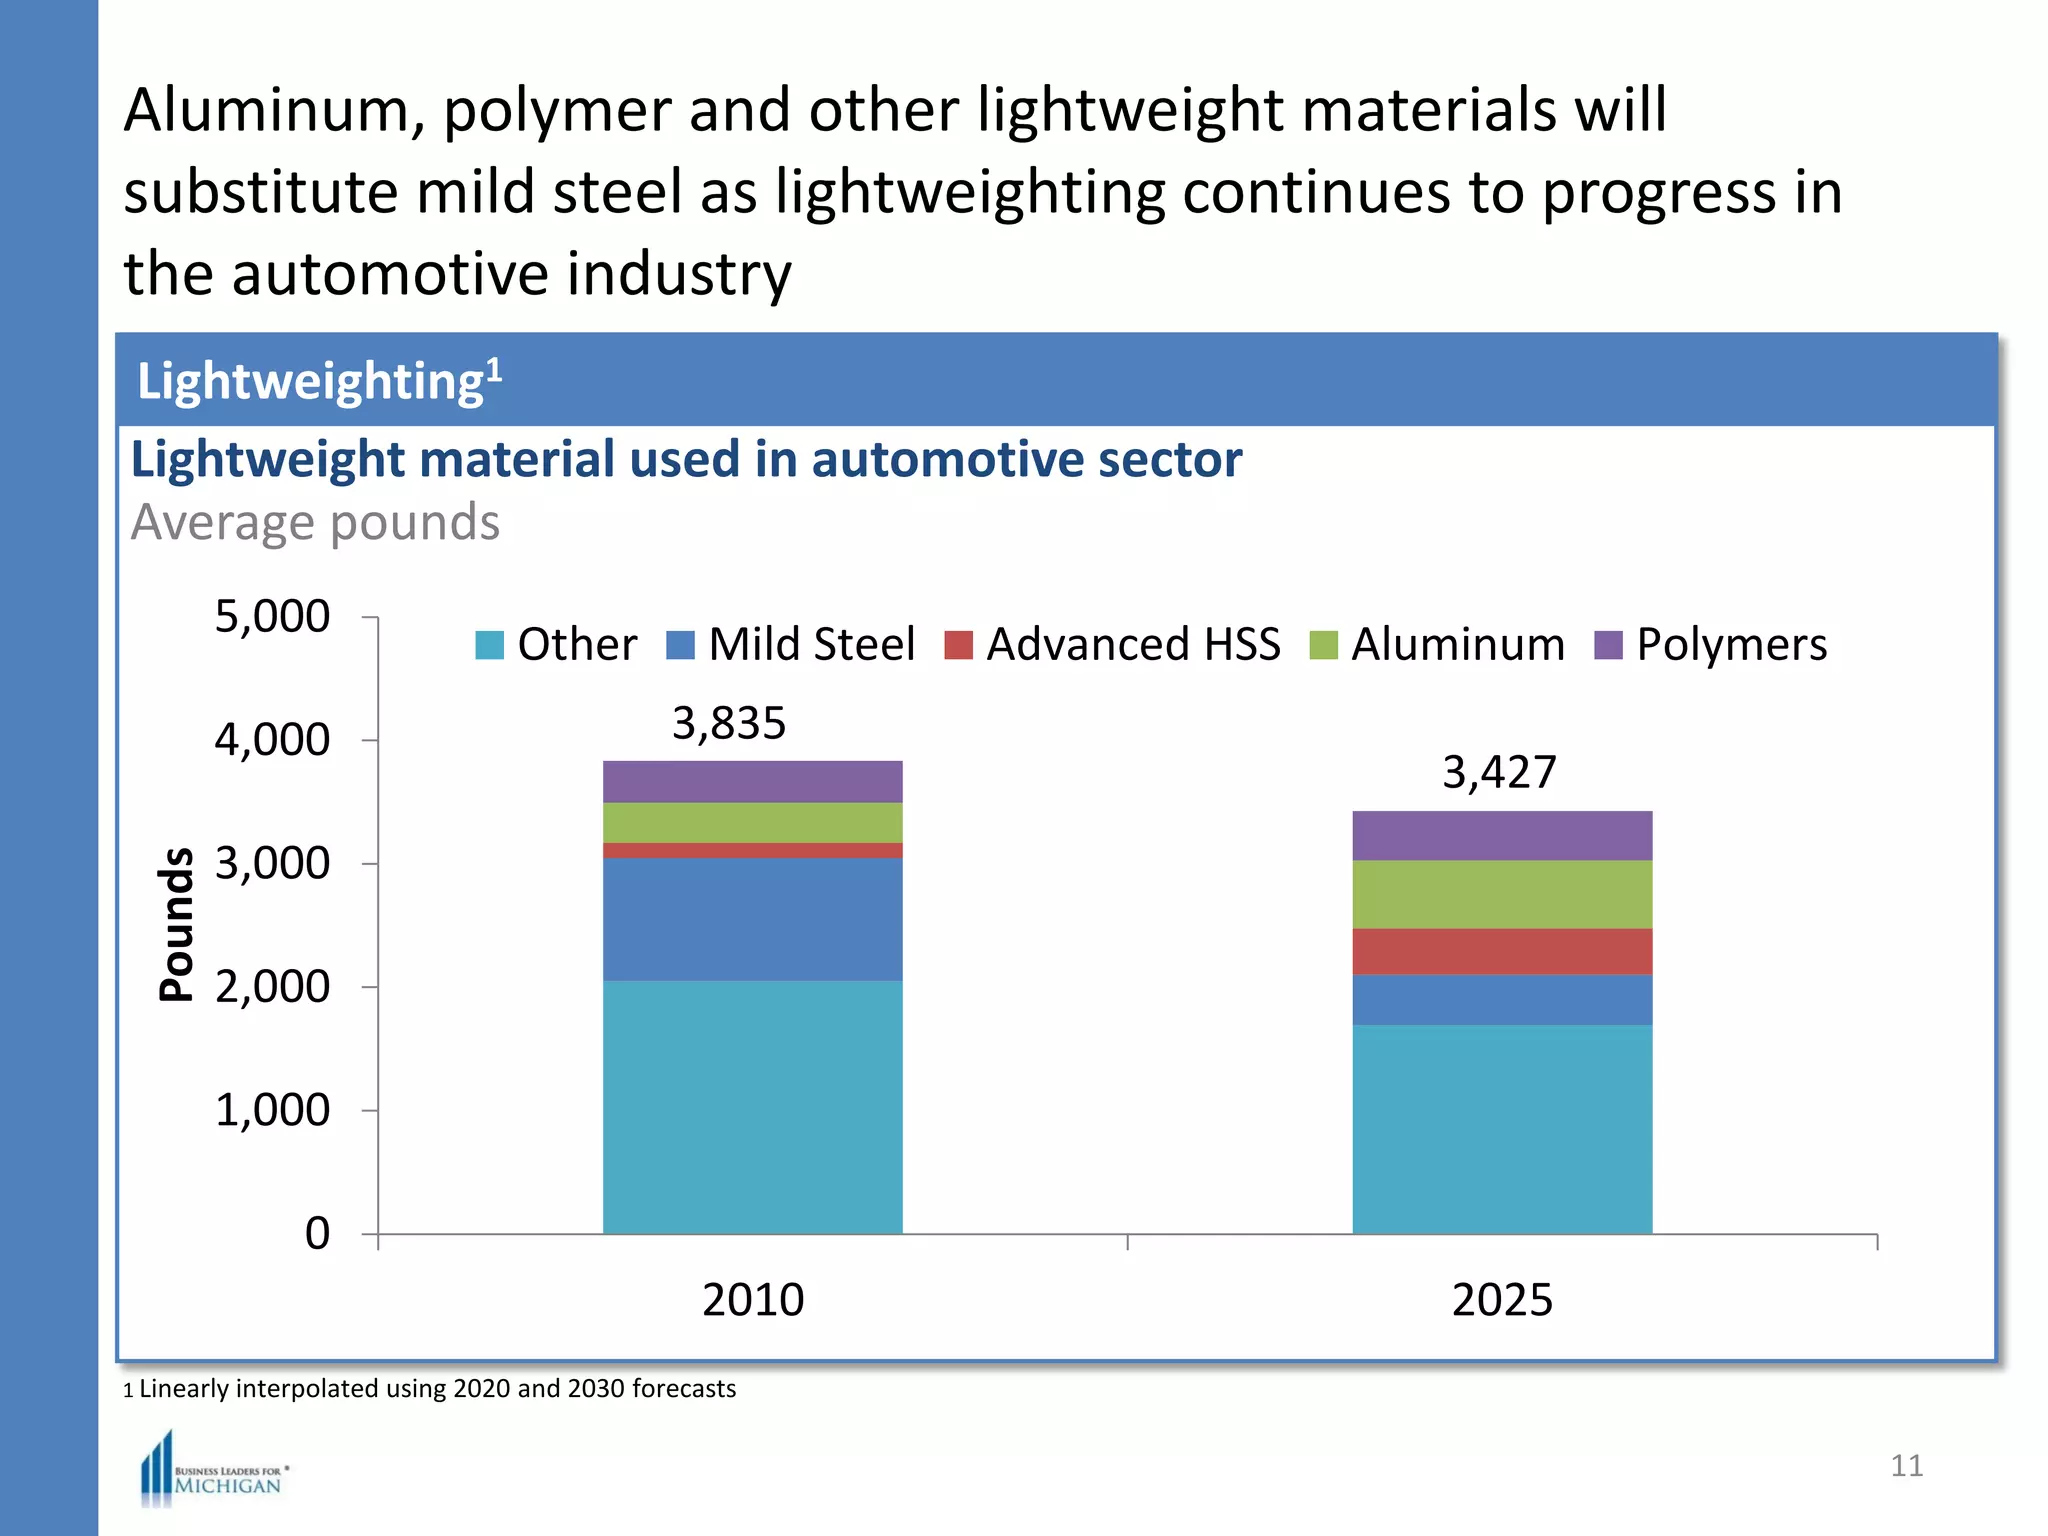
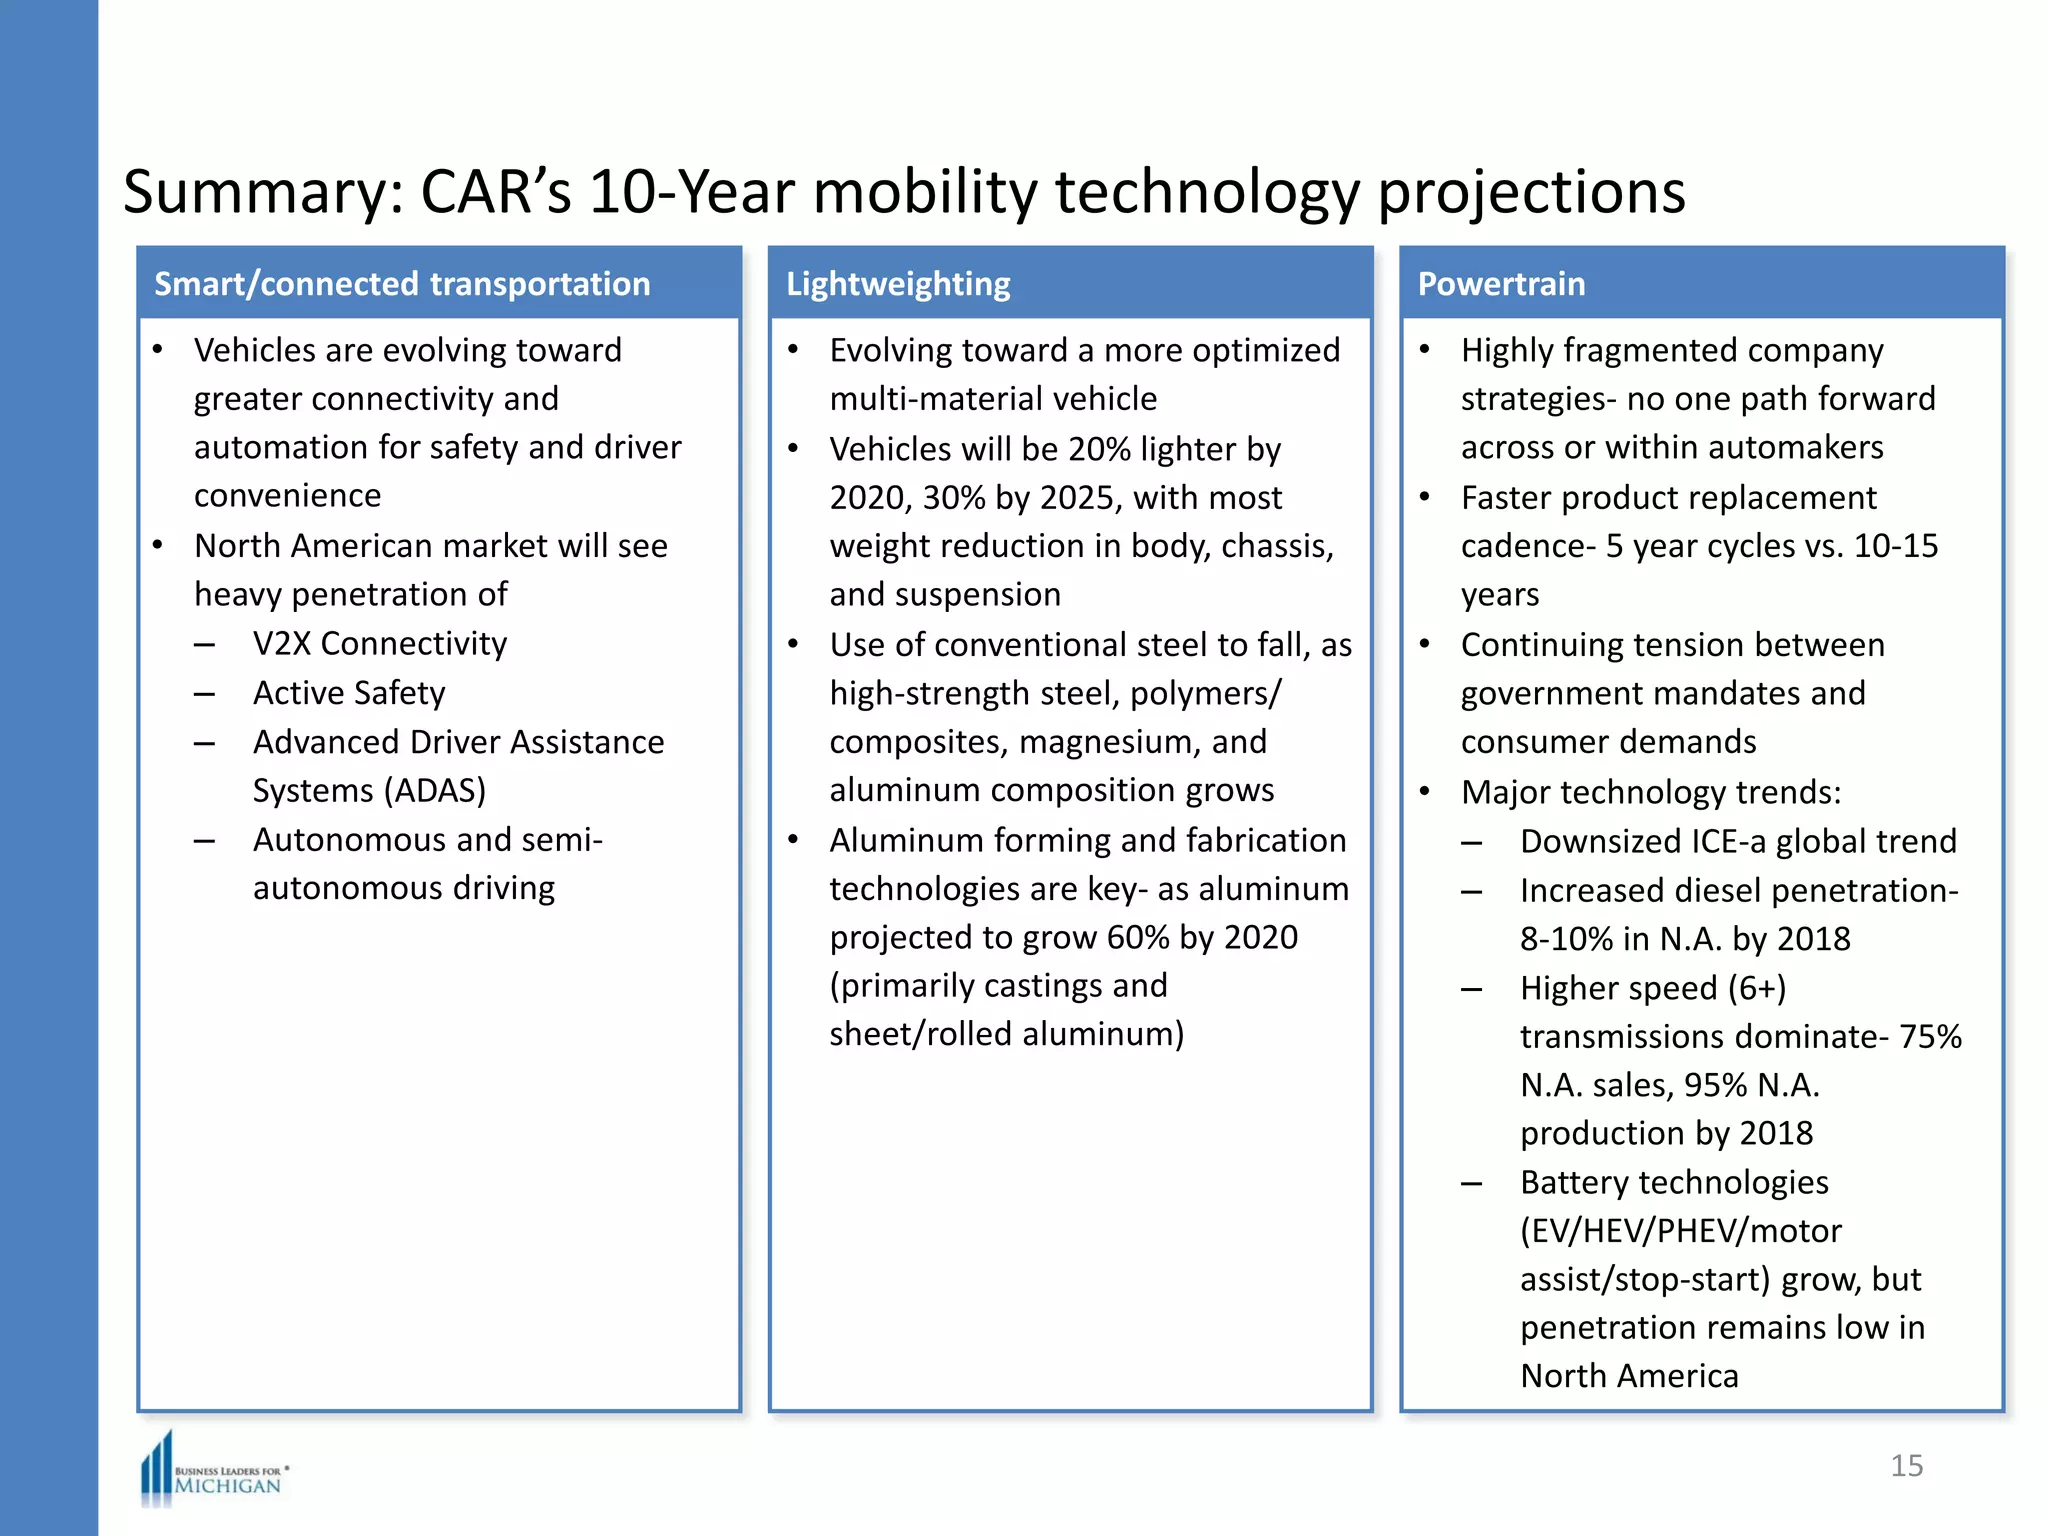
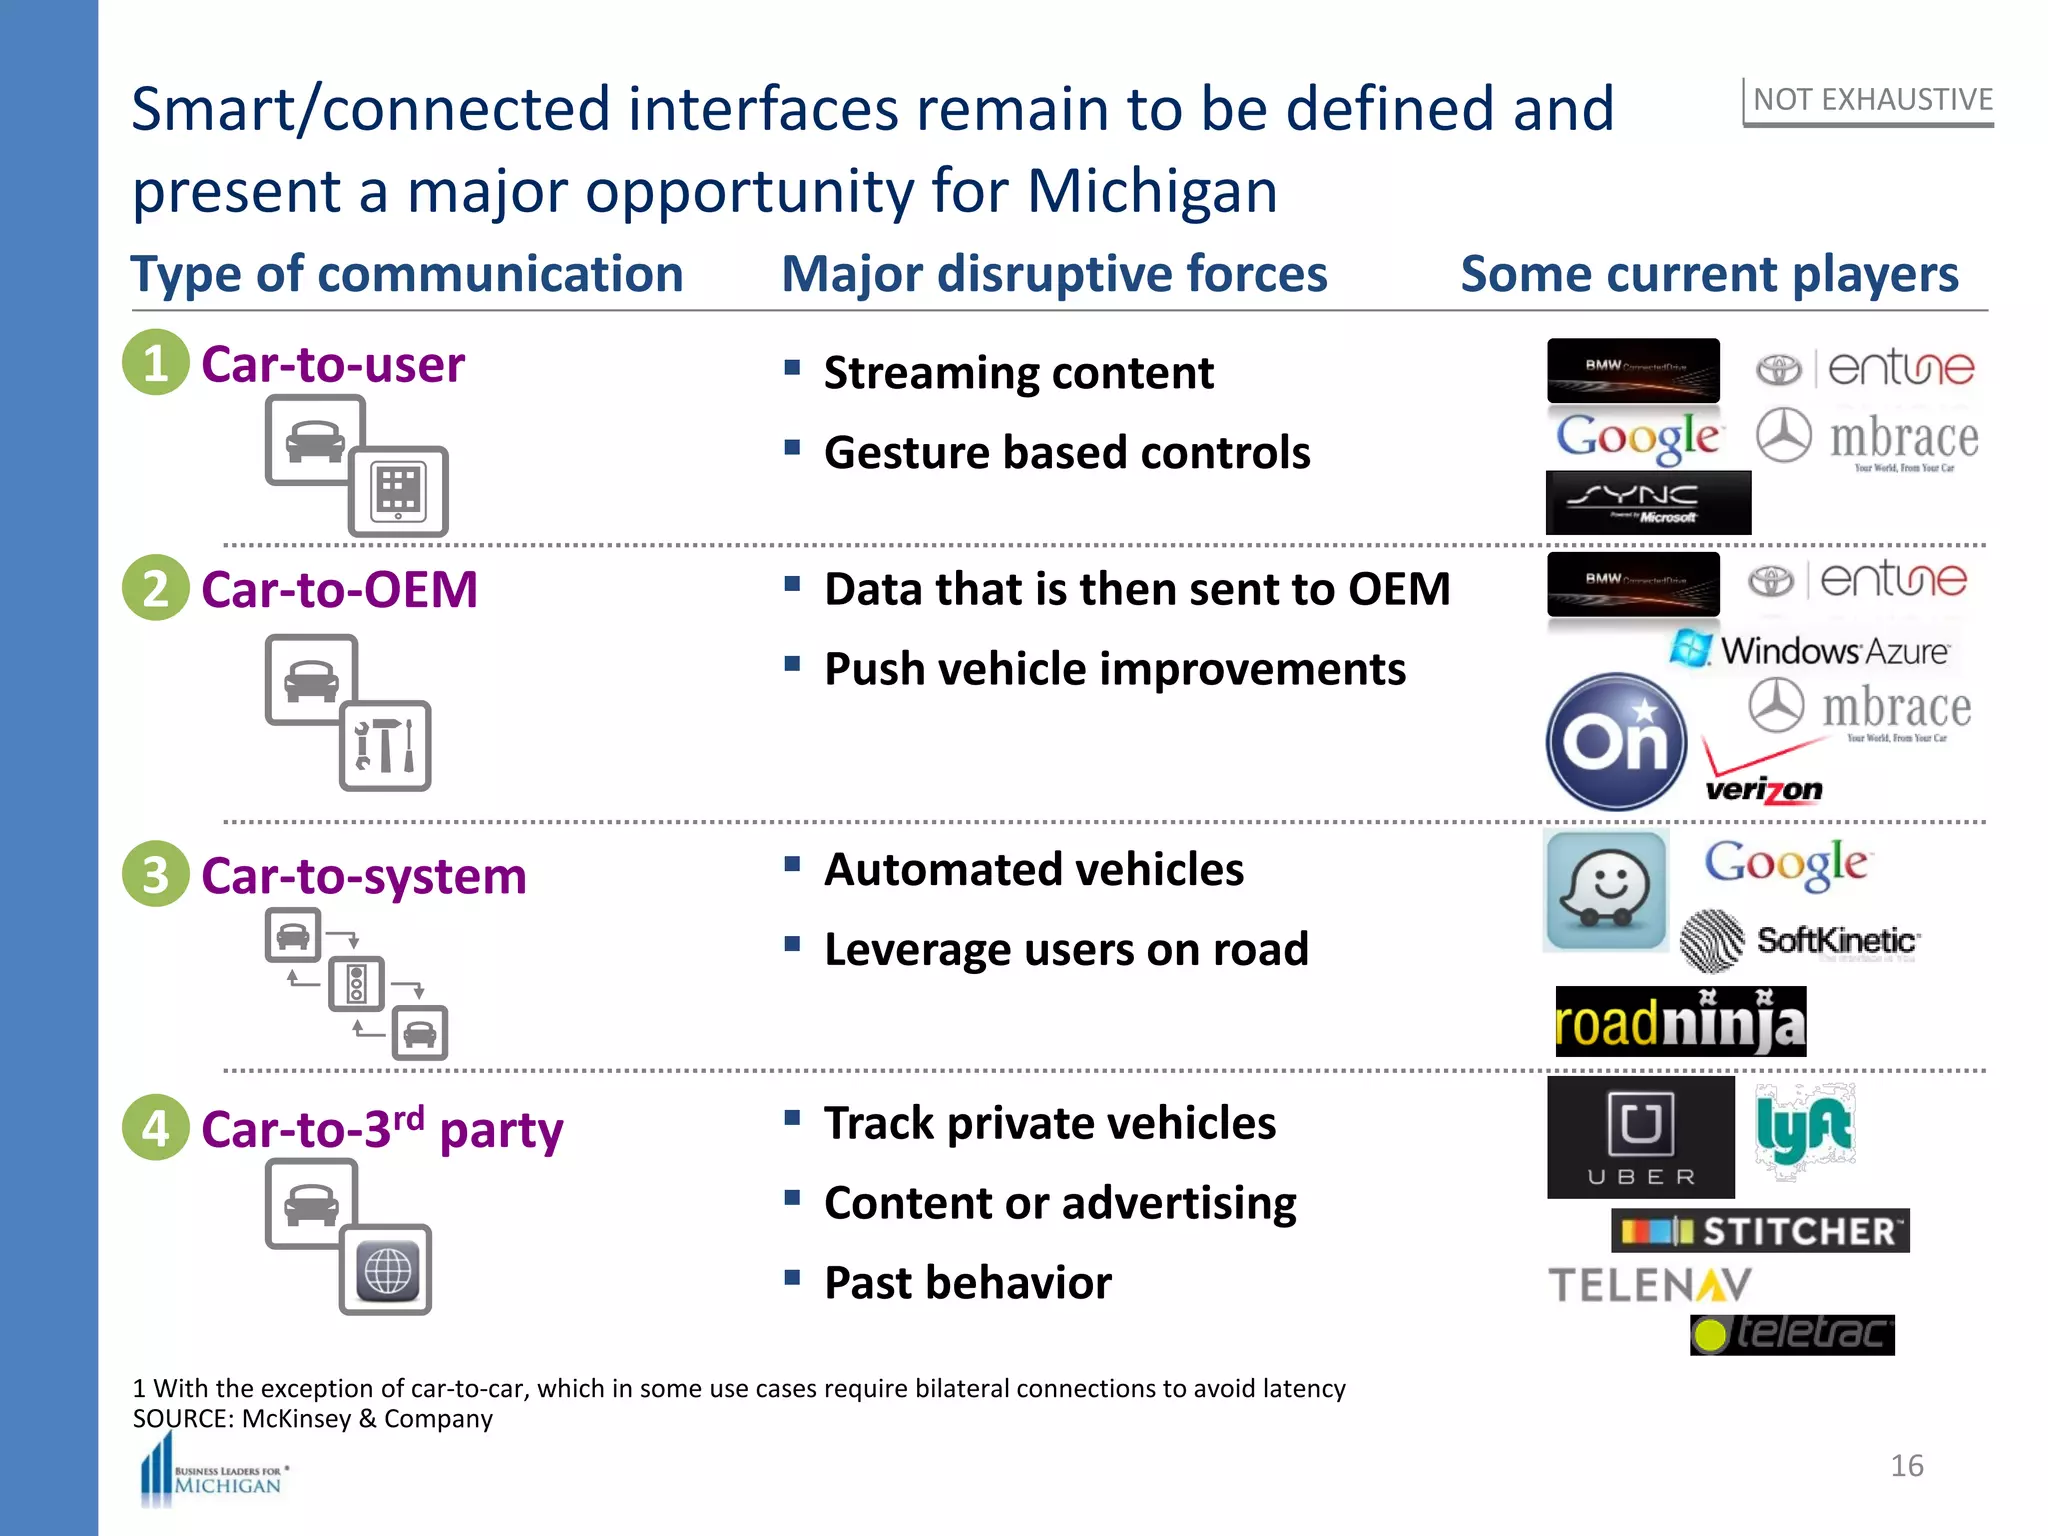
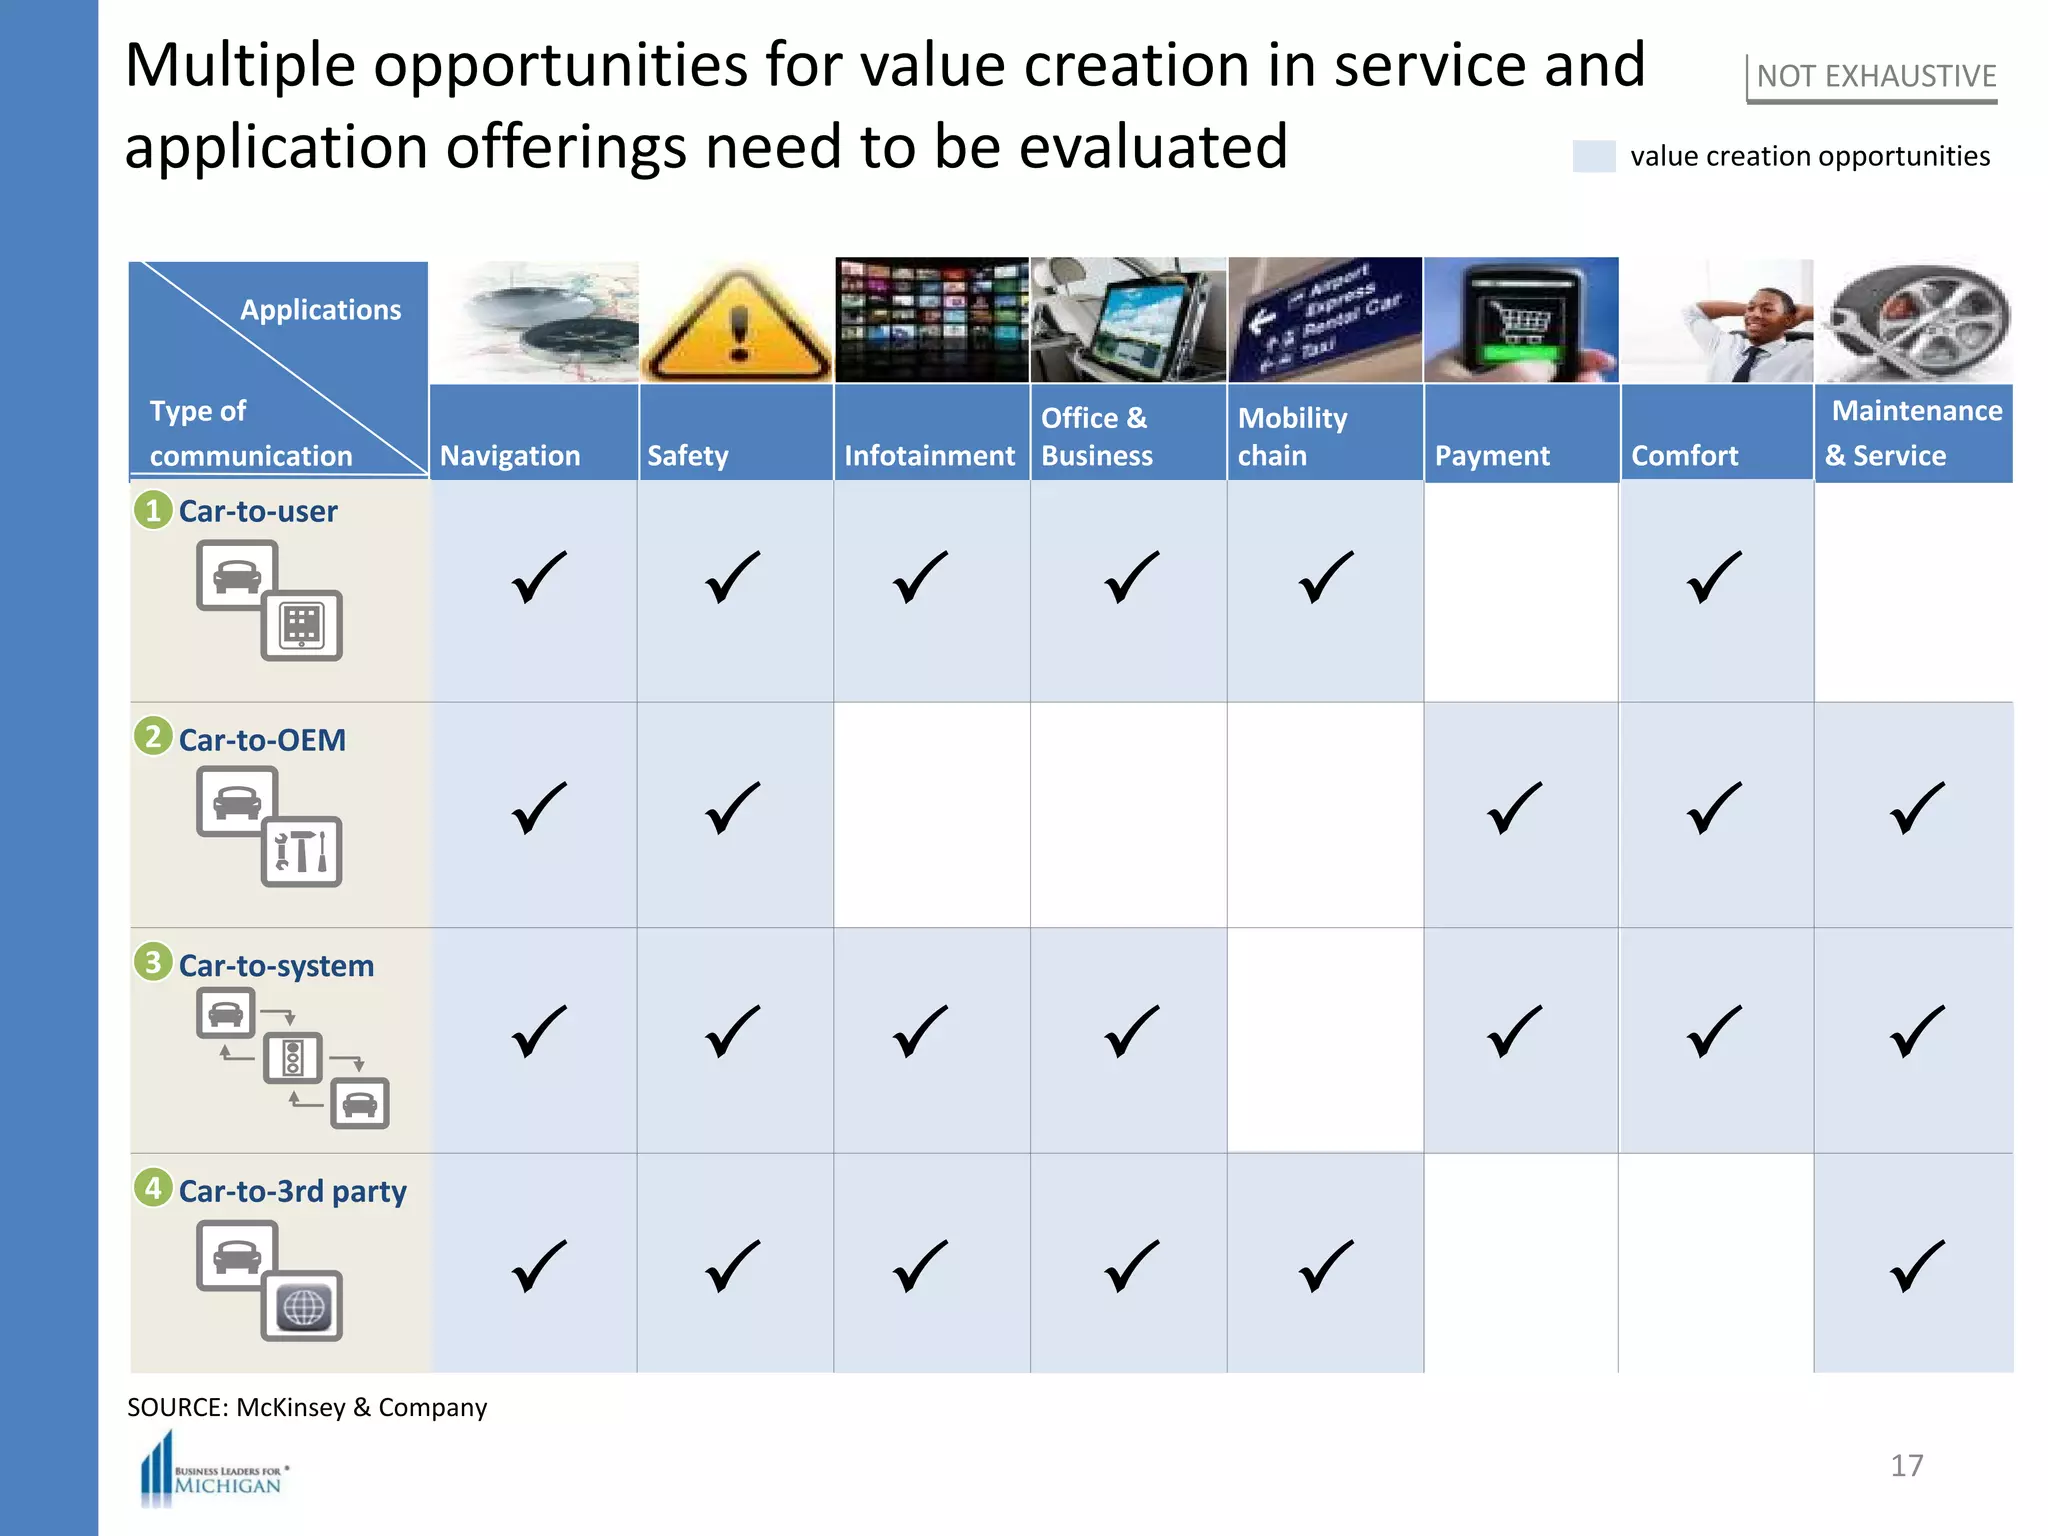
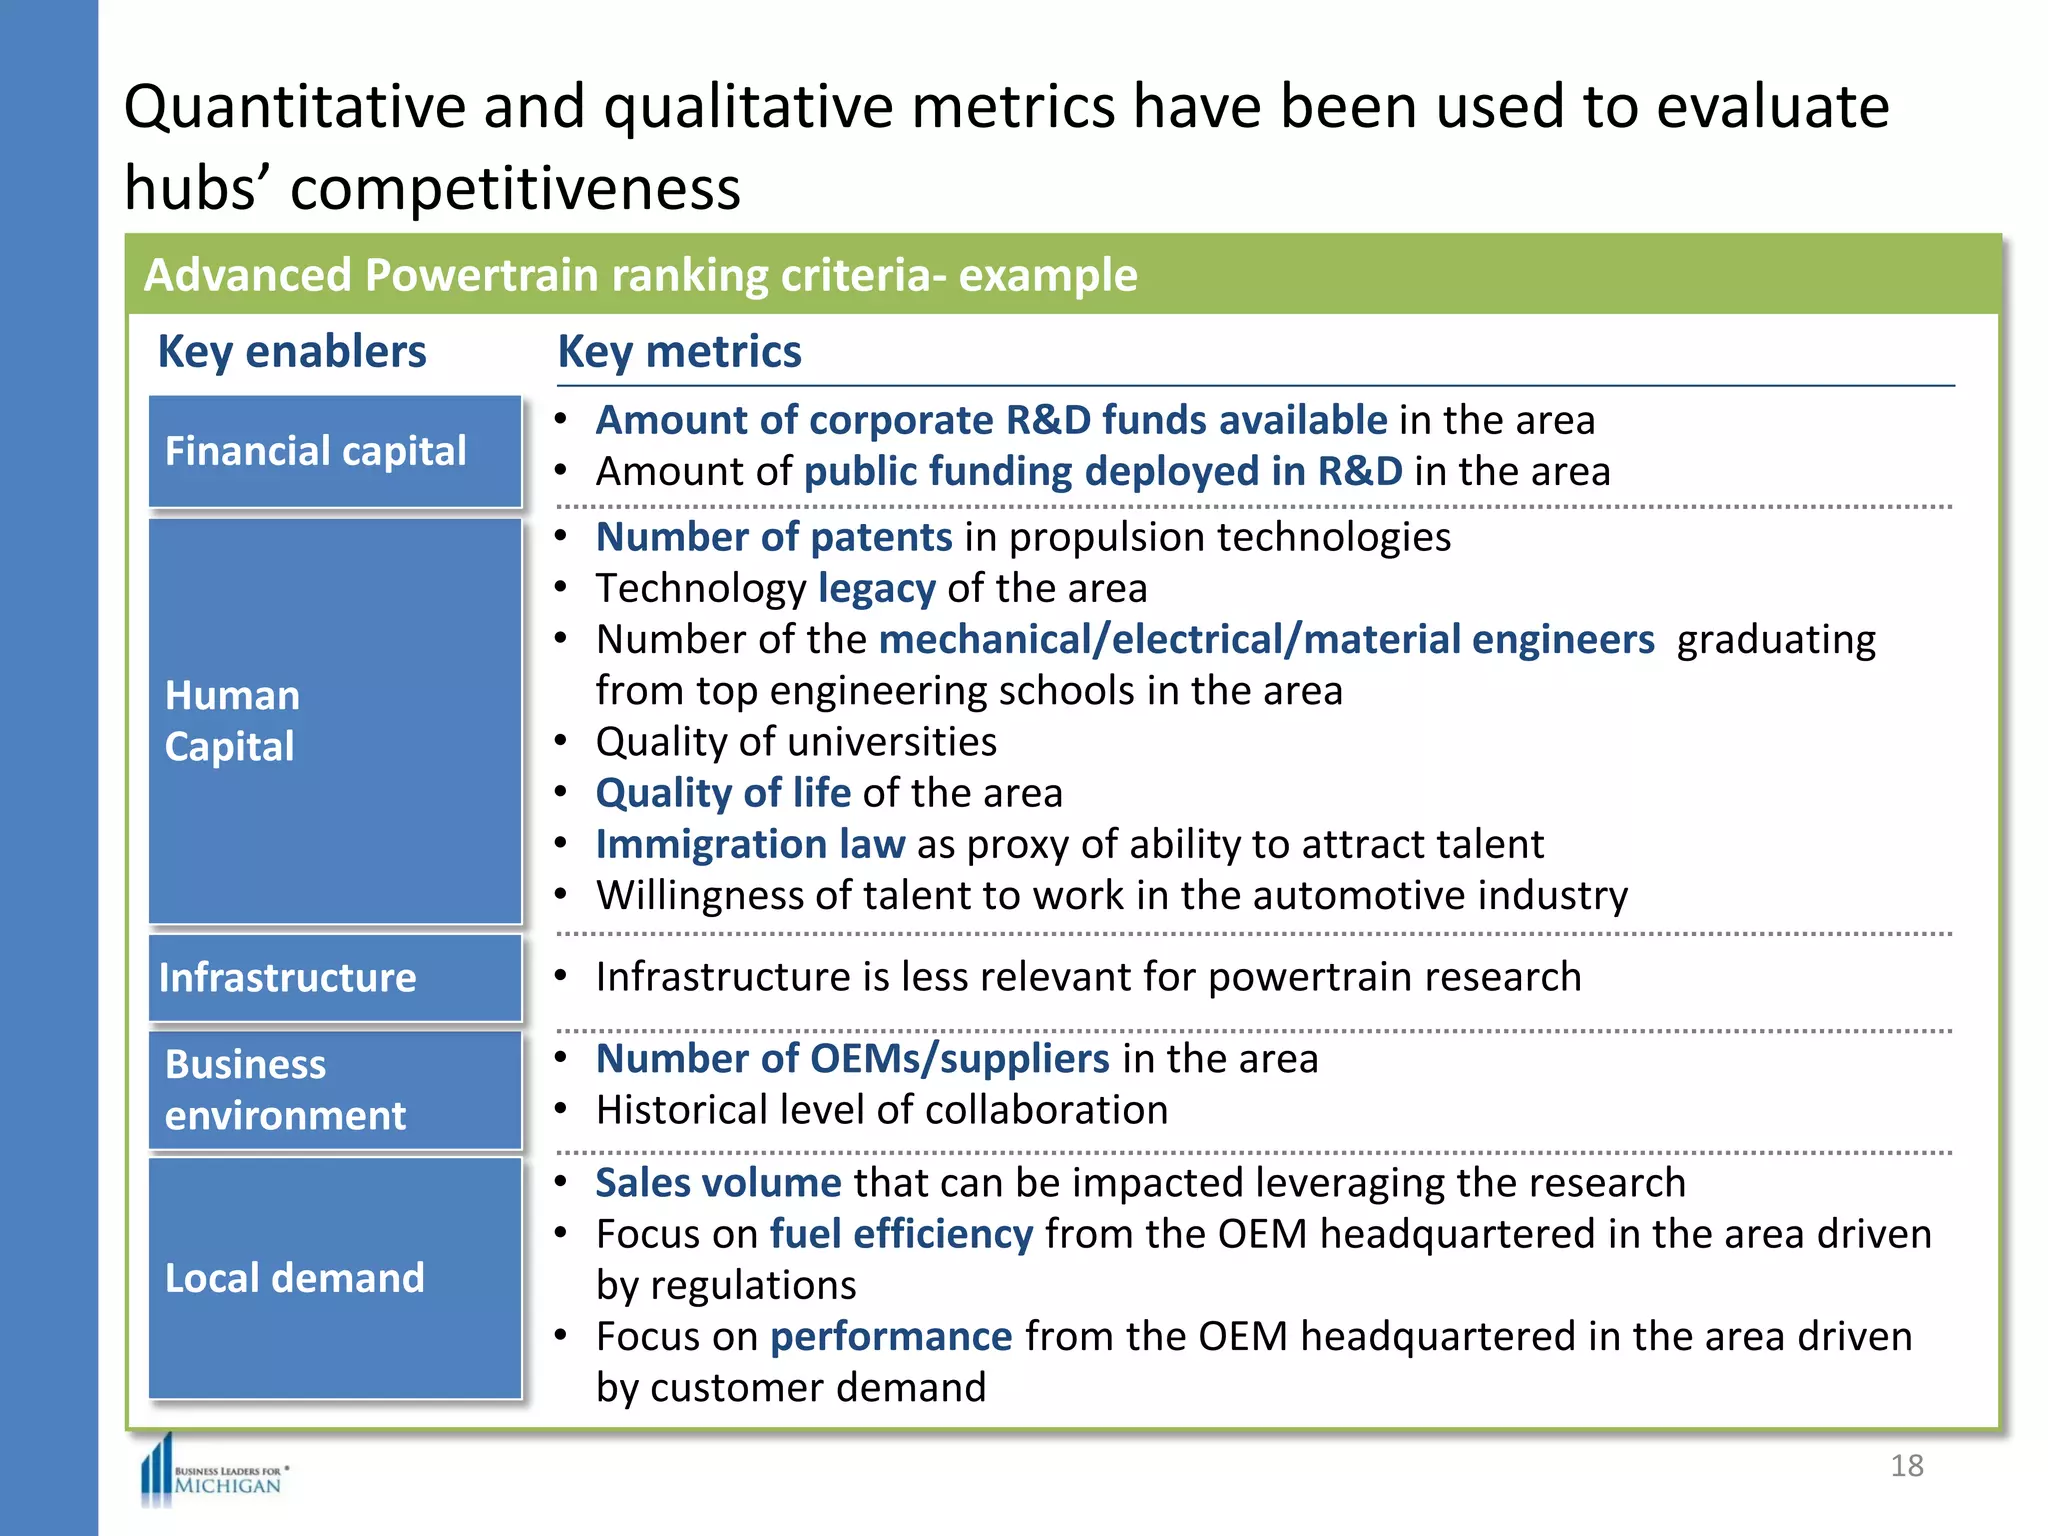
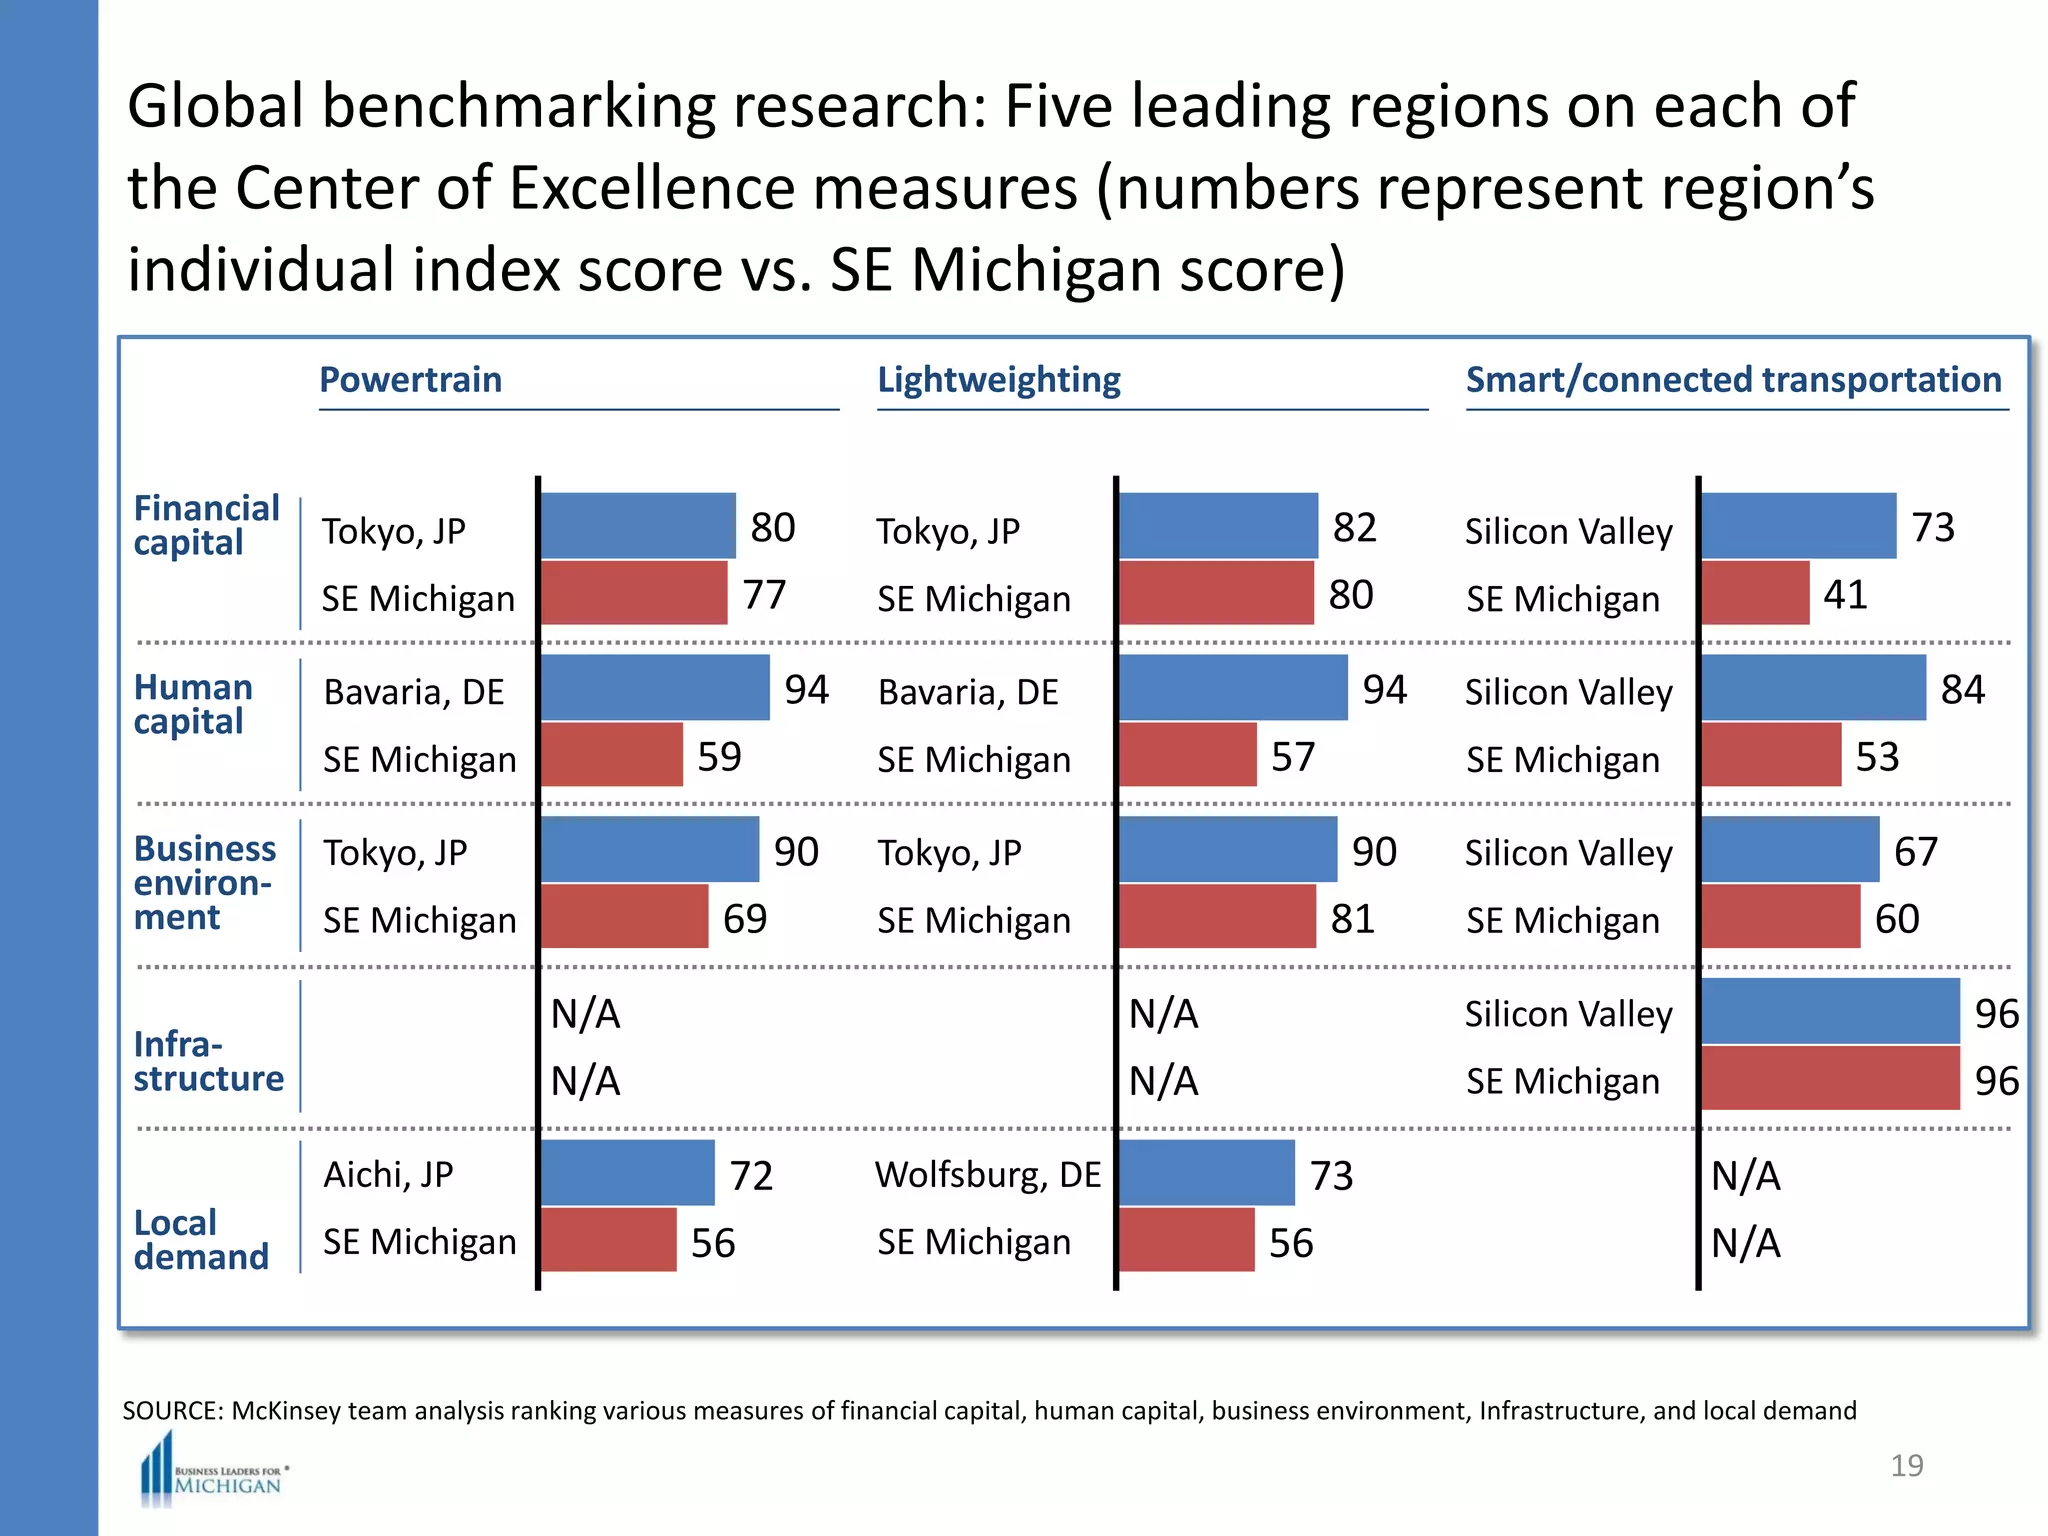
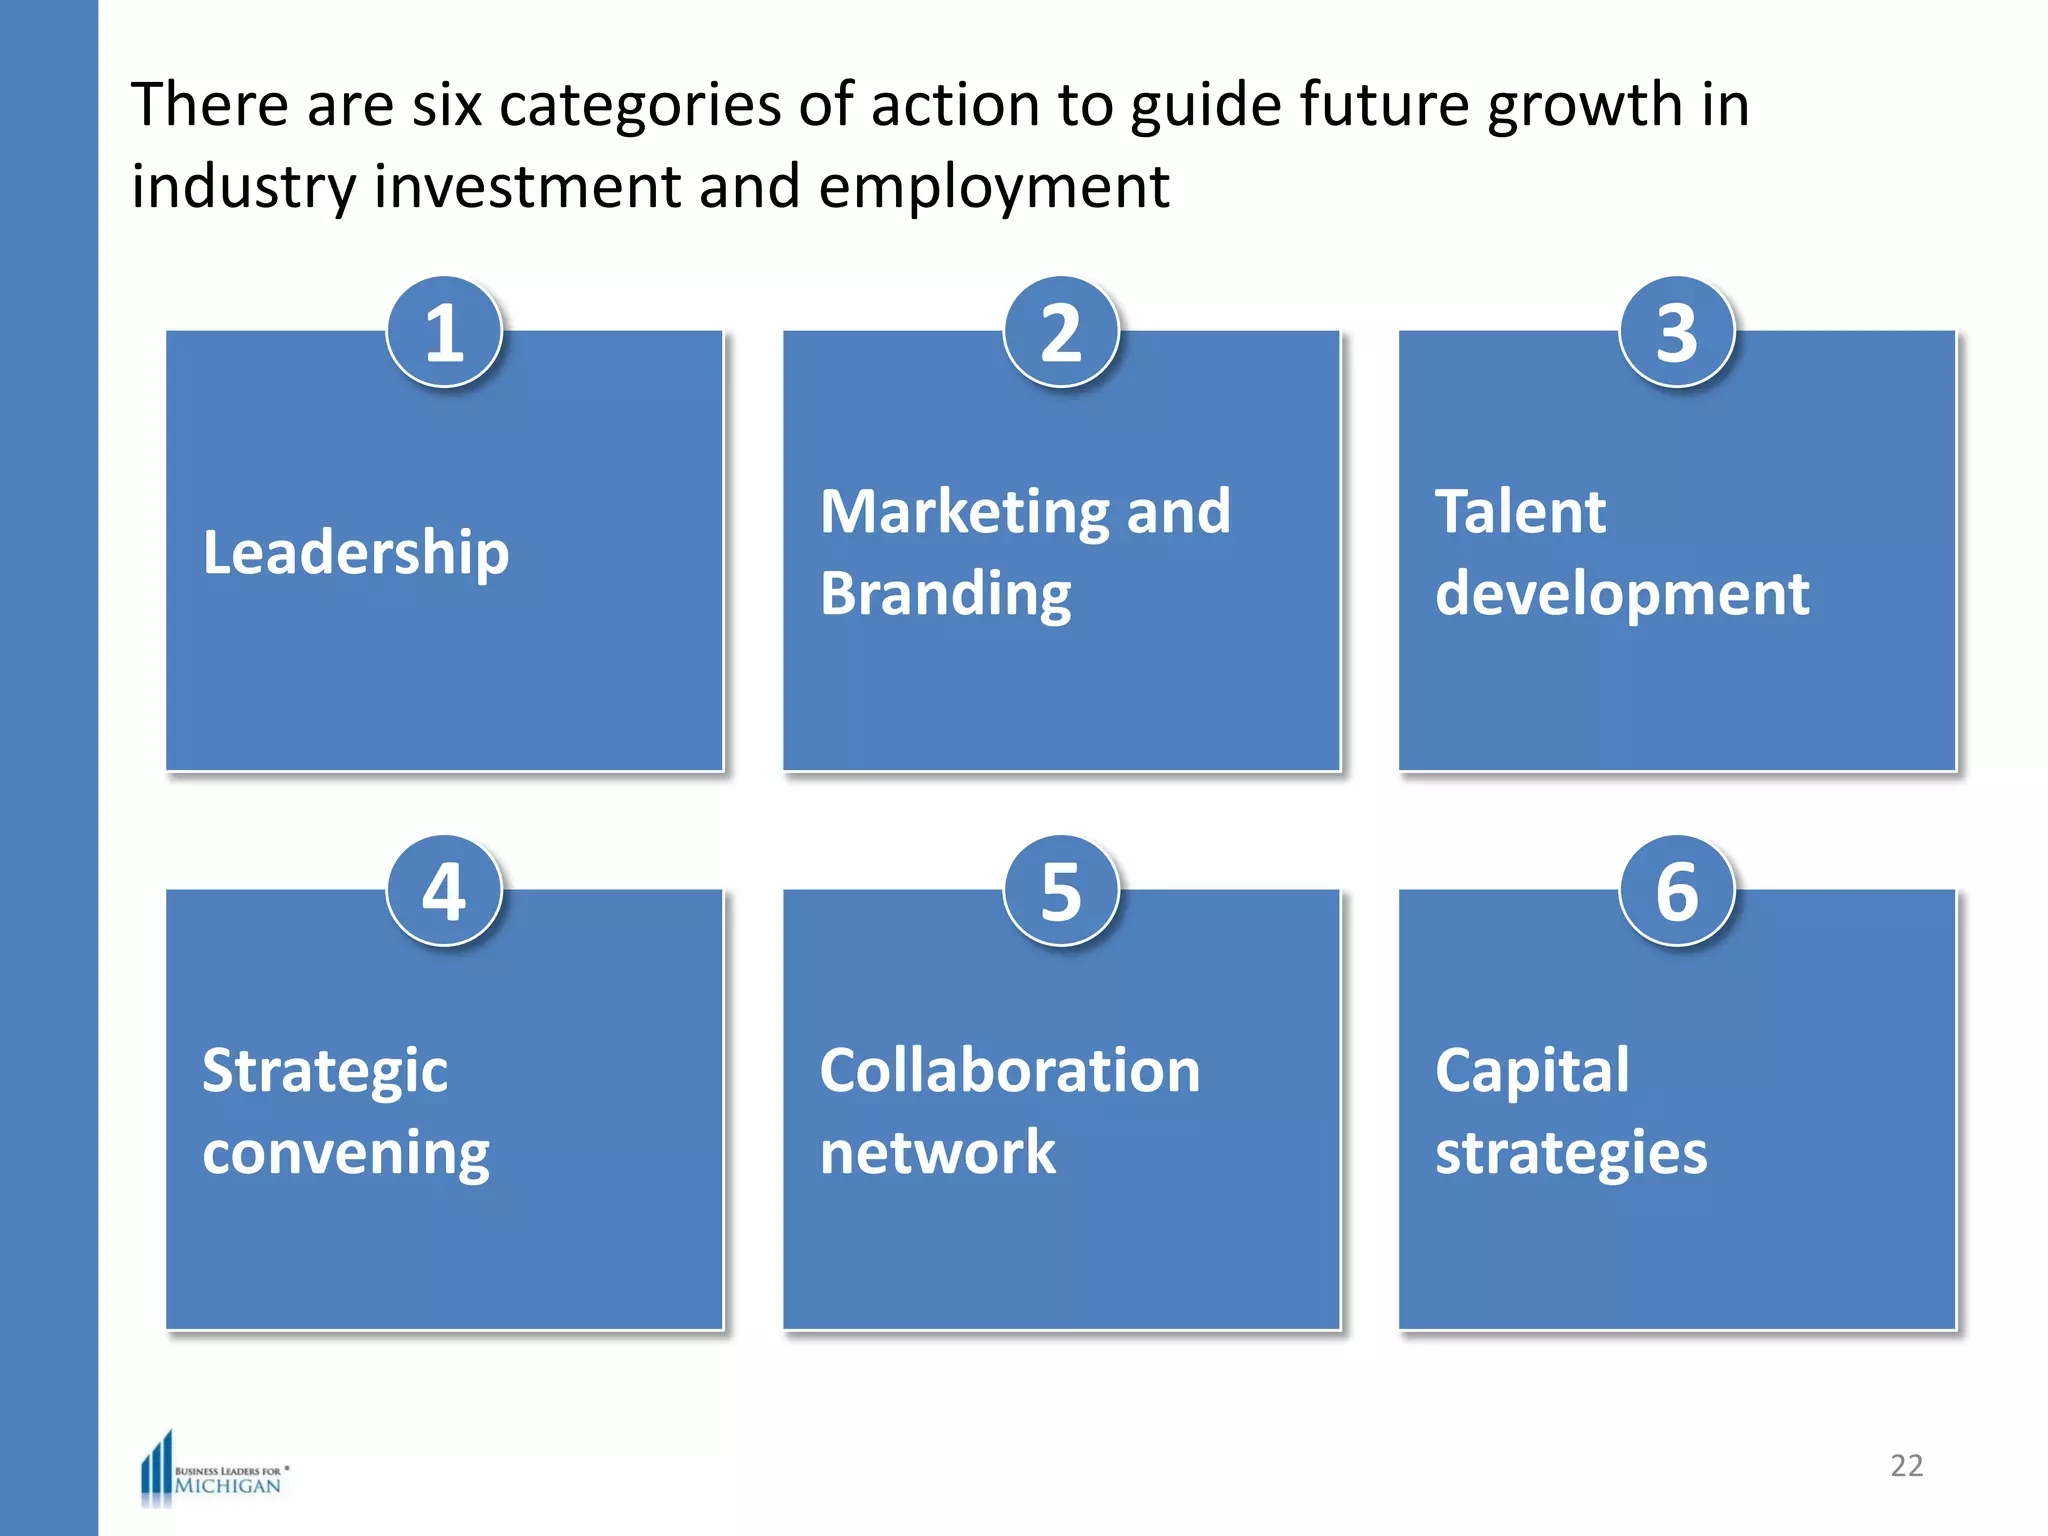
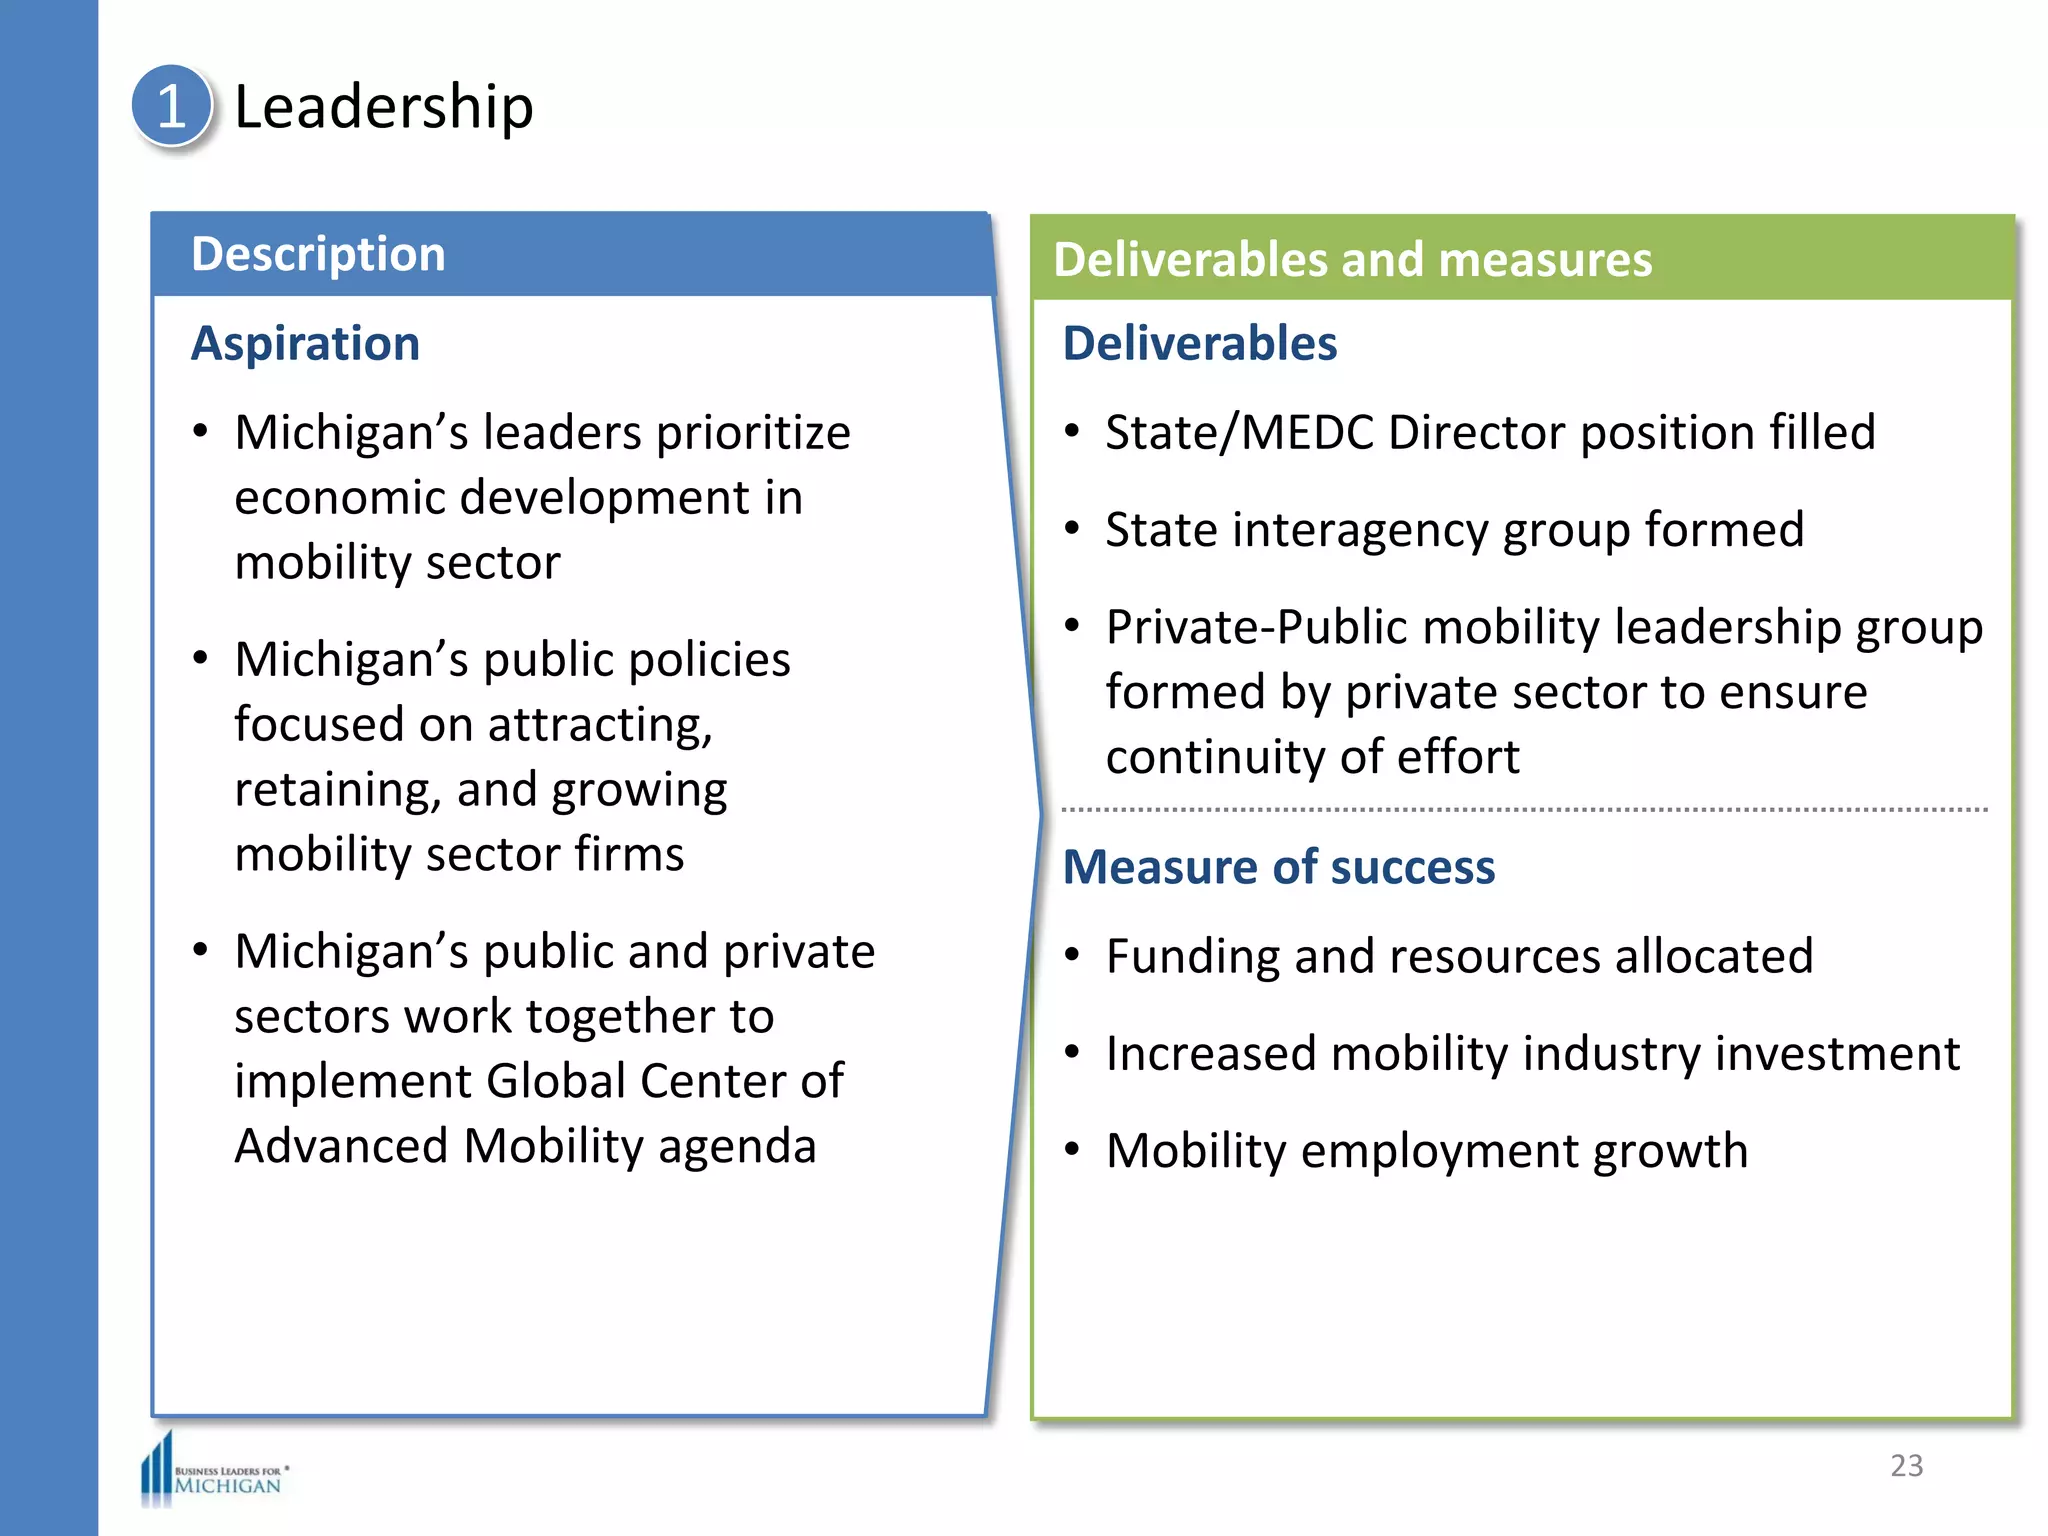
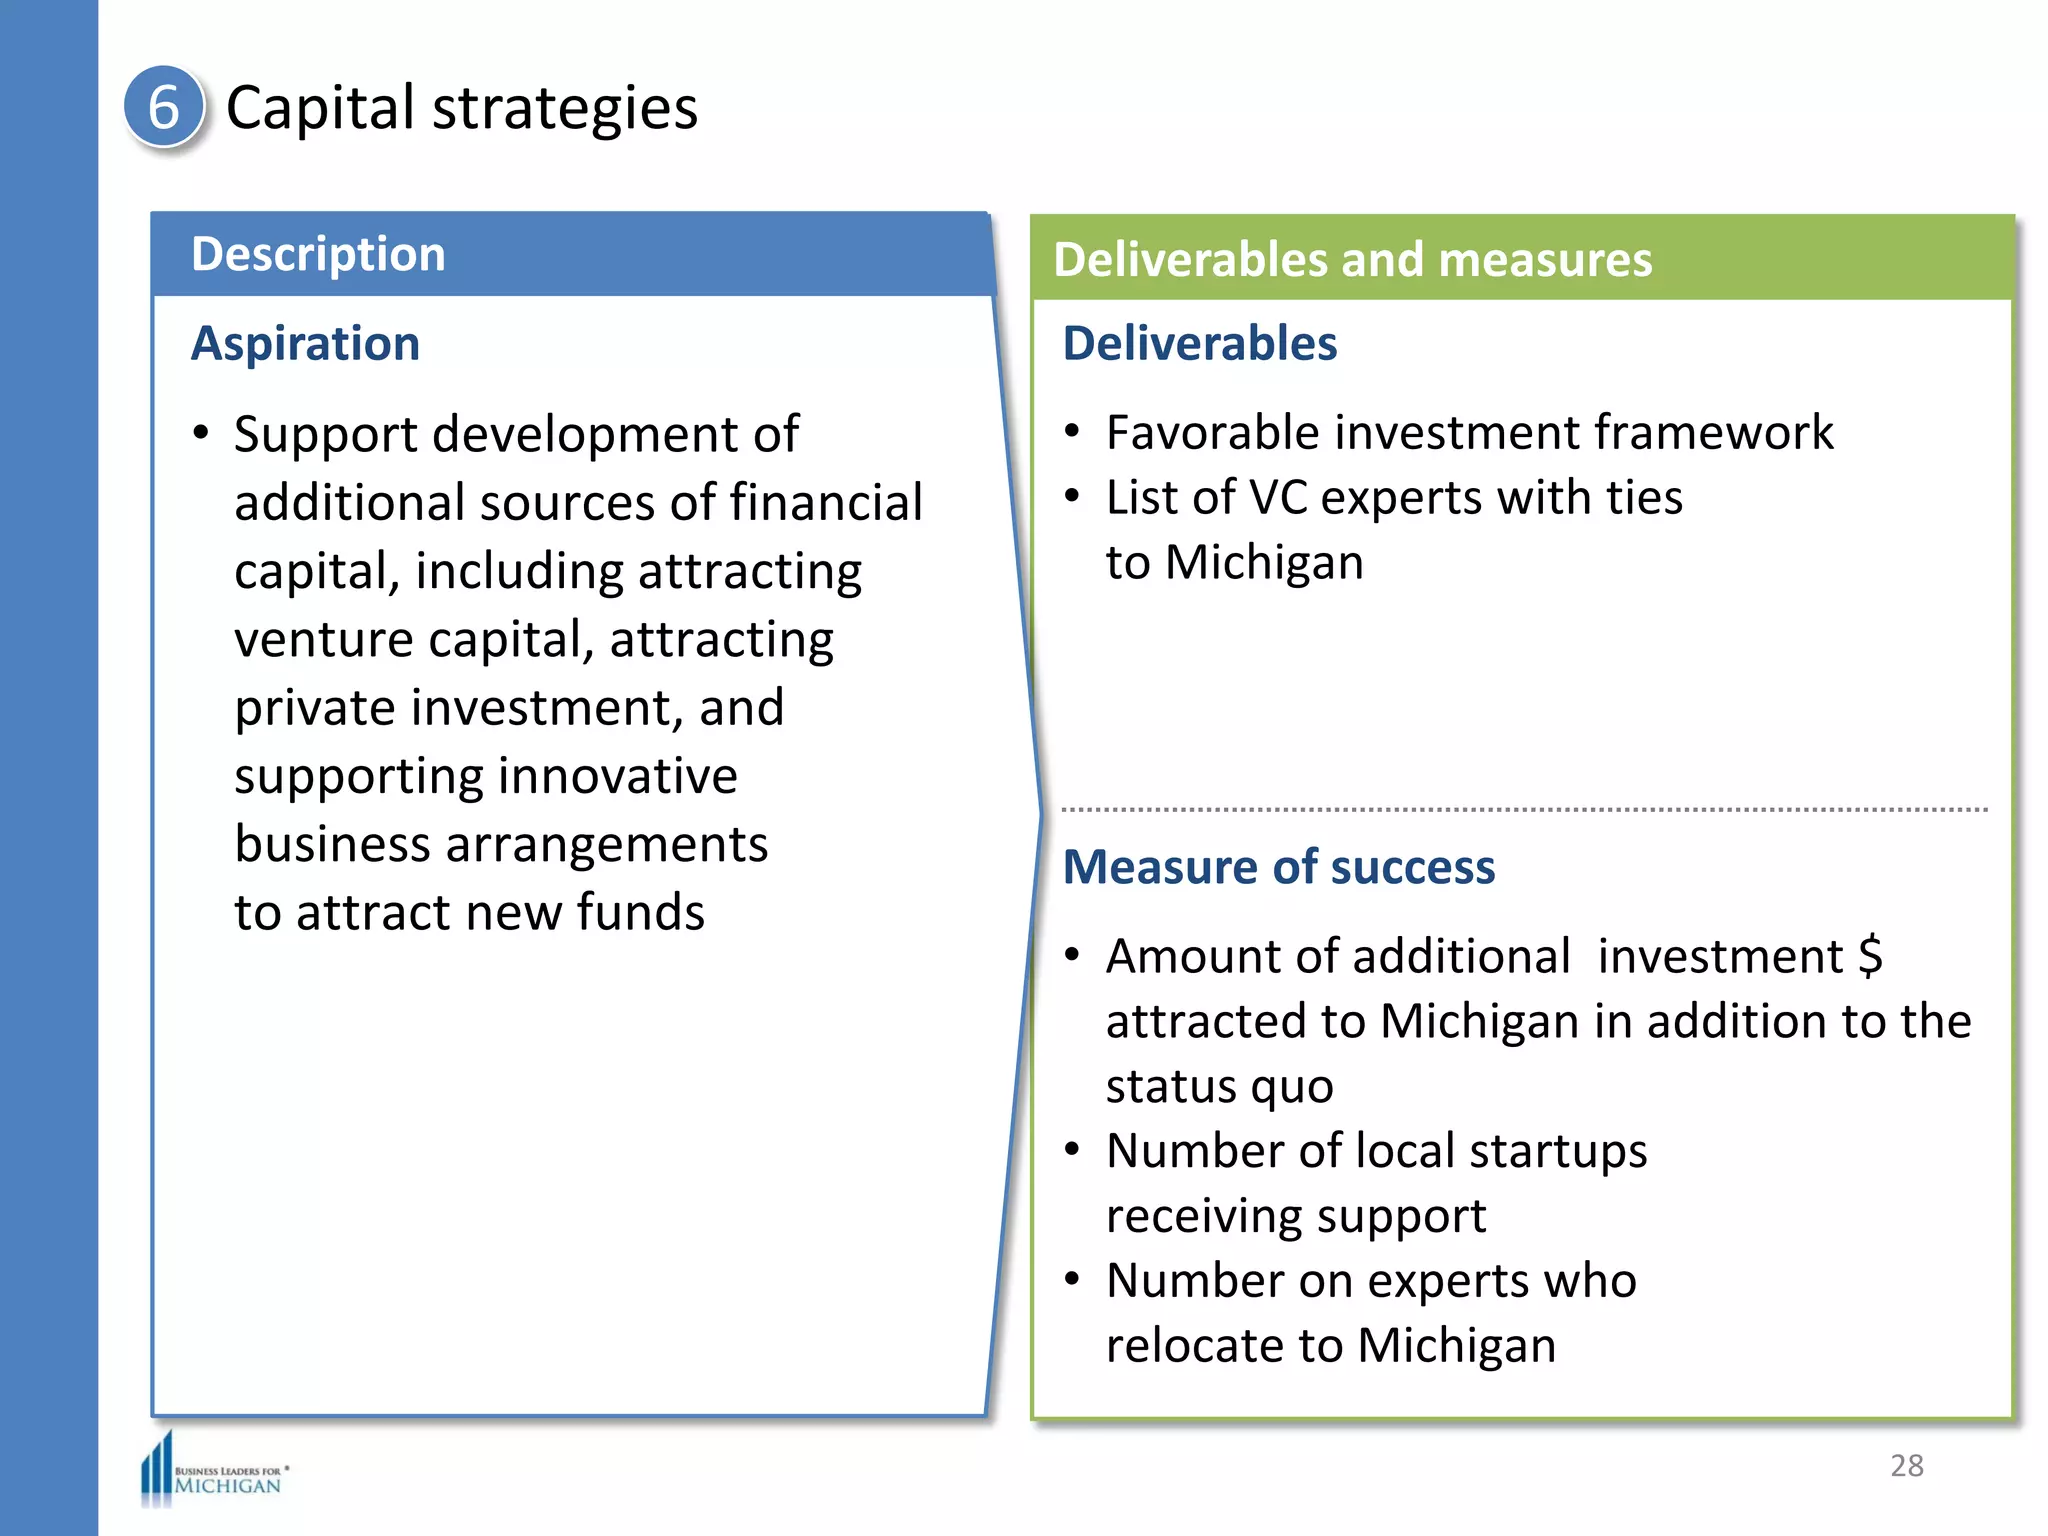
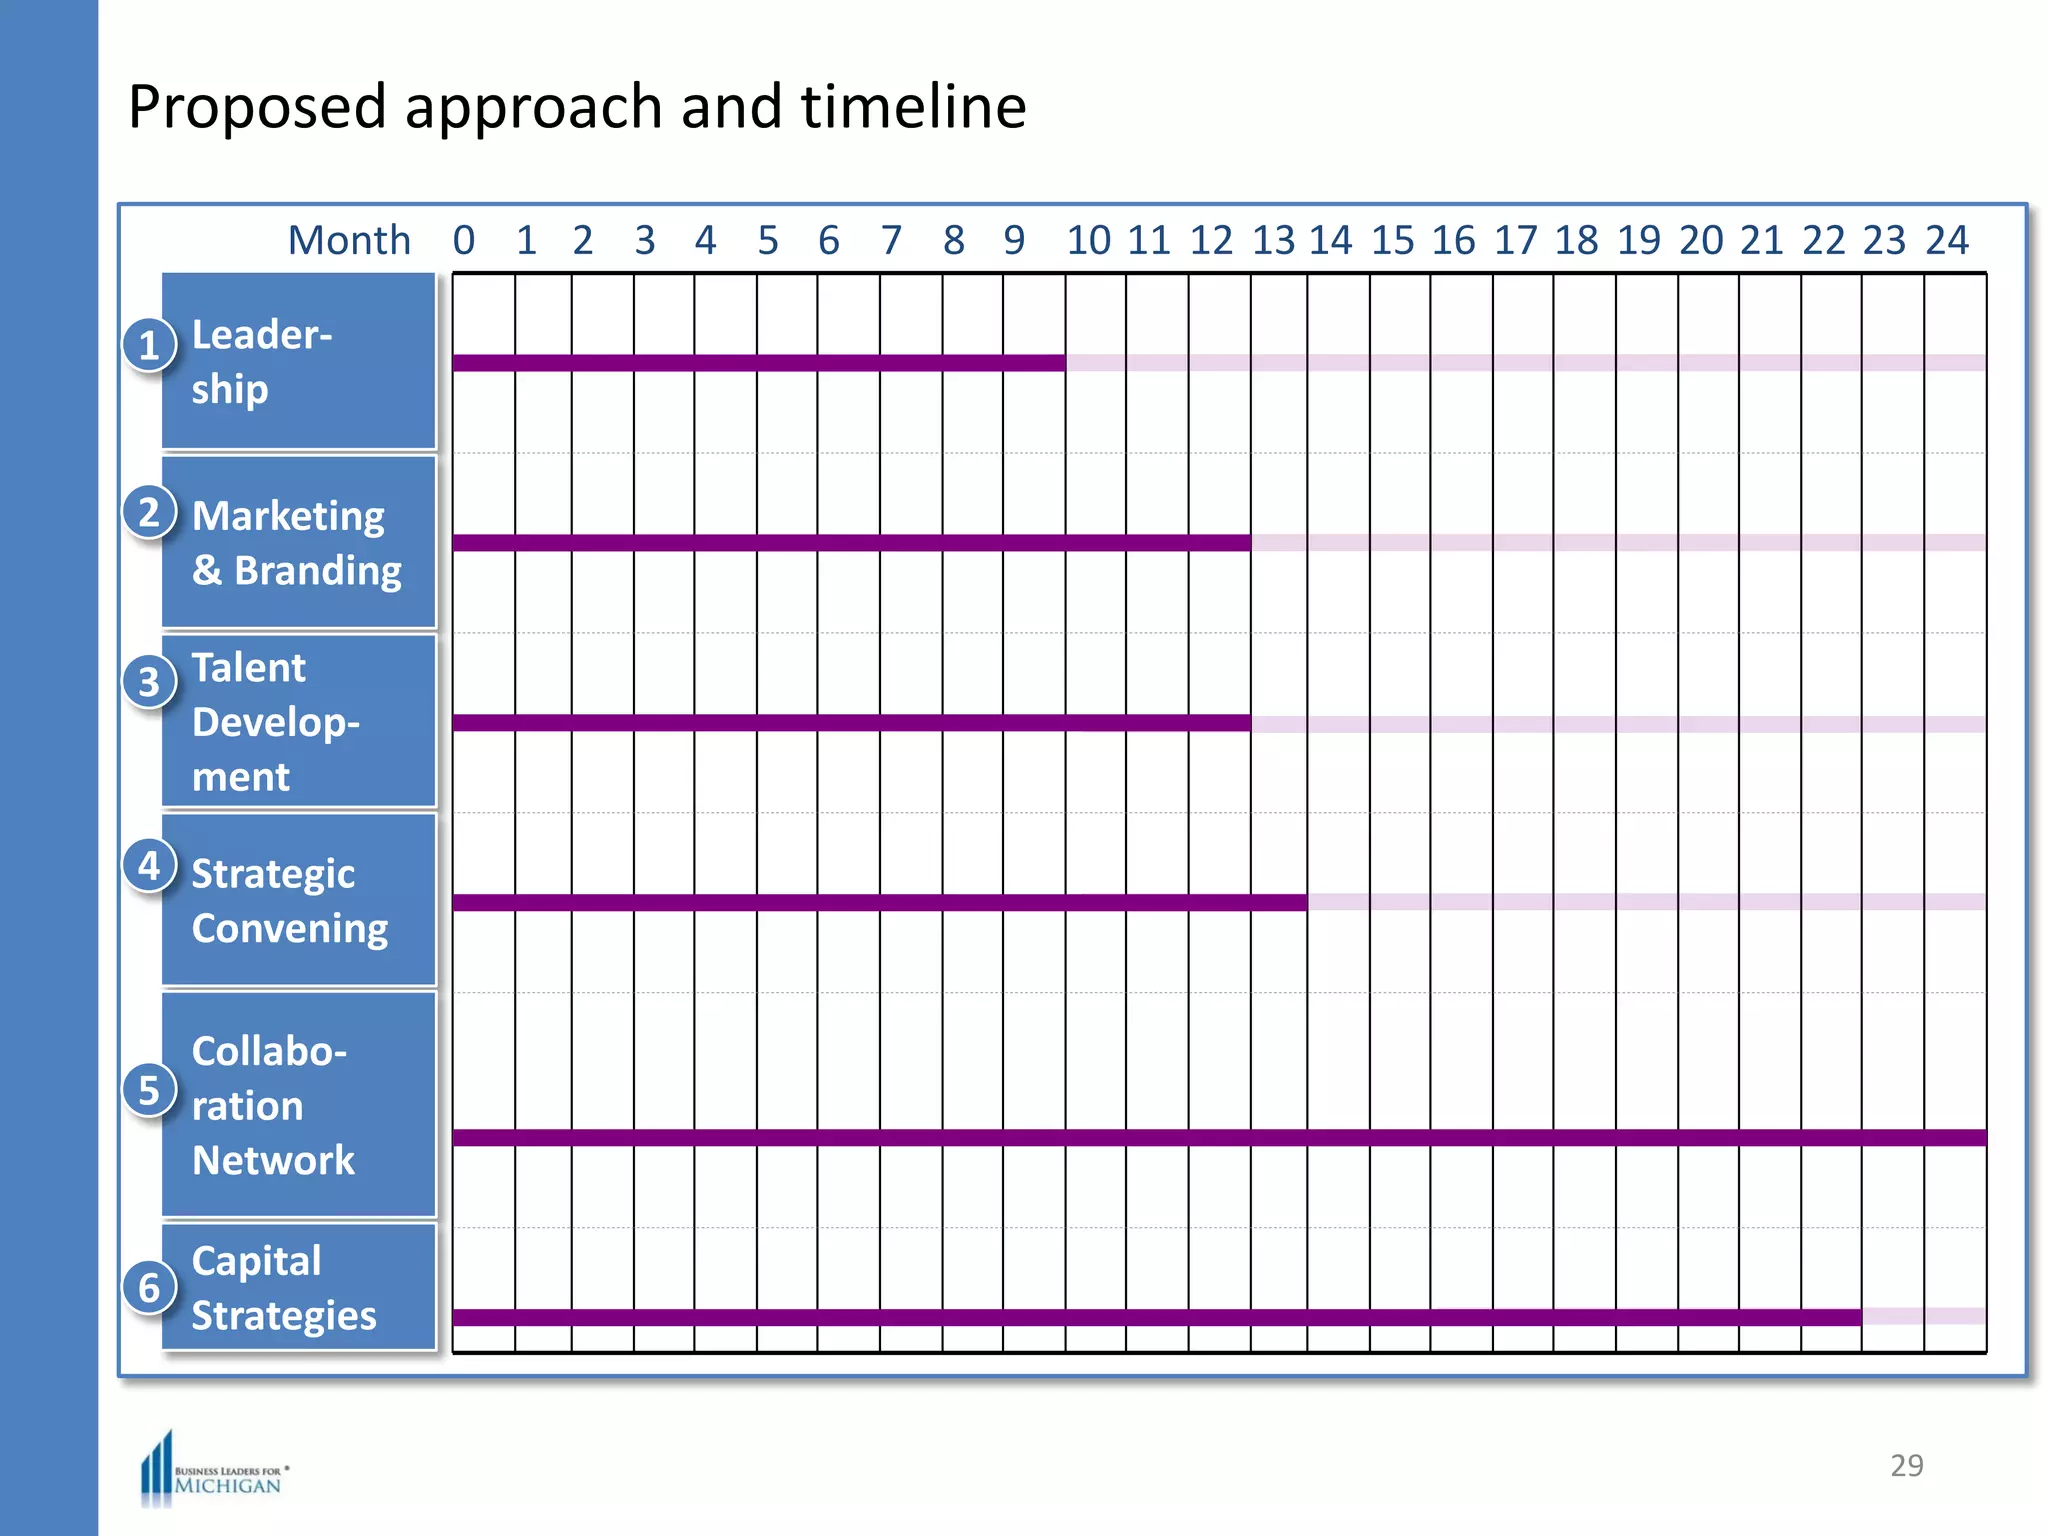
Global Center of Advanced Mobility –
Vision for future, competitive assessment,
and recommended actions
Brief summary document
December 12, 2013
1
This report was developed with a coalition of top industry experts, the
Center for Automotive Research and McKinsey & Company. It outlines
a strategy to position Michigan for long-term growth in the auto
sector as it continues to transition to an increasingly advanced
technology-based sector.
It was produced with support from Business Leaders for Michigan and
the Michigan Economic Development Corporation.
Executive summary
2
• Michigan can develop into the center of excellence for the major technologies in
the automotive landscape, including advanced powertrain, lightweight, and
smart/connected transportation
• Michigan is fairly well positioned to compete in powertrain and lightweighting
technologies but faces strong challenges from other competitive hubs
in smart/connected transportation:
– Strengths of the region include
▫ Strong capital availability driven by access to public funding and corporate
automotive R&D spending
▫ Global uniqueness of Michigan’s concentration and size of OEMs/suppliers
– Areas that need to be addressed to ensure future relevance include
▫ Development of talent pipeline due to demographics and technology changes in
the automotive industry
▫ Continued growth of innovation mentality and increased availability of VC funds
▫ Deeper collaboration across the supply chain
• Six categories of actions need to guide BLM’s path forward:
– Leadership
– Marketing & branding
– Strategic convening
– Talent development
– Collaboration network
– Capital attraction
The BLM Global Center of Advanced Mobility strategy was
developed by: BLM, industry experts, McKinsey and CAR
3
Business Leaders
for Michigan
BLM members include:
• David Dauch, AAM
• Bill Ford, Ford Motor
Company
• Timothy D. Leuliette,
Visteon
• Tim Manganello,
BorgWarner
• Roger Penske, Penske
Corporation
• Stephen Polk, Polk
• Doug Rothwell,
Business Leaders for
Michigan
• Matt Simoncini, Lear
Steering Committee of
Industry Experts
• Mark Barrett, AAM
• Nigel J. Francis, MEDC
• Scott Gallett,
BorgWarner
• Mike Gingell, Polk
• Brian Mackowiak,
Penske Logistics
• Ed Lowenfeld, Lear
• Randal Visintainer,
Ford Motor Company
• Tim Yeardon, Visteon
CAR/McKinsey
Working Group
CAR
• Jay Baron
• Sean McAlinden
• Kristin Dziczek
• Richard Wallace
McKinsey & Company
• Hans-Werner Kaas
• Russell Hensley
• Douglas Mehl
• Paolo Sandrone
• Adeline Dougherty
• Mahi Rayasam
• Abby Holaschutz
Contents
4
• Vision for future
• Competitive assessment
• Recommended actions
Michigan growth strategy relies on six pillars, with Advanced
Mobility being an important one
5
SOURCE: Business Leaders for Michigan – Michigan Turnaround Plan 2012
Number of jobs created for Michigan economy, Thousand
Scenario
1
Scenario
2
41
9
32
30
7
235
1 4
5
1 4
Scenario
3
Total JobsDirect Job creationIndirect Jobs
Investments in three mobility technologies have a potential of
creating up to 75–100 thousand jobs for the Michigan economy
6
Scenario 1: 0% increase in market share, $2 billion sales in IV products
15
2 13
75
15
61
45
11
3415
2 13
21
3 18
Lightweight
21
3 18
Total
101
20
81
Smart/Connected
Transportation
59
14
45
Powertrain
Scenario 2: 2% increase in market share due to PT and LW, $3 billion sales in IV products
Scenario 3: 3% increase in market share due to PT and LW, $4 billion sales in IV products
Source: McKinsey & Company
Goals of the Global Center of Advanced Mobility
7
• Build on Michigan’s strong position in the
automotive industry
• Ensure Michigan’s automotive and mobility R&D
remains a top three region for global R&D
spending and employment
• Attract and catalyze growth in new/growing areas
of the industry:
– Advanced powertrain and fuels
– Advanced materials and forming
– Interactive, smart, connected transportation
Infrastructure, supply chain, financial capital, business environment,
human capital, and local demand need to support the development
of a Center of Excellence
8
Companies
and research
institutes
Financial
capital
Availability
of public and
private funding
Business
environ-
ment
Efficiency and
effectiveness
of business
processes and
networks
Human
capital
Availability
of talent and
social aspect
of talent
Local
demandSize and type
of local demand
Infra-
structure
Availability and
quality of
transportation,
communication and
utility infrastructure
Supply
chain
Availability of
suppliers and
raw materials
SOURCE: Building Innovation Clusters (McKinsey, 2012)
Contents
9
• Vision for future
• Competitive assessment
• Recommended actions
Smart and connected transportation
Global growth of fitment rate of software could enable revenues
from embedded systems to top $12 Billion by 2025
10
0
20
40
60
80
100
120
140
Global revenues from
embedded systems
USD Billions
12
9
6
3
0
Global fitment rate of
embedded systems
Percent
+24% p.a.
202520202010 2015
1 Linearly interpolated using 2020 and 2030 forecasts
Lightweight material used in automotive sector
Average pounds
Lightweighting1
Aluminum, polymer and other lightweight materials will
substitute mild steel as lightweighting continues to progress in
the automotive industry
11
1 Linearly interpolated using 2020 and 2030 forecasts
0
1,000
2,000
3,000
4,000
5,000
2010 2025
Pounds
Other Mild Steel Advanced HSS Aluminum Polymers
3,835
3,427
>55 sq ft
202520202015
65
60
55
50
45
40
35
30
25
5
0
<40 sq ft
Mileage required by CAFE regulation
Advanced powertrain
Advanced powertrain will play a pivotal role in ensuring the
automotive industry can achieve Phase 2 of CAFE regulations
12
Vehicle
footprint
Phase I Phase II
2010
Weighted
average
54.5 mpg
27.3 mpg
35.5 mpg
mpg
1 Linearly interpolated using 2020 and 2030 forecasts
A concentration of smart
and connected test beds
and pilot deployments
Global connected vehicle
project density
Number of connected
vehicle projects
Michigan has many assets to support the advancement of
powertrain, lightweight, and smart/connected
transportation technologies
13
SOURCE: CAR, NSF, U.S. Department of Labor/BLS
A top state for
engineering employment
Concentration of U.S.
auto R&D spending
$0
$2
$4
$6
$8
$10
$12
$14
$16
$18
$20
1999
2000
2001
2002
2003
2004
2005
2006
2007
2008*
2009*
MI U.S.
MI
CA
European
Union
Japan
18.3
20.2
23.4
24.4
24.8
27.2
28.2
41.2
59.8
61.7
0 20 40 60 80
Top engineering employment
states, 2011
Electrical, industrial, and
mechanical engineering
employment in thousands
U.S. and Michigan auto
R&D spending
Billions of dollars
Number of
Connected
Vehicle Projects
0
1
2-3
4-9
10-16
More than 16
CA
MI
TX
PA
OH
NY
IL
FL
MA
VA
Revealed preferences: Global automakers choose Michigan,
California, Germany, China, and Japan for advanced automotive
R&D, product development, design, and testing facilities
Michigan hosts R&D, product development, design, and testing facilities for global
automakers from every region
14
Legend
1 Facility
3 Facilities
6 Facilities
12 Facilities
R&D
PDC
Testing
Design
SOURCE: Center for Automotive Research
Summary: CAR’s 10-Year mobility technology projections
15
• Highly fragmented company
strategies- no one path forward
across or within automakers
• Faster product replacement
cadence- 5 year cycles vs. 10-15
years
• Continuing tension between
government mandates and
consumer demands
• Major technology trends:
– Downsized ICE-a global trend
– Increased diesel penetration-
8-10% in N.A. by 2018
– Higher speed (6+)
transmissions dominate- 75%
N.A. sales, 95% N.A.
production by 2018
– Battery technologies
(EV/HEV/PHEV/motor
assist/stop-start) grow, but
penetration remains low in
North America
Powertrain
• Evolving toward a more optimized
multi-material vehicle
• Vehicles will be 20% lighter by
2020, 30% by 2025, with most
weight reduction in body, chassis,
and suspension
• Use of conventional steel to fall, as
high-strength steel, polymers/
composites, magnesium, and
aluminum composition grows
• Aluminum forming and fabrication
technologies are key- as aluminum
projected to grow 60% by 2020
(primarily castings and
sheet/rolled aluminum)
Lightweighting
• Vehicles are evolving toward
greater connectivity and
automation for safety and driver
convenience
• North American market will see
heavy penetration of
– V2X Connectivity
– Active Safety
– Advanced Driver Assistance
Systems (ADAS)
– Autonomous and semi-
autonomous driving
Smart/connected transportation
Smart/connected interfaces remain to be defined and
present a major opportunity for Michigan
1 With the exception of car-to-car, which in some use cases require bilateral connections to avoid latency
Type of communication Major disruptive forces Some current players
Car-to-OEM2 ▪ Data that is then sent to OEM
▪ Push vehicle improvements
Car-to-system3 ▪ Automated vehicles
▪ Leverage users on road
Car-to-user1 ▪ Streaming content
▪ Gesture based controls
Car-to-3rd party4 ▪ Track private vehicles
▪ Content or advertising
▪ Past behavior
NOT EXHAUSTIVE
SOURCE: McKinsey & Company
16
Multiple opportunities for value creation in service and
application offerings need to be evaluated
Type of
communication
Office &
Business
Mobility
chainInfotainmentSafetyNavigation ComfortPayment
Maintenance
& Service
Applications
Car-to-user
Car-to-OEM
Car-to-system
Car-to-3rd party
1
2
3
4
NOT EXHAUSTIVE
value creation opportunities
SOURCE: McKinsey & Company
17
 



   

     
   
Quantitative and qualitative metrics have been used to evaluate
hubs’ competitiveness
18
Advanced Powertrain ranking criteria- example
Human
Capital
• Number of patents in propulsion technologies
• Technology legacy of the area
• Number of the mechanical/electrical/material engineers graduating
from top engineering schools in the area
• Quality of universities
• Quality of life of the area
• Immigration law as proxy of ability to attract talent
• Willingness of talent to work in the automotive industry
Business
environment
• Number of OEMs/suppliers in the area
• Historical level of collaboration
• Amount of corporate R&D funds available in the area
• Amount of public funding deployed in R&D in the areaFinancial capital
Key enablers Key metrics
Local demand
• Sales volume that can be impacted leveraging the research
• Focus on fuel efficiency from the OEM headquartered in the area driven
by regulations
• Focus on performance from the OEM headquartered in the area driven
by customer demand
Infrastructure • Infrastructure is less relevant for powertrain research
Powertrain Lightweighting Smart/connected transportation
Financial
capital
Human
capital
Business
environ-
ment
Infra-
structure
Local
demand
Global benchmarking research: Five leading regions on each of
the Center of Excellence measures (numbers represent region’s
individual index score vs. SE Michigan score)
19
56
72
N/A
N/A
69
90
59
94
77
80 73
41
N/A
N/A
96
96
60
67
53
84
56
73
N/A
N/A
81
90
57
94
80
82Tokyo, JP
SE Michigan
Bavaria, DE
SE Michigan
Tokyo, JP
SE Michigan
Aichi, JP
SE Michigan
Tokyo, JP
SE Michigan
Bavaria, DE
SE Michigan
Tokyo, JP
SE Michigan
Wolfsburg, DE
SE Michigan
Silicon Valley
SE Michigan
Silicon Valley
SE Michigan
Silicon Valley
SE Michigan
SE Michigan
Silicon Valley
SOURCE: McKinsey team analysis ranking various measures of financial capital, human capital, business environment, Infrastructure, and local demand
Summary of Michigan’s position in global benchmarking
20
• The large R&D spend of $15B by the
Detroit 3 and leading auto suppliers in
2011 ensures access to funding for
technology development, but Tokyo has
greater access to public funding
• Bavaria dominates the ranking for
human capital, due to the high
attractiveness of the auto industry/
region and large talent pool, (i.e., In
powertrain 1,200 graduates annually vs.
Michigan’s 500, and in lightweighting
technologies 950 graduates vs.
Michigan’s 550
• Strong collaboration between players
favors Tokyo region in business
environment
• Tighter regulation and focus on
performance favors local demand from
Europe and Japan
Powertrain and Lightweighting
• Lower levels of VC funding puts
Southeast Michigan at a disadvantage
vis-à-vis California in financial capital.
Michigan had on average $140M annual
VC funding vs. to Silicon Valley’s $6B
• Silicon Valley and Bavaria dominate the
ranking for human capital, driven by
educational systems focused on high
tech (2 of top 5 high tech universities in
SV; UM ranks 20th, MSU ranks 94th) and
high attractiveness of the regions
(Bavaria ranked #4 in terms of best
quality of life, SV #29 and SE Michigan
#71)
• A collaborative and innovative culture
favors Silicon Valley in business
environment
• Michigan leads in federal test bed
investments
Smart/connected transportation
Contents
21
• Vision for future
• Competitive assessment
• Recommended actions
There are six categories of action to guide future growth in
industry investment and employment
22
Leadership
1
Marketing and
Branding
2
Talent
development
3
Strategic
convening
4
Collaboration
network
5
Capital
strategies
6
Leadership1
Deliverables and measures
Deliverables
• State/MEDC Director position filled
• State interagency group formed
• Private-Public mobility leadership group
formed by private sector to ensure
continuity of effort
Measure of success
• Funding and resources allocated
• Increased mobility industry investment
• Mobility employment growth
Description
Aspiration
• Michigan’s leaders prioritize
economic development in
mobility sector
• Michigan’s public policies
focused on attracting,
retaining, and growing
mobility sector firms
• Michigan’s public and private
sectors work together to
implement Global Center of
Advanced Mobility agenda
23
Marketing and branding2
Deliverables and measures
Deliverables
• Campaign developed and launched
• Partnerships formed to support
marketing and branding messaging
Measure of success
• Funding and resources allocated
• Increased VC and PE funds in state
• Increased mobility industry investment
• Mobility employment growth
Description
Aspiration
• Michigan’s mobility industry is
viewed positively
– Within the industry
– Outside the state
– Internationally
• Positive image supports economic
and talent development initiatives
• Increase global talent flow
to Michigan
24
Talent development3
Deliverables and measures
Deliverables
• Critical career needs identified
• Mechanisms for industry-academia
collaboration established
• Marketing/branding talent messages
developed and launched
Measure of success
• Students increase consideration of
mobility careers
• Increased enrollment in mobility
career programs
• Fill firms’ talent pipelines
Description
Aspiration
• Universities, colleges, trade
schools more closely aligned
with mobility industry needs
• Students aspire to careers in
Michigan’s mobility industry
• Create talent attraction pipeline
from other U.S. and global
universities to Michigan
mobility firms
25
Strategic convening4
Deliverables and measures
Deliverables
• Prioritized list of mobility event targets;
proposal for 1-2 new events
• Develop and scale MEDC Business
Connect to integrate with convening
opportunities
Measure of success
• Increased visibility of Michigan’s
mobility industries
• Attract, develop, or expand a future
global mobility conference or event
• Increase mobility industry investment
Description
Aspiration
• Leverage existing and new
mobility industry events to
feed economic and business
development in Michigan
26
Collaboration network5
Deliverables and measures
Deliverables
• Detailed plan to develop and
expand mobility industry collaboration
network(s)
• Proposals to secure
necessary funding
Measure of success
• Increased number of firms participating
in collaboration activities
• Higher number of lower-tier suppliers
deploying advanced technologies
Description
Aspiration
• Develop a focused collaboration,
research, development, and
testing network to promote
the advancement of new
technologies, processes,
and products in advanced
powertrain, lightweighting, and
smart/connected transportation
• State of Michigan should explore
competitive financial support
models to attract future R&D
investments, in light of global
competitive context.
27
Capital strategies6
Deliverables and measures
Deliverables
• Favorable investment framework
• List of VC experts with ties
to Michigan
Measure of success
• Amount of additional investment $
attracted to Michigan in addition to the
status quo
• Number of local startups
receiving support
• Number on experts who
relocate to Michigan
Description
Aspiration
• Support development of
additional sources of financial
capital, including attracting
venture capital, attracting
private investment, and
supporting innovative
business arrangements
to attract new funds
28
Proposed approach and timeline
29
0 1 2 3 4 5 6 7 8 9 10 11 12 13 14 15 16 17 18 19 20 21 22 23 24Month
Leader-
ship
1
Marketing
& Branding
2
Talent
Develop-
ment
3
Strategic
Convening
4
Collabo-
ration
Network
5
Capital
Strategies
6

Michigan as the Global Center of Advanced Mobility - vision for future, competitive assessment, and recommended actions

  • 1.
    Global Center ofAdvanced Mobility – Vision for future, competitive assessment, and recommended actions Brief summary document December 12, 2013
  • 2.
    1 This report wasdeveloped with a coalition of top industry experts, the Center for Automotive Research and McKinsey & Company. It outlines a strategy to position Michigan for long-term growth in the auto sector as it continues to transition to an increasingly advanced technology-based sector. It was produced with support from Business Leaders for Michigan and the Michigan Economic Development Corporation.
  • 3.
    Executive summary 2 • Michigancan develop into the center of excellence for the major technologies in the automotive landscape, including advanced powertrain, lightweight, and smart/connected transportation • Michigan is fairly well positioned to compete in powertrain and lightweighting technologies but faces strong challenges from other competitive hubs in smart/connected transportation: – Strengths of the region include ▫ Strong capital availability driven by access to public funding and corporate automotive R&D spending ▫ Global uniqueness of Michigan’s concentration and size of OEMs/suppliers – Areas that need to be addressed to ensure future relevance include ▫ Development of talent pipeline due to demographics and technology changes in the automotive industry ▫ Continued growth of innovation mentality and increased availability of VC funds ▫ Deeper collaboration across the supply chain • Six categories of actions need to guide BLM’s path forward: – Leadership – Marketing & branding – Strategic convening – Talent development – Collaboration network – Capital attraction
  • 4.
    The BLM GlobalCenter of Advanced Mobility strategy was developed by: BLM, industry experts, McKinsey and CAR 3 Business Leaders for Michigan BLM members include: • David Dauch, AAM • Bill Ford, Ford Motor Company • Timothy D. Leuliette, Visteon • Tim Manganello, BorgWarner • Roger Penske, Penske Corporation • Stephen Polk, Polk • Doug Rothwell, Business Leaders for Michigan • Matt Simoncini, Lear Steering Committee of Industry Experts • Mark Barrett, AAM • Nigel J. Francis, MEDC • Scott Gallett, BorgWarner • Mike Gingell, Polk • Brian Mackowiak, Penske Logistics • Ed Lowenfeld, Lear • Randal Visintainer, Ford Motor Company • Tim Yeardon, Visteon CAR/McKinsey Working Group CAR • Jay Baron • Sean McAlinden • Kristin Dziczek • Richard Wallace McKinsey & Company • Hans-Werner Kaas • Russell Hensley • Douglas Mehl • Paolo Sandrone • Adeline Dougherty • Mahi Rayasam • Abby Holaschutz
  • 5.
    Contents 4 • Vision forfuture • Competitive assessment • Recommended actions
  • 6.
    Michigan growth strategyrelies on six pillars, with Advanced Mobility being an important one 5 SOURCE: Business Leaders for Michigan – Michigan Turnaround Plan 2012
  • 7.
    Number of jobscreated for Michigan economy, Thousand Scenario 1 Scenario 2 41 9 32 30 7 235 1 4 5 1 4 Scenario 3 Total JobsDirect Job creationIndirect Jobs Investments in three mobility technologies have a potential of creating up to 75–100 thousand jobs for the Michigan economy 6 Scenario 1: 0% increase in market share, $2 billion sales in IV products 15 2 13 75 15 61 45 11 3415 2 13 21 3 18 Lightweight 21 3 18 Total 101 20 81 Smart/Connected Transportation 59 14 45 Powertrain Scenario 2: 2% increase in market share due to PT and LW, $3 billion sales in IV products Scenario 3: 3% increase in market share due to PT and LW, $4 billion sales in IV products Source: McKinsey & Company
  • 8.
    Goals of theGlobal Center of Advanced Mobility 7 • Build on Michigan’s strong position in the automotive industry • Ensure Michigan’s automotive and mobility R&D remains a top three region for global R&D spending and employment • Attract and catalyze growth in new/growing areas of the industry: – Advanced powertrain and fuels – Advanced materials and forming – Interactive, smart, connected transportation
  • 9.
    Infrastructure, supply chain,financial capital, business environment, human capital, and local demand need to support the development of a Center of Excellence 8 Companies and research institutes Financial capital Availability of public and private funding Business environ- ment Efficiency and effectiveness of business processes and networks Human capital Availability of talent and social aspect of talent Local demandSize and type of local demand Infra- structure Availability and quality of transportation, communication and utility infrastructure Supply chain Availability of suppliers and raw materials SOURCE: Building Innovation Clusters (McKinsey, 2012)
  • 10.
    Contents 9 • Vision forfuture • Competitive assessment • Recommended actions
  • 11.
    Smart and connectedtransportation Global growth of fitment rate of software could enable revenues from embedded systems to top $12 Billion by 2025 10 0 20 40 60 80 100 120 140 Global revenues from embedded systems USD Billions 12 9 6 3 0 Global fitment rate of embedded systems Percent +24% p.a. 202520202010 2015 1 Linearly interpolated using 2020 and 2030 forecasts
  • 12.
    Lightweight material usedin automotive sector Average pounds Lightweighting1 Aluminum, polymer and other lightweight materials will substitute mild steel as lightweighting continues to progress in the automotive industry 11 1 Linearly interpolated using 2020 and 2030 forecasts 0 1,000 2,000 3,000 4,000 5,000 2010 2025 Pounds Other Mild Steel Advanced HSS Aluminum Polymers 3,835 3,427
  • 13.
    >55 sq ft 202520202015 65 60 55 50 45 40 35 30 25 5 0 <40sq ft Mileage required by CAFE regulation Advanced powertrain Advanced powertrain will play a pivotal role in ensuring the automotive industry can achieve Phase 2 of CAFE regulations 12 Vehicle footprint Phase I Phase II 2010 Weighted average 54.5 mpg 27.3 mpg 35.5 mpg mpg 1 Linearly interpolated using 2020 and 2030 forecasts
  • 14.
    A concentration ofsmart and connected test beds and pilot deployments Global connected vehicle project density Number of connected vehicle projects Michigan has many assets to support the advancement of powertrain, lightweight, and smart/connected transportation technologies 13 SOURCE: CAR, NSF, U.S. Department of Labor/BLS A top state for engineering employment Concentration of U.S. auto R&D spending $0 $2 $4 $6 $8 $10 $12 $14 $16 $18 $20 1999 2000 2001 2002 2003 2004 2005 2006 2007 2008* 2009* MI U.S. MI CA European Union Japan 18.3 20.2 23.4 24.4 24.8 27.2 28.2 41.2 59.8 61.7 0 20 40 60 80 Top engineering employment states, 2011 Electrical, industrial, and mechanical engineering employment in thousands U.S. and Michigan auto R&D spending Billions of dollars Number of Connected Vehicle Projects 0 1 2-3 4-9 10-16 More than 16 CA MI TX PA OH NY IL FL MA VA
  • 15.
    Revealed preferences: Globalautomakers choose Michigan, California, Germany, China, and Japan for advanced automotive R&D, product development, design, and testing facilities Michigan hosts R&D, product development, design, and testing facilities for global automakers from every region 14 Legend 1 Facility 3 Facilities 6 Facilities 12 Facilities R&D PDC Testing Design SOURCE: Center for Automotive Research
  • 16.
    Summary: CAR’s 10-Yearmobility technology projections 15 • Highly fragmented company strategies- no one path forward across or within automakers • Faster product replacement cadence- 5 year cycles vs. 10-15 years • Continuing tension between government mandates and consumer demands • Major technology trends: – Downsized ICE-a global trend – Increased diesel penetration- 8-10% in N.A. by 2018 – Higher speed (6+) transmissions dominate- 75% N.A. sales, 95% N.A. production by 2018 – Battery technologies (EV/HEV/PHEV/motor assist/stop-start) grow, but penetration remains low in North America Powertrain • Evolving toward a more optimized multi-material vehicle • Vehicles will be 20% lighter by 2020, 30% by 2025, with most weight reduction in body, chassis, and suspension • Use of conventional steel to fall, as high-strength steel, polymers/ composites, magnesium, and aluminum composition grows • Aluminum forming and fabrication technologies are key- as aluminum projected to grow 60% by 2020 (primarily castings and sheet/rolled aluminum) Lightweighting • Vehicles are evolving toward greater connectivity and automation for safety and driver convenience • North American market will see heavy penetration of – V2X Connectivity – Active Safety – Advanced Driver Assistance Systems (ADAS) – Autonomous and semi- autonomous driving Smart/connected transportation
  • 17.
    Smart/connected interfaces remainto be defined and present a major opportunity for Michigan 1 With the exception of car-to-car, which in some use cases require bilateral connections to avoid latency Type of communication Major disruptive forces Some current players Car-to-OEM2 ▪ Data that is then sent to OEM ▪ Push vehicle improvements Car-to-system3 ▪ Automated vehicles ▪ Leverage users on road Car-to-user1 ▪ Streaming content ▪ Gesture based controls Car-to-3rd party4 ▪ Track private vehicles ▪ Content or advertising ▪ Past behavior NOT EXHAUSTIVE SOURCE: McKinsey & Company 16
  • 18.
    Multiple opportunities forvalue creation in service and application offerings need to be evaluated Type of communication Office & Business Mobility chainInfotainmentSafetyNavigation ComfortPayment Maintenance & Service Applications Car-to-user Car-to-OEM Car-to-system Car-to-3rd party 1 2 3 4 NOT EXHAUSTIVE value creation opportunities SOURCE: McKinsey & Company 17                    
  • 19.
    Quantitative and qualitativemetrics have been used to evaluate hubs’ competitiveness 18 Advanced Powertrain ranking criteria- example Human Capital • Number of patents in propulsion technologies • Technology legacy of the area • Number of the mechanical/electrical/material engineers graduating from top engineering schools in the area • Quality of universities • Quality of life of the area • Immigration law as proxy of ability to attract talent • Willingness of talent to work in the automotive industry Business environment • Number of OEMs/suppliers in the area • Historical level of collaboration • Amount of corporate R&D funds available in the area • Amount of public funding deployed in R&D in the areaFinancial capital Key enablers Key metrics Local demand • Sales volume that can be impacted leveraging the research • Focus on fuel efficiency from the OEM headquartered in the area driven by regulations • Focus on performance from the OEM headquartered in the area driven by customer demand Infrastructure • Infrastructure is less relevant for powertrain research
  • 20.
    Powertrain Lightweighting Smart/connectedtransportation Financial capital Human capital Business environ- ment Infra- structure Local demand Global benchmarking research: Five leading regions on each of the Center of Excellence measures (numbers represent region’s individual index score vs. SE Michigan score) 19 56 72 N/A N/A 69 90 59 94 77 80 73 41 N/A N/A 96 96 60 67 53 84 56 73 N/A N/A 81 90 57 94 80 82Tokyo, JP SE Michigan Bavaria, DE SE Michigan Tokyo, JP SE Michigan Aichi, JP SE Michigan Tokyo, JP SE Michigan Bavaria, DE SE Michigan Tokyo, JP SE Michigan Wolfsburg, DE SE Michigan Silicon Valley SE Michigan Silicon Valley SE Michigan Silicon Valley SE Michigan SE Michigan Silicon Valley SOURCE: McKinsey team analysis ranking various measures of financial capital, human capital, business environment, Infrastructure, and local demand
  • 21.
    Summary of Michigan’sposition in global benchmarking 20 • The large R&D spend of $15B by the Detroit 3 and leading auto suppliers in 2011 ensures access to funding for technology development, but Tokyo has greater access to public funding • Bavaria dominates the ranking for human capital, due to the high attractiveness of the auto industry/ region and large talent pool, (i.e., In powertrain 1,200 graduates annually vs. Michigan’s 500, and in lightweighting technologies 950 graduates vs. Michigan’s 550 • Strong collaboration between players favors Tokyo region in business environment • Tighter regulation and focus on performance favors local demand from Europe and Japan Powertrain and Lightweighting • Lower levels of VC funding puts Southeast Michigan at a disadvantage vis-à-vis California in financial capital. Michigan had on average $140M annual VC funding vs. to Silicon Valley’s $6B • Silicon Valley and Bavaria dominate the ranking for human capital, driven by educational systems focused on high tech (2 of top 5 high tech universities in SV; UM ranks 20th, MSU ranks 94th) and high attractiveness of the regions (Bavaria ranked #4 in terms of best quality of life, SV #29 and SE Michigan #71) • A collaborative and innovative culture favors Silicon Valley in business environment • Michigan leads in federal test bed investments Smart/connected transportation
  • 22.
    Contents 21 • Vision forfuture • Competitive assessment • Recommended actions
  • 23.
    There are sixcategories of action to guide future growth in industry investment and employment 22 Leadership 1 Marketing and Branding 2 Talent development 3 Strategic convening 4 Collaboration network 5 Capital strategies 6
  • 24.
    Leadership1 Deliverables and measures Deliverables •State/MEDC Director position filled • State interagency group formed • Private-Public mobility leadership group formed by private sector to ensure continuity of effort Measure of success • Funding and resources allocated • Increased mobility industry investment • Mobility employment growth Description Aspiration • Michigan’s leaders prioritize economic development in mobility sector • Michigan’s public policies focused on attracting, retaining, and growing mobility sector firms • Michigan’s public and private sectors work together to implement Global Center of Advanced Mobility agenda 23
  • 25.
    Marketing and branding2 Deliverablesand measures Deliverables • Campaign developed and launched • Partnerships formed to support marketing and branding messaging Measure of success • Funding and resources allocated • Increased VC and PE funds in state • Increased mobility industry investment • Mobility employment growth Description Aspiration • Michigan’s mobility industry is viewed positively – Within the industry – Outside the state – Internationally • Positive image supports economic and talent development initiatives • Increase global talent flow to Michigan 24
  • 26.
    Talent development3 Deliverables andmeasures Deliverables • Critical career needs identified • Mechanisms for industry-academia collaboration established • Marketing/branding talent messages developed and launched Measure of success • Students increase consideration of mobility careers • Increased enrollment in mobility career programs • Fill firms’ talent pipelines Description Aspiration • Universities, colleges, trade schools more closely aligned with mobility industry needs • Students aspire to careers in Michigan’s mobility industry • Create talent attraction pipeline from other U.S. and global universities to Michigan mobility firms 25
  • 27.
    Strategic convening4 Deliverables andmeasures Deliverables • Prioritized list of mobility event targets; proposal for 1-2 new events • Develop and scale MEDC Business Connect to integrate with convening opportunities Measure of success • Increased visibility of Michigan’s mobility industries • Attract, develop, or expand a future global mobility conference or event • Increase mobility industry investment Description Aspiration • Leverage existing and new mobility industry events to feed economic and business development in Michigan 26
  • 28.
    Collaboration network5 Deliverables andmeasures Deliverables • Detailed plan to develop and expand mobility industry collaboration network(s) • Proposals to secure necessary funding Measure of success • Increased number of firms participating in collaboration activities • Higher number of lower-tier suppliers deploying advanced technologies Description Aspiration • Develop a focused collaboration, research, development, and testing network to promote the advancement of new technologies, processes, and products in advanced powertrain, lightweighting, and smart/connected transportation • State of Michigan should explore competitive financial support models to attract future R&D investments, in light of global competitive context. 27
  • 29.
    Capital strategies6 Deliverables andmeasures Deliverables • Favorable investment framework • List of VC experts with ties to Michigan Measure of success • Amount of additional investment $ attracted to Michigan in addition to the status quo • Number of local startups receiving support • Number on experts who relocate to Michigan Description Aspiration • Support development of additional sources of financial capital, including attracting venture capital, attracting private investment, and supporting innovative business arrangements to attract new funds 28
  • 30.
    Proposed approach andtimeline 29 0 1 2 3 4 5 6 7 8 9 10 11 12 13 14 15 16 17 18 19 20 21 22 23 24Month Leader- ship 1 Marketing & Branding 2 Talent Develop- ment 3 Strategic Convening 4 Collabo- ration Network 5 Capital Strategies 6