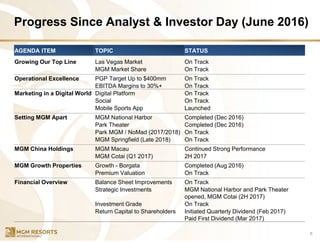
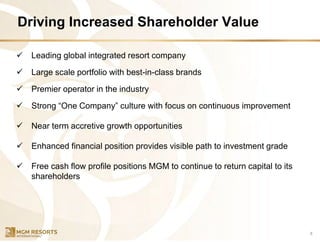
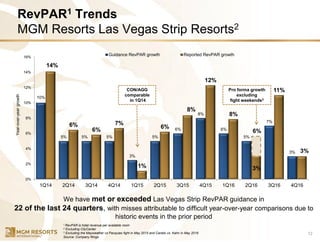
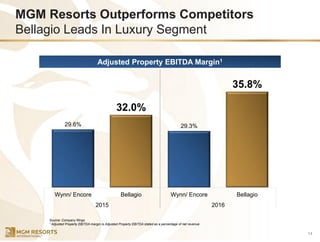
SlideShare a Scribd company logo
1 of 47
Download to read offline
MGM Resorts International
INVESTOR PRESENTATION
March 2017
1
Forward-Looking Statements
Statements in this presentation that are not historical facts are forward-looking statements, within the meaning of the Private Securities Litigation Reform Act of
1995 and involve risks and/or uncertainties, including those described in the Company's public filings with the Securities and Exchange Commission. The Company
has based forward-looking statements on management’s current expectations and assumptions and not on historical facts. Examples of these statements include,
but are not limited to, the Company’s expectations regarding future results (including RevPAR and other guidance), the payment of any future cash dividends on the
Company’s common stock and dividends and distributions we expect to receive from MGM China, The MGM Growth Properties Operating Partnership or
CityCenter, its ability to generate future cash flow growth and to execute on future development and other projects, amounts the Company expects to spend capital
expenditures, and the Company’s ability to execute its strategic initiatives, improve its financial flexibility (including its balance sheet) and continue to execute on
operational improvements. These forward-looking statements involve a number of risks and uncertainties. Among the important factors that could cause actual
results to differ materially from those indicated in such forward-looking statements include effects of economic conditions and market conditions in the markets in
which the Company operates and competition with other destination travel locations throughout the United States and the world, the design, timing and costs of
expansion projects, risks relating to international operations, permits, licenses, financings, approvals and other contingencies in connection with growth in new or
existing jurisdictions and additional risks and uncertainties described in the Company’s Form 10-K, Form 10-Q and Form 8-K reports (including all amendments to
those reports). In providing forward-looking statements, the Company is not undertaking any duty or obligation to update these statements publicly as a result of
new information, future events or otherwise, except as required by law. If the Company updates one or more forward-looking statements, no inference should be
drawn that it will make additional updates with respect to those other forward-looking statements.
Market and Industry Data
This presentation also contains estimates and information concerning the Company’s industry and peers, including market position and fair share information, that
are based on industry publications, reports and peer company public filings. This information involves a number of assumptions and limitations, and you are
cautioned not to rely on or give undue weight to this information. The Company has not independently verified the accuracy or completeness of the data contained
in these industry publications, reports or filings. The industry in which we operate is subject to a high degree of uncertainty and risk due to variety of factors,
including those described in the “Risk Factors” section of the Company’s public filings with the SEC.
Note Regarding Presentation of Non-GAAP Financial Measures
The following presentation includes certain “non-GAAP financial measures” as defined in Regulation G under the Securities Exchange Act of 1934, as amended.
Schedules that reconcile the non-GAAP financial measures to the most directly comparable financial measures calculated and presented in accordance with
Generally Accepted Accounting Principles in the United States are included in our earnings releases that have been furnished with the SEC and are available on
our website at www.mgmresorts.com.
Company Overview
2
✓ Extensively vetted and globally diversified across all high-quality gaming jurisdictions
✓ Operates some of the best known international luxury properties in the gaming and lodging
industry including Bellagio, MGM Grand Las Vegas, ARIA Resort & Casino, Mandalay Bay,
Borgata, MGM National Harbor and MGM Macau
✓ Experienced management team and Board of Directors with extensive industry background
✓ Dominant leader in food & beverage and conventions & corporate meetings
▪ Over 400 owned & leased outlets
▪ Over 3 million square feet of convention space
▪ World-class entertainment featuring a wide array of venues & shows
▪ 21 live entertainment venues, including T-Mobile Arena and Cirque du Soleil
✓ Embarking on new growth opportunities worldwide
▪ MGM Springfield
▪ MGM Cotai
▪ MGM Hospitality
✓ Fortune 500 company with 77,000 employees and ~$30bn enterprise value
✓ Consolidated Net Revenue1 of $9.5bn and Adjusted EBITDA1 of $2.8bn
Leading Global Gaming & Hospitality Company with Highly Valuable Portfolio
1 As of 12/31/16
MGM Resorts Organization Structure
3
MGM Resorts
(Stock Exchange: NYSE / Ticker: MGM)
Owned & Leased
Resorts & Other
(100%)
MGM China
Holdings Limited
(56%)
CityCenter
Holdings
(50%)
Las Vegas Arena
Company
(42.5%)
Diaoyutai MGM
Hospitality
(49%)
Public Shareholders
MGM Growth
Properties REIT
(76%)
Owned
Bellagio, MGM Grand LV,
Circus Circus LV, MGM
National Harbor, Shadow
Creek, Fallen Oak
Leased1
Mandalay Bay, Mirage,
Luxor, Excalibur, New York-
New York, Monte Carlo, The
Park, MGM Grand Detroit,
Beau Rivage, Gold Strike
Tunica, Borgata
Development
MGM Springfield
(Opening Late 2018)
Publicly Traded REIT(1)
Stock Exchange: NYSE
Ticker: MGP
Stock Exchange: HKSE
Ticker: 2282 HK
Properties:
MGM Macau
Development
MGM Cotai
(Opening 2H 2017)
Properties:
ARIA
Vdara
Mandarin Oriental
Properties:
T-Mobile Arena
MGM Grand Garden (Lease)
Elgin Riverboat
Resort
(50%)
1 MGM Growth Properties owns the properties leased by MGM Resorts International
Properties:
MGM Grand Sanya
Diaoyutai Hotel Hangzhou
Diaoyutai Hotel Chengdu
Development
Bellagio Shanghai
(Opening 2017)
Properties:
Grand Victoria
4
Strategic Highlights
Looking Back – A Transformative 3 Years
5
MGM has come a long way since 2014
➢ Significantly improved MGM’s balance sheet
▪ MGP transaction resulted in ~$4bn reduction of debt
▪ Sale of Crystals for $1.1bn provided MGM with $540mm dividend from CityCenter
▪ Converted $1.45bn of convertible notes to equity
▪ Continued MGM China dividends through construction of MGM Cotai
▪ Initiated CityCenter dividends
▪ Multiple Rating Agency upgrades
➢ Operational initiatives
▪ Strategic investment in personnel
▪ Expanded market share through innovative product and media initiatives
▪ Profit Growth Plan – initiated program, upsized target, achieved goals ahead of schedule
▪ Opened MGM National Harbor, T-Mobile Arena and Park Theater
▪ Completed Mandalay Bay Convention Center expansion
➢ Strategic initiatives
▪ MGP transaction
▪ Borgata acquisition with simultaneous sale of real estate to MGP
▪ Sale of non-core assets (Crystals, Circus Circus Reno, Railroad Pass & Gold Strike Jean)
▪ Increased ownership in MGM China from 51% to 56%
Progress Since Analyst & Investor Day (June 2016)
6
AGENDA ITEM TOPIC STATUS
Growing Our Top Line Las Vegas Market On Track
MGM Market Share On Track
Operational Excellence PGP Target Up to $400mm On Track
EBITDA Margins to 30%+ On Track
Marketing in a Digital World Digital Platform On Track
Social On Track
Mobile Sports App Launched
Setting MGM Apart MGM National Harbor Completed (Dec 2016)
Park Theater Completed (Dec 2016)
Park MGM / NoMad (2017/2018) On Track
MGM Springfield (Late 2018) On Track
MGM China Holdings MGM Macau Continued Strong Performance
MGM Cotai (Q1 2017) 2H 2017
MGM Growth Properties Growth - Borgata Completed (Aug 2016)
Premium Valuation On Track
Financial Overview Balance Sheet Improvements On Track
Strategic Investments MGM National Harbor and Park Theater
opened, MGM Cotai (2H 2017)
Investment Grade On Track
Return Capital to Shareholders Initiated Quarterly Dividend (Feb 2017)
Paid First Dividend (Mar 2017)
MGM Ongoing Initiatives
7
➢ Continued Operational Improvements
▪ Focused on growing topline results and continued margin improvement
▪ Las Vegas Strip:
▪ 1QE 2017 RevPAR growth of 7%
▪ Achieved 30% margin in 2016
▪ Strategies in place to grow 2017 margin 50-100bps
▪ Transition from Profit Growth Plan to Continuous Improvement
▪ Disciplined and targeted reinvestment in existing properties
▪ Park MGM/ NoMad
▪ Convention center expansions (Aria, MGM Grand, Bellagio)
➢ Further improvement of Balance Sheet
▪ Accelerating free cash flow story – current development pipeline winding down
▪ Utilize excess free cash flow to pay down debt and return capital to shareholders
▪ Obtain investment grade status
➢ Strategic Initiatives
▪ Potential sale of National Harbor real estate to MGP
▪ MGM Cotai in 2nd half of 2017
▪ MGM Springfield in late 2018
▪ Maximizing future dividends from Joint Ventures
▪ Continue to utilize MGP as a platform for growth
▪ Selectively pursue new jurisdiction opportunities (Japan)
Driving Increased Shareholder Value
8
✓ Leading global integrated resort company
✓ Large scale portfolio with best-in-class brands
✓ Premier operator in the industry
✓ Strong “One Company” culture with focus on continuous improvement
✓ Near term accretive growth opportunities
✓ Enhanced financial position provides visible path to investment grade
✓ Free cash flow profile positions MGM to continue to return capital to its
shareholders
9
Operating Highlights
10
MGM Is Well Diversified
54%
19%
27%
Macau
U.S. Regionals
1 Excludes Management & Other Operations and Other Nevada
2 Includes 12/31/16 reported Net Revenue plus an annualization adjustment for Borgata and MGM National Harbor for the year ended December 31, 2016
Pro forma FY 2016 2
Las Vegas
62%
26%
12%
Macau
U.S. Regionals
FY 2015
Las Vegas
Net Revenue Mix1
44%
27%
15%
7%
7%
11
MGM Is Well Positioned In Las Vegas
Source: Company filings
(1) Includes 100% of CityCenter
(2) Excludes Las Vegas Convention Center
(3) As of May 2016
NO. OF ROOMS
49%
25%
12%
9%
6%
NO. OF TABLES + SLOTS
CONVENTION SPACE(2)
2016 Las Vegas Strip
48%
12%
4%
32%
4%
44%
ARENA, THEATER & SHOWROOM(3)
MGM1
MGM1
MGM1 MGM1
10%
5% 5% 5%
3%
5%
6%
8%
6%
5%
7%
3%
14%
6%
6%
7%
1%
6%
8%
12%
8%
3%
11%
3%
0%
2%
4%
6%
8%
10%
12%
14%
16%
1Q14 2Q14 3Q14 4Q14 1Q15 2Q15 3Q15 4Q15 1Q16 2Q16 3Q16 4Q16
Guidance RevPAR growth Reported RevPAR growth
6%
We have met or exceeded Las Vegas Strip RevPAR guidance in
22 of the last 24 quarters, with misses attributable to difficult year-over-year comparisons due to
historic events in the prior period
12
CON/AGG
comparable
in 1Q14
Year-over-yeargrowth
1 RevPAR is hotel revenue per available room
2 Excluding CityCenter
3 Excluding the Mayweather vs Pacquiao fight in May 2015 and Canelo vs. Kahn in May 2016
Source: Company filings
Pro forma growth
excluding
fight weekends3
RevPAR1 Trends
MGM Resorts Las Vegas Strip Resorts2
13
MGM Has Meaningfully Improved Margins
1 Excludes Borgata which was acquired on August 1, 2016, MGM National Harbor which opened December 8, 2016, and Other Nevada Resorts (Circus Circus Reno, Railroad Pass
and Gold Strike Jean) which were sold in 2015
2 Excludes CityCenter resort operations
Las Vegas Wholly Owned Margin2Same Store Domestic Margin1
24%
26%
30%
22%
23%
24%
25%
26%
27%
28%
29%
30%
31%
32%
2014 2015 2016
24%
26%
30%
22%
23%
24%
25%
26%
27%
28%
29%
30%
31%
32%
2014 2015 2016
MGM Resorts Outperforms Competitors
Bellagio Leads In Luxury Segment
29.6%
32.0%
29.3%
35.8%
Wynn/ Encore Bellagio Wynn/ Encore Bellagio
2015 2016
Source: Company filings
1 Adjusted Property EBITDA margin is Adjusted Property EBITDA stated as a percentage of net revenue
14
Adjusted Property EBITDA Margin1
MGM Resorts Outperforms Competitors
Mandalay Bay Leads In Convention Segment
15
Adjusted Property EBITDA Margin1
20.3%
22.5%
23.1%
25.2%
Venetian/ Palazzo Mandalay Bay Venetian/ Palazzo Mandalay Bay
2015 2016
Source: Company filings
1 Adjusted Property EBITDA margin is Adjusted Property EBITDA stated as a percentage of net revenue
16
Return On Invested Capital
Case Studies
Successful Track Record Of Return On Invested Capital
17
➢ CityCenter
▪ MGM invested ~$2.2bn in CityCenter
o $1.1bn monetization of Crystals at extremely attractive cap rate (~4%)
− Provided opportunity to repay $260mm in debt & reduced leverage to < 4x
o MGM’s dividends to date: $865mm1
▪ Resulting in MGM’s Net investment in CityCenter of ~$1.38bn1 today
➢ MGM China
▪ MGM initial investment in MGM China was $341mm prior to its recent 4.95% purchase
o Distributions and dividends to date of $1.4bn are approximately 4x above initial
investment
o MGM’s current ownership of 56% equals $4.3bn2 of value
➢ MGM Detroit
▪ MGM invested $800mm
o Stabilized Adjusted Property EBITDA of ~$160mm3
➢ T-Mobile Arena
▪ MGM invested ~$73mm and owns 42.5% of the $375mm venue
o Top 3 grossing arena in its category in 2016 (only 9 months of operations)
o Benefits nearby MGM properties and several ancillary revenue streams
1 Includes announced dividend of $250 million on March 24, 2017 (of which $125 million represents MGM Resorts’ 50% share)
2 Assumes HKD / USD exchange rate of 7.75 based on closing price of $15.70 on 3/24/17
3 Reflects trailing two year average
CityCenter Case Study
Return on Invested Capital
18
MGM’s investment in CityCenter is far below investor perception
➢ In 2007, MGM de-risked investment by selling 50% of CityCenter
➢ MGM invested ~$2.2bn in CityCenter
▪ $1.1bn monetization of Crystals at extremely attractive cap rate (~4%)
o Provided opportunity to repay $260mm in debt
o Reduced leverage to < 4x
▪ MGM’s dividends to date: $865mm1
➢ Resulting in MGM’s net investment in CityCenter of ~$1.38bn1
➢ Today, CityCenter is well capitalized, generating strong returns and positioned to
continue returning capital to MGM in excess of cumulative earnings
1 Includes announced dividend of $250 million on March 24, 2017 (of which $125 million represents MGM Resorts’ 50% share)
Is CityCenter Misvalued?
19
1 While the Company is referencing publicly available reports prepared by securities analysts, the Company is not endorsing or adopting the views or analysis of, or methodologies
employed by, those analysts with respect to whether the valuation multiples utilized by those securities analysts is either the correct methodology or the correct multiple; rather, the
Company is solely noting that if such analyst multiples were applied to 50% of CityCenter’s Adjusted EBITDA instead of CityCenter’s Income from Unconsolidated Affiliates
2 CityCenter Income From Unconsolidated Affiliates is as of 12/31/16 of $446 million less gain from the Crystals sale of $401 million plus Nevada Energy Expense of $41 million
3 Assumes 574 million shares outstanding
➢ Aria is consistently one of the top 3 performing resorts within the MGM portfolio
➢ MGM Resorts accounts for CityCenter under the equity method of accounting as per
GAAP. The result of which is Income from Unconsolidated Affiliates which
represents our 50% share of operating income of CityCenter and adjusted for
certain basis differences
➢ This is not a true reflection of CityCenter’s value to MGM Resorts
2016 Valuation
50% of CityCenter Adjusted EBITDA $175 x 11 = $1,925
Reported CityCenter Income From Unconsolidated Affiliates $86 x 11 = $941
Value Variance $983
Value Variance per share $1.71
Illustrative
Multiple1
2
3
MGM China Case Study
Return on Invested Capital
20
➢ MGM initial investment in MGM China was $341mm prior to its
recent 4.95% purchase
▪ Distributions and dividends to date of $1.4bn are approximately
4x above initial investment
➢ In September 2016, MGM increased its ownership stake in MGM
China by 4.95% via cash / stock purchase
▪ Price of MGM China at close of transaction was HK$11.98,
which is well below recent closing price1 of HK$15.70
➢ MGM’s current ownership of 56% equals $4.3bn2 of value
1 As of 3/24/17
2 Assumes HKD / USD exchange rate of 7.75 based on closing price of $15.70 on 3/24/17
MGM Grand Detroit Case Study
Return on Invested Capital
21
➢ Total spend on current MGM Detroit permanent facility of $800mm
➢ MGM Detroit is generating stabilized Adjusted Property EBITDA of
~$160mm (reflects trailing two year average)
➢ Consistent market leader with > 40% market share
T-Mobile Arena Case Study
Return on Invested Capital
22
➢ Developed brand new best-in-class $375 million entertainment
venue
➢ MGM owns 42.5% in the T-Mobile Arena with a net investment of
~$73 million
➢ Benefits several neighboring MGM Resorts properties and offers
incremental ancillary revenue streams to Casino, Hotel, F&B,
Retail, Entertainment & Other
➢ Hosting first Las Vegas NHL team beginning 2017, which secures
over 40 event dates excluding concerts, boxing and other events
➢ Top 3 grossing arena in its category in 2016 (only 9 months of
operations)
23
Leverage & Trading Comparables
24
Historical Consolidated Leverage
2012 2016
Total Cash $1,544 $1,447
LTM Adjusted EBITDA related to:
Domestic Resorts $1,325 $2,340
Management and other operations 10 13
MGM China 679 521
Corporate expense (excluding stock-based compensation) (216) (284)
$1,799 $2,590
Recurring dividends received by MGM Resorts 22 59
$1,821 $2,649
Total Principal Amount of Debt related to:
MGM Resorts Consolidated $13,598 $13,144
$13,598 $13,144
Consolidated Net Leverage Ratio 6.6x 4.4x
1 12/31/2012 includes $952 million at MGM China; 12/31/16 includes $454 million and $360 million at MGM China and MGM Growth Properties, respectively
2 Includes 12/31/16 reported Adjusted Property EBITDA plus an annualization adjustment for Borgata and MGM National Harbor for the year ended December 31,
2016
3 Represents ordinary dividends (excluding special dividends) and other regular cash distributions actually received by MGM from CityCenter and Grand Victoria.
4 12/31/12 includes $554 million at MGM China; 12/31/16 includes $1.9 billion, $3.7 billion, and $450 million at MGM China, MGM Growth Properties, and MGM
National Harbor, respectively
1
2
3
4
2016 Credit Profile Peer Comparison
MGM vs. Select Gaming Companies
25
Net Leverage1
2.0x
4.4x
4.9x
5.8x
6.7x
0.0x
1.0x
2.0x
3.0x
4.0x
5.0x
6.0x
7.0x
8.0x
LVS MGM Red Rock Boyd Wynn
Source: Company filings
1 Consolidated net leverage represents total indebtedness less cash and cash equivalents divided by Adjusted EBITDA.
26
Capital Initiative Projects
Source: Company filings; Maryland Gaming commission
Note: Financial performance statistics combine Jan & Feb 2017 based on Maryland Gaming Commission and West Virginia Lottery reports
1 Fair share is based on total table game and slot units for the D.C. Metro peer / competitive set
2 Win per position per day; assumes 7 seats per table
3 D.C. Metro peer / competitive set includes MGM National Harbor, Maryland Live, Horseshoe Baltimore, Hollywood Perryville, Ocean Downs, Rocky Gap and Hollywood
Chares Town. MGM National Harbor of $336 vs peer / competitive set total WPPD weighted by total gross gaming revenue YTD as of Feb 2017
4 As of 12/31/2016
5 Includes 39 poker tables
 Cost: $1.4 billion
 Location: On the Potomac River just
outside of Washington D.C.
 Casino: 3,241 slots and 126 tables5
 Hotel: 308 rooms
 Meeting & Event Space: 50,000 sq. ft.
Property Highlights4
 Retail and dining: 93,100 sq. ft.
 Theater: 3,000 seat
 Luxury spa and roof-top pool
 Positioned to be one of the highest
grossing facilities in the country
27
MGM National Harbor
Opened December 8, 2016
Financial Performance
 Average market share of ~30% vs. fair share1 of 23%
 Achieved the highest table games revenue on record in January and February of 2017 for Maryland gaming
 Year-to-date February 2017 total WPPD2 of $336, $40 higher than its peers3
 Property is averaging over 22,000 daily visitors
28
MGM National Harbor
Property Highlights
✓ Celebrated the grand opening of the 5,200-seat theater with inaugural
performances by legendary singer-songwriter Stevie Nicks and renowned rock
group The Pretenders
✓ The Park Theater will play a key role in MGM’s strategy to further evolve the
entertainment landscape in Las Vegas, featuring unparalleled audio and visual
technology and providing intimate exposure to some of the most celebrated artists
29
✓ The stage is set for award winning entertainers in 2017
❖ Bruno Mars, a 17-time
GRAMMY® Award
nominee will take the
stage in March and
September
❖ Multiple GRAMMY®
Award-winning artist,
Ricky Martin will begin
his Las Vegas
residency in April
❖ The Oscar, Emmy,
and GRAMMY®
Award-winning
Goddess of Pop,
Cher will perform in
February and May
Park Theater at Monte Carlo
Opened December 17, 2016
30
Park Theater at Monte Carlo
31
Park Theater at Monte Carlo
Park MGM / The NoMad Las Vegas
 Cost: ~$500 million
 Opening Date: Late 2018
 Location: Las Vegas Strip, between New York- New York, T-Mobile Arena and CityCenter
 Hotel:
 Park MGM: 2,700 room luxury resort conceptualized by MGM and Sydell Group conceived to
target a younger, well-traveled demographic seeking unique experiences and innovative design.
 NoMad Las Vegas: 292 guestrooms and suites with a dedicated drop-off lobby, swimming pool
and NoMad branded gaming, eating and drinking experiences.
Project Highlights
Park MGM
Las Vegas Boulevard
NoMad Las Vegas
Park Theater
TropicanaAvenue
Market at Park MGM
Interstate 15
32
Planned Casino Projects
1 Excludes capitalized interest and land related costs
2 Includes poker tables
MGM Springfield
 Cost: ~$865 million(1)
 Opening Date: Late 2018
 Location: 14 acres in downtown Springfield, MA
 Casino: 3,000 slots and 100 tables(2)
Project Highlights:
 Hotel: 250 rooms
 Retail and dining: 100,000 sq. .ft.
 Parking garage: 3,375 spaces
 Meeting & Event Space: 44,000 sq. ft.
Everett Wynn
Plainridge Park
Twin River
Newport Grand
Foxwoods
Mohegan Sun
Other Casino Properties
50 mi – Population 3.3 million
25 mi – Population 1.2 million
33
34
MGM Springfield
Construction – Aerial View
 Cost: $3.3 billion
 Opening Date: 2nd Half of 2017
 Location: 18 acre site on the Cotai Strip in Macau
 Casino: capacity for up to 500 gaming tables and 1,500 slots
 Hotel: 1,500 rooms
 Other amenities: meeting space, high end spa, retail offerings, F&B outlets, a transformable theater, and the
Spectacle as well as the first international MGM Mansion villa product for the ultimate luxury experience.
Project Highlights
MGM Cotai
35
36
MGM Cotai
Construction
37
MGM Cotai
Construction
38
Appendix
Total Shareholder Return Performance
Strategic Highlights – Detail
MGM Highlights – 2014 & 2015
39
2014
➢ Re-priced CityCenter's TLB generating annual savings of $12mm
➢ MGM issued $1.25bn of 6% Senior Notes due 2023
➢ MGM repaid $509mm of 5.875% senior notes
➢ MGM China paid $499mm special dividend in March, $127mm final dividend in June and $137mm
interim dividend in September
2015
➢ Converted $1.45bn convertible notes to equity
➢ Closed on sale of Railroad Pass & Gold Strike Jean for net proceeds of $20mm
➢ Announced implementation of Profit Growth Plan with initial target of $300mm
➢ Closed on sale of Circus Circus Reno for net proceeds of $72mm
➢ MGM Resort’s $200mm share of the first ever $400mm special distribution from CityCenter
➢ Repayment of the $875mm senior notes
➢ Amend and extend of MGM China's Senior Credit Facility with +$1B upsize
➢ MGM China paid $400mm special dividend in March, $120mm final dividend in June and $76mm
interim dividend in August
MGM Highlights – 2016
40
➢ Profit Growth Plan – Continued successful execution with 2017 target increased from
$300mm to $400mm
➢ MGP Formation & IPO
▪ $1.2bn of proceeds was third largest US IPO of 2016
▪ Priced at the high-end of the range
▪ 14x multiple represented a premium valuation to closest comp
▪ Strong after-market performance with MGP equity currently trading ~16% above issuance
➢ Significant MGM balance sheet improvement
▪ Consolidated net leverage below 4.5x
o Lowest levels since pre-recession despite funding over $3bn in construction in
progress
▪ MGP transaction resulted in two-notch upgrade from Moody’s and Fitch and a one-notch
upgrade from S&P
▪ MGM raised $500mm of 10 year bonds at 4.625% - lowest long-term bond yield in MGM's
history
▪ Overall reduction of ~$4bn of debt
➢ Crystals Sale for $1.1bn represents cap rate of ~4.2%
➢ Acquired BYD's 50% interest in Borgata at $1.8bn valuation (100%) & sold underlying real
estate to MGP for $1.175bn
▪ Implied multiple of 8.9x at signing (8.5x at announce)
MGM Highlights – 2016 (Continued)
41
➢ MGM acquired 4.95% of MGM China from Pansy Ho for 7.1mm MGM shares, $100mm cash &
$50mm deferred cash payment
➢ Entered into MGM National Harbor $525mm credit facility to complete construction
➢ MGP raised $500 million of 10 year bonds at 4.50% - lowest coupon in company's history
➢ Re-priced MGP's TLB generating annual savings of $13.5mm upon Moody's upgrade
➢ CityCenter Dividends - $540mm received in 2016 by MGM as a result of Crystals transaction
➢ MGM China paid $46mm final dividend in June and $58mm interim dividend in August
➢ Announced $450mm Monte Carlo rebrand initiative (with expected completion in 2018)
➢ Completed $70mm Mandalay Bay Convention expansion
➢ Successfully opened the T-Mobile Arena / MGM National Harbor / Park Theater
42
Appendix
Total Shareholder Return Performance
Strategic Highlights – Detail
Total Shareholder Returns
43
MGM has generally outperformed industry peers on a 1,3, and 5 year basis
Source: Bloomberg
Note: Trailing total stock performance as of 3/24/17
1 Returns include dividends; 3-Year and 5-Year represents the compounded annual growth rate
Annualized Returns1
1-Year 3-Year 5-Year
MGM Resorts International 25.8% 0.3% 12.2%
Las Vegas Sands 12.0% -6.5% 4.0%
Wynn Resorts 22.3% -17.9% 1.3%
S&P 500 Index 17.6% 10.2% 13.0%
1-Year Performance
44
1-Year Performance
25.8%
12.0%
22.3%
17.6%
-30%
-20%
-10%
0%
10%
20%
30%
40%
50%
Mar-16
Apr-16
May-16
Jun-16
Jul-16
Aug-16
Sep-16
Oct-16
Nov-16
Dec-16
Jan-17
Feb-17
Mar-17
MGM LVS WYNN S&P 500 Index
Stock Price Stock Price 1 Year
Company 3/24/2016 3/24/2017 Return(1)
MGM Resorts International $20.52 $25.71 25.8%
Las Vegas Sands 52.47 55.62 12.0%
Wynn Resorts 93.47 111.92 22.3%
S&P 500 Index 2,036 2,344 17.6%
Source: Bloomberg
Note: Trailing total stock performance as of 3/24/17
1 Returns include dividends
3-Year Performance
45
3-Year Performance
0.8%
-18.4%
-44.7%
33.8%
-100%
-80%
-60%
-40%
-20%
0%
20%
40%
60%
Mar-14
Jun-14
Sep-14
Dec-14
Mar-15
Jun-15
Sep-15
Dec-15
Mar-16
Jun-16
Sep-16
Dec-16
MGM LVS WYNN S&P 500 Index
Stock Price Stock Price 3 Year Return(1)
Company 3/25/2014 3/24/2017 Cumulative CAGR
MGM Resorts International 25.61 $25.71 0.8% 0.3%
Las Vegas Sands 78.80 55.62 -18.4% -6.5%
Wynn Resorts 219.50 111.92 -44.7% -17.9%
S&P 500 Index 1,866 2,344 33.8% 10.2%
Source: Bloomberg
Note: Trailing total stock performance as of 3/24/17
1 Returns include dividends
5-Year Performance
46
5-Year Performance
77.6%
21.5%
6.4%
84.1%
-80%
-60%
-40%
-20%
0%
20%
40%
60%
80%
100%
120%
140%
Mar-12
Jun-12
Sep-12
Dec-12
Mar-13
Jun-13
Sep-13
Dec-13
Mar-14
Jun-14
Sep-14
Dec-14
Mar-15
Jun-15
Sep-15
Dec-15
Mar-16
Jun-16
Sep-16
Dec-16
MGM LVS WYNN S&P 500 Index
Source: Bloomberg
Note: Trailing total stock performance as of 3/24/17
1 Returns include dividends
Stock Price Stock Price 5 Year Return(1)
Company 3/26/2012 3/24/2017 Cumulative CAGR
MGM Resorts International $14.54 $25.71 77.6% 12.2%
Las Vegas Sands 58.83 55.62 21.5% 4.0%
Wynn Resorts 130.00 111.92 6.4% 1.3%
S&P 500 Index 1,417 2,344 84.1% 13.0%

More Related Content

What's hot

MoreSleep Creative Agency Credentials
MoreSleep Creative Agency CredentialsMoreSleep Creative Agency Credentials
MoreSleep Creative Agency CredentialsMore Sleep
 
Digital Marketing for Hotel Industry
Digital Marketing for Hotel IndustryDigital Marketing for Hotel Industry
Digital Marketing for Hotel IndustryDigital Vidya
 
GreenRoom Agency Capabilities Deck
GreenRoom Agency Capabilities DeckGreenRoom Agency Capabilities Deck
GreenRoom Agency Capabilities DeckGreenRoom Agency
 
Pitch Deck for Enlive
Pitch Deck for EnlivePitch Deck for Enlive
Pitch Deck for EnlivePitch Decks
 
NPR Design. Agency deck, 2017.
NPR Design. Agency deck, 2017.NPR Design. Agency deck, 2017.
NPR Design. Agency deck, 2017.NPR design
 
Trigger Agency Profile - Advertising and Digital Marketing Services
Trigger Agency Profile - Advertising and Digital Marketing ServicesTrigger Agency Profile - Advertising and Digital Marketing Services
Trigger Agency Profile - Advertising and Digital Marketing ServicesTrigger Advertising
 
Influencer Marketing’s Growth Rate In One Infographic
Influencer Marketing’s Growth Rate In One InfographicInfluencer Marketing’s Growth Rate In One Infographic
Influencer Marketing’s Growth Rate In One InfographicInfluencer Marketing Hub
 
Four Seasons Hotel Campaign
Four Seasons Hotel CampaignFour Seasons Hotel Campaign
Four Seasons Hotel CampaignBethany Nicole
 
Smart Cities – how to master the world's biggest growth challenge
Smart Cities – how to master the world's biggest growth challengeSmart Cities – how to master the world's biggest growth challenge
Smart Cities – how to master the world's biggest growth challengeBoston Consulting Group
 
REIKA Credential 2022
REIKA Credential 2022REIKA Credential 2022
REIKA Credential 2022REIKA
 
Sticker Driver Advertiser Presentation
Sticker Driver Advertiser PresentationSticker Driver Advertiser Presentation
Sticker Driver Advertiser PresentationSticker Driver Limited
 
Digital Marketing Agency Intro Deck
Digital Marketing Agency Intro DeckDigital Marketing Agency Intro Deck
Digital Marketing Agency Intro DeckUPtimiser
 
Crowdfunding market in china report by daxue consulting & Jiaotong university
Crowdfunding market in china report by daxue consulting & Jiaotong universityCrowdfunding market in china report by daxue consulting & Jiaotong university
Crowdfunding market in china report by daxue consulting & Jiaotong universityDaxue Consulting
 
Isentia Two Social_Agency Credentials
Isentia Two Social_Agency CredentialsIsentia Two Social_Agency Credentials
Isentia Two Social_Agency CredentialsRichard Spencer
 
IMPRiNT Digital Agency Capabilities Deck
IMPRiNT Digital Agency Capabilities DeckIMPRiNT Digital Agency Capabilities Deck
IMPRiNT Digital Agency Capabilities DeckBrent Burghdorf
 
Timeahead Agency Pitch Deck.pdf
Timeahead Agency Pitch Deck.pdfTimeahead Agency Pitch Deck.pdf
Timeahead Agency Pitch Deck.pdfHabib-ur- Rehman
 
Malik Media Agency Capabilities Deck
Malik Media Agency Capabilities DeckMalik Media Agency Capabilities Deck
Malik Media Agency Capabilities DeckSam Malik
 

What's hot (20)

BrandStudios Portfolio
BrandStudios PortfolioBrandStudios Portfolio
BrandStudios Portfolio
 
MoreSleep Creative Agency Credentials
MoreSleep Creative Agency CredentialsMoreSleep Creative Agency Credentials
MoreSleep Creative Agency Credentials
 
Digital Marketing for Hotel Industry
Digital Marketing for Hotel IndustryDigital Marketing for Hotel Industry
Digital Marketing for Hotel Industry
 
GreenRoom Agency Capabilities Deck
GreenRoom Agency Capabilities DeckGreenRoom Agency Capabilities Deck
GreenRoom Agency Capabilities Deck
 
Pitch Deck for Enlive
Pitch Deck for EnlivePitch Deck for Enlive
Pitch Deck for Enlive
 
Graffiti Company_Profile_01_01_2015
Graffiti Company_Profile_01_01_2015Graffiti Company_Profile_01_01_2015
Graffiti Company_Profile_01_01_2015
 
NPR Design. Agency deck, 2017.
NPR Design. Agency deck, 2017.NPR Design. Agency deck, 2017.
NPR Design. Agency deck, 2017.
 
Trigger Agency Profile - Advertising and Digital Marketing Services
Trigger Agency Profile - Advertising and Digital Marketing ServicesTrigger Agency Profile - Advertising and Digital Marketing Services
Trigger Agency Profile - Advertising and Digital Marketing Services
 
RFP VFS Project Vision
RFP VFS Project VisionRFP VFS Project Vision
RFP VFS Project Vision
 
Influencer Marketing’s Growth Rate In One Infographic
Influencer Marketing’s Growth Rate In One InfographicInfluencer Marketing’s Growth Rate In One Infographic
Influencer Marketing’s Growth Rate In One Infographic
 
Four Seasons Hotel Campaign
Four Seasons Hotel CampaignFour Seasons Hotel Campaign
Four Seasons Hotel Campaign
 
Smart Cities – how to master the world's biggest growth challenge
Smart Cities – how to master the world's biggest growth challengeSmart Cities – how to master the world's biggest growth challenge
Smart Cities – how to master the world's biggest growth challenge
 
REIKA Credential 2022
REIKA Credential 2022REIKA Credential 2022
REIKA Credential 2022
 
Sticker Driver Advertiser Presentation
Sticker Driver Advertiser PresentationSticker Driver Advertiser Presentation
Sticker Driver Advertiser Presentation
 
Digital Marketing Agency Intro Deck
Digital Marketing Agency Intro DeckDigital Marketing Agency Intro Deck
Digital Marketing Agency Intro Deck
 
Crowdfunding market in china report by daxue consulting & Jiaotong university
Crowdfunding market in china report by daxue consulting & Jiaotong universityCrowdfunding market in china report by daxue consulting & Jiaotong university
Crowdfunding market in china report by daxue consulting & Jiaotong university
 
Isentia Two Social_Agency Credentials
Isentia Two Social_Agency CredentialsIsentia Two Social_Agency Credentials
Isentia Two Social_Agency Credentials
 
IMPRiNT Digital Agency Capabilities Deck
IMPRiNT Digital Agency Capabilities DeckIMPRiNT Digital Agency Capabilities Deck
IMPRiNT Digital Agency Capabilities Deck
 
Timeahead Agency Pitch Deck.pdf
Timeahead Agency Pitch Deck.pdfTimeahead Agency Pitch Deck.pdf
Timeahead Agency Pitch Deck.pdf
 
Malik Media Agency Capabilities Deck
Malik Media Agency Capabilities DeckMalik Media Agency Capabilities Deck
Malik Media Agency Capabilities Deck
 

Similar to MGM Investor Presentation

1 q18 earnings presentation vfinal
1 q18 earnings presentation vfinal1 q18 earnings presentation vfinal
1 q18 earnings presentation vfinalmgm2017ir
 
1 q18 earnings presentation vfinal
1 q18 earnings presentation vfinal1 q18 earnings presentation vfinal
1 q18 earnings presentation vfinalmgm2017ir
 
MGM 1Q18 Earnings Presentation
MGM 1Q18 Earnings PresentationMGM 1Q18 Earnings Presentation
MGM 1Q18 Earnings Presentationmgm2017ir
 
Mgm investment summary deck v final
Mgm investment summary deck v finalMgm investment summary deck v final
Mgm investment summary deck v finalmgm2017ir
 
Mgm investment-summary-deck-january-2018-v final
Mgm investment-summary-deck-january-2018-v finalMgm investment-summary-deck-january-2018-v final
Mgm investment-summary-deck-january-2018-v finalmgm2017ir
 
MGM Third Quarter 2017 Earnings
MGM Third Quarter 2017 EarningsMGM Third Quarter 2017 Earnings
MGM Third Quarter 2017 Earningsmgm2017ir
 
4 q17 earnings presentation final
4 q17 earnings presentation final4 q17 earnings presentation final
4 q17 earnings presentation finalmgm2017ir
 
MGM-Resorts-Earnings-Presentation.pdf
MGM-Resorts-Earnings-Presentation.pdfMGM-Resorts-Earnings-Presentation.pdf
MGM-Resorts-Earnings-Presentation.pdfssuser230f55
 
MGM First Quarter 2017 Earnings Presentation
MGM First Quarter 2017 Earnings PresentationMGM First Quarter 2017 Earnings Presentation
MGM First Quarter 2017 Earnings Presentationmgm2017ir
 
AGS Investor Overview - June 2018
AGS Investor Overview - June 2018AGS Investor Overview - June 2018
AGS Investor Overview - June 2018AGS
 
Brink's june 25 2018 investor presentation final 06222018
Brink's june 25 2018 investor presentation final 06222018Brink's june 25 2018 investor presentation final 06222018
Brink's june 25 2018 investor presentation final 06222018investorsbrinks
 
Jefferies 2016 Consumer Conference
Jefferies 2016 Consumer ConferenceJefferies 2016 Consumer Conference
Jefferies 2016 Consumer ConferenceSysco_Investors
 
2015 masco corporation raymond james
2015 masco corporation raymond james2015 masco corporation raymond james
2015 masco corporation raymond jamesMasco_Investors
 
Brink's june 5 2018 investor presentation final 06042018
Brink's june 5 2018 investor presentation final 06042018Brink's june 5 2018 investor presentation final 06042018
Brink's june 5 2018 investor presentation final 06042018investorsbrinks
 
Q4 fy17 earnings presentation v f
Q4 fy17 earnings presentation v fQ4 fy17 earnings presentation v f
Q4 fy17 earnings presentation v fir_westrock
 
Brink's may 2018 investor presentation final
Brink's may 2018 investor presentation finalBrink's may 2018 investor presentation final
Brink's may 2018 investor presentation finalinvestorsbrinks
 
Noble investor presentation
Noble investor presentation Noble investor presentation
Noble investor presentation tribuneIR
 
20160216 cagny presentation vfinal
20160216 cagny presentation vfinal20160216 cagny presentation vfinal
20160216 cagny presentation vfinalSysco_Investors
 

Similar to MGM Investor Presentation (20)

1 q18 earnings presentation vfinal
1 q18 earnings presentation vfinal1 q18 earnings presentation vfinal
1 q18 earnings presentation vfinal
 
1 q18 earnings presentation vfinal
1 q18 earnings presentation vfinal1 q18 earnings presentation vfinal
1 q18 earnings presentation vfinal
 
MGM 1Q18 Earnings Presentation
MGM 1Q18 Earnings PresentationMGM 1Q18 Earnings Presentation
MGM 1Q18 Earnings Presentation
 
Mgm investment summary deck v final
Mgm investment summary deck v finalMgm investment summary deck v final
Mgm investment summary deck v final
 
Mgm investment-summary-deck-january-2018-v final
Mgm investment-summary-deck-january-2018-v finalMgm investment-summary-deck-january-2018-v final
Mgm investment-summary-deck-january-2018-v final
 
MGM Third Quarter 2017 Earnings
MGM Third Quarter 2017 EarningsMGM Third Quarter 2017 Earnings
MGM Third Quarter 2017 Earnings
 
4 q17 earnings presentation final
4 q17 earnings presentation final4 q17 earnings presentation final
4 q17 earnings presentation final
 
MGM-Resorts-Earnings-Presentation.pdf
MGM-Resorts-Earnings-Presentation.pdfMGM-Resorts-Earnings-Presentation.pdf
MGM-Resorts-Earnings-Presentation.pdf
 
MGM First Quarter 2017 Earnings Presentation
MGM First Quarter 2017 Earnings PresentationMGM First Quarter 2017 Earnings Presentation
MGM First Quarter 2017 Earnings Presentation
 
AGS Investor Overview - June 2018
AGS Investor Overview - June 2018AGS Investor Overview - June 2018
AGS Investor Overview - June 2018
 
Brink's june 25 2018 investor presentation final 06222018
Brink's june 25 2018 investor presentation final 06222018Brink's june 25 2018 investor presentation final 06222018
Brink's june 25 2018 investor presentation final 06222018
 
Jefferies 2016 Consumer Conference
Jefferies 2016 Consumer ConferenceJefferies 2016 Consumer Conference
Jefferies 2016 Consumer Conference
 
2015 masco corporation raymond james
2015 masco corporation raymond james2015 masco corporation raymond james
2015 masco corporation raymond james
 
Brink's june 5 2018 investor presentation final 06042018
Brink's june 5 2018 investor presentation final 06042018Brink's june 5 2018 investor presentation final 06042018
Brink's june 5 2018 investor presentation final 06042018
 
DSS Presentation Deck 2021
DSS Presentation Deck 2021DSS Presentation Deck 2021
DSS Presentation Deck 2021
 
Q4 fy17 earnings presentation v f
Q4 fy17 earnings presentation v fQ4 fy17 earnings presentation v f
Q4 fy17 earnings presentation v f
 
Brink's may 2018 investor presentation final
Brink's may 2018 investor presentation finalBrink's may 2018 investor presentation final
Brink's may 2018 investor presentation final
 
Genting
GentingGenting
Genting
 
Noble investor presentation
Noble investor presentation Noble investor presentation
Noble investor presentation
 
20160216 cagny presentation vfinal
20160216 cagny presentation vfinal20160216 cagny presentation vfinal
20160216 cagny presentation vfinal
 

Recently uploaded

一比一原版(Mac毕业证书)麦克马斯特大学毕业证成绩单原件一模一样
一比一原版(Mac毕业证书)麦克马斯特大学毕业证成绩单原件一模一样一比一原版(Mac毕业证书)麦克马斯特大学毕业证成绩单原件一模一样
一比一原版(Mac毕业证书)麦克马斯特大学毕业证成绩单原件一模一样dyuozua
 
AMG Quarterly Investor Presentation May 2024
AMG Quarterly Investor Presentation May 2024AMG Quarterly Investor Presentation May 2024
AMG Quarterly Investor Presentation May 2024gstubel
 
Osisko Development - Investor Presentation - May 2024
Osisko Development - Investor Presentation - May 2024Osisko Development - Investor Presentation - May 2024
Osisko Development - Investor Presentation - May 2024Philip Rabenok
 
Corporate Presentation Probe May 2024.pdf
Corporate Presentation Probe May 2024.pdfCorporate Presentation Probe May 2024.pdf
Corporate Presentation Probe May 2024.pdfProbe Gold
 
Camil Institutional Presentation_Mai24.pdf
Camil Institutional Presentation_Mai24.pdfCamil Institutional Presentation_Mai24.pdf
Camil Institutional Presentation_Mai24.pdfCAMILRI
 
Financial Results for the Fiscal Year Ended March 2024
Financial Results for the Fiscal Year Ended March 2024Financial Results for the Fiscal Year Ended March 2024
Financial Results for the Fiscal Year Ended March 2024KDDI
 
Camil Institutional Presentation_Mai24.pdf
Camil Institutional Presentation_Mai24.pdfCamil Institutional Presentation_Mai24.pdf
Camil Institutional Presentation_Mai24.pdfCAMILRI
 
一比一原版(RUG毕业证书)格罗宁根大学毕业证成绩单原件一模一样
一比一原版(RUG毕业证书)格罗宁根大学毕业证成绩单原件一模一样一比一原版(RUG毕业证书)格罗宁根大学毕业证成绩单原件一模一样
一比一原版(RUG毕业证书)格罗宁根大学毕业证成绩单原件一模一样dyuozua
 
一比一原版(AUT毕业证书)奥克兰理工大学毕业证成绩单原件一模一样
一比一原版(AUT毕业证书)奥克兰理工大学毕业证成绩单原件一模一样一比一原版(AUT毕业证书)奥克兰理工大学毕业证成绩单原件一模一样
一比一原版(AUT毕业证书)奥克兰理工大学毕业证成绩单原件一模一样dyuozua
 
Osisko Gold Royalties Ltd - Corporate Presentation, May 2024
Osisko Gold Royalties Ltd - Corporate Presentation, May 2024Osisko Gold Royalties Ltd - Corporate Presentation, May 2024
Osisko Gold Royalties Ltd - Corporate Presentation, May 2024Osisko Gold Royalties Ltd
 
一比一原版(VUW毕业证书)惠灵顿维多利亚大学毕业证成绩单原件一模一样
一比一原版(VUW毕业证书)惠灵顿维多利亚大学毕业证成绩单原件一模一样一比一原版(VUW毕业证书)惠灵顿维多利亚大学毕业证成绩单原件一模一样
一比一原版(VUW毕业证书)惠灵顿维多利亚大学毕业证成绩单原件一模一样dyuozua
 
BofA Securities GMM and Steel Conference
BofA Securities GMM and Steel ConferenceBofA Securities GMM and Steel Conference
BofA Securities GMM and Steel ConferenceTeckResourcesLtd
 
一比一原版(UNITEC毕业证书)UNITEC理工学院毕业证成绩单原件一模一样
一比一原版(UNITEC毕业证书)UNITEC理工学院毕业证成绩单原件一模一样一比一原版(UNITEC毕业证书)UNITEC理工学院毕业证成绩单原件一模一样
一比一原版(UNITEC毕业证书)UNITEC理工学院毕业证成绩单原件一模一样dyuozua
 
一比一原版(UofG毕业证书)圭尔夫大学毕业证成绩单原件一模一样
一比一原版(UofG毕业证书)圭尔夫大学毕业证成绩单原件一模一样一比一原版(UofG毕业证书)圭尔夫大学毕业证成绩单原件一模一样
一比一原版(UofG毕业证书)圭尔夫大学毕业证成绩单原件一模一样dyuozua
 
The Leonardo 1Q 2024 Results Presentation
The Leonardo 1Q 2024 Results PresentationThe Leonardo 1Q 2024 Results Presentation
The Leonardo 1Q 2024 Results PresentationLeonardo
 
一比一原版(Acadia毕业证书)加拿大阿卡迪亚大学毕业证学历认证可查认证
一比一原版(Acadia毕业证书)加拿大阿卡迪亚大学毕业证学历认证可查认证一比一原版(Acadia毕业证书)加拿大阿卡迪亚大学毕业证学历认证可查认证
一比一原版(Acadia毕业证书)加拿大阿卡迪亚大学毕业证学历认证可查认证xzxvi5zp
 
0838*4800*7379 JUAL OBAT ABORSI CYTOTEC BOGOR
0838*4800*7379 JUAL OBAT ABORSI CYTOTEC BOGOR0838*4800*7379 JUAL OBAT ABORSI CYTOTEC BOGOR
0838*4800*7379 JUAL OBAT ABORSI CYTOTEC BOGORjualobat34
 

Recently uploaded (20)

一比一原版(Mac毕业证书)麦克马斯特大学毕业证成绩单原件一模一样
一比一原版(Mac毕业证书)麦克马斯特大学毕业证成绩单原件一模一样一比一原版(Mac毕业证书)麦克马斯特大学毕业证成绩单原件一模一样
一比一原版(Mac毕业证书)麦克马斯特大学毕业证成绩单原件一模一样
 
AMG Quarterly Investor Presentation May 2024
AMG Quarterly Investor Presentation May 2024AMG Quarterly Investor Presentation May 2024
AMG Quarterly Investor Presentation May 2024
 
Osisko Development - Investor Presentation - May 2024
Osisko Development - Investor Presentation - May 2024Osisko Development - Investor Presentation - May 2024
Osisko Development - Investor Presentation - May 2024
 
ITAU EQUITY_STRATEGY_WARM_UP_20240505 DHG.pdf
ITAU EQUITY_STRATEGY_WARM_UP_20240505 DHG.pdfITAU EQUITY_STRATEGY_WARM_UP_20240505 DHG.pdf
ITAU EQUITY_STRATEGY_WARM_UP_20240505 DHG.pdf
 
SME IPO Opportunity and Trends of May 2024
SME IPO Opportunity and Trends of May 2024SME IPO Opportunity and Trends of May 2024
SME IPO Opportunity and Trends of May 2024
 
Corporate Presentation Probe May 2024.pdf
Corporate Presentation Probe May 2024.pdfCorporate Presentation Probe May 2024.pdf
Corporate Presentation Probe May 2024.pdf
 
Camil Institutional Presentation_Mai24.pdf
Camil Institutional Presentation_Mai24.pdfCamil Institutional Presentation_Mai24.pdf
Camil Institutional Presentation_Mai24.pdf
 
Financial Results for the Fiscal Year Ended March 2024
Financial Results for the Fiscal Year Ended March 2024Financial Results for the Fiscal Year Ended March 2024
Financial Results for the Fiscal Year Ended March 2024
 
Camil Institutional Presentation_Mai24.pdf
Camil Institutional Presentation_Mai24.pdfCamil Institutional Presentation_Mai24.pdf
Camil Institutional Presentation_Mai24.pdf
 
一比一原版(RUG毕业证书)格罗宁根大学毕业证成绩单原件一模一样
一比一原版(RUG毕业证书)格罗宁根大学毕业证成绩单原件一模一样一比一原版(RUG毕业证书)格罗宁根大学毕业证成绩单原件一模一样
一比一原版(RUG毕业证书)格罗宁根大学毕业证成绩单原件一模一样
 
一比一原版(AUT毕业证书)奥克兰理工大学毕业证成绩单原件一模一样
一比一原版(AUT毕业证书)奥克兰理工大学毕业证成绩单原件一模一样一比一原版(AUT毕业证书)奥克兰理工大学毕业证成绩单原件一模一样
一比一原版(AUT毕业证书)奥克兰理工大学毕业证成绩单原件一模一样
 
Osisko Gold Royalties Ltd - Corporate Presentation, May 2024
Osisko Gold Royalties Ltd - Corporate Presentation, May 2024Osisko Gold Royalties Ltd - Corporate Presentation, May 2024
Osisko Gold Royalties Ltd - Corporate Presentation, May 2024
 
一比一原版(VUW毕业证书)惠灵顿维多利亚大学毕业证成绩单原件一模一样
一比一原版(VUW毕业证书)惠灵顿维多利亚大学毕业证成绩单原件一模一样一比一原版(VUW毕业证书)惠灵顿维多利亚大学毕业证成绩单原件一模一样
一比一原版(VUW毕业证书)惠灵顿维多利亚大学毕业证成绩单原件一模一样
 
Osisko Gold Royalties Ltd - Q1 2024 Results
Osisko Gold Royalties Ltd - Q1 2024 ResultsOsisko Gold Royalties Ltd - Q1 2024 Results
Osisko Gold Royalties Ltd - Q1 2024 Results
 
BofA Securities GMM and Steel Conference
BofA Securities GMM and Steel ConferenceBofA Securities GMM and Steel Conference
BofA Securities GMM and Steel Conference
 
一比一原版(UNITEC毕业证书)UNITEC理工学院毕业证成绩单原件一模一样
一比一原版(UNITEC毕业证书)UNITEC理工学院毕业证成绩单原件一模一样一比一原版(UNITEC毕业证书)UNITEC理工学院毕业证成绩单原件一模一样
一比一原版(UNITEC毕业证书)UNITEC理工学院毕业证成绩单原件一模一样
 
一比一原版(UofG毕业证书)圭尔夫大学毕业证成绩单原件一模一样
一比一原版(UofG毕业证书)圭尔夫大学毕业证成绩单原件一模一样一比一原版(UofG毕业证书)圭尔夫大学毕业证成绩单原件一模一样
一比一原版(UofG毕业证书)圭尔夫大学毕业证成绩单原件一模一样
 
The Leonardo 1Q 2024 Results Presentation
The Leonardo 1Q 2024 Results PresentationThe Leonardo 1Q 2024 Results Presentation
The Leonardo 1Q 2024 Results Presentation
 
一比一原版(Acadia毕业证书)加拿大阿卡迪亚大学毕业证学历认证可查认证
一比一原版(Acadia毕业证书)加拿大阿卡迪亚大学毕业证学历认证可查认证一比一原版(Acadia毕业证书)加拿大阿卡迪亚大学毕业证学历认证可查认证
一比一原版(Acadia毕业证书)加拿大阿卡迪亚大学毕业证学历认证可查认证
 
0838*4800*7379 JUAL OBAT ABORSI CYTOTEC BOGOR
0838*4800*7379 JUAL OBAT ABORSI CYTOTEC BOGOR0838*4800*7379 JUAL OBAT ABORSI CYTOTEC BOGOR
0838*4800*7379 JUAL OBAT ABORSI CYTOTEC BOGOR
 

MGM Investor Presentation

  • 1. MGM Resorts International INVESTOR PRESENTATION March 2017
  • 2. 1 Forward-Looking Statements Statements in this presentation that are not historical facts are forward-looking statements, within the meaning of the Private Securities Litigation Reform Act of 1995 and involve risks and/or uncertainties, including those described in the Company's public filings with the Securities and Exchange Commission. The Company has based forward-looking statements on management’s current expectations and assumptions and not on historical facts. Examples of these statements include, but are not limited to, the Company’s expectations regarding future results (including RevPAR and other guidance), the payment of any future cash dividends on the Company’s common stock and dividends and distributions we expect to receive from MGM China, The MGM Growth Properties Operating Partnership or CityCenter, its ability to generate future cash flow growth and to execute on future development and other projects, amounts the Company expects to spend capital expenditures, and the Company’s ability to execute its strategic initiatives, improve its financial flexibility (including its balance sheet) and continue to execute on operational improvements. These forward-looking statements involve a number of risks and uncertainties. Among the important factors that could cause actual results to differ materially from those indicated in such forward-looking statements include effects of economic conditions and market conditions in the markets in which the Company operates and competition with other destination travel locations throughout the United States and the world, the design, timing and costs of expansion projects, risks relating to international operations, permits, licenses, financings, approvals and other contingencies in connection with growth in new or existing jurisdictions and additional risks and uncertainties described in the Company’s Form 10-K, Form 10-Q and Form 8-K reports (including all amendments to those reports). In providing forward-looking statements, the Company is not undertaking any duty or obligation to update these statements publicly as a result of new information, future events or otherwise, except as required by law. If the Company updates one or more forward-looking statements, no inference should be drawn that it will make additional updates with respect to those other forward-looking statements. Market and Industry Data This presentation also contains estimates and information concerning the Company’s industry and peers, including market position and fair share information, that are based on industry publications, reports and peer company public filings. This information involves a number of assumptions and limitations, and you are cautioned not to rely on or give undue weight to this information. The Company has not independently verified the accuracy or completeness of the data contained in these industry publications, reports or filings. The industry in which we operate is subject to a high degree of uncertainty and risk due to variety of factors, including those described in the “Risk Factors” section of the Company’s public filings with the SEC. Note Regarding Presentation of Non-GAAP Financial Measures The following presentation includes certain “non-GAAP financial measures” as defined in Regulation G under the Securities Exchange Act of 1934, as amended. Schedules that reconcile the non-GAAP financial measures to the most directly comparable financial measures calculated and presented in accordance with Generally Accepted Accounting Principles in the United States are included in our earnings releases that have been furnished with the SEC and are available on our website at www.mgmresorts.com.
  • 3. Company Overview 2 ✓ Extensively vetted and globally diversified across all high-quality gaming jurisdictions ✓ Operates some of the best known international luxury properties in the gaming and lodging industry including Bellagio, MGM Grand Las Vegas, ARIA Resort & Casino, Mandalay Bay, Borgata, MGM National Harbor and MGM Macau ✓ Experienced management team and Board of Directors with extensive industry background ✓ Dominant leader in food & beverage and conventions & corporate meetings ▪ Over 400 owned & leased outlets ▪ Over 3 million square feet of convention space ▪ World-class entertainment featuring a wide array of venues & shows ▪ 21 live entertainment venues, including T-Mobile Arena and Cirque du Soleil ✓ Embarking on new growth opportunities worldwide ▪ MGM Springfield ▪ MGM Cotai ▪ MGM Hospitality ✓ Fortune 500 company with 77,000 employees and ~$30bn enterprise value ✓ Consolidated Net Revenue1 of $9.5bn and Adjusted EBITDA1 of $2.8bn Leading Global Gaming & Hospitality Company with Highly Valuable Portfolio 1 As of 12/31/16
  • 4. MGM Resorts Organization Structure 3 MGM Resorts (Stock Exchange: NYSE / Ticker: MGM) Owned & Leased Resorts & Other (100%) MGM China Holdings Limited (56%) CityCenter Holdings (50%) Las Vegas Arena Company (42.5%) Diaoyutai MGM Hospitality (49%) Public Shareholders MGM Growth Properties REIT (76%) Owned Bellagio, MGM Grand LV, Circus Circus LV, MGM National Harbor, Shadow Creek, Fallen Oak Leased1 Mandalay Bay, Mirage, Luxor, Excalibur, New York- New York, Monte Carlo, The Park, MGM Grand Detroit, Beau Rivage, Gold Strike Tunica, Borgata Development MGM Springfield (Opening Late 2018) Publicly Traded REIT(1) Stock Exchange: NYSE Ticker: MGP Stock Exchange: HKSE Ticker: 2282 HK Properties: MGM Macau Development MGM Cotai (Opening 2H 2017) Properties: ARIA Vdara Mandarin Oriental Properties: T-Mobile Arena MGM Grand Garden (Lease) Elgin Riverboat Resort (50%) 1 MGM Growth Properties owns the properties leased by MGM Resorts International Properties: MGM Grand Sanya Diaoyutai Hotel Hangzhou Diaoyutai Hotel Chengdu Development Bellagio Shanghai (Opening 2017) Properties: Grand Victoria
  • 6. Looking Back – A Transformative 3 Years 5 MGM has come a long way since 2014 ➢ Significantly improved MGM’s balance sheet ▪ MGP transaction resulted in ~$4bn reduction of debt ▪ Sale of Crystals for $1.1bn provided MGM with $540mm dividend from CityCenter ▪ Converted $1.45bn of convertible notes to equity ▪ Continued MGM China dividends through construction of MGM Cotai ▪ Initiated CityCenter dividends ▪ Multiple Rating Agency upgrades ➢ Operational initiatives ▪ Strategic investment in personnel ▪ Expanded market share through innovative product and media initiatives ▪ Profit Growth Plan – initiated program, upsized target, achieved goals ahead of schedule ▪ Opened MGM National Harbor, T-Mobile Arena and Park Theater ▪ Completed Mandalay Bay Convention Center expansion ➢ Strategic initiatives ▪ MGP transaction ▪ Borgata acquisition with simultaneous sale of real estate to MGP ▪ Sale of non-core assets (Crystals, Circus Circus Reno, Railroad Pass & Gold Strike Jean) ▪ Increased ownership in MGM China from 51% to 56%
  • 7. Progress Since Analyst & Investor Day (June 2016) 6 AGENDA ITEM TOPIC STATUS Growing Our Top Line Las Vegas Market On Track MGM Market Share On Track Operational Excellence PGP Target Up to $400mm On Track EBITDA Margins to 30%+ On Track Marketing in a Digital World Digital Platform On Track Social On Track Mobile Sports App Launched Setting MGM Apart MGM National Harbor Completed (Dec 2016) Park Theater Completed (Dec 2016) Park MGM / NoMad (2017/2018) On Track MGM Springfield (Late 2018) On Track MGM China Holdings MGM Macau Continued Strong Performance MGM Cotai (Q1 2017) 2H 2017 MGM Growth Properties Growth - Borgata Completed (Aug 2016) Premium Valuation On Track Financial Overview Balance Sheet Improvements On Track Strategic Investments MGM National Harbor and Park Theater opened, MGM Cotai (2H 2017) Investment Grade On Track Return Capital to Shareholders Initiated Quarterly Dividend (Feb 2017) Paid First Dividend (Mar 2017)
  • 8. MGM Ongoing Initiatives 7 ➢ Continued Operational Improvements ▪ Focused on growing topline results and continued margin improvement ▪ Las Vegas Strip: ▪ 1QE 2017 RevPAR growth of 7% ▪ Achieved 30% margin in 2016 ▪ Strategies in place to grow 2017 margin 50-100bps ▪ Transition from Profit Growth Plan to Continuous Improvement ▪ Disciplined and targeted reinvestment in existing properties ▪ Park MGM/ NoMad ▪ Convention center expansions (Aria, MGM Grand, Bellagio) ➢ Further improvement of Balance Sheet ▪ Accelerating free cash flow story – current development pipeline winding down ▪ Utilize excess free cash flow to pay down debt and return capital to shareholders ▪ Obtain investment grade status ➢ Strategic Initiatives ▪ Potential sale of National Harbor real estate to MGP ▪ MGM Cotai in 2nd half of 2017 ▪ MGM Springfield in late 2018 ▪ Maximizing future dividends from Joint Ventures ▪ Continue to utilize MGP as a platform for growth ▪ Selectively pursue new jurisdiction opportunities (Japan)
  • 9. Driving Increased Shareholder Value 8 ✓ Leading global integrated resort company ✓ Large scale portfolio with best-in-class brands ✓ Premier operator in the industry ✓ Strong “One Company” culture with focus on continuous improvement ✓ Near term accretive growth opportunities ✓ Enhanced financial position provides visible path to investment grade ✓ Free cash flow profile positions MGM to continue to return capital to its shareholders
  • 11. 10 MGM Is Well Diversified 54% 19% 27% Macau U.S. Regionals 1 Excludes Management & Other Operations and Other Nevada 2 Includes 12/31/16 reported Net Revenue plus an annualization adjustment for Borgata and MGM National Harbor for the year ended December 31, 2016 Pro forma FY 2016 2 Las Vegas 62% 26% 12% Macau U.S. Regionals FY 2015 Las Vegas Net Revenue Mix1
  • 12. 44% 27% 15% 7% 7% 11 MGM Is Well Positioned In Las Vegas Source: Company filings (1) Includes 100% of CityCenter (2) Excludes Las Vegas Convention Center (3) As of May 2016 NO. OF ROOMS 49% 25% 12% 9% 6% NO. OF TABLES + SLOTS CONVENTION SPACE(2) 2016 Las Vegas Strip 48% 12% 4% 32% 4% 44% ARENA, THEATER & SHOWROOM(3) MGM1 MGM1 MGM1 MGM1
  • 13. 10% 5% 5% 5% 3% 5% 6% 8% 6% 5% 7% 3% 14% 6% 6% 7% 1% 6% 8% 12% 8% 3% 11% 3% 0% 2% 4% 6% 8% 10% 12% 14% 16% 1Q14 2Q14 3Q14 4Q14 1Q15 2Q15 3Q15 4Q15 1Q16 2Q16 3Q16 4Q16 Guidance RevPAR growth Reported RevPAR growth 6% We have met or exceeded Las Vegas Strip RevPAR guidance in 22 of the last 24 quarters, with misses attributable to difficult year-over-year comparisons due to historic events in the prior period 12 CON/AGG comparable in 1Q14 Year-over-yeargrowth 1 RevPAR is hotel revenue per available room 2 Excluding CityCenter 3 Excluding the Mayweather vs Pacquiao fight in May 2015 and Canelo vs. Kahn in May 2016 Source: Company filings Pro forma growth excluding fight weekends3 RevPAR1 Trends MGM Resorts Las Vegas Strip Resorts2
  • 14. 13 MGM Has Meaningfully Improved Margins 1 Excludes Borgata which was acquired on August 1, 2016, MGM National Harbor which opened December 8, 2016, and Other Nevada Resorts (Circus Circus Reno, Railroad Pass and Gold Strike Jean) which were sold in 2015 2 Excludes CityCenter resort operations Las Vegas Wholly Owned Margin2Same Store Domestic Margin1 24% 26% 30% 22% 23% 24% 25% 26% 27% 28% 29% 30% 31% 32% 2014 2015 2016 24% 26% 30% 22% 23% 24% 25% 26% 27% 28% 29% 30% 31% 32% 2014 2015 2016
  • 15. MGM Resorts Outperforms Competitors Bellagio Leads In Luxury Segment 29.6% 32.0% 29.3% 35.8% Wynn/ Encore Bellagio Wynn/ Encore Bellagio 2015 2016 Source: Company filings 1 Adjusted Property EBITDA margin is Adjusted Property EBITDA stated as a percentage of net revenue 14 Adjusted Property EBITDA Margin1
  • 16. MGM Resorts Outperforms Competitors Mandalay Bay Leads In Convention Segment 15 Adjusted Property EBITDA Margin1 20.3% 22.5% 23.1% 25.2% Venetian/ Palazzo Mandalay Bay Venetian/ Palazzo Mandalay Bay 2015 2016 Source: Company filings 1 Adjusted Property EBITDA margin is Adjusted Property EBITDA stated as a percentage of net revenue
  • 17. 16 Return On Invested Capital Case Studies
  • 18. Successful Track Record Of Return On Invested Capital 17 ➢ CityCenter ▪ MGM invested ~$2.2bn in CityCenter o $1.1bn monetization of Crystals at extremely attractive cap rate (~4%) − Provided opportunity to repay $260mm in debt & reduced leverage to < 4x o MGM’s dividends to date: $865mm1 ▪ Resulting in MGM’s Net investment in CityCenter of ~$1.38bn1 today ➢ MGM China ▪ MGM initial investment in MGM China was $341mm prior to its recent 4.95% purchase o Distributions and dividends to date of $1.4bn are approximately 4x above initial investment o MGM’s current ownership of 56% equals $4.3bn2 of value ➢ MGM Detroit ▪ MGM invested $800mm o Stabilized Adjusted Property EBITDA of ~$160mm3 ➢ T-Mobile Arena ▪ MGM invested ~$73mm and owns 42.5% of the $375mm venue o Top 3 grossing arena in its category in 2016 (only 9 months of operations) o Benefits nearby MGM properties and several ancillary revenue streams 1 Includes announced dividend of $250 million on March 24, 2017 (of which $125 million represents MGM Resorts’ 50% share) 2 Assumes HKD / USD exchange rate of 7.75 based on closing price of $15.70 on 3/24/17 3 Reflects trailing two year average
  • 19. CityCenter Case Study Return on Invested Capital 18 MGM’s investment in CityCenter is far below investor perception ➢ In 2007, MGM de-risked investment by selling 50% of CityCenter ➢ MGM invested ~$2.2bn in CityCenter ▪ $1.1bn monetization of Crystals at extremely attractive cap rate (~4%) o Provided opportunity to repay $260mm in debt o Reduced leverage to < 4x ▪ MGM’s dividends to date: $865mm1 ➢ Resulting in MGM’s net investment in CityCenter of ~$1.38bn1 ➢ Today, CityCenter is well capitalized, generating strong returns and positioned to continue returning capital to MGM in excess of cumulative earnings 1 Includes announced dividend of $250 million on March 24, 2017 (of which $125 million represents MGM Resorts’ 50% share)
  • 20. Is CityCenter Misvalued? 19 1 While the Company is referencing publicly available reports prepared by securities analysts, the Company is not endorsing or adopting the views or analysis of, or methodologies employed by, those analysts with respect to whether the valuation multiples utilized by those securities analysts is either the correct methodology or the correct multiple; rather, the Company is solely noting that if such analyst multiples were applied to 50% of CityCenter’s Adjusted EBITDA instead of CityCenter’s Income from Unconsolidated Affiliates 2 CityCenter Income From Unconsolidated Affiliates is as of 12/31/16 of $446 million less gain from the Crystals sale of $401 million plus Nevada Energy Expense of $41 million 3 Assumes 574 million shares outstanding ➢ Aria is consistently one of the top 3 performing resorts within the MGM portfolio ➢ MGM Resorts accounts for CityCenter under the equity method of accounting as per GAAP. The result of which is Income from Unconsolidated Affiliates which represents our 50% share of operating income of CityCenter and adjusted for certain basis differences ➢ This is not a true reflection of CityCenter’s value to MGM Resorts 2016 Valuation 50% of CityCenter Adjusted EBITDA $175 x 11 = $1,925 Reported CityCenter Income From Unconsolidated Affiliates $86 x 11 = $941 Value Variance $983 Value Variance per share $1.71 Illustrative Multiple1 2 3
  • 21. MGM China Case Study Return on Invested Capital 20 ➢ MGM initial investment in MGM China was $341mm prior to its recent 4.95% purchase ▪ Distributions and dividends to date of $1.4bn are approximately 4x above initial investment ➢ In September 2016, MGM increased its ownership stake in MGM China by 4.95% via cash / stock purchase ▪ Price of MGM China at close of transaction was HK$11.98, which is well below recent closing price1 of HK$15.70 ➢ MGM’s current ownership of 56% equals $4.3bn2 of value 1 As of 3/24/17 2 Assumes HKD / USD exchange rate of 7.75 based on closing price of $15.70 on 3/24/17
  • 22. MGM Grand Detroit Case Study Return on Invested Capital 21 ➢ Total spend on current MGM Detroit permanent facility of $800mm ➢ MGM Detroit is generating stabilized Adjusted Property EBITDA of ~$160mm (reflects trailing two year average) ➢ Consistent market leader with > 40% market share
  • 23. T-Mobile Arena Case Study Return on Invested Capital 22 ➢ Developed brand new best-in-class $375 million entertainment venue ➢ MGM owns 42.5% in the T-Mobile Arena with a net investment of ~$73 million ➢ Benefits several neighboring MGM Resorts properties and offers incremental ancillary revenue streams to Casino, Hotel, F&B, Retail, Entertainment & Other ➢ Hosting first Las Vegas NHL team beginning 2017, which secures over 40 event dates excluding concerts, boxing and other events ➢ Top 3 grossing arena in its category in 2016 (only 9 months of operations)
  • 24. 23 Leverage & Trading Comparables
  • 25. 24 Historical Consolidated Leverage 2012 2016 Total Cash $1,544 $1,447 LTM Adjusted EBITDA related to: Domestic Resorts $1,325 $2,340 Management and other operations 10 13 MGM China 679 521 Corporate expense (excluding stock-based compensation) (216) (284) $1,799 $2,590 Recurring dividends received by MGM Resorts 22 59 $1,821 $2,649 Total Principal Amount of Debt related to: MGM Resorts Consolidated $13,598 $13,144 $13,598 $13,144 Consolidated Net Leverage Ratio 6.6x 4.4x 1 12/31/2012 includes $952 million at MGM China; 12/31/16 includes $454 million and $360 million at MGM China and MGM Growth Properties, respectively 2 Includes 12/31/16 reported Adjusted Property EBITDA plus an annualization adjustment for Borgata and MGM National Harbor for the year ended December 31, 2016 3 Represents ordinary dividends (excluding special dividends) and other regular cash distributions actually received by MGM from CityCenter and Grand Victoria. 4 12/31/12 includes $554 million at MGM China; 12/31/16 includes $1.9 billion, $3.7 billion, and $450 million at MGM China, MGM Growth Properties, and MGM National Harbor, respectively 1 2 3 4
  • 26. 2016 Credit Profile Peer Comparison MGM vs. Select Gaming Companies 25 Net Leverage1 2.0x 4.4x 4.9x 5.8x 6.7x 0.0x 1.0x 2.0x 3.0x 4.0x 5.0x 6.0x 7.0x 8.0x LVS MGM Red Rock Boyd Wynn Source: Company filings 1 Consolidated net leverage represents total indebtedness less cash and cash equivalents divided by Adjusted EBITDA.
  • 28. Source: Company filings; Maryland Gaming commission Note: Financial performance statistics combine Jan & Feb 2017 based on Maryland Gaming Commission and West Virginia Lottery reports 1 Fair share is based on total table game and slot units for the D.C. Metro peer / competitive set 2 Win per position per day; assumes 7 seats per table 3 D.C. Metro peer / competitive set includes MGM National Harbor, Maryland Live, Horseshoe Baltimore, Hollywood Perryville, Ocean Downs, Rocky Gap and Hollywood Chares Town. MGM National Harbor of $336 vs peer / competitive set total WPPD weighted by total gross gaming revenue YTD as of Feb 2017 4 As of 12/31/2016 5 Includes 39 poker tables  Cost: $1.4 billion  Location: On the Potomac River just outside of Washington D.C.  Casino: 3,241 slots and 126 tables5  Hotel: 308 rooms  Meeting & Event Space: 50,000 sq. ft. Property Highlights4  Retail and dining: 93,100 sq. ft.  Theater: 3,000 seat  Luxury spa and roof-top pool  Positioned to be one of the highest grossing facilities in the country 27 MGM National Harbor Opened December 8, 2016 Financial Performance  Average market share of ~30% vs. fair share1 of 23%  Achieved the highest table games revenue on record in January and February of 2017 for Maryland gaming  Year-to-date February 2017 total WPPD2 of $336, $40 higher than its peers3  Property is averaging over 22,000 daily visitors
  • 30. ✓ Celebrated the grand opening of the 5,200-seat theater with inaugural performances by legendary singer-songwriter Stevie Nicks and renowned rock group The Pretenders ✓ The Park Theater will play a key role in MGM’s strategy to further evolve the entertainment landscape in Las Vegas, featuring unparalleled audio and visual technology and providing intimate exposure to some of the most celebrated artists 29 ✓ The stage is set for award winning entertainers in 2017 ❖ Bruno Mars, a 17-time GRAMMY® Award nominee will take the stage in March and September ❖ Multiple GRAMMY® Award-winning artist, Ricky Martin will begin his Las Vegas residency in April ❖ The Oscar, Emmy, and GRAMMY® Award-winning Goddess of Pop, Cher will perform in February and May Park Theater at Monte Carlo Opened December 17, 2016
  • 31. 30 Park Theater at Monte Carlo
  • 32. 31 Park Theater at Monte Carlo
  • 33. Park MGM / The NoMad Las Vegas  Cost: ~$500 million  Opening Date: Late 2018  Location: Las Vegas Strip, between New York- New York, T-Mobile Arena and CityCenter  Hotel:  Park MGM: 2,700 room luxury resort conceptualized by MGM and Sydell Group conceived to target a younger, well-traveled demographic seeking unique experiences and innovative design.  NoMad Las Vegas: 292 guestrooms and suites with a dedicated drop-off lobby, swimming pool and NoMad branded gaming, eating and drinking experiences. Project Highlights Park MGM Las Vegas Boulevard NoMad Las Vegas Park Theater TropicanaAvenue Market at Park MGM Interstate 15 32
  • 34. Planned Casino Projects 1 Excludes capitalized interest and land related costs 2 Includes poker tables MGM Springfield  Cost: ~$865 million(1)  Opening Date: Late 2018  Location: 14 acres in downtown Springfield, MA  Casino: 3,000 slots and 100 tables(2) Project Highlights:  Hotel: 250 rooms  Retail and dining: 100,000 sq. .ft.  Parking garage: 3,375 spaces  Meeting & Event Space: 44,000 sq. ft. Everett Wynn Plainridge Park Twin River Newport Grand Foxwoods Mohegan Sun Other Casino Properties 50 mi – Population 3.3 million 25 mi – Population 1.2 million 33
  • 36.  Cost: $3.3 billion  Opening Date: 2nd Half of 2017  Location: 18 acre site on the Cotai Strip in Macau  Casino: capacity for up to 500 gaming tables and 1,500 slots  Hotel: 1,500 rooms  Other amenities: meeting space, high end spa, retail offerings, F&B outlets, a transformable theater, and the Spectacle as well as the first international MGM Mansion villa product for the ultimate luxury experience. Project Highlights MGM Cotai 35
  • 39. 38 Appendix Total Shareholder Return Performance Strategic Highlights – Detail
  • 40. MGM Highlights – 2014 & 2015 39 2014 ➢ Re-priced CityCenter's TLB generating annual savings of $12mm ➢ MGM issued $1.25bn of 6% Senior Notes due 2023 ➢ MGM repaid $509mm of 5.875% senior notes ➢ MGM China paid $499mm special dividend in March, $127mm final dividend in June and $137mm interim dividend in September 2015 ➢ Converted $1.45bn convertible notes to equity ➢ Closed on sale of Railroad Pass & Gold Strike Jean for net proceeds of $20mm ➢ Announced implementation of Profit Growth Plan with initial target of $300mm ➢ Closed on sale of Circus Circus Reno for net proceeds of $72mm ➢ MGM Resort’s $200mm share of the first ever $400mm special distribution from CityCenter ➢ Repayment of the $875mm senior notes ➢ Amend and extend of MGM China's Senior Credit Facility with +$1B upsize ➢ MGM China paid $400mm special dividend in March, $120mm final dividend in June and $76mm interim dividend in August
  • 41. MGM Highlights – 2016 40 ➢ Profit Growth Plan – Continued successful execution with 2017 target increased from $300mm to $400mm ➢ MGP Formation & IPO ▪ $1.2bn of proceeds was third largest US IPO of 2016 ▪ Priced at the high-end of the range ▪ 14x multiple represented a premium valuation to closest comp ▪ Strong after-market performance with MGP equity currently trading ~16% above issuance ➢ Significant MGM balance sheet improvement ▪ Consolidated net leverage below 4.5x o Lowest levels since pre-recession despite funding over $3bn in construction in progress ▪ MGP transaction resulted in two-notch upgrade from Moody’s and Fitch and a one-notch upgrade from S&P ▪ MGM raised $500mm of 10 year bonds at 4.625% - lowest long-term bond yield in MGM's history ▪ Overall reduction of ~$4bn of debt ➢ Crystals Sale for $1.1bn represents cap rate of ~4.2% ➢ Acquired BYD's 50% interest in Borgata at $1.8bn valuation (100%) & sold underlying real estate to MGP for $1.175bn ▪ Implied multiple of 8.9x at signing (8.5x at announce)
  • 42. MGM Highlights – 2016 (Continued) 41 ➢ MGM acquired 4.95% of MGM China from Pansy Ho for 7.1mm MGM shares, $100mm cash & $50mm deferred cash payment ➢ Entered into MGM National Harbor $525mm credit facility to complete construction ➢ MGP raised $500 million of 10 year bonds at 4.50% - lowest coupon in company's history ➢ Re-priced MGP's TLB generating annual savings of $13.5mm upon Moody's upgrade ➢ CityCenter Dividends - $540mm received in 2016 by MGM as a result of Crystals transaction ➢ MGM China paid $46mm final dividend in June and $58mm interim dividend in August ➢ Announced $450mm Monte Carlo rebrand initiative (with expected completion in 2018) ➢ Completed $70mm Mandalay Bay Convention expansion ➢ Successfully opened the T-Mobile Arena / MGM National Harbor / Park Theater
  • 43. 42 Appendix Total Shareholder Return Performance Strategic Highlights – Detail
  • 44. Total Shareholder Returns 43 MGM has generally outperformed industry peers on a 1,3, and 5 year basis Source: Bloomberg Note: Trailing total stock performance as of 3/24/17 1 Returns include dividends; 3-Year and 5-Year represents the compounded annual growth rate Annualized Returns1 1-Year 3-Year 5-Year MGM Resorts International 25.8% 0.3% 12.2% Las Vegas Sands 12.0% -6.5% 4.0% Wynn Resorts 22.3% -17.9% 1.3% S&P 500 Index 17.6% 10.2% 13.0%
  • 45. 1-Year Performance 44 1-Year Performance 25.8% 12.0% 22.3% 17.6% -30% -20% -10% 0% 10% 20% 30% 40% 50% Mar-16 Apr-16 May-16 Jun-16 Jul-16 Aug-16 Sep-16 Oct-16 Nov-16 Dec-16 Jan-17 Feb-17 Mar-17 MGM LVS WYNN S&P 500 Index Stock Price Stock Price 1 Year Company 3/24/2016 3/24/2017 Return(1) MGM Resorts International $20.52 $25.71 25.8% Las Vegas Sands 52.47 55.62 12.0% Wynn Resorts 93.47 111.92 22.3% S&P 500 Index 2,036 2,344 17.6% Source: Bloomberg Note: Trailing total stock performance as of 3/24/17 1 Returns include dividends
  • 46. 3-Year Performance 45 3-Year Performance 0.8% -18.4% -44.7% 33.8% -100% -80% -60% -40% -20% 0% 20% 40% 60% Mar-14 Jun-14 Sep-14 Dec-14 Mar-15 Jun-15 Sep-15 Dec-15 Mar-16 Jun-16 Sep-16 Dec-16 MGM LVS WYNN S&P 500 Index Stock Price Stock Price 3 Year Return(1) Company 3/25/2014 3/24/2017 Cumulative CAGR MGM Resorts International 25.61 $25.71 0.8% 0.3% Las Vegas Sands 78.80 55.62 -18.4% -6.5% Wynn Resorts 219.50 111.92 -44.7% -17.9% S&P 500 Index 1,866 2,344 33.8% 10.2% Source: Bloomberg Note: Trailing total stock performance as of 3/24/17 1 Returns include dividends
  • 47. 5-Year Performance 46 5-Year Performance 77.6% 21.5% 6.4% 84.1% -80% -60% -40% -20% 0% 20% 40% 60% 80% 100% 120% 140% Mar-12 Jun-12 Sep-12 Dec-12 Mar-13 Jun-13 Sep-13 Dec-13 Mar-14 Jun-14 Sep-14 Dec-14 Mar-15 Jun-15 Sep-15 Dec-15 Mar-16 Jun-16 Sep-16 Dec-16 MGM LVS WYNN S&P 500 Index Source: Bloomberg Note: Trailing total stock performance as of 3/24/17 1 Returns include dividends Stock Price Stock Price 5 Year Return(1) Company 3/26/2012 3/24/2017 Cumulative CAGR MGM Resorts International $14.54 $25.71 77.6% 12.2% Las Vegas Sands 58.83 55.62 21.5% 4.0% Wynn Resorts 130.00 111.92 6.4% 1.3% S&P 500 Index 1,417 2,344 84.1% 13.0%