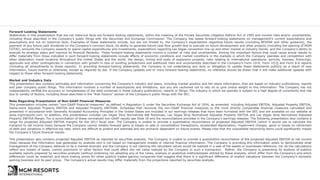
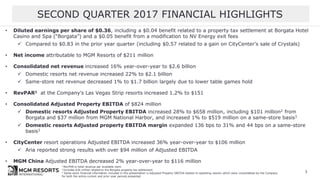
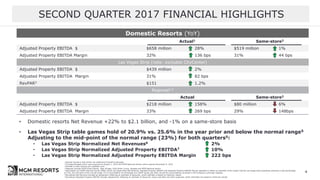
- MGM Resorts reported second quarter 2017 earnings, with diluted EPS of $0.36 including benefits from a property tax settlement and modification to exit fees. Net income was $211 million.
- Consolidated net revenue increased 16% year-over-year to $2.6 billion, with domestic resorts revenue up 22% to $2.1 billion. Same-store net revenue decreased 1% largely due to lower table games hold.
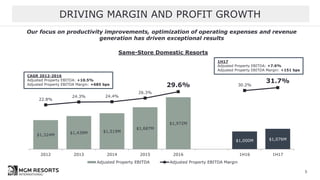
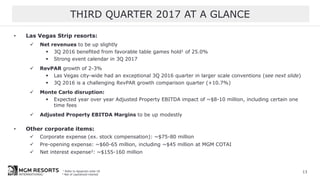
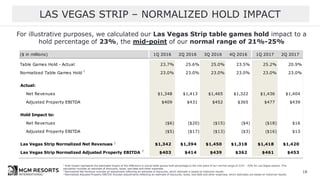
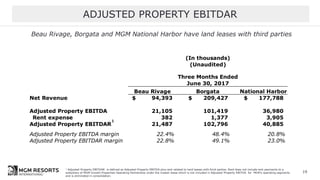
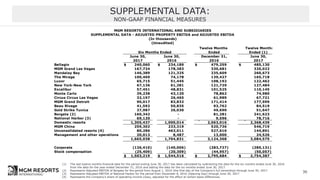
- RevPAR at Las Vegas Strip resorts increased 1.2% to $151. Consolidated Adjusted Property EBITDA was $824 million, with domestic resorts EBITDA up 28% to $658 million including contributions from Borgata and