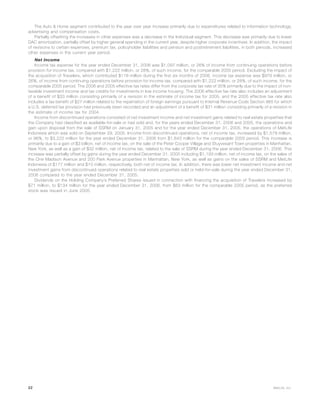
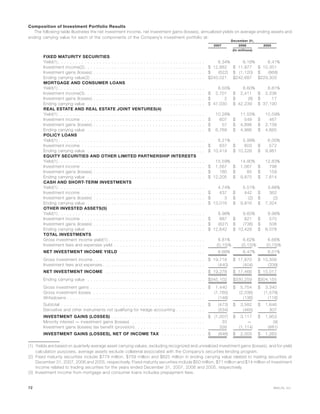
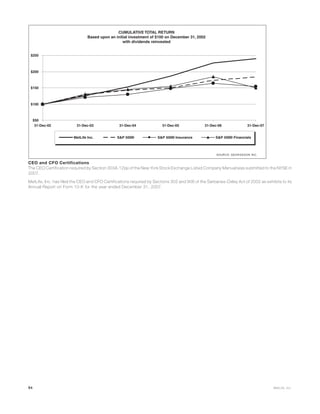
ANNUAL REPORT
MetLife, Inc. 2007
Chairman’s Letter
To My Fellow Shareholders:
This year, MetLife will commemorate its 140th anniversary. This is an impressive milestone that we are
proud to celebrate, because it serves as a testament to our strength, commitment, and long-term
perspective. For 140 years, MetLife has helped individuals and institutions build and protect their most
valuable assets. We offer our customers innovative financial solutions through a broad array of products —
life insurance, dental insurance, auto and home protection, annuities, and retirement and savings solutions.
More importantly, we promise to stand behind the guarantees in these products with the full financial
strength of MetLife. To keep the promises we make, we manage our company with discipline and plan for the
long-term.
This long-term approach has been incredibly successful for MetLife. We have grown to become the largest life insurer in the U.S., a
leading provider of employee benefits, and an expert in retirement and savings. Our understanding of customer needs and our ability to
execute on our growth plans have driven strong financial results. This was especially true in 2007.
Driving Growth
By many counts, MetLife had an outstanding year: premiums, fees and other revenues reached a record $34.8 billion; total assets grew
to $558.6 billion; and net income was strong at $4.3 billion. Across the board, all of our businesses continued to perform extremely well
and helped to make 2007 one of our best years ever.
Institutional Business achieved a record year in 2007 with nearly $14 billion in premiums, fees and other revenues. We retained our
customers through strong service, grew our existing relationships, and introduced new customers to MetLife. Today, we stand alone in the
marketplace with more than 90 of the top 100 FORTUNE 500» companies turning to MetLife for employee benefits. We have supplemented
our organic growth with acquisitions. For example, in early 2008, we completed the acquisition of SafeGuard Health Enterprises, Inc., to
augment our already strong dental offering in the key, growing markets of California, Florida, Texas, and Nevada.
We continue to see a tremendous need for solutions for individuals who are retired or approaching retirement. Our individual variable
annuity business in the U.S. had a very strong year in 2007 with a record $16.5 billion in individual annuity premiums and deposits. We
have increased our market position in this business from 11th in 2000 to 2nd at the end of 2007. Our expanding distribution reach over the
past several years, as well as the introduction of new and innovative variable annuity offerings, has enabled us to achieve this significant
growth.
Our focus on innovative products is also evident in our Auto & Home business. In 2007, we increased sales of our GrandProtect product
offering, which offers our customers complete personal insurance protection in one package. This growth in GrandProtect sales is even
more noteworthy when you consider the very competitive nature of the auto and home insurance market.
I am very pleased with the performance of our International business. This segment experienced a 16% growth in top line results, and
represents approximately 15% of our 2007 net income. International has become — and will continue to be — an important, growing
contributor to MetLife’s bottom line. We are successfully exporting our expertise outside of the U.S., and today we hold leading market
positions in several countries — including Mexico, South Korea, Chile and through our joint venture in Japan. Our efforts to expand
continue as we plant seeds for growth in a number of other countries, including China and India.
In addition to positioning MetLife’s businesses for further success, we are committed to leveraging our time-tested strengths in asset/
liability management. In a rapidly changing investment environment like the one experienced in 2007, our focus on identifying trends,
actively managing our portfolio, and consistently managing risk has been crucial. Our performance has been excellent, as evidenced by the
$19 billion in net investment income we generated during the year. The effective management of our $345 billion portfolio has enabled us to
keep the promises we make to our customers and meet the expectations you have as our shareholders.
At the same time, we continue to focus on the best ways to leverage our strong capital position at MetLife. In 2007, we repurchased
more than $1.7 billion of our common stock, announced a 25% increase in our annual common stock dividend, and grew book value to
$43.47 per share. Collectively, these actions and results demonstrate our commitment to providing value and a strong return to
shareholders.
Strong Leadership
MetLife was recently recognized by Forbes magazine as the “Best Managed Insurance Company” for 2008. I have always been proud of
our management team and the outstanding talent of our organization. Key to our success has been the MetLife Board of Directors. At this
year’s annual shareholders meeting, three members of our Board will retire. Charlie Leighton, Helene Kaplan, and Jamie Houghton have
provided many years of service and made numerous contributions to the company. I am extremely grateful for their service and wish them
well. At the same time, I am very pleased to welcome our two newest Board members — Eduardo Castro-Wright and Lulu Wang. Eduardo
has held a number of key leadership roles at several well known companies in the U.S. and in the Latin America and Asia Pacific regions.
Similarly, Lulu has had a distinguished and successful career in professional money management, including the management of assets for
pensions, endowments and mutual funds. Both Eduardo and Lulu are great additions to the MetLife Board.
As a shareholder, you should feel excited by what MetLife has accomplished and confident about our prospects. Even more important,
you should know that you have ownership in a company that continues to have a significant, positive impact on the lives of millions of
individuals around the world. We are committed to leveraging our 140 years of experience to generate further growth and managing MetLife
for the long-term.
Thank you for your continued support.
Sincerely,
C. Robert Henrikson
Chairman of the Board, President and Chief Executive Officer
MetLife, Inc.
February 28, 2008
TABLE OF CONTENTS
Page
Number
Note Regarding Forward-Looking Statements . . . . . . . . . . . . . . . . . . . . . . . . . . . . . . . . . . . . . . . . . . . . . . . . . . . . . 2
Selected Financial Data . . . . . . . . . . . . . . . . . . . . . . . . . . . . . . . . . . . . . . . . . . . . . . . . . . . . . . . . . . . . . . . . . . . 2
Management’s Discussion and Analysis of Financial Condition and Results of Operations . . . . . . . . . . . . . . . . . . . . . . . . 5
Quantitative and Qualitative Disclosures About Market Risk . . . . . . . . . . . . . . . . . . . . . . . . . . . . . . . . . . . . . . . . . . . . 85
Changes in and Disagreements With Accountants on Accounting and Financial Disclosure . . . . . . . . . . . . . . . . . . . . . . . 89
Management’s Annual Report on Internal Control Over Financial Reporting . . . . . . . . . . . . . . . . . . . . . . . . . . . . . . . . . . 89
Attestation Report of the Company’s Registered Public Accounting Firm . . . . . . . . . . . . . . . . . . . . . . . . . . . . . . . . . . . 89
Financial Statements. . . . . . . . . . . . . . . . . . . . . . . . . . . . . . . . . . . . . . . . . . . . . . . . . . . . . . . . . . . . . . . . . . . . . 91
Board of Directors . . . . . . . . . . . . . . . . . . . . . . . . . . . . . . . . . . . . . . . . . . . . . . . . . . . . . . . . . . . . . . . . . . . . . . 92
Executive Officers . . . . . . . . . . . . . . . . . . . . . . . . . . . . . . . . . . . . . . . . . . . . . . . . . . . . . . . . . . . . . . . . . . . . . . 92
Contact Information . . . . . . . . . . . . . . . . . . . . . . . . . . . . . . . . . . . . . . . . . . . . . . . . . . . . . . . . . . . . . . . . . . . . . 93
Corporate Information . . . . . . . . . . . . . . . . . . . . . . . . . . . . . . . . . . . . . . . . . . . . . . . . . . . . . . . . . . . . . . . . . . . . 93
1MetLife, Inc.
Note Regarding Forward-Looking Statements
This Annual Report, including the Management’s Discussion and Analysis of Financial Condition and Results of Operations, contains
statements which constitute forward-looking statements within the meaning of the Private Securities Litigation Reform Act of 1995,
including statements relating to trends in the operations and financial results and the business and the products of MetLife, Inc. (the
“Holding Company”) and its subsidiaries (collectively, “MetLife” or the “Company”), as well as other statements including words such as
“anticipate,” “believe,” “plan,” “estimate,” “expect,” “intend” and other similar expressions. Forward-looking statements are made based
upon management’s current expectations and beliefs concerning future developments and their potential effects on MetLife, Inc. and its
subsidiaries. Such forward-looking statements are not guarantees of future performance. See “Management’s Discussion and Analysis of
Financial Condition and Results of Operations.”
Selected Financial Data
The following selected financial data has been derived from the Company’s audited consolidated financial statements. The statement of
income data for the years ended December 31, 2007, 2006 and 2005 and the balance sheet data as of December 31, 2007 and 2006
have been derived from the Company’s audited financial statements included elsewhere herein. The statement of income data for the years
ended December 31, 2004 and 2003 and the balance sheet data as of December 31, 2005, 2004 and 2003 have been derived from the
Company’s audited financial statements not included herein. The selected financial data set forth below should be read in conjunction with
“Management’s Discussion and Analysis of Financial Condition and Results of Operations” and the consolidated financial statements and
related notes included elsewhere herein. Some previously reported amounts have been reclassified to conform with the presentation at
and for the year ended December 31, 2007.
2007 2006 2005 2004 2003
Years Ended December 31,
(In millions)
Statement of Income Data(1)
Revenues(2)(3):
Premiums . . . . . . . . . . . . . . . . . . . . . . . . . . . . . . . . . . . . . . . . . . . . . . $27,895 $26,412 $24,860 $22,200 $20,575
Universal life and investment-type product policy fees . . . . . . . . . . . . . . . . . 5,311 4,780 3,828 2,867 2,495
Net investment income . . . . . . . . . . . . . . . . . . . . . . . . . . . . . . . . . . . . . 19,006 17,082 14,756 12,261 11,373
Other revenues . . . . . . . . . . . . . . . . . . . . . . . . . . . . . . . . . . . . . . . . . . 1,533 1,362 1,271 1,198 1,199
Net investment gains (losses) . . . . . . . . . . . . . . . . . . . . . . . . . . . . . . . . . (738) (1,382) (86) 175 (551)
Total revenues . . . . . . . . . . . . . . . . . . . . . . . . . . . . . . . . . . . . . . 53,007 48,254 44,629 38,701 35,091
Expenses(2)(3):
Policyholder benefits and claims . . . . . . . . . . . . . . . . . . . . . . . . . . . . . . . 27,828 26,431 25,506 22,662 20,811
Interest credited to policyholder account balances . . . . . . . . . . . . . . . . . . . 5,741 5,171 3,887 2,997 3,035
Policyholder dividends. . . . . . . . . . . . . . . . . . . . . . . . . . . . . . . . . . . . . . 1,726 1,701 1,679 1,666 1,731
Other expenses . . . . . . . . . . . . . . . . . . . . . . . . . . . . . . . . . . . . . . . . . . 11,673 10,783 9,264 7,813 7,168
Total expenses . . . . . . . . . . . . . . . . . . . . . . . . . . . . . . . . . . . . . . 46,968 44,086 40,336 35,138 32,745
Income from continuing operations before provision for income tax . . . . . . . . . 6,039 4,168 4,293 3,563 2,346
Provision for income tax(2) . . . . . . . . . . . . . . . . . . . . . . . . . . . . . . . . . . . 1,759 1,097 1,222 991 580
Income from continuing operations . . . . . . . . . . . . . . . . . . . . . . . . . . . . . 4,280 3,071 3,071 2,572 1,766
Income from discontinued operations, net of income tax(2) . . . . . . . . . . . . . . 37 3,222 1,643 272 477
Income before cumulative effect of a change in accounting, net of income tax. . 4,317 6,293 4,714 2,844 2,243
Cumulative effect of a change in accounting, net of
income tax(3) . . . . . . . . . . . . . . . . . . . . . . . . . . . . . . . . . . . . . . . . . . — — — (86) (26)
Net income . . . . . . . . . . . . . . . . . . . . . . . . . . . . . . . . . . . . . . . . . . . . . 4,317 6,293 4,714 2,758 2,217
Preferred stock dividends . . . . . . . . . . . . . . . . . . . . . . . . . . . . . . . . . . . 137 134 63 — —
Charge for conversion of company-obligated mandatorily redeemable securities
of a subsidiary trust . . . . . . . . . . . . . . . . . . . . . . . . . . . . . . . . . . . . . . — — — — 21
Net income available to common shareholders . . . . . . . . . . . . . . . . . . . . . . $ 4,180 $ 6,159 $ 4,651 $ 2,758 $ 2,196
2 MetLife, Inc.
2007 2006 2005 2004 2003
December 31,
(In millions)
Balance Sheet Data(1)
Assets:
General account assets . . . . . . . . . . . . . . . . . . . . . . . . . . . . . . . $398,403 $383,350 $353,776 $270,039 $251,085
Separate account assets . . . . . . . . . . . . . . . . . . . . . . . . . . . . . . 160,159 144,365 127,869 86,769 75,756
Total assets(2) . . . . . . . . . . . . . . . . . . . . . . . . . . . . . . . . . . . . $558,562 $527,715 $481,645 $356,808 $326,841
Liabilities:
Life and health policyholder liabilities(4) . . . . . . . . . . . . . . . . . . . . . $278,246 $267,146 $257,258 $193,612 $177,947
Property and casualty policyholder
liabilities(4) . . . . . . . . . . . . . . . . . . . . . . . . . . . . . . . . . . . . . . 3,324 3,453 3,490 3,180 2,943
Short-term debt . . . . . . . . . . . . . . . . . . . . . . . . . . . . . . . . . . . . 667 1,449 1,414 1,445 3,642
Long-term debt . . . . . . . . . . . . . . . . . . . . . . . . . . . . . . . . . . . . 9,628 9,129 9,489 7,412 5,703
Collateral financing arrangements . . . . . . . . . . . . . . . . . . . . . . . . . 5,732 850 — — —
Junior subordinated debt securities . . . . . . . . . . . . . . . . . . . . . . . 4,474 3,780 2,533 — —
Payables for collateral under securities loaned and other
transactions . . . . . . . . . . . . . . . . . . . . . . . . . . . . . . . . . . . . . 44,136 45,846 34,515 28,678 27,083
Other . . . . . . . . . . . . . . . . . . . . . . . . . . . . . . . . . . . . . . . . . . . 17,017 17,899 15,976 12,888 12,618
Separate account liabilities . . . . . . . . . . . . . . . . . . . . . . . . . . . . . 160,159 144,365 127,869 86,769 75,756
Total liabilities(2) . . . . . . . . . . . . . . . . . . . . . . . . . . . . . . . . . . 523,383 493,917 452,544 333,984 305,692
Stockholders’ Equity
Preferred stock, at par value . . . . . . . . . . . . . . . . . . . . . . . . . . . . 1 1 1 — —
Common stock, at par value . . . . . . . . . . . . . . . . . . . . . . . . . . . . 8 8 8 8 8
Additional paid-in capital . . . . . . . . . . . . . . . . . . . . . . . . . . . . . . 17,098 17,454 17,274 15,037 14,991
Retained earnings(5) . . . . . . . . . . . . . . . . . . . . . . . . . . . . . . . . . 19,884 16,574 10,865 6,608 4,193
Treasury stock, at cost . . . . . . . . . . . . . . . . . . . . . . . . . . . . . . . . (2,890) (1,357) (959) (1,785) (835)
Accumulated other comprehensive income(6) . . . . . . . . . . . . . . . . . 1,078 1,118 1,912 2,956 2,792
Total stockholders’ equity. . . . . . . . . . . . . . . . . . . . . . . . . . . . . 35,179 33,798 29,101 22,824 21,149
Total liabilities and stockholders’ equity . . . . . . . . . . . . . . . . . . . . $558,562 $527,715 $481,645 $356,808 $326,841
2007 2006 2005 2004 2003
Years Ended December 31,
Other Data(1)
Net income available to common shareholders . . . . . . . . . . . . . . . . . . . . . . . . . $4,180 $6,159 $4,651 $2,758 $2,196
Return on common equity(7) . . . . . . . . . . . . . . . . . . . . . . . . . . . . . . . . . . . . 13.0% 21.9% 18.5% 12.5% 11.4%
Return on common equity, excluding accumulated other comprehensive income . . . 13.2% 22.6% 20.4% 14.4% 13.0%
EPS Data(1)
Income from Continuing Operations Available to Common Shareholders Per
Common Share
Basic . . . . . . . . . . . . . . . . . . . . . . . . . . . . . . . . . . . . . . . . . . . . . . . . . . . $ 5.57 $ 3.85 $ 4.02 $ 3.43 $ 2.36
Diluted . . . . . . . . . . . . . . . . . . . . . . . . . . . . . . . . . . . . . . . . . . . . . . . . . . $ 5.44 $ 3.81 $ 3.98 $ 3.41 $ 2.34
Income (loss) from Discontinued Operations Per Common Share
Basic . . . . . . . . . . . . . . . . . . . . . . . . . . . . . . . . . . . . . . . . . . . . . . . . . . . $ 0.05 $ 4.24 $ 2.19 $ 0.35 $ 0.65
Diluted . . . . . . . . . . . . . . . . . . . . . . . . . . . . . . . . . . . . . . . . . . . . . . . . . . $ 0.04 $ 4.18 $ 2.18 $ 0.35 $ 0.64
Cumulative Effect of a Change in Accounting Per Common Share(3)
Basic . . . . . . . . . . . . . . . . . . . . . . . . . . . . . . . . . . . . . . . . . . . . . . . . . . . $ — $ — $ — $ (0.11) $ (0.04)
Diluted . . . . . . . . . . . . . . . . . . . . . . . . . . . . . . . . . . . . . . . . . . . . . . . . . . $ — $ — $ — $ (0.11) $ (0.04)
Net Income Available to Common Shareholders Per Common Share
Basic . . . . . . . . . . . . . . . . . . . . . . . . . . . . . . . . . . . . . . . . . . . . . . . . . . . $ 5.62 $ 8.09 $ 6.21 $ 3.67 $ 2.97
Diluted . . . . . . . . . . . . . . . . . . . . . . . . . . . . . . . . . . . . . . . . . . . . . . . . . . $ 5.48 $ 7.99 $ 6.16 $ 3.65 $ 2.94
Dividends Declared Per Common Share . . . . . . . . . . . . . . . . . . . . . . . . . . . $ 0.74 $ 0.59 $ 0.52 $ 0.46 $ 0.23
(1) On July 1, 2005, the Company acquired Travelers. The 2005 selected financial data includes total revenues and total expenses of
$966 million and $577 million, respectively, from the date of the acquisition. See “Management’s Discussion and Analysis of Financial
Condition and Results of Operations — Acquisitions and Dispositions.”
(2) Discontinued Operations:
3MetLife, Inc.
Real Estate
In accordance with Statement of Financial Accounting Standards (“SFAS”) No. 144, Accounting for the Impairment or Disposal of
Long-Lived Assets (“SFAS 144”), income related to real estate sold or classified as held-for-sale for transactions initiated on or after
January 1, 2002 is presented as discontinued operations. The following information presents the components of income from
discontinued real estate operations:
2007 2006 2005 2004 2003
Years Ended December 31,
(In millions)
Investment income . . . . . . . . . . . . . . . . . . . . . . . . . . . . . . . . . . $ 59 $ 276 $ 435 $ 690 $ 763
Investment expense . . . . . . . . . . . . . . . . . . . . . . . . . . . . . . . . . (43) (182) (273) (418) (452)
Net investment gains (losses) . . . . . . . . . . . . . . . . . . . . . . . . . . . 13 4,795 2,125 146 420
Total revenues . . . . . . . . . . . . . . . . . . . . . . . . . . . . . . . . . . . 29 4,889 2,287 418 731
Interest expense . . . . . . . . . . . . . . . . . . . . . . . . . . . . . . . . . . . — — — 13 4
Provision for income tax . . . . . . . . . . . . . . . . . . . . . . . . . . . . . . 11 1,727 813 143 266
Income from discontinued operations, net of income tax . . . . . . . . $ 18 $3,162 $1,474 $ 262 $ 461
Operations
In September 2007, September 2005 and January 2005, the Company sold its MetLife Insurance Limited (“MetLife Australia”)
annuities and pension businesses, P.T. Sejahtera (“MetLife Indonesia”) and SSRM Holdings, Inc. (“SSRM”), respectively. In accordance
with SFAS 144, the assets, liabilities and operations of MetLife Indonesia, SSRM and MetLife Australia have been reclassified into
discontinued operations for all years presented. The following tables present these discontinued operations:
2007 2006 2005 2004 2003
Years Ended December 31,
(In millions)
Revenues . . . . . . . . . . . . . . . . . . . . . . . . . . . . . . . . . . . . . . . . $71 $ 100 $ 74 $333 $235
Expenses . . . . . . . . . . . . . . . . . . . . . . . . . . . . . . . . . . . . . . . . . 58 89 89 310 206
Income before provision for income tax . . . . . . . . . . . . . . . . . . . . . 13 11 (15) 23 29
Provision for income tax . . . . . . . . . . . . . . . . . . . . . . . . . . . . . . . 4 3 (2) 13 13
Income (loss) from discontinued operations, net of income tax . . . . . 9 8 (13) 10 16
Net investment gains, net of income tax . . . . . . . . . . . . . . . . . . . . . 10 52 182 — —
Income from discontinued operations, net of income tax . . . . . . . . . $19 $ 60 $ 169 $ 10 $ 16
2006 2005 2004 2003
December 31,
(In millions)
General account assets . . . . . . . . . . . . . . . . . . . . . . . . . . . . . . . $1,563 $1,621 $410 $210
Total assets . . . . . . . . . . . . . . . . . . . . . . . . . . . . . . . . . . . . . . $1,563 $1,621 $410 $210
Life and health policyholder liabilities(4) . . . . . . . . . . . . . . . . . . . . . $1,595 $1,622 $ 24 $ 17
Short-term debt. . . . . . . . . . . . . . . . . . . . . . . . . . . . . . . . . . . . . — — 19 —
Other . . . . . . . . . . . . . . . . . . . . . . . . . . . . . . . . . . . . . . . . . . . — — 225 73
Total liabilites . . . . . . . . . . . . . . . . . . . . . . . . . . . . . . . . . . . . . $1,595 $1,622 $268 $ 90
(3) The cumulative effect of a change in accounting, net of income tax, of $86 million for the year ended December 31, 2004, resulted from
the adoption of SOP 03-1, Accounting and Reporting by Insurance Enterprises for Certain Nontraditional Long-Duration Contracts and for
Separate Accounts. The cumulative effect of a change in accounting, net of income tax, of $26 million for the year ended December 31,
2003, resulted from the adoption of SFAS No. 133 Implementation Issue No. B36, Embedded Derivatives: Modified Coinsurance
Arrangements and Debt Instruments That Incorporate Credit Risk Exposures That Are Unrelated or Only Partially Related to the
Creditworthiness of the Obligor under Those Instruments.
(4) Policyholder liabilities include future policy benefits, other policyholder funds and bank deposits. The life and health policyholder liabilities
also include policyholder account balances, policyholder dividends payable and the policyholder dividend obligation.
(5) The cumulative effect of changes in accounting, net of income tax, of $329 million, which decreased retained earnings at January 1, 2007,
resulted from $292 million related to the adoption of SOP 05-1, Accounting by Insurance Enterprises for Deferred Acquisition Costs in
Connection with Modifications or Exchanges of Insurance Contracts, and $37 million related to the adoption of Financial Accounting
Standards Board Interpretation No. 48, Accounting for Uncertainty in Income Taxes — An Interpretation of FASB Statement No. 109.
(6) The cumulative effect of a change in accounting, net of income tax, of $744 million resulted from the adoption of SFAS No. 158,
Employers’ Accounting for Defined Benefit Pension and Other Postretirement Plans, and decreased accumulated other comprehensive
income at December 31, 2006.
(7) Return on common equity is defined as net income available to common shareholders divided by average common stockholders’ equity.
4 MetLife, Inc.
Management’s Discussion and Analysis of Financial Condition and Results of Operations
For purposes of this discussion, “MetLife” or the “Company” refers to MetLife, Inc., a Delaware corporation incorporated in 1999 (the
“Holding Company”), and its subsidiaries, including Metropolitan Life Insurance Company (“MLIC”). Following this summary is a discussion
addressing the consolidated results of operations and financial condition of the Company for the periods indicated. This discussion should
be read in conjunction with the forward-looking statement information included below, “Risk Factors” contained in MetLife Inc.’s Annual
Report on Form 10-K for the year ended December 31, 2007, “Selected Financial Data” and the Company’s consolidated financial
statements included elsewhere herein.
This Management’s Discussion and Analysis of Financial Condition and Results of Operations contains statements which constitute
forward-looking statements within the meaning of the Private Securities Litigation Reform Act of 1995, including statements relating to
trends in the operations and financial results and the business and the products of MetLife, Inc. and its subsidiaries, as well as other
statements including words such as “anticipate,” “believe,” “plan,” “estimate,” “expect,” “intend” and other similar expressions. Forward-
looking statements are made based upon management’s current expectations and beliefs concerning future developments and their
potential effects on the Company. Such forward-looking statements are not guarantees of future performance.
Actual results may differ materially from those included in the forward-looking statements as a result of risks and uncertainties including,
but not limited to, the following: (i) changes in general economic conditions, including the performance of financial markets and interest
rates, which may affect the Company’s ability to raise capital; (ii) heightened competition, including with respect to pricing, entry of new
competitors, the development of new products by new and existing competitors and for personnel; (iii) investment losses and defaults, and
changes to investment valuations; (iv) unanticipated changes in industry trends; (v) catastrophe losses; (vi) ineffectiveness of risk
management policies and procedures; (vii) changes in accounting standards, practices and/or policies; (viii) changes in assumptions
related to deferred policy acquisition costs (“DAC”), value of business acquired (“VOBA”) or goodwill; (ix) discrepancies between actual
claims experience and assumptions used in setting prices for the Company’s products and establishing the liabilities for the Company’s
obligations for future policy benefits and claims; (x) discrepancies between actual experience and assumptions used in establishing
liabilities related to other contingencies or obligations; (xi) adverse results or other consequences from litigation, arbitration or regulatory
investigations; (xii) downgrades in the Company’s and its affiliates’ claims paying ability, financial strength or credit ratings; (xiii) regulatory,
legislative or tax changes that may affect the cost of, or demand for, the Company’s products or services; (xiv) MetLife, Inc.’s primary
reliance, as a holding company, on dividends from its subsidiaries to meet debt payment obligations and the applicable regulatory
restrictions on the ability of the subsidiaries to pay such dividends; (xv) deterioration in the experience of the “closed block” established in
connection with the reorganization of MLIC; (xvi) economic, political, currency and other risks relating to the Company’s international
operations; (xvii) the effects of business disruption or economic contraction due to terrorism or other hostilities; (xviii) the Company’s ability
to identify and consummate on successful terms any future acquisitions, and to successfully integrate acquired businesses with minimal
disruption; and (xix) other risks and uncertainties described from time to time in MetLife’s filings with the U.S. Securities and Exchange
Commission (“SEC”).
The Company specifically disclaims any obligation to update or revise any forward-looking statement, whether as a result of new
information, future developments or otherwise.
Executive Summary
MetLife is a leading provider of insurance and other financial services with operations throughout the United States and the regions of
Latin America, Europe, and Asia Pacific. Through its domestic and international subsidiaries and affiliates, MetLife offers life insurance,
annuities, automobile and homeowners insurance, retail banking and other financial services to individuals, as well as group insurance,
reinsurance and retirement & savings products and services to corporations and other institutions. MetLife is organized into five operating
segments: Institutional, Individual, Auto & Home, International and Reinsurance, as well as Corporate & Other.
The management’s discussion and analysis which follows isolates, in order to be meaningful, the results of the acquisition of The
Travelers Insurance Company, excluding certain assets, most significantly, Primerica, from Citigroup Inc. (“Citigroup”), and substantially all
of Citigroup’s international insurance businesses (collectively, “Travelers”) in the period over period comparison as the Travelers acquisition
was not included in the results of the Company until July 1, 2005. The Travelers’ amounts which have been isolated represent the results of
the Travelers legal entities which have been acquired. These amounts represent the impact of the Travelers acquisition; however, as
business currently transacted through the acquired Travelers legal entities is transitioned to legal entities already owned by the Company,
some of which has already occurred, the identification of the Travelers legal entity business will not necessarily be indicative of the impact
of the Travelers acquisition on the results of the Company.
As a part of the Travelers acquisition, management realigned certain products and services within several of the Company’s segments
to better conform to the way it manages and assesses its business. Accordingly, all prior period segment results have been adjusted to
reflect such product reclassifications. Also in connection with the Travelers acquisition, management has utilized its economic capital
model to evaluate the deployment of capital based upon the unique and specific nature of the risks inherent in the Company’s existing and
newly acquired businesses and has adjusted such allocations based upon this model.
Year ended December 31, 2007 compared with the year ended December 31, 2006
The Company reported $4,180 million in net income available to common shareholders and earnings per diluted common share of
$5.48 for the year ended December 31, 2007 compared to $6,159 million in net income available to common shareholders and earnings
per diluted common share of $7.99 for the year ended December 31, 2006. Net income available to common shareholders decreased by
$1,979 million, or 32%, for the year ended December 31, 2007 compared to the 2006 period.
The decrease in net income available to common shareholders was primarily due to a decrease in income from discontinued operations
of $3,185 million, net of income tax. This decrease in income from discontinued operations was principally driven by a gain of $3 billion, net
of income tax, on the sale of the Peter Cooper Village and Stuyvesant Town properties in Manhattan, New York, that was recognized during
the year ended December 31, 2006. Also contributing to the decrease was lower net investment income and net investment gains (losses)
from discontinued operations related to real estate properties sold or held-for-sale during the year ended December 31, 2007 as compared
to the year ended December 31, 2006. In addition, there was lower income from discontinued operations related to the sale of MetLife
Insurance Limited (“MetLife Australia”) annuities and pension businesses to a third party in the third quarter of 2007 and lower income from
5MetLife, Inc.
discontinued operations related to the sale of SSRM Holdings, Inc. (“SSRM”) resulting from a reduction in additional proceeds from the sale
received during the year ended December 31, 2007 as compared to the year December 31, 2006.
An increase in other expenses of $579 million, net of income tax, decreased net income available to common shareholders. The
increase in other expenses was primarily due to higher DAC amortization resulting from business growth, lower net investment losses in the
current year and the net impact of revisions to management’s assumption used to determine estimated gross profits and margins in both
years. In addition, other expenses increased due to higher compensation, higher interest expense on debt and interest on tax contin-
gencies, higher minority interest expense, the net impact of revisions to certain liabilities in both periods, asset write-offs, higher general
spending and expenses related to growth initiatives, partially offset by lower legal costs and integration costs incurred in the prior year.
An increase in interest credited to policyholder account balances associated with an increase in the average policyholder account
balance decreased net income available to common shareholders by $371 million, net of income tax.
Partially offsetting the decrease in net income available to common shareholders was an increase in net investment income of
$1,251 million, net of income tax, primarily due to an increase in the average asset base and an increase in yields. Growth in the average
asset base was primarily within fixed maturity securities, mortgage loans, real estate joint ventures, and other limited partnership interests.
Higher yields was primarily due to higher returns on fixed maturity securities, other limited partnership interests excluding hedge funds,
equity securities and improved securities lending results, partially offset by lower returns on real estate joint ventures, cash, cash
equivalents and short-term investments, hedge funds and mortgage loans. Management anticipates that investment income and the
related yields on other limited partnership interests may decline during 2008 due to increased volatility in the equity and credit markets
during 2007.
Additionally, there was a decrease in net investment losses of $419 million, net of income tax, primarily due to a reduction of losses on
fixed maturity securities resulting principally from the 2006 portfolio repositioning in a rising interest rate environment, increased gains from
asset-based foreign currency transactions due to a decline in the U.S. dollar year over year against several major currencies and increased
gains on equity securities, partially offset by increased losses from the mark-to-market on derivatives and reduced gains on real estate and
real estate joint ventures.
The net effect of increases in premiums, fees and other revenues of $1,420 million, net of income tax, across all of the Company’s
operating segments and increases in policyholder benefit and claims and policyholder dividends of $924 million, net of income tax, was
attributable to overall business growth and increased net income available to common shareholders.
The remainder of the variance is due to the change in effective tax rates between periods.
Year ended December 31, 2006 compared with the year ended December 31, 2005
The Company reported $6,159 million in net income available to common shareholders and diluted earnings per common share of
$7.99 for the year ended December 31, 2006 compared to $4,651 million in net income available to common shareholders and diluted
earnings per common share of $6.16 for the year ended December 31, 2005. Excluding the acquisition of Travelers, which contributed
$317 million during the first six months of 2006 to the year over year increase, net income available to common shareholders increased by
$1,191 million for the year ended December 31, 2006 compared to the 2005 period.
Income from discontinued operations consisted of net investment income and net investment gains related to real estate properties that
the Company had classified as available-for-sale or had sold and, for the years ended December 31, 2006 and 2005, the operations and
gain upon disposal from the sale of SSRM on January 31, 2005 and for the year ended December 31, 2005, the operations of P.T. Sejahtera
(“MetLife Indonesia”) which was sold on September 29, 2005. Income from discontinued operations, net of income tax, increased by
$1,579 million, or 96%, to $3,222 million for the year ended December 31, 2006 from $1,643 million for the comparable 2005 period. This
increase was primarily due to a gain of $3 billion, net of income tax, on the sale of the Peter Cooper Village and Stuyvesant Town properties
in Manhattan, New York, as well as a gain of $32 million, net of income tax, related to the sale of SSRM during the year ended December 31,
2006. This increase was partially offset by gains during the year ended December 31, 2005 including $1,193 million, net of income tax, on
the sales of the One Madison Avenue and 200 Park Avenue properties in Manhattan, New York, as well as gains on the sales of SSRM and
MetLife Indonesia of $177 million and $10 million, respectively, both net of income tax. In addition, there was lower net investment income
and net investment gains from discontinued operations related to other real estate properties sold or held-for-sale during the year ended
December 31, 2006 compared to the year ended December 31, 2005.
Net investment losses increased by $842 million, net of income tax, to a loss of $898 million, net of income tax, for the year ended
December 31, 2006 from a loss of $56 million, net of income tax, for the comparable 2005 period. Excluding the impact of the acquisition
of Travelers, which contributed a loss of $191 million, net of income tax, during the first six months of 2006 to the year over year increase,
net investment losses increased by $651 million. The increase in net investment losses was due to a combination of losses from the mark-
to-market on derivatives and foreign currency transaction losses during 2006, largely driven by increases in U.S. interest rates and the
weakening of the dollar against the major currencies the Company hedges, notably the euro and pound sterling.
Dividends on the Holding Company’s Series A preferred shares and Series B preferred shares (“Preferred Shares”) issued in connection
with financing the acquisition of Travelers increased by $71 million, to $134 million for the year ended December 31, 2006, from $63 million
for the comparable 2005 period, as the preferred stock was issued in June 2005.
The remainder of the increase of $334 million in net income available to common shareholders for the year ended December 31, 2006
compared to the 2005 period was primarily due to an increase in premiums, fees and other revenues attributable to continued business
growth across all of the Company’s operating segments. Also contributing to the increase was higher net investment income primarily due
to an overall increase in the asset base, an increase in fixed maturity security yields, improved results on real estate and real estate joint
ventures, mortgage loans, and other limited partnership interests, as well as higher short-term interest rates on cash equivalents and short-
term investments. These increases were partially offset by a decline in net investment income from securities lending results, and bond and
commercial mortgage prepayment fees. Favorable underwriting results for the year ended December 31, 2006 were partially offset by a
decrease in net interest margins. These increases were partially offset by an increase in expenses primarily due to higher interest expense
on debt, increased general spending, higher compensation and commission costs and higher expenses related to growth initiatives and
information technology projects, partially offset by a reduction in Travelers’ integration expenses, principally corporate incentives.
6 MetLife, Inc.
Acquisitions and Dispositions
On August 31, 2007, MetLife Australia completed the sale of its annuities and pension businesses to a third party for $25 million in cash
consideration, resulting in a gain upon disposal of $41 million, net of income tax, which was adjusted in the fourth quarter of 2007 for
additional transaction costs. The Company reclassified the assets and liabilities of the annuities and pension businesses within MetLife
Australia, which is reported in the International segment, to assets and liabilities of subsidiaries held-for-sale and the operations of the
business to discontinued operations for all periods presented. Included within the assets to be sold were certain fixed maturity securities in
a loss position for which the Company recognized a net investment loss on a consolidated basis of $59 million, net of income tax, for the
year ended December 31, 2007, because the Company no longer had the intent to hold such securities.
On June 28, 2007, the Company acquired the remaining 50% interest in a joint venture in Hong Kong, MetLife Fubon Limited (“MetLife
Fubon”), for $56 million in cash, resulting in MetLife Fubon becoming a consolidated subsidiary of the Company. The transaction was
treated as a step acquisition, and at June 30, 2007, total assets and liabilities of MetLife Fubon of $839 million and $735 million,
respectively, were included in the Company’s consolidated balance sheet. The Company’s investment for the initial 50% interest in MetLife
Fubon was $48 million. The Company used the equity method of accounting for such investment in MetLife Fubon. The Company’s share
of the joint venture’s results for the six months ended June 30, 2007, was a loss of $3 million. The fair value of the assets acquired and the
liabilities assumed in the step acquisition at June 30, 2007, was $427 million and $371 million, respectively. No additional goodwill was
recorded as a part of the step acquisition. As a result of this acquisition, additional VOBA and value of distribution agreements of $45 million
and $5 million, respectively, were recorded and both have a weighted average amortization period of 16 years.
On June 1, 2007, the Company completed the sale of its Bermuda insurance subsidiary, MetLife International Insurance, Ltd. (“MLII”), to
a third party for $33 million in cash consideration, resulting in a gain upon disposal of $3 million, net of income tax. The net assets of MLII at
disposal were $27 million. A liability of $1 million was recorded with respect to a guarantee provided in connection with this disposition.
On September 29, 2005, the Company completed the sale of MetLife Indonesia to a third party, resulting in a gain upon disposal of
$10 million, net of income tax. As a result of this sale, the Company recognized income (loss) from discontinued operations of $5 million,
net of income tax, for the year ended December 31, 2005. The Company reclassified the operations of MetLife Indonesia into discontinued
operations for all years presented.
On September 1, 2005, the Company completed the acquisition of CitiStreet Associates, a division of CitiStreet LLC, which is primarily
involved in the distribution of annuity products and retirement plans to the education, healthcare, and not-for-profit markets, for $56 million,
of which $2 million was allocated to goodwill and $54 million to other identifiable intangibles, specifically the value of customer relationships
acquired, which have a weighted average amortization period of 16 years. CitiStreet Associates was integrated with MetLife Resources, a
focused distribution channel of MetLife, which is dedicated to provide retirement plans and financial services to the same markets.
On July 1, 2005, the Company completed the acquisition of Travelers for $12.1 billion. The results of Travelers’ operations were
included in the Company’s financial statements beginning July 1, 2005. As a result of the acquisition, management of the Company
increased significantly the size and scale of the Company’s core insurance and annuity products and expanded the Company’s presence in
both the retirement & savings’ domestic and international markets. The distribution agreements executed with Citigroup as part of the
acquisition provide the Company with one of the broadest distribution networks in the industry.
The initial consideration paid in 2005 by the Company for the acquisition consisted of $10.9 billion in cash and 22,436,617 shares of
the Holding Company’s common stock with a market value of $1.0 billion to Citigroup and $100 million in other transaction costs.
Additional consideration of $115 million was paid by the Holding Company to Citigroup in 2006 as a result of the finalization by both parties
of their review of the June 30, 2005 financial statements and final resolution as to the interpretation of the provisions of the acquisition
agreement. In addition to cash on-hand, the purchase price was financed through the issuance of common stock, debt securities,
common equity units and preferred stock. See “— Liquidity and Capital Resources — The Holding Company — Liquidity Sources.”
On January 31, 2005, the Company completed the sale of SSRM to a third party for $328 million in cash and stock. The Company
reported the operations of SSRM in discontinued operations. Under the terms of the sale agreement, MetLife will have an opportunity to
receive additional payments based on, among other things, certain revenue retention and growth measures. The purchase price is also
subject to reduction over five years, depending on retention of certain MetLife-related business. Also under the terms of such agreement,
MetLife had the opportunity to receive additional consideration for the retention of certain customers for a specific period in 2005. Upon
finalization of the computation, the Company received payments of $30 million, net of income tax, in the second quarter of 2006 and
$12 million, net of income tax, in the fourth quarter of 2005 due to the retention of these specific customer accounts. In the first quarter of
2007, the Company received a payment of $16 million, net of income tax, as a result of the revenue retention and growth measure
provision in the sales agreement. In the fourth quarter of 2007, the Company accrued a liability for $2 million, net of income tax, related to
the termination of certain MetLife-related business. In the fourth quarter of 2006, the Company eliminated $4 million of a liability that was
previously recorded with respect to the indemnities provided in connection with the sale of SSRM, resulting in a benefit to the Company of
$2 million, net of income tax. The Company believes that future payments relating to these indemnities are not probable.
See “— Subsequent Events” for information on the Company’s acquisitions subsequent to December 31, 2007.
Industry Trends
The Company’s segments continue to be influenced by a variety of trends that affect the industry.
Financial and Economic Environment. During 2007, the global capital markets reassessed the credit risk inherent in sub-prime
mortgages. This reassessment led to a fairly broad repricing of all credit risk assets and strained market liquidity. Global central banks
intervened to stabilize market conditions and protect against downside risks to economic growth. Still, market and economic conditions
continued to deteriorate. The economic community’s consensus outlook of global economic growth is lower for calendar year 2008, with a
sizable minority of economists forecasting a recessionary environment. The global capital markets have adjusted towards this consensus
outlook, with interest rates and equity prices falling and risk spreads widening. Slow growth and recessionary periods are often associated
with declining asset prices, lower interest rates, credit rating agency downgrades and increasing default losses. The global capital markets
are also less liquid now than in more normal environments. Liquidity conditions impact the cost of purchasing and selling assets and, at
times, the ability to purchase or sell assets. These adjustments in the global capital markets have also resulted in higher realized and
expected volatility.
7MetLife, Inc.
As expectations for global economic growth are lowered, factors such as consumer spending, business investment, government
spending, the volatility and strength of the capital markets, and inflation all affect the business and economic environment and, ultimately,
the amount and profitability of the business we conduct. In an economic downturn characterized by higher unemployment, lower family
income, lower corporate earnings, lower business investment and lower consumer spending, the demand for financial and insurance
products could be adversely affected. Adverse changes in the economy could affect earnings negatively and have a material adverse effect
on our business, results of operations and financial condition.
Demographics. In the coming decade, a key driver shaping the actions of the life insurance industry will be the rising income
protection, wealth accumulation and needs of the retiring Baby Boomers. As a result of increasing longevity, retirees will need to
accumulate sufficient savings to finance retirements that may span 30 or more years. Helping the Baby Boomers to accumulate assets for
retirement and subsequently to convert these assets into retirement income represents an opportunity for the life insurance industry.
Life insurers are well positioned to address the Baby Boomers’ rapidly increasing need for savings tools and for income protection. The
Company believes that, among life insurers, those with strong brands, high financial strength ratings and broad distribution, are best
positioned to capitalize on the opportunity to offer income protection products to Baby Boomers.
Moreover, the life insurance industry’s products and the needs they are designed to address are complex. The Company believes that
individuals approaching retirement age will need to seek information to plan for and manage their retirements and that, in the workplace, as
employees take greater responsibility for their benefit options and retirement planning, they will need information about their possible
individual needs. One of the challenges for the life insurance industry will be the delivery of this information in a cost effective manner.
Competitive Pressures. The life insurance industry remains highly competitive. The product development and product life-cycles have
shortened in many product segments, leading to more intense competition with respect to product features. Larger companies have the
ability to invest in brand equity, product development, technology and risk management, which are among the fundamentals for sustained
profitable growth in the life insurance industry. In addition, several of the industry’s products can be quite homogeneous and subject to
intense price competition. Sufficient scale, financial strength and financial flexibility are becoming prerequisites for sustainable growth in
the life insurance industry. Larger market participants tend to have the capacity to invest in additional distribution capability and the
information technology needed to offer the superior customer service demanded by an increasingly sophisticated industry client base.
Regulatory Changes. The life insurance industry is regulated at the state level, with some products and services also subject to federal
regulation. As life insurers introduce new and often more complex products, regulators refine capital requirements and introduce new
reserving standards for the life insurance industry. Regulations recently adopted or currently under review can potentially impact the
reserve and capital requirements of the industry. In addition, regulators have undertaken market and sales practices reviews of several
markets or products, including equity-indexed annuities, variable annuities and group products.
Pension Plans. On August 17, 2006, President Bush signed the Pension Protection Act of 2006 (“PPA”) into law. The PPA is
considered to be the most sweeping pension legislation since the adoption of the Employee Retirement Income Security Act of 1974
(“ERISA”) on September 2, 1974. The provisions of the PPA may, over time, have a significant impact on demand for pension, retirement
savings, and lifestyle protection products in both the institutional and retail markets. The impact of the legislation may have a positive effect
on the life insurance and financial services industries in the future.
Impact of Hurricanes
On August 29, 2005, Hurricane Katrina made landfall in the states of Louisiana, Mississippi and Alabama, causing catastrophic damage
to these coastal regions. MetLife’s cumulative gross losses from Hurricane Katrina were $314 million, $333 million and $335 million at
December 31, 2007, 2006 and 2005, respectively, primarily arising from the Company’s homeowners business. During the years ended
December 31, 2007, 2006 and 2005, the Company recognized net losses, net of income tax and reinsurance recoverables and including
reinstatement premiums and other reinsurance-related premium adjustments related to the catastrophe, of ($13) million, ($2) million and
$134 million, respectively.
On October 24, 2005, Hurricane Wilma made landfall across the state of Florida. MetLife’s cumulative gross losses from Hurricane
Wilma were $66 million, $64 million and $57 million at December 31, 2007, 2006 and 2005, respectively, primarily arising from the
Company’s homeowners and automobile businesses. During the years ended December 31, 2006 and 2005, the Company’s Auto & Home
segment recognized net losses, net of income tax and reinsurance recoverables, of ($3) million and $32 million, respectively, related to
Hurricane Wilma. The Company did not recognize any loss during the year ended December 31, 2007, related to Hurricane Wilma.
Additional hurricane-related losses may be recorded in future periods as claims are received from insureds and claims to reinsurers are
processed. Reinsurance recoveries are dependent upon the continued creditworthiness of the reinsurers, which may be affected by their
other reinsured losses in connection with Hurricanes Katrina and Wilma and otherwise. In addition, lawsuits, including purported class
actions, have been filed in Louisiana and Mississippi challenging denial of claims for damages caused to property during Hurricane Katrina.
Metropolitan Property and Casualty Insurance Company is a named party in some of these lawsuits. In addition, rulings in cases in which
Metropolitan Property and Casualty Insurance Company is not a party may affect interpretation of its policies. Metropolitan Property and
Casualty Insurance Company intends to vigorously defend these matters. However, any adverse rulings could result in an increase in the
Company’s hurricane-related claim exposure and losses. Based on information known by management, it does not believe that additional
claim losses resulting from Hurricane Katrina will have a material adverse impact on the Company’s consolidated financial statements.
Summary of Critical Accounting Estimates
The preparation of financial statements in conformity with accounting principles generally accepted in the United States of America
(“GAAP”) requires management to adopt accounting policies and make estimates and assumptions that affect amounts reported in the
consolidated financial statements. The most critical estimates include those used in determining:
i) the fair value of investments in the absence of quoted market values;
ii) investment impairments;
iii) the recognition of income on certain investments;
8 MetLife, Inc.
iv) the application of the consolidation rules to certain investments;
v) the fair value of and accounting for derivatives;
vi) the capitalization and amortization of DAC and the establishment and amortization of VOBA;
vii) the measurement of goodwill and related impairment, if any;
viii) the liability for future policyholder benefits;
ix) accounting for income taxes and the valuation of deferred tax assets;
x) accounting for reinsurance transactions;
xi) accounting for employee benefit plans; and
xii) the liability for litigation and regulatory matters.
The application of purchase accounting requires the use of estimation techniques in determining the fair values of assets acquired and
liabilities assumed — the most significant of which relate to the aforementioned critical estimates. In applying these policies, management
makes subjective and complex judgments that frequently require estimates about matters that are inherently uncertain. Many of these
policies, estimates and related judgments are common in the insurance and financial services industries; others are specific to the
Company’s businesses and operations. Actual results could differ from these estimates.
Investments
The Company’s principal investments are in fixed maturity and equity securities, mortgage and consumer loans, policy loans, real
estate, real estate joint ventures and other limited partnerships, short-term investments, and other invested assets. The Company’s
investments are exposed to three primary sources of risk: credit, interest rate and market valuation. The financial statement risks, stemming
from such investment risks, are those associated with the determination of fair values, the recognition of impairments, the recognition of
income on certain investments, and the potential consolidation of previously unconsolidated subsidiaries.
The Company’s investments in fixed maturity and equity securities are classified as available-for-sale, except for trading securities, and
are reported at their estimated fair value. The fair values for public fixed maturity securities and public equity securities are based on quoted
market prices or estimates from independent pricing services. However, in cases where quoted market prices are not available, such as for
private fixed maturities, fair values are estimated using present value or valuation techniques. The determination of fair values in the
absence of quoted market prices is based on: (i) valuation methodologies; (ii) securities the Company deems to be comparable; and
(iii) assumptions deemed appropriate given the circumstances. The fair value estimates are made at a specific point in time, based on
available market information and judgments about financial instruments, including estimates of the timing and amounts of expected future
cash flows and the credit standing of the issuer or counterparty. Factors considered in estimating fair value include: coupon rate, maturity,
estimated duration, call provisions, sinking fund requirements, credit rating, industry sector of the issuer, and quoted market prices of
comparable securities. The use of different methodologies and assumptions may have a material effect on the estimated fair value
amounts.
One of the significant estimates related to available-for-sale securities is the evaluation of investments for other-than-temporary
impairments. The assessment of whether impairments have occurred is based on management’s case-by-case evaluation of the
underlying reasons for the decline in fair value. The Company’s review of its fixed maturity and equity securities for impairments includes
an analysis of the total gross unrealized losses by three categories of securities: (i) securities where the estimated fair value had declined
and remained below cost or amortized cost by less than 20%; (ii) securities where the estimated fair value had declined and remained
below cost or amortized cost by 20% or more for less than six months; and (iii) securities where the estimated fair value had declined and
remained below cost or amortized cost by 20% or more for six months or greater. Additionally, management considers a wide range of
factors about the security issuer and uses its best judgment in evaluating the cause of the decline in the estimated fair value of the security
and in assessing the prospects for near-term recovery. Inherent in management’s evaluation of the security are assumptions and estimates
about the operations of the issuer and its future earnings potential. Considerations used by the Company in the impairment evaluation
process include, but are not limited to:
i) the length of time and the extent to which the market value has been below cost or amortized cost;
ii) the potential for impairments of securities when the issuer is experiencing significant financial difficulties;
iii) the potential for impairments in an entire industry sector or sub-sector;
iv) the potential for impairments in certain economically depressed geographic locations;
v) the potential for impairments of securities where the issuer, series of issuers or industry has suffered a catastrophic type of
loss or has exhausted natural resources;
vi) the Company’s ability and intent to hold the security for a period of time sufficient to allow for the recovery of its value to an
amount equal to or greater than cost or amortized cost;
vii) unfavorable changes in forecasted cash flows on mortgage-backed and asset-backed securities; and
viii) other subjective factors, including concentrations and information obtained from regulators and rating agencies.
The cost of fixed maturity and equity securities is adjusted for impairments in value deemed to be other-than-temporary in the period in
which the determination is made. These impairments are included within net investment gains (losses) and the cost basis of the fixed
maturity and equity securities is reduced accordingly. The Company does not change the revised cost basis for subsequent recoveries in
value.
The determination of the amount of allowances and impairments on other invested asset classes is highly subjective and is based upon
the Company’s periodic evaluation and assessment of known and inherent risks associated with the respective asset class. Such
evaluations and assessments are revised as conditions change and new information becomes available. Management updates its
evaluations regularly and reflects changes in allowances and impairments in operations as such evaluations are revised.
The recognition of income on certain investments (e.g. loan-backed securities, including mortgage-backed and asset-backed
securities, certain investment transactions, trading securities, etc.) is dependent upon market conditions, which could result in prepay-
ments and changes in amounts to be earned.
Additionally, when the Company enters into certain structured investment transactions, real estate joint ventures and other limited
partnerships for which the Company may be deemed to be the primary beneficiary under Financial Accounting Standards Board (“FASB”)
Interpretation (“FIN”) No. 46(r), Consolidation of Variable Interest Entities — An Interpretation of ARB No. 51, it may be required to
9MetLife, Inc.
consolidate such investments. The accounting rules for the determination of the primary beneficiary are complex and require evaluation of
the contractual rights and obligations associated with each party involved in the entity, an estimate of the entity’s expected losses and
expected residual returns and the allocation of such estimates to each party.
The use of different methodologies and assumptions as to the determination of the fair value of investments, the timing and amount of
impairments, the recognition of income, or consolidation of investments may have a material effect on the amounts presented within the
consolidated financial statements.
Derivative Financial Instruments
The Company enters into freestanding derivative transactions including swaps, forwards, futures and option contracts. The Company
uses derivatives primarily to manage various risks. The risks being managed are variability in cash flows or changes in fair values related to
financial instruments and currency exposure associated with net investments in certain foreign operations. To a lesser extent, the Company
uses credit derivatives, such as credit default swaps, to synthetically replicate investment risks and returns which are not readily available
in the cash market. The Company also purchases certain securities, issues certain insurance policies and engages in certain reinsurance
contracts that have embedded derivatives.
Fair value of derivatives is determined by quoted market prices or through the use of pricing models. The determination of fair value,
when quoted market values are not available, is based on valuation methodologies and assumptions deemed appropriate under the
circumstances. Derivative valuations can be affected by changes in interest rates, foreign currency exchange rates, financial indices, credit
spreads, market volatility, and liquidity. Values can also be affected by changes in estimates and assumptions used in pricing models. Such
assumptions include estimates of volatility, interest rates, foreign currency exchange rates, other financial indices and credit ratings.
Essential to the analysis of the fair value is risk of counterparty default. The use of different assumptions may have a material effect on the
estimated derivative fair value amounts, as well as the amount of reported net income. Also, fluctuations in the fair value of derivatives
which have not been designated for hedge accounting may result in significant volatility in net income.
The accounting for derivatives is complex and interpretations of the primary accounting standards continue to evolve in practice.
Judgment is applied in determining the availability and application of hedge accounting designations and the appropriate accounting
treatment under these accounting standards. If it was determined that hedge accounting designations were not appropriately applied,
reported net income could be materially affected. Differences in judgment as to the availability and application of hedge accounting
designations and the appropriate accounting treatment may result in a differing impact on the consolidated financial statements of the
Company from that previously reported. Measurements of ineffectiveness of hedging relationships are also subject to interpretations and
estimations and different interpretations or estimates may have a material effect on the amount reported in net income.
Additionally, there is a risk that embedded derivatives requiring bifurcation may not be identified and reported at fair value in the
consolidated financial statements and that their related changes in fair value could materially affect reported net income.
Deferred Policy Acquisition Costs and Value of Business Acquired
The Company incurs significant costs in connection with acquiring new and renewal insurance business. Costs that vary with and relate
to the production of new business are deferred as DAC. Such costs consist principally of commissions and agency and policy issue
expenses. VOBA is an intangible asset that reflects the estimated fair value of in-force contracts in a life insurance company acquisition and
represents the portion of the purchase price that is allocated to the value of the right to receive future cash flows from the business in-force
at the acquisition date. VOBA is based on actuarially determined projections, by each block of business, of future policy and contract
charges, premiums, mortality and morbidity, separate account performance, surrenders, operating expenses, investment returns and other
factors. Actual experience on the purchased business may vary from these projections. The recovery of DAC and VOBA is dependent upon
the future profitability of the related business. DAC and VOBA are aggregated in the financial statements for reporting purposes.
DAC for property and casualty insurance contracts, which is primarily composed of commissions and certain underwriting expenses, is
amortized on a pro rata basis over the applicable contract term or reinsurance treaty.
DAC and VOBA on life insurance or investment-type contracts are amortized in proportion to gross premiums, gross margins or gross
profits, depending on the type of contract as described below.
The Company amortizes DAC and VOBA related to non-participating and non-dividend-paying traditional contracts (term insurance,
non-participating whole life insurance, non-medical health insurance, and traditional group life insurance) over the entire premium paying
period in proportion to the present value of actual historic and expected future gross premiums. The present value of expected premiums is
based upon the premium requirement of each policy and assumptions for mortality, morbidity, persistency, and investment returns at policy
issuance, or policy acquisition, as it relates to VOBA, that include provisions for adverse deviation and are consistent with the assumptions
used to calculate future policyholder benefit liabilities. These assumptions are not revised after policy issuance or acquisition unless the
DAC or VOBA balance is deemed to be unrecoverable from future expected profits. Absent a premium deficiency, variability in amortization
after policy issuance or acquisition is caused only by variability in premium volumes.
The Company amortizes DAC and VOBA related to participating, dividend-paying traditional contracts over the estimated lives of the
contracts in proportion to actual and expected future gross margins. The amortization includes interest based on rates in effect at inception
or acquisition of the contracts. The future gross margins are dependent principally on investment returns, policyholder dividend scales,
mortality, persistency, expenses to administer the business, creditworthiness of reinsurance counterparties, and certain economic
variables, such as inflation. For participating contracts (dividend paying traditional contracts within the closed block) future gross margins
are also dependent upon changes in the policyholder dividend obligation. Of these factors, the Company anticipates that investment
returns, expenses, persistency, and other factor changes and policyholder dividend scales are reasonably likely to impact significantly the
rate of DAC and VOBA amortization. Each reporting period, the Company updates the estimated gross margins with the actual gross
margins for that period. When the actual gross margins change from previously estimated gross margins, the cumulative DAC and VOBA
amortization is re-estimated and adjusted by a cumulative charge or credit to current operations. When actual gross margins exceed those
previously estimated, the DAC and VOBA amortization will increase, resulting in a current period charge to earnings. The opposite result
occurs when the actual gross margins are below the previously estimated gross margins. Each reporting period, the Company also
updates the actual amount of business in-force, which impacts expected future gross margins.
The Company amortizes DAC and VOBA related to fixed and variable universal life contracts and fixed and variable deferred annuity
contracts over the estimated lives of the contracts in proportion to actual and expected future gross profits. The amortization includes
10 MetLife, Inc.
interest based on rates in effect at inception or acquisition of the contracts. The amount of future gross profits is dependent principally
upon returns in excess of the amounts credited to policyholders, mortality, persistency, interest crediting rates, expenses to administer the
business, creditworthiness of reinsurance counterparties, the effect of any hedges used, and certain economic variables, such as inflation.
Of these factors, the Company anticipates that investment returns, expenses, and persistency are reasonably likely to impact significantly
the rate of DAC and VOBA amortization. Each reporting period, the Company updates the estimated gross profits with the actual gross
profits for that period. When the actual gross profits change from previously estimated gross profits, the cumulative DAC and VOBA
amortization is re-estimated and adjusted by a cumulative charge or credit to current operations. When actual gross profits exceed those
previously estimated, the DAC and VOBA amortization will increase, resulting in a current period charge to earnings. The opposite result
occurs when the actual gross profits are below the previously estimated gross profits. Each reporting period, the Company also updates
the actual amount of business remaining in-force, which impacts expected future gross profits.
Separate account rates of return on variable universal life contracts and variable deferred annuity contracts affect in-force account
balances on such contracts each reporting period. Returns that are higher than the Company’s long-term expectation produce higher
account balances, which increases the Company’s future fee expectations and decreases future benefit payment expectations on
minimum death benefit guarantees, resulting in higher expected future gross profits. The opposite result occurs when returns are lower
than the Company’s long-term expectation. The Company’s practice to determine the impact of gross profits resulting from returns on
separate accounts assumes that long-term appreciation in equity markets is not changed by short-term market fluctuations, but is only
changed when sustained interim deviations are expected. The Company monitors these changes and only changes the assumption when
its long-term expectation changes. The effect of an increase/(decrease) by 100 basis points in the assumed future rate of return is
reasonably likely to result in a decrease/(increase) in the DAC and VOBA balances of approximately $95 million with an offset to the
Company’s unearned revenue liability of approximately $20 million for this factor.
The Company also reviews periodically other long-term assumptions underlying the projections of estimated gross margins and profits.
These include investment returns, policyholder dividend scales, interest crediting rates, mortality, persistency, and expenses to administer
business. Management annually updates assumptions used in the calculation of estimated gross margins and profits which may have
significantly changed. If the update of assumptions causes expected future gross margins and profits to increase, DAC and VOBA
amortization will decrease, resulting in a current period increase to earnings. The opposite result occurs when the assumption update
causes expected future gross margins and profits to decrease.
Over the past two years, the Company’s most significant assumption updates resulting in a change to expected future gross margins
and profits and the amortization of DAC and VOBA have been updated due to revisions to expected future investment returns, expenses,
in-force or persistency assumptions and policyholder dividends on contracts included within the Individual segment. The Company
expects these assumptions to be the ones most reasonably likely to cause significant changes in the future. Changes in these assumptions
can be offsetting and the Company is unable to predict their movement or offsetting impact over time.
The following chart illustrates the effect on DAC and VOBA within the Company’s Individual segment of changing each of the respective
assumptions during the years ended December 31, 2007 and 2006:
2007 2006
Years Ended
December 31,
(In millions)
Investment return . . . . . . . . . . . . . . . . . . . . . . . . . . . . . . . . . . . . . . . . . . . . . . . . . . . . . . . $100 $192
Expense . . . . . . . . . . . . . . . . . . . . . . . . . . . . . . . . . . . . . . . . . . . . . . . . . . . . . . . . . . . . . (53) 45
In-force/Persistency . . . . . . . . . . . . . . . . . . . . . . . . . . . . . . . . . . . . . . . . . . . . . . . . . . . . . . 17 (7)
Policyholder dividends and other . . . . . . . . . . . . . . . . . . . . . . . . . . . . . . . . . . . . . . . . . . . . . . (55) (39)
Total . . . . . . . . . . . . . . . . . . . . . . . . . . . . . . . . . . . . . . . . . . . . . . . . . . . . . . . . . . . . . . . . $ 9 $191
As of December 31, 2007 and 2006, DAC and VOBA for the Individual segment were $14.2 billion and $14.0 billion, respectively, and
for the total Company were $21.5 billion and $20.8 billion, respectively.
Goodwill
Goodwill is the excess of cost over the fair value of net assets acquired. Goodwill is not amortized but is tested for impairment at least
annually or more frequently if events or circumstances, such as adverse changes in the business climate, indicate that there may be
justification for conducting an interim test.
Impairment testing is performed using the fair value approach, which requires the use of estimates and judgment, at the “reporting unit”
level. A reporting unit is the operating segment or a business one level below the operating segment, if discrete financial information is
prepared and regularly reviewed by management at that level. For purposes of goodwill impairment testing, goodwill within Corporate &
Other is allocated to reporting units within the Company’s business segments. If the carrying value of a reporting unit’s goodwill exceeds its
fair value, the excess is recognized as an impairment and recorded as a charge against net income. The fair values of the reporting units
are determined using a market multiple, a discounted cash flow model, or a cost approach. The critical estimates necessary in determining
fair value are projected earnings, comparative market multiples and the discount rate.
Liability for Future Policy Benefits
The Company establishes liabilities for amounts payable under insurance policies, including traditional life insurance, traditional
annuities and non-medical health insurance. Generally, amounts are payable over an extended period of time and related liabilities are
calculated as the present value of expected future benefits to be paid, reduced by the present value of expected future premiums. Such
liabilities are established based on methods and underlying assumptions in accordance with GAAP and applicable actuarial standards.
Principal assumptions used in the establishment of liabilities for future policy benefits are mortality, morbidity, policy lapse, renewal,
retirement, investment returns, inflation, expenses and other contingent events as appropriate to the respective product type. These
assumptions are established at the time the policy is issued and are intended to estimate the experience for the period the policy benefits
11MetLife, Inc.
are payable. Utilizing these assumptions, liabilities are established on a block of business basis. If experience is less favorable than
assumptions, additional liabilities may be required, resulting in a charge to policyholder benefits and claims.
Liabilities for future policy benefits for disabled lives are estimated using the present value of benefits method and experience
assumptions as to claim terminations, expenses and interest.
Liabilities for unpaid claims and claim expenses for property and casualty insurance are included in future policyholder benefits and
represent the amount estimated for claims that have been reported but not settled and claims incurred but not reported. Other policyholder
funds include claims that have been reported but not settled and claims incurred but not reported on life and non-medical health insurance.
Liabilities for unpaid claims are estimated based upon the Company’s historical experience and other actuarial assumptions that consider
the effects of current developments, anticipated trends and risk management programs, reduced for anticipated salvage and subrogation.
The effects of changes in such estimated liabilities are included in the results of operations in the period in which the changes occur.
Future policy benefit liabilities for minimum death and income benefit guarantees relating to certain annuity contracts and secondary and
paid up guarantees relating to certain life policies are based on estimates of the expected value of benefits in excess of the projected
account balance and recognizing the excess ratably over the accumulation period based on total expected assessments. Liabilities for
universal and variable life secondary guarantees and paid-up guarantees are determined by estimating the expected value of death
benefits payable when the account balance is projected to be zero and recognizing those benefits ratably over the accumulation period
based on total expected assessments. The assumptions used in estimating these liabilities are consistent with those used for amortizing
DAC, and are thus subject to the same variability and risk.
The Company offers certain variable annuity products with guaranteed minimum benefit riders. These include guaranteed minimum
withdrawal benefit (“GMWB”) riders and guaranteed minimum accumulation benefit (“GMAB”) riders. GMWB and GMAB riders are
embedded derivatives, which are measured at fair value separately from the host variable annuity contract, with changes in fair value
reported in net investment gains (losses). The fair values of GMWB and GMAB riders are calculated based on actuarial and capital market
assumptions related to the projected cash flows, including benefits and related contract charges, over the lives of the contracts,
incorporating expectations concerning policyholder behavior. These riders may be more costly than expected in volatile or declining
markets, causing an increase in liabilities for future policy benefits, negatively affecting net income.
The Company periodically reviews its estimates of actuarial liabilities for future policy benefits and compares them with its actual
experience. Differences between actual experience and the assumptions used in pricing these policies, guarantees and riders and in the
establishment of the related liabilities result in variances in profit and could result in losses. The effects of changes in such estimated
liabilities are included in the results of operations in the period in which the changes occur.
Income Taxes
Income taxes represent the net amount of income taxes that the Company expects to pay to or receive from various taxing jurisdictions
in connection with its operations. The Company provides for federal, state and foreign income taxes currently payable, as well as those
deferred due to temporary differences between the financial reporting and tax bases of assets and liabilities. The Company’s accounting for
income taxes represents management’s best estimate of various events and transactions.
Deferred tax assets and liabilities resulting from temporary differences between the financial reporting and tax bases of assets and
liabilities are measured at the balance sheet date using enacted tax rates expected to apply to taxable income in the years the temporary
differences are expected to reverse. The realization of deferred tax assets depends upon the existence of sufficient taxable income within
the carryback or carryforward periods under the tax law in the applicable tax jurisdiction. Valuation allowances are established when
management determines, based on available information, that it is more likely than not that deferred income tax assets will not be realized.
Significant judgment is required in determining whether valuation allowances should be established, as well as the amount of such
allowances. When making such determination, consideration is given to, among other things, the following:
i) future taxable income exclusive of reversing temporary differences and carryforwards;
ii) future reversals of existing taxable temporary differences;
iii) taxable income in prior carryback years; and
iv) tax planning strategies.
The Company may be required to change its provision for income taxes in certain circumstances. Examples of such circumstances
include when the ultimate deductibility of certain items is challenged by taxing authorities or when estimates used in determining valuation
allowances on deferred tax assets significantly change or when receipt of new information indicates the need for adjustment in valuation
allowances. Additionally, future events, such as changes in tax laws, tax regulations, or interpretations of such laws or regulations, could
have an impact on the provision for income tax and the effective tax rate. Any such changes could significantly affect the amounts reported
in the consolidated financial statements in the year these changes occur.
As described more fully in “— Adoption of New Accounting Pronouncements”, the Company adopted FIN No. 48, Accounting for
Uncertainty in Income Taxes — An Interpretation of FASB Statement No. 109 (“FIN 48”) effective January 1, 2007. Under FIN 48, the
Company determines whether it is more-likely-than-not that a tax position will be sustained upon examination by the appropriate taxing
authorities before any part of the benefit can be recorded in the financial statements. A tax position is measured at the largest amount of
benefit that is greater than 50 percent likely of being realized upon settlement.
Reinsurance
The Company enters into reinsurance transactions as both a provider and a purchaser of reinsurance for its life and property and
casualty insurance products. Accounting for reinsurance requires extensive use of assumptions and estimates, particularly related to the
future performance of the underlying business and the potential impact of counterparty credit risks. The Company periodically reviews
actual and anticipated experience compared to the aforementioned assumptions used to establish assets and liabilities relating to ceded
and assumed reinsurance and evaluates the financial strength of counterparties to its reinsurance agreements using criteria similar to that
evaluated in the security impairment process discussed previously. Additionally, for each of its reinsurance contracts, the Company
determines if the contract provides indemnification against loss or liability relating to insurance risk, in accordance with applicable
accounting standards. The Company reviews all contractual features, particularly those that may limit the amount of insurance risk to which
the reinsurer is subject or features that delay the timely reimbursement of claims. If the Company determines that a reinsurance contract
12 MetLife, Inc.
does not expose the reinsurer to a reasonable possibility of a significant loss from insurance risk, the Company records the contract using
the deposit method of accounting.
Employee Benefit Plans
Certain subsidiaries of the Holding Company (the “Subsidiaries”) sponsor and/or administer pension and other postretirement plans
covering employees who meet specified eligibility requirements. The obligations and expenses associated with these plans require an
extensive use of assumptions such as the discount rate, expected rate of return on plan assets, rate of future compensation increases,
healthcare cost trend rates, as well as assumptions regarding participant demographics such as rate and age of retirements, withdrawal
rates and mortality. Management, in consultation with its external consulting actuarial firm, determines these assumptions based upon a
variety of factors such as historical performance of the plan and its assets, currently available market and industry data, and expected
benefit payout streams. The assumptions used may differ materially from actual results due to, among other factors, changing market and
economic conditions and changes in participant demographics. These differences may have a significant effect on the Company’s
consolidated financial statements and liquidity.
Litigation Contingencies
The Company is a party to a number of legal actions and is involved in a number of regulatory investigations. Given the inherent
unpredictability of these matters, it is difficult to estimate the impact on the Company’s financial position. Liabilities are established when it
is probable that a loss has been incurred and the amount of the loss can be reasonably estimated. Liabilities related to certain lawsuits,
including the Company’s asbestos-related liability, are especially difficult to estimate due to the limitation of available data and uncertainty
regarding numerous variables that can affect liability estimates. The data and variables that impact the assumptions used to estimate the
Company’s asbestos-related liability include the number of future claims, the cost to resolve claims, the disease mix and severity of
disease in pending and future claims, the impact of the number of new claims filed in a particular jurisdiction and variations in the law in the
jurisdictions in which claims are filed, the possible impact of tort reform efforts, the willingness of courts to allow plaintiffs to pursue claims
against the Company when exposure to asbestos took place after the dangers of asbestos exposure were well known, and the impact of
any possible future adverse verdicts and their amounts. On a quarterly and annual basis, the Company reviews relevant information with
respect to liabilities for litigation, regulatory investigations and litigation-related contingencies to be reflected in the Company’s consol-
idated financial statements. It is possible that an adverse outcome in certain of the Company’s litigation and regulatory investigations,
including asbestos-related cases, or the use of different assumptions in the determination of amounts recorded could have a material
effect upon the Company’s consolidated net income or cash flows in particular quarterly or annual periods.
Economic Capital
Economic capital is an internally developed risk capital model, the purpose of which is to measure the risk in the business and to provide
a basis upon which capital is deployed. The economic capital model accounts for the unique and specific nature of the risks inherent in
MetLife’s businesses. As a part of the economic capital process, a portion of net investment income is credited to the segments based on
the level of allocated equity. This is in contrast to the standardized regulatory risk-based capital (“RBC”) formula, which is not as refined in
its risk calculations with respect to the nuances of the Company’s businesses.
13MetLife, Inc.
Results of Operations
Discussion of Results
The following table presents consolidated financial information for the Company for the years indicated:
2007 2006 2005
Years Ended December 31,
(In millions)
Revenues
Premiums . . . . . . . . . . . . . . . . . . . . . . . . . . . . . . . . . . . . . . . . . . . . . . . . . . . $27,895 $26,412 $24,860
Universal life and investment-type product policy fees . . . . . . . . . . . . . . . . . . . . . . 5,311 4,780 3,828
Net investment income . . . . . . . . . . . . . . . . . . . . . . . . . . . . . . . . . . . . . . . . . . 19,006 17,082 14,756
Other revenues . . . . . . . . . . . . . . . . . . . . . . . . . . . . . . . . . . . . . . . . . . . . . . . 1,533 1,362 1,271
Net investment gains (losses) . . . . . . . . . . . . . . . . . . . . . . . . . . . . . . . . . . . . . . (738) (1,382) (86)
Total revenues . . . . . . . . . . . . . . . . . . . . . . . . . . . . . . . . . . . . . . . . . . . 53,007 48,254 44,629
Expenses
Policyholder benefits and claims . . . . . . . . . . . . . . . . . . . . . . . . . . . . . . . . . . . . 27,828 26,431 25,506
Interest credited to policyholder account balances . . . . . . . . . . . . . . . . . . . . . . . . 5,741 5,171 3,887
Policyholder dividends . . . . . . . . . . . . . . . . . . . . . . . . . . . . . . . . . . . . . . . . . . 1,726 1,701 1,679
Other expenses . . . . . . . . . . . . . . . . . . . . . . . . . . . . . . . . . . . . . . . . . . . . . . . 11,673 10,783 9,264
Total expenses . . . . . . . . . . . . . . . . . . . . . . . . . . . . . . . . . . . . . . . . . . . 46,968 44,086 40,336
Income from continuing operations before provision for income tax . . . . . . . . . . . . . . 6,039 4,168 4,293
Provision for income tax . . . . . . . . . . . . . . . . . . . . . . . . . . . . . . . . . . . . . . . . . 1,759 1,097 1,222
Income from continuing operations . . . . . . . . . . . . . . . . . . . . . . . . . . . . . . . . . . 4,280 3,071 3,071
Income from discontinued operations, net of income tax . . . . . . . . . . . . . . . . . . . . 37 3,222 1,643
Net income. . . . . . . . . . . . . . . . . . . . . . . . . . . . . . . . . . . . . . . . . . . . . . . . . . 4,317 6,293 4,714
Preferred stock dividends . . . . . . . . . . . . . . . . . . . . . . . . . . . . . . . . . . . . . . . . 137 134 63
Net income available to common shareholders . . . . . . . . . . . . . . . . . . . . . . . . . . . $ 4,180 $ 6,159 $ 4,651
Year ended December 31, 2007 compared with the year ended December 31, 2006 — The Company
Income from Continuing Operations
Income from continuing operations increased by $1,209 million, or 39%, to $4,280 million for the year ended December 31, 2007 from
$3,071 million for the comparable 2006 period.
The following table provides the change from the prior year in income from continuing operations by segment:
$ Change
% of Total
$ Change
(In millions)
International . . . . . . . . . . . . . . . . . . . . . . . . . . . . . . . . . . . . . . . . . . . . . . . . . . . . . . . $ 472 39%
Institutional . . . . . . . . . . . . . . . . . . . . . . . . . . . . . . . . . . . . . . . . . . . . . . . . . . . . . . . . 314 26
Corporate & Other . . . . . . . . . . . . . . . . . . . . . . . . . . . . . . . . . . . . . . . . . . . . . . . . . . . 278 23
Individual . . . . . . . . . . . . . . . . . . . . . . . . . . . . . . . . . . . . . . . . . . . . . . . . . . . . . . . . . 110 9
Auto & Home. . . . . . . . . . . . . . . . . . . . . . . . . . . . . . . . . . . . . . . . . . . . . . . . . . . . . . . 20 2
Reinsurance . . . . . . . . . . . . . . . . . . . . . . . . . . . . . . . . . . . . . . . . . . . . . . . . . . . . . . . 15 1
Total change, net of income tax . . . . . . . . . . . . . . . . . . . . . . . . . . . . . . . . . . . . . . $1,209 100%
The increase in the International segment’s income from continuing operations was primarily attributable to the following factors:
• An increase in Argentina’s income from continuing operations primarily due to a net reduction of liabilities resulting from pension
reform, a reduction in claim liabilities resulting from experience reviews in both the current and prior years, higher premiums resulting
from higher pension contributions attributable to higher participant salaries, higher net investment income resulting from capital
contributions in the prior year, and a smaller increase in market indexed policyholder liabilities without a corresponding decrease in
net investment income, partially offset by the reduction of cost of insurance fees as a result of the new pension system reform
regulation, an increase in retention incentives related to pension reform, as well as lower trading portfolio income. Argentina also
benefited, in both the current and prior years, from the utilization of tax loss carryforwards against which valuation allowances had
been previously established.
• Mexico’s income from continuing operations increased primarily due to a decrease in certain policyholder liabilities caused by a
decrease in the unrealized investment results on invested assets supporting those liabilities relative to the prior year, the favorable
impact of experience refunds during the first quarter of 2007, a reduction in claim liabilities resulting from an experience review and
the unfavorable impact in the prior year resulting from an adjustment to experience refunds in its institutional business, a year over
14 MetLife, Inc.
year decrease in DAC amortization resulting from management’s update of assumptions used to determine estimated gross profits in
both the current and prior years, a decrease in liabilities based on a review of outstanding remittances, and growth in its institutional
and universal life businesses. These increases in Mexico’s income from continuing operations were partially offset by lower fees
resulting from management’s update of assumptions used to determine estimated gross profits, the favorable impact in the prior year
associated with a large group policy that was not renewed, a decrease in various one-time revenue items, lower investment yields,
the favorable impact in the prior year of liabilities related to employment matters that were reduced, and the benefit in the prior year
from the elimination of liabilities for pending claims determined to be invalid.
• Taiwan’s income from continuing operations increased primarily driven by an increase due to higher DAC amortization in the prior year
resulting from a loss recognition adjustment and restructuring costs, partially offset by the favorable impact of liability refinements in
the prior year, as well as higher policyholder liabilities related to loss recognition in the fourth quarter of 2006.
• Brazil’s income from continuing operations increased due to the unfavorable impact of increases in policyholder liabilities due to
higher than expected mortality on specific blocks of business and an increase in litigation liabilities in the prior year, the unfavorable
impact of the reversal of a tax credit in the prior year, as well as growth of the in-force business.
• Ireland’s income from continuing operations increased primarily due to the utilization of net operating losses for which a valuation
allowance had been previously established, higher investment income, partially offset by higher start-up expenses and currency
transaction losses.
• Japan’s income from continuing operations increased due to improved hedge results and business growth, partially offset by the
impact of foreign currency transaction losses.
• Hong Kong’s income from continuing operations increased due to the acquisition of the remaining 50% interest in MetLife Fubon and
the resulting consolidation of the operation, as well as business growth.
• Chile’s income from continuing operations increased primarily due to growth of the in-force business, higher joint venture income and
higher returns on inflation indexed securities, partially offset by higher compensation, infrastructure and marketing expenses.
• Income from continuing operations increased in the United Kingdom due to a reduction of claim liabilities resulting from an experience
review, offset by an unearned premium calculation refinement.
• Australia’s income from continuing operations increased due to growth of the in-force business and changes in foreign currency
exchange rates.
• These increases in income from continuing operations were partially offset by a decrease in the home office due to higher economic
capital charges and investment expenses, an increase in contingent tax expenses in the current year, as well as higher spending due
to growth and initiatives, partially offset by the elimination of certain intercompany expenses previously charged to the International
segment, and a tax benefit associated with a prior year income tax expense related to a revision of an estimate.
• India’s income from continuing operations decreased primarily due to headcount increases and growth initiatives, as well as the
impact of valuation allowances established against losses in both years.
• South Korea’s income from continuing operations decreased due to a favorable impact in the prior year associated with the
implementation of a more refined reserve valuation system, as well as additional expenses in the current year associated with growth
and infrastructure initiatives, partially offset by continued growth and lower DAC amortization, both in the variable universal life
business.
The Institutional segment’s income from continuing operations increased primarily due to lower net investment losses, an increase in
interest margins, an increase in underwriting results, the impact of revisions to certain expenses in both periods, partially offset by higher
expenses due to an increase in non-deferrable volume-related and corporate support expenses and an increase in DAC amortization
resulting from the ongoing implementation of Statement of Position (“SOP”) 05-1, Accounting by Insurance Enterprises for Deferred
Acquisition Costs in Connection with Modifications or Exchanges of Insurance Contracts (“SOP 05-1”) in the current year.
Corporate & Other’s income from continuing operations increased primarily due to higher net investment income, lower net investment
losses, lower corporate expenses, higher other revenues, integration costs incurred in the prior year, and lower legal costs, partially offset
by a decrease in tax benefits, higher interest expense on debt, higher interest on tax contingencies, and higher interest credited to
bankholder deposits.
The Individual segment’s income from continuing operations increased primarily due to a decrease in net investment losses, higher fee
income from separate account products, higher net investment income on blocks of business not driven by interest margins and an
increase in interest margins, partially offset by higher DAC amortization, unfavorable underwriting results in life products, higher general
expenses, the impact of revisions to certain liabilities in both years, the write-off of a receivable in the current year, an increase in the
closed block-related policyholder dividend obligation, higher annuity benefits, an increase in policyholder dividends and an increase in
interest credited to policyholder account balances.
The Auto & Home segment’s income from continuing operations increased primarily due to an increase in premiums and other revenues,
an increase in net investment income, an increase in net investment gains and a decrease in other expenses. These were partially offset by
losses related to higher claim frequencies, higher earned exposures, higher losses due to severity, an increase in unallocated claims
adjusting expenses and an increase from a reduction in favorable development of prior year losses, partially offset by a decrease in
catastrophe losses, which included favorable development of prior year catastrophe reserves, all of which are related to policyholder
benefits and claims. Also offsetting the increase in income from continuing operations was a decrease in average earned premium per
policy and an increase in catastrophe reinsurance costs.
The Reinsurance segment’s income from continuing operations increased primarily due to an increase in premiums due to additional
business in-force from facultative and automatic treaties and renewal premiums on existing blocks of business, an increase in net
investment income due to growth in the asset base, an increase in other revenues and a decrease in other expenses, partially offset by an
increase in net investment losses which was primarily due to a decrease in the fair value of embedded derivatives associated with the
reinsurance of annuity products on a funds withheld basis.
15MetLife, Inc.
Revenues and Expenses
Premiums, Fees and Other Revenues
Premiums, fees and other revenues increased by $2,185 million, or 7%, to $34,739 million for the year ended December 31, 2007 from
$32,554 million for the comparable 2006 period.
The following table provides the change from the prior year in premiums, fees and other revenues by segment:
$ Change
% of Total
$ Change
(In millions)
Institutional . . . . . . . . . . . . . . . . . . . . . . . . . . . . . . . . . . . . . . . . . . . . . . . . . . . . . . . $ 594 27%
Reinsurance . . . . . . . . . . . . . . . . . . . . . . . . . . . . . . . . . . . . . . . . . . . . . . . . . . . . . . 573 26
International . . . . . . . . . . . . . . . . . . . . . . . . . . . . . . . . . . . . . . . . . . . . . . . . . . . . . . 560 26
Individual . . . . . . . . . . . . . . . . . . . . . . . . . . . . . . . . . . . . . . . . . . . . . . . . . . . . . . . . 364 17
Auto & Home . . . . . . . . . . . . . . . . . . . . . . . . . . . . . . . . . . . . . . . . . . . . . . . . . . . . . 65 3
Corporate & Other . . . . . . . . . . . . . . . . . . . . . . . . . . . . . . . . . . . . . . . . . . . . . . . . . . 29 1
Total change. . . . . . . . . . . . . . . . . . . . . . . . . . . . . . . . . . . . . . . . . . . . . . . . . . $2,185 100%
The growth in the Institutional segment was primarily due to increases in the non-medical health & other and group life businesses. The
non-medical health & other business increased primarily due to growth in the dental, disability, accidental death & dismemberment
(“AD&D”) and individual disability insurance (“IDI”) businesses. Partially offsetting these increases is a decrease in the long-term care (“LTC”)
business, net of a decrease resulting from a shift to deposit liability-type contracts in the current year, partially offset by growth in the
business. The group life business increased primarily due to business growth in term life and increases in corporate-owned life insurance
and life insurance sold to postretirement benefit plans. These increases in the non-medical health & other and group life businesses were
partially offset by a decrease in the retirement & savings business. The decrease in retirement & savings was primarily due to a decrease in
structured settlement and pension closeout premiums, partially offset by an increase in other products.
The growth in the Reinsurance segment was primarily attributable to premiums from new facultative and automatic treaties and renewal
premiums on existing blocks of business in all RGA’s operating segments. In addition, other revenues increased due to an increase in
surrender charges on asset-intensive business reinsured and an increase in fees associated with financial reinsurance.
The growth in the International segment was primarily due to the following factors:
• An increase in Mexico’s premiums, fees and other revenues due to higher fees and growth in its institutional and universal life
businesses, a decrease in experience refunds during the first quarter of 2007 on Mexico’s institutional business, as well as the
adverse impact in the prior year of an adjustment for experience refunds on Mexico’s institutional business, offset by lower fees
resulting from management’s update of assumptions used to determine estimated gross profits and various one-time revenue items
which benefited both the current and prior years.
• Premiums, fees and other revenues increased in Hong Kong primarily due to the acquisition of the remaining 50% interest in MetLife
Fubon and the resulting consolidation of the operation as well as business growth.
• Chile’s premiums, fees and other revenues increased primarily due to higher annuity sales, higher institutional premiums from its
traditional and bank distribution channels, and the decrease in the prior year resulting from management’s decision not to match
aggressive pricing in the marketplace.
• South Korea’s premiums, fees and other revenues increased primarily due to higher fees from growth in its guaranteed annuity and
variable universal life businesses.
• Brazil’s premiums, fees and other revenues increased due to changes in foreign currency exchange rates and business growth.
• Premiums, fees and other revenues increased in Japan due to an increase in reinsurance assumed.
• Australia’s premiums, fees and other revenues increased primarily due to growth in the institutional and reinsurance business in-
force, an increase in retention levels and changes in foreign currency exchange rates.
• Argentina’s premiums, fees and other revenues increased due to higher pension contributions resulting from higher participant
salaries and a higher salary threshold subject to fees and growth in bancassurance, offset by the reduction of cost of insurance fees
as a result of the new pension system reform regulation.
• Taiwan’s and India’s premiums, fees and other revenues increased primarily due to business growth.
These increases in premiums, fees and other revenues were partially offset by a decrease in the United Kingdom due to an unearned
premium calculation refinement, partially offset by changes in foreign currency exchange rates.
The growth in the Individual segment was primarily due to higher fee income from variable life and annuity and investment-type products
and growth in premiums from other life products, partially offset by a decrease in immediate annuity premiums and a decline in premiums
associated with the Company’s closed block business, in line with expectations.
The growth in the Auto & Home segment was primarily due to an increase in premiums related to increased exposures, an increase in
various voluntary and involuntary programs, and a change in estimate on auto rate refunds due to a regulatory examination, as well as an
increase in other revenues primarily due to slower than anticipated claim payments in 2006. These increases were partially offset by a
reduction in average earned premium per policy, and an increase in catastrophe reinsurance costs.
The increase in Corporate & Other was primarily related to the resolution of an indemnification claim associated with the 2000
acquisition of General American Life Insurance Company (“GALIC”), partially offset by an adjustment of surrender values on corporate-
owned life insurance policies.
Net Investment Income
Net investment income increased by $1,924 million, or 11%, to $19,006 million for the year ended December 31, 2007 from
$17,082 million for the comparable 2006 period. Management attributes $1,336 million of this increase to growth in the average asset
base and $588 million to an increase in yields. The increase in net investment income from growth in the average asset base was primarily
within fixed maturity securities, mortgage loans, real estate joint ventures and other limited partnership interests. The increase in net
16 MetLife, Inc.
investment income attributable to higher yields was primarily due to higher returns on fixed maturity securities, other limited partnership
interests excluding hedge funds, equity securities and improved securities lending results, partially offset by lower returns on real estate
joint ventures, cash, cash equivalents and short-term investments, hedge funds and mortgage loans. Management anticipates that
investment income and the related yields on other limited partnership interests may decline during 2008 due to increased volatility in the
equity and credit markets during 2007.
Interest Margin
Interest margin, which represents the difference between interest earned and interest credited to policyholder account balances
increased in the Institutional and Individual segments for the year ended December 31, 2007 as compared to the prior year. Interest earned
approximates net investment income on investable assets attributed to the segment with minor adjustments related to the consolidation of
certain separate accounts and other minor non-policyholder elements. Interest credited is the amount attributed to insurance products,
recorded in policyholder benefits and claims, and the amount credited to policyholder account balances for investment-type products,
recorded in interest credited to policyholder account balances. Interest credited on insurance products reflects the current year impact of
the interest rate assumptions established at issuance or acquisition. Interest credited to policyholder account balances is subject to
contractual terms, including some minimum guarantees. This tends to move gradually over time to reflect market interest rate movements
and may reflect actions by management to respond to competitive pressures and, therefore, generally does not introduce volatility in
expense.
Net Investment Gains (Losses)
Net investment losses decreased by $644 million to a loss of $738 million for the year ended December 31, 2007 from a loss of
$1,382 million for the comparable 2006 period. The decrease in net investment losses was primarily due to a reduction of losses on fixed
maturity securities resulting principally from the 2006 portfolio repositioning in a rising interest rate environment, increased gains from
asset-based foreign currency transactions due to a decline in the U.S. dollar year over year against several major currencies and increased
gains on equity securities, partially offset by increased losses from the mark-to-market on derivatives and reduced gains on real estate and
real estate joint ventures.
Underwriting
Underwriting results are generally the difference between the portion of premium and fee income intended to cover mortality, morbidity
or other insurance costs, less claims incurred, and the change in insurance-related liabilities. Underwriting results are significantly
influenced by mortality, morbidity or other insurance-related experience trends, as well as the reinsurance activity related to certain blocks
of business. Consequently, results can fluctuate from period to period. Underwriting results, excluding catastrophes, in the Auto & Home
segment were less favorable for the year ended December 31, 2007, as the combined ratio, excluding catastrophes, increased to 86.3%
from 82.8% for the year ended December 31, 2006. Underwriting results were favorable in the non-medical health & other, group life and
retirement & savings businesses in the Institutional segment. Underwriting results were unfavorable in the life products in the Individual
segment.
Other Expenses
Other expenses increased by $890 million, or 8%, to $11,673 million for the year ended December 31, 2007 from $10,783 million for
the comparable 2006 period.
The following table provides the change from the prior year in other expenses by segment:
$ Change
% of Total
$ Change
(In millions)
Individual . . . . . . . . . . . . . . . . . . . . . . . . . . . . . . . . . . . . . . . . . . . . . . . . . . . . . . . . $512 57%
International . . . . . . . . . . . . . . . . . . . . . . . . . . . . . . . . . . . . . . . . . . . . . . . . . . . . . . 219 25
Institutional . . . . . . . . . . . . . . . . . . . . . . . . . . . . . . . . . . . . . . . . . . . . . . . . . . . . . . . 124 14
Corporate & Other . . . . . . . . . . . . . . . . . . . . . . . . . . . . . . . . . . . . . . . . . . . . . . . . . . 51 6
Auto & Home . . . . . . . . . . . . . . . . . . . . . . . . . . . . . . . . . . . . . . . . . . . . . . . . . . . . . (15) (2)
Reinsurance . . . . . . . . . . . . . . . . . . . . . . . . . . . . . . . . . . . . . . . . . . . . . . . . . . . . . . (1) —
Total change. . . . . . . . . . . . . . . . . . . . . . . . . . . . . . . . . . . . . . . . . . . . . . . . . . $890 100%
The Individual segment contributed to the year over year increase in other expenses primarily due to higher DAC amortization, higher
expenses associated with business growth, information technology and other general expenses, the impact of revisions to certain
liabilities, including pension and postretirement liabilities and policyholder liabilities in the prior year, and a write-off of a receivable in the
current year.
The International segment contributed to the year over year increase in other expenses primarily due to the business growth
commensurate with the increase in revenues discussed above. It was driven by the following factors:
• Argentina’s other expenses increased primarily due to a liability for servicing obligations that was established as a result of pension
reform, an increase in commissions on bancassurance business, an increase in retention incentives related to pension reform, and
the impact of management’s update of DAC assumptions as a result of pension reform and growth, partially offset by a lower increase
in liabilities due to inflation and exchange rate indexing.
• South Korea’s other expenses increased primarily due to the favorable impact in DAC amortization associated with the implemen-
tation of a more refined reserve valuation system in the prior year, additional expenses associated with growth and infrastructure
initiatives, as well as business growth and higher bank insurance fees, partially offset by a decrease in DAC amortization.
• Mexico’s other expenses increased due to higher expenses related to business growth and the favorable impact in the prior year of
liabilities that were reduced, offset by a decrease in DAC amortization resulting from management’s update of assumptions used to
determine estimated gross profits in both the current and prior years and a decrease in liabilities based on a review of outstanding
remittances.
17MetLife, Inc.
• Other expenses increased in India primarily due to headcount increases and growth initiatives, partially offset by the impact of
management’s update of assumptions used to determine estimated gross profits.
• Other expenses increased in Australia primarily due to business growth and changes in foreign currency exchange rates.
• Other expenses increased in Chile primarily due to compensation costs, infrastructure and marketing programs, and growth partially
offset by a decrease in DAC amortization related to inflation indexing.
• Other expenses increased in Hong Kong due to the acquisition of the remaining 50% interest in MetLife Fubon and the resulting
consolidation of the operation.
• Ireland’s other expenses increased due to higher start-up costs, as well as foreign currency transaction losses.
• Brazil’s other expenses increased due to changes in foreign currency exchange rates partially offset by an increase in litigation
liabilities in the prior year.
• The United Kingdom’s other expenses increased due to changes in foreign currency exchange rates and higher spending on
business initiatives partially offset by lower DAC amortization resulting from calculation refinements.
• These increases in other expenses were partially offset by a decrease in Taiwan’s other expenses primarily due to a one-time increase
in DAC amortization in the prior year due to a loss recognition adjustment resulting from low interest rates related to product
guarantees coupled with high persistency rates on certain blocks of business, an increase in DAC amortization in the prior year
associated with the implementation of a new valuation system, as well as one-time expenses in the prior year related to the
termination of the agency force, and expense reductions recognized in the current year due to the elimination of the agency force.
Other expenses decreased in the home office primarily due to the elimination of certain intercompany expenses previously charged to
the International segment, offset by higher spending on growth and infrastructure initiatives.
The Institutional segment contributed to the year over year increase primarily due to an increase in non-deferrable volume-related and
corporate support expenses, higher DAC amortization associated with the ongoing implementation of SOP 05-1 in the current year, a
charge related to the reimbursement of dental claims in the current year, the establishment of a contingent legal liability in the current year
and the impact of certain revisions in both years. These increases were partially offset by a benefit related to a reduction of an allowance for
doubtful accounts in the current year, the impact of a charge of non-deferrable LTC commissions expense, a charge associated with costs
related to the sale of certain small market record keeping businesses and a regulatory settlement, all in the prior year.
Corporate & Other contributed to the year over year increase in other expenses primarily due to higher interest expense, higher interest
on tax contingences and an increase in interest credited to bankholder deposits at MetLife Bank, National Association, a national bank
(“MetLife Bank” or “MetLife Bank, N.A.”), partially offset by lower corporate support expenses, lower costs from reductions of MetLife
Foundation contributions, integration costs incurred in the prior year and lower legal costs.
These increases in other expenses were partially offset by a decrease in the Auto & Home segment primarily related to lower information
technology and advertising costs, partially offset by minor changes in a variety of expense categories.
These increases in other expenses were partially offset by a decrease in the Reinsurance segment primarily due to a decrease in
expenses associated with DAC, partially offset by an increase in interest expense associated with note offerings in both years, an increase
in minority interest expense, as well as an increase in compensation and overhead-related expenses associated with RGA’s international
expansion and general growth in the operations.
Net Income
Income tax expense for the year ended December 31, 2007 was $1,759 million, or 29% of income from continuing operations before
provision for income tax, compared with $1,097 million, or 26% of such income, for the comparable 2006 period. The 2007 and 2006
effective tax rates differ from the corporate tax rate of 35% primarily due to the impact of non-taxable investment income and tax credits for
investments in low income housing. In addition, the increase in the effective rate for FIN 48 liability additions is entirely offset by an increase
in non-taxable investment income. The 2007 period includes a benefit for decrease in international deferred tax valuation allowances and
the 2006 period included a prior year benefit for international taxes. Lastly, the 2006 period included benefit for a “provision-to-filed return”
adjustment regarding non-taxable investment income.
Income from discontinued operations, net of income tax, decreased by $3,185 million, or 99%, to $37 million for the year ended
December 31, 2007 from $3,222 million for the comparable 2006 period. The decrease in income from discontinued operations was
primarily due a gain of $3 billion, net of income tax, on the sale of the Peter Cooper Village and Stuyvesant Town properties in Manhattan,
New York, that was recognized during the year ended December 31, 2006. In addition, there was lower net investment income and net
investment gains (losses) of $144 million, net of income tax, from discontinued operations related to real estate properties sold or held-for-
sale during the year ended December 31, 2007 as compared to the year ended December 31, 2006. Also contributing to the decrease
was lower income from discontinued operations of $23 million, net of income tax, related to the sale of MetLife Australia’s annuities and
pension businesses to a third party in the third quarter of 2007 and lower income from discontinued operations of $18 million, net of
income tax, related to the sale of SSRM resulting from a reduction in additional proceeds from the sale received during the year ended
December 31, 2007 as compared to the year December 31, 2006.
Year ended December 31, 2006 compared with the year ended December 31, 2005 — The Company
Income from Continuing Operations
Income from continuing operations was $3,071 million for the years ended December 31, 2006 and December 31, 2005. Excluding the
acquisition of Travelers, which contributed $298 million during the first six months of 2006 to the year over year increase, income from
continuing operations decreased by $298 million. Income from continuing operations for the years ended December 31, 2006 and 2005
included the impact of certain transactions or events, the timing, nature and amount of which are generally unpredictable. These
transactions are described in each applicable segment’s discussion. These items contributed a charge of $23 million, net of income tax, to
the year ended December 31, 2006. These items contributed a benefit of $48 million, net of income tax, to the year ended December 31,
2005. Excluding the impact of these items and the acquisition of Travelers, income from continuing operations decreased by $227 million
for the year ended December 31, 2006 compared to the prior 2005 period.
18 MetLife, Inc.
The following table provides the change in income from continuing operations by segment, excluding Travelers, and certain transactions
as mentioned above:
$ Change
% of Total
$ Change
(In millions)
Institutional . . . . . . . . . . . . . . . . . . . . . . . . . . . . . . . . . . . . . . . . . . . . . . . . . . . . . . . . $(319) (140)%
Individual . . . . . . . . . . . . . . . . . . . . . . . . . . . . . . . . . . . . . . . . . . . . . . . . . . . . . . . . . (68) (30)
International . . . . . . . . . . . . . . . . . . . . . . . . . . . . . . . . . . . . . . . . . . . . . . . . . . . . . . . (33) (15)
Corporate & Other . . . . . . . . . . . . . . . . . . . . . . . . . . . . . . . . . . . . . . . . . . . . . . . . . . . (25) (11)
Auto & Home. . . . . . . . . . . . . . . . . . . . . . . . . . . . . . . . . . . . . . . . . . . . . . . . . . . . . . . 192 85
Reinsurance . . . . . . . . . . . . . . . . . . . . . . . . . . . . . . . . . . . . . . . . . . . . . . . . . . . . . . . 26 11
Total change, net of income tax . . . . . . . . . . . . . . . . . . . . . . . . . . . . . . . . . . . . . . $(227) (100)%
The Institutional segment’s income from continuing operations decreased primarily due to an increase in net investment losses, a
decline in interest margins, an increase in operating expenses, which included a charge associated with costs related to the sale of certain
small market recordkeeping businesses, a charge associated with non-deferrable LTC commissions expense and a charge associated with
costs related to a previously announced regulatory settlement, partially offset by the impact of integration costs in the prior year and
favorable underwriting results.
The Individual segment’s income from continuing operations decreased as a result of an increase in net investment losses, a decline in
interest margins, higher expenses and annuity benefits, as well as increases in interest credited to policyholder account balances and
policyholder dividends. These decreases were partially offset by increased fee income related to the growth in separate account products,
favorable underwriting results in life products, lower DAC amortization and a decrease in the closed block-related policyholder dividend
obligation.
Income from continuing operations in Corporate & Other decreased primarily due to higher investment losses, higher interest expense
on debt, corporate support expenses, interest credited to bankholder deposits and legal-related costs, partially offset by an increase in tax
benefits, an increase in net investment income, lower integration costs and an increase in other revenues.
The decrease in income from continuing operations in the International segment was primarily attributable to the following factors:
• Taiwan had a decrease due to a loss recognition adjustment and a restructuring charge, partially offset by reserve refinements
associated with the implementation of a new valuation system.
• Income from continuing operations decreased in Canada primarily due to the realignment of economic capital in the prior year.
• Income from continuing operations in Mexico decreased primarily due to an increase in amortization of DAC, higher operating
expenses, the net impact of an adjustment to the liability for experience refunds on a block of business, a decrease in various one-
time other revenue items in both periods, as well as an increase in income tax expense due to a tax benefit realized in the prior year.
These decreases in Mexico were partially offset by a decrease in certain policyholder liabilities caused by a decrease in unrealized
investment gains on invested assets supporting those liabilities relative to the prior year, a decrease in policyholder benefits
associated with a large group policy that was not renewed by the policyholder, a benefit in the current year from the release of
liabilities for pending claims that were determined to be invalid following a review, and the unfavorable impact in the prior year of
contingent liabilities.
• In addition, a decrease in Brazil was primarily due to an increase in policyholder benefits and claims related to an increase in future
policyholder benefit liabilities on specific blocks of business and an increase in litigation liabilities, as well as adverse claim
experience in the current year.
• The home office recorded higher infrastructure expenditures in support of segment growth, as well as a contingent tax liability. This
was offset by a reduction in the amount charged for economic capital.
• Results of the Company’s investment in Japan decreased primarily due to variability in the hedging program.
• In addition, expenses related to the Company’s start-up operations in Ireland reduced income from continuing operations. A valuation
allowance was established against the deferred tax benefit resulting from the Ireland losses.
• Partially offsetting these decreases in income from continuing operations were increases in Chile and the United Kingdom due to
continued growth of the in-force business.
• In addition, an increase occurred in Australia due to reserve strengthening on a block of business in the prior year.
• South Korea’s income from continuing operations increased due to growth in the in-force business and the implementation of a more
refined reserve valuation system.
• Argentina’s income from continuing operations increased due to higher net investment income resulting from capital contributions,
the release of liabilities for pending claims that were determined to be invalid following a review, the favorable impact of foreign
currency exchange rates and inflation rates on certain contingent liabilities, the utilization of net operating losses for which a valuation
allowance had been previously established, and an increase in the prior year period of a deferred income tax valuation allowance, as
well as business growth. Changes in foreign currency exchange rates also contributed to the increase.
Partially offsetting the decreases in income from continuing operations was an increase in the Auto & Home segment primarily due to a
loss in the third quarter of 2005 related to Hurricane Katrina, favorable development of prior year loss reserves, improvement in non-
catastrophe loss experience and a reduction in loss adjustment expenses. These increases were partially offset by higher catastrophe
losses, excluding Hurricanes Katrina and Wilma, in the current year period, and decreases in net earned premiums, other revenues, and
net investment income, as well as an increase in other expenses.
Income from continuing operations in the Reinsurance segment increased primarily due to added business in-force from facultative and
automatic treaties and renewal premiums on existing blocks of business in the U.S. and international operations, an increase in net
investment income due to growth in the invested asset base and an increase in other revenues. These items were partially offset by
unfavorable mortality experience, an increase in liabilities associated with Reinsurance Group of America, Incorporated’s (“RGA”) Argentine
19MetLife, Inc.
pension business in the prior period and an increase in other expenses, primarily related to expenses associated with DAC, interest
expense, minority interest expense and equity compensation costs.
Revenues and Expenses
Premiums, Fees and Other Revenues
Premiums, fees and other revenues increased by $2,595 million, or 9%, to $32,554 million for the year ended December 31, 2006 from
$29,959 million for the comparable 2005 period. Excluding the impact of the acquisition of Travelers, which contributed $945 million during
the first six months of 2006 to the year over year increase, premiums, fees and other revenues increased by $1,650 million.
The following table provides the change in premiums, fees and other revenues by segment, excluding Travelers:
$ Change
% of Total
$ Change
(In millions)
Reinsurance . . . . . . . . . . . . . . . . . . . . . . . . . . . . . . . . . . . . . . . . . . . . . . . . . . . . . . . $ 487 30%
International . . . . . . . . . . . . . . . . . . . . . . . . . . . . . . . . . . . . . . . . . . . . . . . . . . . . . . . 470 28
Institutional . . . . . . . . . . . . . . . . . . . . . . . . . . . . . . . . . . . . . . . . . . . . . . . . . . . . . . . . 458 28
Individual . . . . . . . . . . . . . . . . . . . . . . . . . . . . . . . . . . . . . . . . . . . . . . . . . . . . . . . . . 229 14
Corporate & Other . . . . . . . . . . . . . . . . . . . . . . . . . . . . . . . . . . . . . . . . . . . . . . . . . . . 4 —
Auto & Home. . . . . . . . . . . . . . . . . . . . . . . . . . . . . . . . . . . . . . . . . . . . . . . . . . . . . . . 2 —
Total change . . . . . . . . . . . . . . . . . . . . . . . . . . . . . . . . . . . . . . . . . . . . . . . . . . . $1,650 100%
The growth in the Reinsurance segment was primarily attributable to premiums from new facultative and automatic treaties and renewal
premiums on existing blocks of business in the U.S. and international operations.
The growth in the International segment was primarily due to the following factors:
• An increase in Mexico’s premiums, fees and other revenues due to growth in the business and higher fees, partially offset by an
adjustment for experience refunds on a block of business and various one- time other revenue items in both years.
• South Korea’s premiums, fees and other revenues increased due to business growth, as well as the favorable impact of foreign
currency exchange rates.
• Brazil’s premiums, fees and other revenues increased due to business growth and higher bancassurance business, as well as an
increase in amounts retained under reinsurance arrangements.
• Chile’s premiums, fees and other revenues increased primarily due to higher institutional premiums through its bank distribution
channel, partially offset by lower annuity sales.
• Business growth in the United Kingdom, Argentina, Australia and Taiwan, as well as the favorable impact of changes in foreign
currency exchange rates, also contributed to the increase in the International segment.
The growth in the Institutional segment was primarily due to growth in the dental, disability, AD&D products, as well as growth in the LTC
and IDI businesses, all within the non-medical health & other business. Additionally, growth in the group life business was attributable to the
impact of sales and favorable persistency largely in the term life business. These increases in the non-medical health & other and group life
businesses were partially offset by a decrease in the retirement & savings business. The decline in retirement & savings was primarily due
to a decline in premiums from structured settlements predominantly due to lower sales, partially offset by an increase in master terminal
funding premiums (“MTF”).
The growth in the Individual segment was primarily due to higher fee income from universal life and investment-type products and an
increase in premiums from other life products, partially offset by a decrease in immediate annuity premiums and a decline in premiums
associated with the Company’s closed block business as this business continues to run-off.
Net Investment Income
Net investment income increased by $2,326 million, or 16%, to $17,082 million for the year ended December 31, 2006 from
$14,756 million for the comparable 2005 period. Excluding the impact of the acquisition of Travelers, which contributed $1,425 million
during the first six months of 2006 to the year over year increase, net investment income increased by $901 million of which management
attributes $648 million to growth in the average asset base and $253 million to an increase in yields. This increase was primarily due to an
overall increase in the asset base, an increase in fixed maturity security yields, improved results on real estate and real estate joint
ventures, mortgage loans, and other limited partnership interests, as well as higher short-term interest rates on cash equivalents and short-
term investments. These increases were partially offset by a decline in investment income from securities lending results, and bond and
commercial mortgage prepayment fees.
Interest Margin
Interest margin, which represents the difference between interest earned and interest credited to policyholder account balances,
decreased in the Institutional and Individual segments for the year ended December 31, 2006 as compared to the prior year. Interest
earned approximates net investment income on investable assets attributed to the segment with minor adjustments related to the
consolidation of certain separate accounts and other minor non-policyholder elements. Interest credited is the amount attributed to
insurance products, recorded in policyholder benefits and claims, and the amount credited to policyholder account balances for
investment-type products, recorded in interest credited to policyholder account balances. Interest credited on insurance products
reflects the current period impact of the interest rate assumptions established at issuance or acquisition. Interest credited to policyholder
account balances is subject to contractual terms, including some minimum guarantees. This tends to move gradually over time to reflect
market interest rate movements and may reflect actions by management to respond to competitive pressures and, therefore, generally
does not introduce volatility in expense.
20 MetLife, Inc.
Net Investment Gains (Losses)
Net investment losses increased by $1,296 million to a loss of $1,382 million for the year ended December 31, 2006 from a loss of
$86 million for the comparable 2005 period. Excluding the impact of the acquisition of Travelers, which contributed a loss of $294 million
during the first six months of 2006 to the year over year increase, net investment losses increased by $1,002 million. The increase in net
investment losses was due to a combination of losses from the mark-to-market on derivatives and foreign currency transaction losses
during 2006, largely driven by increases in U.S. interest rates and the weakening of the dollar against the major currencies the Company
hedges, notably the euro and pound sterling.
Underwriting
Underwriting results are generally the difference between the portion of premium and fee income intended to cover mortality, morbidity
or other insurance costs, less claims incurred, and the change in insurance-related liabilities. Underwriting results are significantly
influenced by mortality, morbidity or other insurance-related experience trends and the reinsurance activity related to certain blocks of
business and, as a result, can fluctuate from period to period. Underwriting results were favorable within the life products in the Individual
segment, as well as in the Reinsurance segment, and in the group life and non-medical health & other products in the Institutional segment.
Retirement & saving’s underwriting results were mixed across several products in the Institutional segment. Underwriting results, excluding
catastrophes, in the Auto & Home segment were favorable for the year ended December 31, 2006, as the combined ratio, excluding
catastrophes, decreased to 82.8% from 86.7% for the year ended December 31, 2005. Underwriting results in the International segment
increased commensurate with the growth in the business for most countries with the exception of Brazil, which experienced unfavorable
claim experience, and Argentina, which experienced improved claim experience.
Other Expenses
Other expenses increased by $1,519 million, or 16%, to $10,783 million for the year ended December 31, 2006 from $9,264 million for
the comparable 2005 period. Excluding the impact of the acquisition of Travelers, which contributed $605 million during the first six months
of 2006 to the year over year increase, other expenses increased by $914 million. The year ended December 31, 2006 includes a
$35 million contribution to the MetLife Foundation. The year ended December 31, 2005 included a $28 million benefit associated with the
reduction of a previously established real estate transfer tax liability related to MLIC’s demutualization in 2000. Excluding these items and
the acquisition of Travelers, other expenses increased by $851 million from the comparable 2005 period.
The following table provides the change in other expenses by segment, excluding Travelers, and certain transactions as mentioned
above:
$ Change
% of Total
$ Change
(In millions)
International . . . . . . . . . . . . . . . . . . . . . . . . . . . . . . . . . . . . . . . . . . . . . . . . . . . . . . . $326 38%
Corporate & Other . . . . . . . . . . . . . . . . . . . . . . . . . . . . . . . . . . . . . . . . . . . . . . . . . . . 287 34
Reinsurance . . . . . . . . . . . . . . . . . . . . . . . . . . . . . . . . . . . . . . . . . . . . . . . . . . . . . . . 236 28
Institutional . . . . . . . . . . . . . . . . . . . . . . . . . . . . . . . . . . . . . . . . . . . . . . . . . . . . . . . . 79 9
Auto & Home. . . . . . . . . . . . . . . . . . . . . . . . . . . . . . . . . . . . . . . . . . . . . . . . . . . . . . . 17 2
Individual . . . . . . . . . . . . . . . . . . . . . . . . . . . . . . . . . . . . . . . . . . . . . . . . . . . . . . . . . (94) (11)
Total change . . . . . . . . . . . . . . . . . . . . . . . . . . . . . . . . . . . . . . . . . . . . . . . . . . . $851 100%
The International segment contributed to the year over year increase in other expenses primarily due to business growth commensurate
with the increase in revenues discussed above and changes in foreign currency exchange rates. This was driven by the following factors:
• Taiwan’s other expenses increased due to an increase in amortization of DAC, due to a loss recognition adjustment, refinements
associated with the implementation of a new valuation system and a restructuring charge.
• Mexico’s other expenses increased due to an increase in commissions commensurate with the revenue growth, higher DAC
amortization, higher expenses related to growth initiatives and additional expenses associated with the Mexican pension business,
partially offset by the unfavorable impact of contingent liabilities that were established in the prior year related to potential employment
matters and which were eliminated in the current year.
• South Korea’s other expenses increased due to an increase in DAC amortization and general expenses, partially offset by a decrease
in DAC amortization associated with the implementation of a more refined reserve valuation system.
• Brazil’s other expenses increased due to an increase in litigation liabilities.
• Other expenses associated with the home office increased due to an increase in expenditures for information technology projects,
growth initiative projects and integration costs, as well as an increase in compensation expense.
• In addition, expenses were incurred related to the start-up of operations in Ireland.
Corporate & Other contributed to the year over year variance in other expenses primarily due to higher interest expense, corporate
support expenses, interest credited to bankholder deposits at MetLife Bank and legal-related costs, partially offset by lower integration
costs.
The Reinsurance segment also contributed to the increase in other expenses primarily due to an increase in expenses associated with
DAC, interest expense and minority interest, as well as an increase in compensation, including equity compensation expense and
overhead-related expenses.
The Institutional segment contributed to the year over year increase primarily due to an increase in non-deferrable volume-related
expenses, a charge associated with costs related to the sale of certain small market recordkeeping businesses, a charge associated with
non-deferrable LTC commissions expense and a charge associated with costs related to a previously announced regulatory settlement, all
within the current year, partially offset by the reduction in Travelers-related integration costs, principally incentive accruals and an
adjustment of DAC for certain LTC products.
21MetLife, Inc.
The Auto & Home segment contributed to the year over year increase primarily due to expenditures related to information technology,
advertising and compensation costs.
Partially offsetting the increases in other expenses was a decrease in the Individual segment. This decrease was primarily due to lower
DAC amortization, partially offset by higher general spending in the current year, despite higher corporate incentives. In addition, the impact
of revisions to certain expenses, premium tax, policyholder liabilities and pension and postretirement liabilities, in both periods, increased
other expenses in the current year period.
Net Income
Income tax expense for the year ended December 31, 2006 was $1,097 million, or 26% of income from continuing operations before
provision for income tax, compared with $1,222 million, or 28%, of such income, for the comparable 2005 period. Excluding the impact of
the acquisition of Travelers, which contributed $118 million during the first six months of 2006, income tax expense was $979 million, or
26%, of income from continuing operations before provision for income tax, compared with $1,222 million, or 28%, of such income, for the
comparable 2005 period. The 2006 and 2005 effective tax rates differ from the corporate tax rate of 35% primarily due to the impact of non-
taxable investment income and tax credits for investments in low income housing. The 2006 effective tax rate also includes an adjustment
of a benefit of $33 million consisting primarily of a revision in the estimate of income tax for 2005, and the 2005 effective tax rate also
includes a tax benefit of $27 million related to the repatriation of foreign earnings pursuant to Internal Revenue Code Section 965 for which
a U.S. deferred tax provision had previously been recorded and an adjustment of a benefit of $31 million consisting primarily of a revision in
the estimate of income tax for 2004.
Income from discontinued operations consisted of net investment income and net investment gains related to real estate properties that
the Company had classified as available-for-sale or had sold and, for the years ended December 31, 2006 and 2005, the operations and
gain upon disposal from the sale of SSRM on January 31, 2005 and for the year ended December 31, 2005, the operations of MetLife
Indonesia which was sold on September 29, 2005. Income from discontinued operations, net of income tax, increased by $1,579 million,
or 96%, to $3,222 million for the year ended December 31, 2006 from $1,643 million for the comparable 2005 period. This increase is
primarily due to a gain of $3 billion, net of income tax, on the sale of the Peter Cooper Village and Stuyvesant Town properties in Manhattan,
New York, as well as a gain of $32 million, net of income tax, related to the sale of SSRM during the year ended December 31, 2006. This
increase was partially offset by gains during the year ended December 31, 2005 including $1,193 million, net of income tax, on the sales of
the One Madison Avenue and 200 Park Avenue properties in Manhattan, New York, as well as gains on the sales of SSRM and MetLife
Indonesia of $177 million and $10 million, respectively, both net of income tax. In addition, there was lower net investment income and net
investment gains from discontinued operations related to real estate properties sold or held-for-sale during the year ended December 31,
2006 compared to the year ended December 31, 2005.
Dividends on the Holding Company’s Preferred Shares issued in connection with financing the acquisition of Travelers increased by
$71 million, to $134 million for the year ended December 31, 2006, from $63 million for the comparable 2005 period, as the preferred
stock was issued in June 2005.
22 MetLife, Inc.
Institutional
The following table presents consolidated financial information for the Institutional segment for the years indicated:
2007 2006 2005
Years Ended December 31,
(In millions)
Revenues
Premiums . . . . . . . . . . . . . . . . . . . . . . . . . . . . . . . . . . . . . . . . . . . . . . . . . . . $12,392 $11,867 $11,387
Universal life and investment-type product policy fees . . . . . . . . . . . . . . . . . . . . . . 803 775 772
Net investment income . . . . . . . . . . . . . . . . . . . . . . . . . . . . . . . . . . . . . . . . . . 8,179 7,265 5,942
Other revenues . . . . . . . . . . . . . . . . . . . . . . . . . . . . . . . . . . . . . . . . . . . . . . . 726 685 653
Net investment gains (losses) . . . . . . . . . . . . . . . . . . . . . . . . . . . . . . . . . . . . . . (580) (631) (10)
Total revenues . . . . . . . . . . . . . . . . . . . . . . . . . . . . . . . . . . . . . . . . . . . . . . 21,520 19,961 18,744
Expenses
Policyholder benefits and claims . . . . . . . . . . . . . . . . . . . . . . . . . . . . . . . . . . . . 13,806 13,367 12,776
Interest credited to policyholder account balances . . . . . . . . . . . . . . . . . . . . . . . . 3,094 2,593 1,652
Policyholder dividends . . . . . . . . . . . . . . . . . . . . . . . . . . . . . . . . . . . . . . . . . . — — 1
Other expenses . . . . . . . . . . . . . . . . . . . . . . . . . . . . . . . . . . . . . . . . . . . . . . . 2,438 2,314 2,229
Total expenses . . . . . . . . . . . . . . . . . . . . . . . . . . . . . . . . . . . . . . . . . . . . . . 19,338 18,274 16,658
Income from continuing operations before provision for income tax . . . . . . . . . . . . . . 2,182 1,687 2,086
Provision for income tax . . . . . . . . . . . . . . . . . . . . . . . . . . . . . . . . . . . . . . . . . 743 562 698
Income from continuing operations . . . . . . . . . . . . . . . . . . . . . . . . . . . . . . . . . . 1,439 1,125 1,388
Income from discontinued operations, net of income tax . . . . . . . . . . . . . . . . . . . . 10 42 174
Net income . . . . . . . . . . . . . . . . . . . . . . . . . . . . . . . . . . . . . . . . . . . . . . . . $ 1,449 $ 1,167 $ 1,562
Year ended December 31, 2007 compared with the year ended December 31, 2006 — Institutional
Income from Continuing Operations
Income from continuing operations increased $314 million, or 28%, to $1,439 million for the year ended December 31, 2007 from
$1,125 million for the comparable 2006 period.
Included in this increase are higher earnings of $33 million, net of income tax, from lower net investment losses. In addition, higher
earnings of $11 million, net of income tax, resulted from an increase in policyholder benefits and claims related to net investment gains
(losses). Excluding the impact of net investment gains (losses), income from continuing operations increased by $270 million, net of
income tax, compared to the prior year.
Interest margins increased $229 million, net of income tax, compared to the prior year. Management attributes this increase to a
$146 million increase in retirement & savings, a $46 million increase in group life and a $37 million increase in non-medical health and
other, respectively, all net of income tax. Interest margin is the difference between interest earned and interest credited to policyholder
account balances. Interest earned approximates net investment income on investable assets attributed to the segment with minor
adjustments related to the consolidation of certain separate accounts and other minor non-policyholder elements. Interest credited is the
amount attributed to insurance products, recorded in policyholder benefits and claims, and the amount credited to policyholder account
balances for investment-type products, recorded in interest credited to policyholder account balances. Interest credited on insurance
products reflects the current year impact of the interest rate assumptions established at issuance or acquisition. Interest credited to
policyholder account balances is subject to contractual terms, including some minimum guarantees. This tends to move gradually over
time to reflect market interest rate movements, and may reflect actions by management to respond to competitive pressures and,
therefore, generally does not introduce volatility in expense.
An increase in underwriting results of $89 million, net of income tax, compared to the prior year, contributed to the increase in income
from continuing operations. Management attributes this increase primarily to the non-medical health & other, group life and retirement &
savings businesses with increases of $65 million, $16 million and $8 million, all net of income tax, respectively.
Underwriting results are generally the difference between the portion of premium and fee income intended to cover mortality, morbidity,
or other insurance costs less claims incurred, and the change in insurance-related liabilities. Underwriting results are significantly
influenced by mortality, morbidity, or other insurance-related experience trends, as well as the reinsurance activity related to certain
blocks of business. Consequently, results can fluctuate from period to period.
Partially offsetting this increase in income from continuing operations were higher expenses related to an increase in non-deferrable
volume-related expenses and corporate support expenses of $72 million, net of income tax, as well as an increase in DAC amortization of
$44 million, net of income tax, primarily due to a $40 million, net of income tax, charge due to the ongoing impact on DAC and VOBA
amortization resulting from the implementation of SOP 05-1 in the current year. This increase in expense was partially offset by the impact
of certain revisions in both years for a net decrease of $34 million, net of income tax. The remaining increase in operating expenses was
more than offset by the remaining increase in premiums, fees, and other revenues.
Revenues
Total revenues, excluding net investment gains (losses), increased by $1,508 million, or 7%, to $22,100 million for the year ended
December 31, 2007 from $20,592 million for the comparable 2006 period.
23MetLife, Inc.
Net investment income increased by $914 million. Management attributes $742 million of this increase to growth in the average asset
base primarily within mortgage loans on real estate, fixed maturity securities, real estate joint ventures, other limited partnership interests,
and equity securities, driven by continued business growth, particularly growth in the funding agreements and global GIC businesses.
Additionally, management attributes $172 million of this increase in net investment income to an increase in yields, primarily due to higher
returns on fixed maturity securities, improved securities lending results, other limited partnership interests, and equity securities, partially
offset by a decline in yields on real estate and real estate joint ventures and mortgage loans.
The increase of $594 million in premiums, fees and other revenues was largely due to increases in the non-medical health & other
business of $483 million, primarily due to growth in the dental, disability, AD&D and IDI businesses of $478 million. Partially offsetting these
increases in the non-medical health & other business is a decline in the LTC business of $7 million, which includes a $66 million decrease
resulting from a shift to deposit liability-type contracts in the current year. Excluding this shift, LTC premiums would have increased due to
growth in the business. Group life increased $345 million, which management primarily attributes to a $262 million increase in term life,
primarily due to growth in the business from new sales and an increase in reinsurance assumed, partially offset by the impact of an increase
in experience rated refunds. In addition, corporate-owned life insurance and life insurance sold to postretirement benefit plans increased
by $65 million and $30 million, respectively. The increase in corporate-owned life insurance is largely attributable to fees earned on a large
sale in the current year. These increases in group life’s premiums, fees and other revenues were partially offset by a decrease of $5 million
in the universal life insurance products. Partially offsetting the increase in premiums, fees and other revenues was a decline in retirement &
savings’ premiums, fees and other revenues of $234 million, primarily from declines of $158 million and $79 million in structured settlement
and pension closeout premiums, respectively, partially offset by an increase of $3 million across several products. The declines in the
structured settlement and pension closeout businesses are predominantly due to the impact of lower sales in the current year. Premiums,
fees and other revenues from retirement & savings products are significantly influenced by large transactions and, as a result, can fluctuate
from period to period.
Expenses
Total expenses increased by $1,064 million, or 6%, to $19,338 million for the year ended December 31, 2007 from $18,274 million for
the comparable 2006 period.
The increase in expenses was attributable to higher interest credited to policyholder account balances of $501 million, higher
policyholder benefits and claims of $439 million and an increase in operating expenses of $124 million.
Management attributes the increase of $501 million in interest credited to policyholder account balances to a $352 million increase
solely from growth in the average policyholder account balances, primarily resulting from growth in global GICs and funding agreements
within the retirement & savings business and a $149 million increase from a rise in average crediting rates, largely due to the global GIC
program, coupled with a rise in short-term interest rates in the current year.
The increase in policyholder benefits and claims of $439 million included a $16 million decrease related to net investment gains
(losses). Excluding the decrease related to net investment gains (losses), policyholder benefits and claims increased by $455 million. Non-
medical health & other’s policyholder benefits and claims increased by $385 million. This increase was largely due to a $371 million
increase in the dental, disability, IDI and AD&D businesses, resulting from the aforementioned growth in business. This increase was
partially offset by favorable claim experience in the dental business and favorable morbidity experience in the disability, IDI and AD&D
businesses. This increase included charges related to certain refinements of $14 million in the current year in LTD and the impact of a
$22 million disability liability reduction in the prior year, which contributed to the increase. An increase in LTC of $14 million is largely
attributable to business growth and an increase in interest credited, partially offset by the aforementioned $66 million shift to deposit
liability-type contracts and the impact of more favorable claim experience in the current year. Group life’s policyholder benefits and claims
increased by $264 million due mostly to an increase in the term life business of $245 million, which included the impact of less favorable
mortality in the term life product, partially offset by the net impact of favorable liability refinements of $12 million in the current year. An
increase of $29 million in life insurance sold to postretirement plans and $25 million for other group life products, including corporate-
owned life insurance, also contributed to the increase in policyholder benefits and claims for group life. The increases in term life and life
insurance sold to postretirement benefit plans are commensurate with the aforementioned premiums increases. These increases were
partially offset by a decline in universal group life products of $36 million, primarily due to favorable claim experience. Retirement & savings’
policyholder benefits decreased by $194 million, which was largely due to decreases in the pension closeout and structured settlement
businesses of $98 million and $97 million, respectively. The decrease in pension closeouts was primarily due to the aforementioned
decrease in premiums and a decrease in interest credited. The decline in structured settlements was primarily a result of the aforemen-
tioned decline in premiums, partially offset by an increase in interest credited and less favorable mortality experience in the current year. In
addition, this decrease included the net impact of favorable liability refinements in the current year, which contributed a decrease of
$20 million, and the net impact of favorable liability refinements in the prior year of $57 million, largely related to business associated with
the acquisition of Travelers, principally in the structured settlement, pension closeout and general account businesses.
Higher other expenses of $124 million included an increase in non-deferrable volume-related expenses and corporate support
expenses of $108 million. Non-deferrable volume-related expenses included those expenses associated with direct departmental
spending, information technology, commissions and premium taxes. Corporate support expenses included advertising, corporate over-
head and consulting fees. The increase in other expenses was also attributable to higher DAC amortization of $68 million, primarily due to a
$61 million charge as a result of the ongoing impact of DAC and VOBA amortization resulting from the implementation of SOP 05-1 in the
current year. In addition, a charge of $14 million related to the reimbursement of certain dental claims and a $15 million charge related to
the establishment of a contingent legal liability in the current year contributed to the increase in other expenses. The impact of certain
revisions in both years also contributed to a net increase in other expenses of $2 million. These increases were partially offset by a
$13 million benefit related to a reduction of an allowance for doubtful accounts in the current year. Additionally, the prior year included the
impact of a $22 million charge for non-deferrable LTC commissions expense, a charge of $24 million associated with costs related to the
sale of certain small market recordkeeping businesses and $24 million related to a regulatory settlement, which reduced other expenses in
the current year.
24 MetLife, Inc.
Year ended December 31, 2006 compared with the year ended December 31, 2005 — Institutional
Income from Continuing Operations
Income from continuing operations decreased $263 million, or 19%, to $1,125 million for the year ended December 31, 2006 from
$1,388 million for the comparable 2005 period. The acquisition of Travelers contributed $56 million during the first six months of 2006 to
income from continuing operations, which included a decline of $104 million, net of income tax, of net investment gains (losses). Excluding
the impact of Travelers, income from continuing operations decreased $319 million, or 23%, from the comparable 2005 period.
Included in this decrease was a decline of $300 million, net of income tax, in net investment gains (losses), as well as a decline of
$18 million, net of income tax, resulting from an increase in policyholder benefits and claims related to net investment gains (losses).
Excluding the impact of Travelers and the decline in net investment gains (losses), income from continuing operations was flat when
compared to the prior year period.
A decrease in interest margins of $84 million, net of income tax, compared to the prior year period contributed to the decrease in
income from continuing operations. Management attributes this decrease primarily to the group life and retirement & savings businesses of
$60 million and $51 million, both net of income tax, respectively. Partially offsetting these decreases was an increase of $27 million, net of
income tax, in the non-medical health & other business. Interest margin is the difference between interest earned and interest credited to
policyholder account balances. Interest earned approximates net investment income on investable assets attributed to the segment with
minor adjustments related to the consolidation of certain separate accounts and other minor non-policyholder elements. Interest credited is
the amount attributed to insurance products, recorded in policyholder benefits and claims, and the amount credited to policyholder
account balances for investment-type products, recorded in interest credited to policyholder account balances. Interest credited on
insurance products reflects the current period impact of the interest rate assumptions established at issuance or acquisition. Interest
credited to policyholder account balances is subject to contractual terms, including some minimum guarantees. This tends to move
gradually over time to reflect market interest rate movements, may reflect actions by management to respond to competitive pressures and
therefore, generally does not introduce volatility in expense.
The year over year variance in income from continuing operations included charges recorded in other expenses of $17 million, net of
income tax, associated with costs related to the sale of certain small market recordkeeping businesses, $16 million, net of income tax, due
to costs associated with a previously announced regulatory settlement and $15 million, net of income tax, associated with non-deferrable
LTC commission expense. Partially offsetting these increases in operating expenses were benefits due to prior year charges of $28 million,
net of income tax, as a result of the impact of Travelers’ integration costs and $14 million, net of income tax, related to an adjustment of
DAC for certain LTC products.
Partially offsetting these decreases in income from continuing operations was an increase in underwriting results of $97 million, net of
income tax, compared to the prior year period. This increase was primarily due to favorable results of $48 million, $38 million and
$11 million, all net of income tax, in the group life, the non-medical health & other businesses and the retirement & savings businesses,
respectively.
The results in group life were primarily due to favorable mortality results, predominantly in the term life business, which included a
benefit from reserve refinements in the current year.
Non-medical health & other’s favorable underwriting results were primarily due to improvements in the IDI and dental businesses. The IDI
results included certain reserve refinements in the prior year. Partially offsetting these increases was a decrease in the AD&D and disability
businesses. Disability’s results include the benefit of prior and current year reserve refinements.
Retirement & savings’ underwriting results were favorable with mixed underwriting across several products. Underwriting results are
generally the difference between the portion of premium and fee income intended to cover mortality, morbidity, or other insurance costs
less claims incurred, and the change in insurance-related liabilities. Underwriting results are significantly influenced by mortality, morbidity,
or other insurance-related experience trends and the reinsurance activity related to certain blocks of business.
The remaining increase in operating expenses more than offset the remaining increase in premiums, fees and other revenues.
Revenues
Total revenues, excluding net investment gains (losses), increased by $1,838 million, or 10%, to $20,592 million for the year ended
December 31, 2006 from $18,754 million for the comparable 2005 period. The acquisition of Travelers contributed $797 million during the
first six months of 2006 to the year over year increase. Excluding the impact of the Travelers acquisition, such revenues increased by
$1,041 million, or 6%, from the comparable 2005 period. This increase was comprised of higher net investment income of $583 million and
growth in premiums, fees and other revenues of $458 million.
Net investment income increased by $583 million of which management attributes $463 million to growth in the average asset base
driven by business growth throughout 2005 and 2006, particularly in the GIC and structured settlement businesses and $120 million to an
increase in yields. The increase in yields was primarily attributable to higher yields on fixed maturity securities, an increase in short-term
rates and higher returns on joint ventures. These increases were partially offset by a decline in securities lending results and commercial
mortgage prepayment fees.
The increase of $458 million in premiums, fees and other revenues was largely due to increases in the non-medical health & other
business of $408 million, primarily due to growth in the dental, disability and AD&D products of $255 million. In addition, continued growth
in the LTC and IDI businesses contributed $117 million and $25 million, respectively. Group life increased by $296 million, which
management primarily attributes to the impact of sales and favorable persistency largely in term life business, which includes a significant
increase in premiums from two large customers. Partially offsetting these increases was a decline in retirement & savings’ premiums, fees
and other revenues of $246 million, resulting primarily from a decline of $320 million in structured settlements, predominantly due to the
impact of lower sales. This decline was partially offset by a $83 million increase in MTF premiums. Premiums, fees and other revenues from
retirement & savings products are significantly influenced by large transactions and, as a result, can fluctuate from period to period.
Expenses
Total expenses increased by $1,616 million, or 10%, to $18,274 million for the year ended December 31, 2006 from $16,658 million for
the comparable 2005 period. The acquisition of Travelers contributed $551 million during the first six months of 2006 to the year over year
25MetLife, Inc.
increase. Excluding the impact of the Travelers acquisition, total expenses increased $1,065 million, or 6%, from the comparable 2005
period.
The increase in expenses was attributable to higher interest credited to policyholder account balances of $621 million, policyholder
benefits and claims of $366 million and operating expenses of $79 million.
Management attributes the increase of $621 million in interest credited to policyholder account balances to $433 million from an
increase in average crediting rates, which was largely due to the impact of higher short-term rates in the current year period and
$188 million solely from growth in the average policyholder account balances, primarily resulting from GICs within the retirement & savings
business.
The increases in policyholder benefits and claims of $366 million included a $27 million increase related to net investment gains
(losses). Excluding the increase related to net investment gains (losses), policyholder benefits and claims increased by $339 million. Non-
medical health & other’s policyholder benefits and claims increased by $306 million, predominantly due to the aforementioned growth in
business, as well as unfavorable morbidity in disability and unfavorable claim experience in AD&D. Partially offsetting these increases was
favorable claim and morbidity experience in IDI, as well as the impact of an establishment of a $25 million liability for future losses in the
prior year. In addition, favorable claim experience in the current year reduced dental policyholder benefits and claims. Additionally, disability
business included a $22 million benefit which resulted from reserve refinements in the current year. The year over year variance in disability
also includes the impact of an $18 million loss related to Hurricane Katrina in the prior year. Group life’s policyholder benefits and claims
increased by $238 million, largely due to the aforementioned growth in the business, partially offset by favorable underwriting results,
particularly in the term life business. Term life included a benefit of $16 million due to reserve refinements in the current year. Partially
offsetting the increase was a retirement & savings’ policyholder benefits and claims decrease of $205 million, predominantly due to the
aforementioned decrease in revenues, partially offset by higher FAS 60 interest credits recorded in policyholder benefits and claims due to
growth in structured settlements and MTF.
The increase in other expenses of $79 million was primarily due to an increase in the current year of $60 million in non-deferrable
volume related expenses and corporate support expenses. Non-deferrable volume related expenses include those expenses associated
with information technology, direct departmental spending and commission expenses. Corporate support expenses include advertising,
corporate overhead and consulting fees. Also contributing to the increase was $26 million associated with costs related to the sale of
certain small market recordkeeping businesses, $23 million of non-deferrable LTC commission expense, $24 million related to costs
associated with a previously announced regulatory settlement and $11 million related to stock-based compensation. Partially offsetting
these increases were benefits due to prior year charges of $43 million in Travelers-related integration costs, principally incentive accruals
and $22 million related to an adjustment of DAC for certain LTC products.
26 MetLife, Inc.
Individual
The following table presents consolidated financial information for the Individual segment for the years indicated:
2007 2006 2005
Years Ended December 31,
(In millions)
Revenues
Premiums . . . . . . . . . . . . . . . . . . . . . . . . . . . . . . . . . . . . . . . . . . . . . . . . . . . $ 4,496 $ 4,516 $ 4,485
Universal life and investment-type product policy fees . . . . . . . . . . . . . . . . . . . . . . 3,513 3,201 2,476
Net investment income . . . . . . . . . . . . . . . . . . . . . . . . . . . . . . . . . . . . . . . . . . 7,052 6,912 6,534
Other revenues . . . . . . . . . . . . . . . . . . . . . . . . . . . . . . . . . . . . . . . . . . . . . . . 599 527 477
Net investment gains (losses) . . . . . . . . . . . . . . . . . . . . . . . . . . . . . . . . . . . . . . (99) (598) (50)
Total revenues . . . . . . . . . . . . . . . . . . . . . . . . . . . . . . . . . . . . . . . . . . . . . . 15,561 14,558 13,922
Expenses
Policyholder benefits and claims . . . . . . . . . . . . . . . . . . . . . . . . . . . . . . . . . . . . 5,721 5,409 5,417
Interest credited to policyholder account balances . . . . . . . . . . . . . . . . . . . . . . . . 2,030 2,035 1,775
Policyholder dividends . . . . . . . . . . . . . . . . . . . . . . . . . . . . . . . . . . . . . . . . . . 1,718 1,697 1,670
Other expenses . . . . . . . . . . . . . . . . . . . . . . . . . . . . . . . . . . . . . . . . . . . . . . . 4,031 3,519 3,264
Total expenses . . . . . . . . . . . . . . . . . . . . . . . . . . . . . . . . . . . . . . . . . . . . . . 13,500 12,660 12,126
Income from continuing operations before provision for income tax . . . . . . . . . . . . . . 2,061 1,898 1,796
Provision for income tax . . . . . . . . . . . . . . . . . . . . . . . . . . . . . . . . . . . . . . . . . 705 652 594
Income from continuing operations . . . . . . . . . . . . . . . . . . . . . . . . . . . . . . . . . . 1,356 1,246 1,202
Income (loss) from discontinued operations, net of income tax. . . . . . . . . . . . . . . . . 1 18 296
Net income. . . . . . . . . . . . . . . . . . . . . . . . . . . . . . . . . . . . . . . . . . . . . . . . . . $ 1,357 $ 1,264 $ 1,498
Year ended December 31, 2007 compared with the year ended December 31, 2006 — Individual
Income from Continuing Operations
Income from continuing operations increased by $110 million, or 9%, to $1,356 million for the year ended December 31, 2007 from
$1,246 million for the comparable 2006 period. Included in this increase was a decrease in net investment losses of $324 million, net of
income tax. Excluding the impact of net investment gains (losses), income from continuing operations decreased by $214 million from the
comparable 2006 period.
The decrease in income from continuing operations for the year was driven by the following items:
• Higher DAC amortization of $204 million, net of income tax, primarily resulting from business growth, lower net investment losses in
the current year and revisions to management’s assumptions used to determine estimated gross profits and margins.
• Unfavorable underwriting results in life products of $134 million, net of income tax. Underwriting results are generally the difference
between the portion of premium and fee income intended to cover mortality, morbidity or other insurance costs less claims incurred
and the change in insurance-related liabilities. Underwriting results are significantly influenced by mortality, morbidity, or other
insurance-related experience trends, as well as the reinsurance activity related to certain blocks of business. Consequently, results
can fluctuate from period to period.
• Higher expenses of $129 million, net of income tax. Higher general expenses, the impact of revisions to certain liabilities in both
periods, and the write-off of a receivable from one of the Company’s joint venture partners contributed to the increase in other
expenses.
• An increase in the closed block-related policyholder dividend obligation of $75 million, net of income tax, which was driven by net
investment gains.
• Higher annuity benefits of $24 million, net of income tax, primarily due to higher amortization of deferred costs, partially offset by lower
costs of guaranteed annuity benefit riders and related hedging.
• An increase in policyholder dividends of $14 million, net of income tax, due to growth in the business.
• An increase in interest credited to policyholder account balances of $13 million, net of income tax, due primarily to lower amortization
of the excess interest reserves on acquired annuity and universal life blocks of business.
These aforementioned decreases in income from continuing operations were partially offset by the following items:
• Higher fee income from separate account products of $271 million, net of income tax, primarily related to fees being earned on a
higher average account balance resulting from a combination of growth in the business and overall market performance.
• Higher net investment income on blocks of business not driven by interest margins of $85 million, net of income tax, due to an
increase in yields and growth in the average asset base.
• An increase in interest margins of $18 million, net of income tax. Interest margins relate primarily to the general account portion of
investment-type products. Management attributed a $1 million decrease to the deferred annuity business offset by a $19 million
increase to other investment-type products, both net of income tax. Interest margin is the difference between interest earned and
interest credited to policyholder account balances related to the general account on these businesses. Interest earned approximates
net investment income on invested assets attributed to these businesses with net adjustments for other non-policyholder elements.
Interest credited approximates the amount recorded in interest credited to policyholder account balances. Interest credited to
policyholder account balances is subject to contractual terms, including some minimum guarantees, and may reflect actions by
management to respond to competitive pressures. Interest credited to policyholder account balances tends to move gradually over
27MetLife, Inc.
time to reflect market interest rate movements, subject to any minimum guarantees and, therefore, generally does not introduce
volatility in expense.
The change in effective tax rates between periods accounts for the remainder of the decrease in income from continuing operations.
Revenues
Total revenues, excluding net investment gains (losses), increased by $504 million, or 3%, to $15,660 million for the year ended
December 31, 2007 from $15,156 million for the comparable 2006 period.
Premiums decreased by $20 million due to a decrease in immediate annuity premiums of $27 million, and an $89 million decline in
premiums associated with the Company’s closed block of business, in line with expectations. These decreases were partially offset by
growth in premiums from other life products of $96 million, primarily driven by increased sales of term life business.
Universal life and investment-type product policy fees combined with other revenues increased by $384 million due to a combination of
growth in the business and improved overall market performance, as well as revisions to management’s assumptions used to determine
estimated gross profits and margins. Policy fees from variable life and annuity and investment-type products are typically calculated as a
percentage of the average assets in policyholder accounts. The value of these assets can fluctuate depending on equity performance.
Net investment income increased by $140 million. Net investment income from the general account portion of investment-type products
and other businesses increased by $45 million and $95 million, respectively. Management attributes $5 million of this increase to an
increase in yields, primarily due to higher returns on other limited partnership interests. Additionally, management attributes $135 million to
growth in the average asset base across various investment types.
Expenses
Total expenses increased by $840 million, or 7%, to $13,500 million for the year ended December 31, 2007 from $12,660 million for the
comparable 2006 period.
Policyholder benefits and claims increased by $312 million primarily due to an increase in the closed block-related policyholder dividend
obligation of $115 million which was primarily driven by net investment gains. Unfavorable mortality in the life products, as well as revisions
to policyholder benefits in both periods, contributed $180 million to this increase. Included in this increase was $72 million of unfavorable
mortality in the closed block and a prior year net increase of $15 million in the excess mortality liability on specific blocks of life insurance
policies. Higher amortization of sales inducements resulting from business growth and revisions to management’s assumptions used to
determine estimated gross profits and margins, partially offset by lower costs of guaranteed annuity benefit riders and related hedging
increased annuity benefits by $37 million. Partially offsetting these increases, policyholder benefits and claims decreased by $20 million
commensurate with the decrease in premiums discussed above.
Interest credited to policyholder account balances decreased by $5 million. Interest credited on the general account portion of
investment-type products and other businesses decreased by $15 million and $10 million, respectively. Of the $15 million decrease on the
general account portion of investment-type products, management attributed $67 million to higher crediting rates, more than offset by
$82 million due to lower average policyholder account balances. Partially offsetting these decreases was lower amortization of the excess
interest reserves on acquired annuity and universal life blocks of business of $20 million primarily driven by lower lapses in the current year.
Policyholder dividends increased by $21 million due to growth in the business.
Higher other expenses of $512 million include higher DAC amortization of $314 million resulting from business growth, lower net
investment losses and revisions to management’s assumptions used to determine estimated gross profits and margins. The remaining
increase in other expenses of $198 million was comprised of $167 million associated with business growth, information technology and
other general expenses, $7 million due to the impact of revisions to certain liabilities including pension and postretirement liabilities and
policyholder liabilities in the prior year, and $24 million associated with the write-off of a receivable from one of the Company’s joint venture
partners in the current year.
Year ended December 31, 2006 compared with the year ended December 31, 2005 — Individual
Income from Continuing Operations
Income from continuing operations increased by $44 million, or 4%, to $1,246 million for the year ended December 31, 2006 from
$1,202 million for the comparable 2005 period. The acquisition of Travelers contributed $112 million during the first six months of 2006 to
income from continuing operations, which included $88 million, net of income tax, of net investment losses. Included in the Travelers
results was a $21 million increase to the excess mortality liability on specific blocks of life insurance policies. Excluding the impact of
Travelers, income from continuing operations decreased by $68 million, or 6%, to $1,134 million for the year ended December 31, 2006
from $1,202 million for the comparable 2005 period.
Included in this decrease were net investment losses of $270 million, net of income tax. Excluding the impact of net investment gains
(losses) and the acquisition of Travelers for the first six months of 2006, income from continuing operations increased by $202 million from
the comparable 2005 period.
The increase in income from continuing operations for the year was driven by the following items:
• Higher fee income from separate account products of $151 million, net of income tax, primarily related to fees being earned on a
higher average account balance resulting from a combination of growth in the business and overall market performance.
• Lower DAC amortization of $113 million, net of income tax, resulting from investment losses and revisions to management’s
assumptions used to determine estimated gross profits and margins.
• A decrease in the closed block-related policyholder dividend obligation of $68 million, net of income tax.
• Favorable underwriting results in life products of $61 million, net of income tax. Underwriting results are generally the difference
between the portion of premium and fee income intended to cover mortality, morbidity or other insurance costs less claims incurred
and the change in insurance-related liabilities. Underwriting results are significantly influenced by mortality, morbidity, or other
insurance-related experience trends, as well as the reinsurance activity related to certain blocks of business. Consequently, results
can fluctuate from period to period.
• Higher net investment income on blocks of business that were not driven by interest margins of $16 million, net of income tax.
28 MetLife, Inc.
These aforementioned increases in income from continuing operations were partially offset by the following items:
• A decline in interest margins of $58 million, net of income tax. Interest margins relate primarily to the general account portion of
investment-type products. Management attributed $40 million of this decrease to the deferred annuity business and the remaining
$18 million to other investment-type products. Interest margin is the difference between interest earned and interest credited to
policyholder account balances related to the general account on these businesses. Interest earned approximates net investment
income on invested assets attributed to these businesses with net adjustments for other non-policyholder elements. Interest credited
approximates the amount recorded in interest credited to policyholder account balances. Interest credited to policyholder account
balances is subject to contractual terms, including some minimum guarantees, and may reflect actions by management to respond to
competitive pressures. Interest credited to policyholder account balances tends to move gradually over time to reflect market interest
rate movements, subject to any minimum guarantees, and therefore, generally does not introduce volatility in expense.
• Higher expenses of $52 million, net of income tax. Higher general spending in the current period was partially offset by higher
corporate incentives in the prior year.
• Higher annuity benefits of $30 million, net of income tax, primarily due to higher costs of the guaranteed annuity benefit riders and the
related hedging, and revisions to future policyholder benefits.
• An increase in interest credited to policyholder account balances of $26 million, net of income tax, due primarily to lower amortization
of the excess interest reserves on acquired annuity and universal life blocks of business.
• An increase in policyholder dividends of $18 million, net of income tax, due to growth in the business.
The change in effective tax rates between periods accounts for the remainder of the increase in income from continuing operations.
Revenues
Total revenues, excluding net investment gains (losses), increased by $1,184 million, or 8%, to $15,156 million for the year ended
December 31, 2006 from $13,972 million for the comparable 2005 period. The acquisition of Travelers contributed $1,009 million during
the first six months of 2006 to the period over period increase. Excluding the impact of Travelers, such revenues increased by $175 million,
or 1%, from the comparable 2005 period.
Premiums decreased by $38 million due to a decrease in immediate annuity premiums of $22 million, and a $103 million expected
decline in premiums associated with the Company’s closed block of business, partially offset by growth in premiums from other life
products of $87 million.
Higher universal life and investment-type product policy fees combined with other revenues of $267 million resulted from a combination
of growth in the business and improved overall market performance. Policy fees from variable life and annuity and investment-type products
are typically calculated as a percentage of the average assets in policyholder accounts. The value of these assets can fluctuate depending
on equity performance.
Net investment income decreased by $54 million. Net investment income from the general account portion of investment-type products
decreased by $56 million which was partially offset by an increase of $2 million in other businesses. Management attributed a decrease of
$146 million partially to lower yields in the current year primarily resulting from lower income from securities lending activities, mortgage and
bond prepayment fee income, partially offset by higher corporate joint venture income. In addition, management attributed an increase of
$92 million from growth in the average asset base primarily from equity securities and mortgage loans.
Expenses
Total expenses increased by $534 million, or 4%, to $12,660 million for the year ended December 31, 2006 from $12,126 million for the
comparable 2005 period. The acquisition of Travelers contributed $706 million during the first six months of 2006 to the period over period
increase. Included in the Travelers results was a $33 million increase to the excess mortality liability on specific blocks of life insurance
policies. Excluding the impact of Travelers, total expenses decreased by $172 million, or 1%, from the comparable 2005 period.
Policyholder benefits and claims decreased by $156 million primarily due to a reduction in the closed block-related policyholder
dividend obligation of $105 million driven by higher net investment losses. A reduction of $49 million related to the excess mortality liability
on a specific block of life insurance policies that lapsed or otherwise changed also contributed to the decrease. In addition, policyholder
benefits and claims decreased by $38 million commensurate with the decrease in premiums discussed above. Unfavorable mortality in the
closed block of $99 million was more than offset by favorable mortality in the life products of $109 million, contributing $10 million to the
decrease in policyholder benefits and claims. Partially offsetting these decreases in policyholder benefits and claims was an increase in
annuity benefits of $46 million primarily due to higher costs of the guaranteed annuity benefit riders and the related hedging, and revisions
to future policyholder benefits.
Partially offsetting these decreases, interest credited to policyholder account balances increased by $51 million. Lower amortization of
the excess interest reserves on acquired annuity and universal life blocks of business resulting from higher lapses in the prior period, as
well as an update of assumptions in the current period contributed $40 million to the increase. In addition, interest credited on the general
account portion of investment-type products increased $16 million, while other businesses decreased by $5 million. Of the $16 million
increase on the general account portion of investment-type products, management attributed $37 million to higher crediting rates, partially
offset by $21 million due to lower average policyholder account balances.
Partially offsetting these decreases in total expenses was a $27 million increase in policyholder dividends associated with growth in the
business.
Lower other expenses of $94 million include lower DAC amortization of $174 million resulting from changes in investment gains and
losses of $154 million and $20 million related to management’s update of assumptions used to determine estimated gross margins. The
remaining increase in other expenses was $80 million. The current year included higher general spending of $94 million primarily due to
information technology and travel expenses while the prior year had higher corporate incentives of $39 million related to the Travelers
integration. In addition, the impact of revisions to certain expenses, premium tax, policyholder liabilities and pension and postretirement
liabilities in both periods was a net increase to expenses of $25 million in the current period.
29MetLife, Inc.
Auto & Home
The following table presents consolidated financial information for the Auto & Home segment for the years indicated:
2007 2006 2005
Years Ended December 31,
(In millions)
Revenues
Premiums . . . . . . . . . . . . . . . . . . . . . . . . . . . . . . . . . . . . . . . . . . . . . . . . . . . . . $2,966 $2,924 $2,911
Net investment income . . . . . . . . . . . . . . . . . . . . . . . . . . . . . . . . . . . . . . . . . . . . . 196 177 181
Other revenues. . . . . . . . . . . . . . . . . . . . . . . . . . . . . . . . . . . . . . . . . . . . . . . . . . 45 22 33
Net investment gains (losses) . . . . . . . . . . . . . . . . . . . . . . . . . . . . . . . . . . . . . . . . 16 4 (12)
Total revenues . . . . . . . . . . . . . . . . . . . . . . . . . . . . . . . . . . . . . . . . . . . . . . . . . 3,223 3,127 3,113
Expenses
Policyholder benefits and claims. . . . . . . . . . . . . . . . . . . . . . . . . . . . . . . . . . . . . . . 1,807 1,717 1,994
Policyholder dividends . . . . . . . . . . . . . . . . . . . . . . . . . . . . . . . . . . . . . . . . . . . . . 4 6 3
Other expenses . . . . . . . . . . . . . . . . . . . . . . . . . . . . . . . . . . . . . . . . . . . . . . . . . 830 845 828
Total expenses . . . . . . . . . . . . . . . . . . . . . . . . . . . . . . . . . . . . . . . . . . . . . . . . 2,641 2,568 2,825
Income before provision for income tax . . . . . . . . . . . . . . . . . . . . . . . . . . . . . . . . . . 582 559 288
Provision for income tax . . . . . . . . . . . . . . . . . . . . . . . . . . . . . . . . . . . . . . . . . . . . 146 143 64
Net income . . . . . . . . . . . . . . . . . . . . . . . . . . . . . . . . . . . . . . . . . . . . . . . . . . . . $ 436 $ 416 $ 224
Year ended December 31, 2007 compared with the year ended December 31, 2006 — Auto & Home
Net Income
Net income increased by $20 million, or 5%, to $436 million for the year ended December 31, 2007 from $416 million for the
comparable 2006 period.
The increase in net income was primarily attributable to an increase in premiums of $28 million, net of income tax. The increase in
premiums was principally due to an increase of $38 million, net of income tax, related to increased exposures, an increase of $4 million, net
of income tax, from various voluntary and involuntary programs and an increase of $4 million, net of income tax, resulting from the change
in estimate on auto rate refunds due to a regulatory examination. Offsetting these increases was a $14 million, net of income tax, decrease
related to a reduction in average earned premium per policy and an increase in catastrophe reinsurance costs of $4 million, net of
income tax.
In addition, net investment income increased by $12 million, net of income tax, due primarily to a realignment of economic capital and
an increase in net investment income from higher yields, somewhat offset by a lower asset base. Net investment gains (losses) increased
by $11 million, net of income tax, for the year ended December 31, 2007 as compared to the prior year.
In addition, other revenues increased by $16 million, net of income tax, due primarily to slower than anticipated claims payments in
2006 resulting in slower recognition of deferred income in 2006 related to a reinsurance contract as compared to 2007.
Negatively impacting net income were additional policyholder benefits and claims of $60 million, net of income tax, primarily due to
$39 million, $20 million, and $16 million, all net of income tax, of losses related to higher claim frequencies, higher earned exposures and
higher losses due to severity, respectively. In addition, a $13 million increase, net of income tax, in unallocated claims adjusting expenses
and an increase of $12 million, net of income tax, from a reduction in favorable development of prior year losses negatively impacted net
income. Offsetting these increases was a $41 million, net of income tax, decrease in catastrophe losses, which included favorable
development of prior year catastrophe reserves of $10 million, net of income tax.
In addition, there was a decrease of $1 million, net of income tax, in policyholder dividends that positively impacted net income.
Also favorably impacting net income was a reduction of $10 million, net of income tax, in other expenses related to lower information
technology and advertising costs.
Revenues
Total revenues, excluding net investment gains (losses), increased by $84 million, or 3%, to $3,207 million for the year ended
December 31, 2007 from $3,123 million for the comparable 2006 period.
Premiums increased by $42 million due principally to a $59 million increase in premiums related to increased exposures, an increase of
$5 million from various voluntary and involuntary programs and an increase in premiums of $5 million, resulting from the change in estimate
on auto rate refunds due to a regulatory examination. Offsetting these increases was a $21 million decrease related to a reduction in
average earned premium per policy and an increase in catastrophe reinsurance costs of $6 million.
Net investment income increased by $19 million due to a realignment of economic capital and an increase in net investment income
from higher yields, somewhat offset by a lower asset base.
In addition, other revenues increased $23 million due primarily to slower than anticipated claims payments resulting in slower
recognition of deferred income in 2006 related to a reinsurance contract as compared to 2007.
Expenses
Total expenses increased by $73 million, or 3%, to $2,641 million for the year ended December 31, 2007 from $2,568 million for the
comparable 2006 period.
Policyholder benefits and claims increased by $90 million which was primarily due to an increase of $59 million from higher claim
frequencies, as a result of a return to normal weather patterns in 2007 compared to the milder weather in 2006 across the majority of the
30 MetLife, Inc.
country, and a $25 million and $30 million increase in losses related to higher severity and higher earned exposures, respectively. In
addition, an increase of $20 million in unallocated loss adjustment expenses, primarily resulting from an increase in claims-related
information technology costs, and a $19 million decrease in favorable development of prior year losses, representing $148 million of
favorable development for 2007 as compared to $167 million for the 2006 period, increased policyholder benefits and claims. Offsetting
these increases in losses was a decrease of $63 million in catastrophe losses, which includes $15 million of favorable loss development
from prior year catastrophes.
Policyholder dividends decreased by $2 million in 2007 as compared to the prior year.
Other expenses decreased by $15 million primarily related to lower information technology and advertising costs, partially offset by
minor changes in a variety of expense categories.
Underwriting results, excluding catastrophes, in the Auto & Home segment were favorable for the year ended December 31, 2007,
although lower than the comparable period of 2006, as the combined ratio, excluding catastrophes, increased to 86.3% from 82.8% for the
year ended December 31, 2006.
Year ended December 31, 2006 compared with the year ended December 31, 2005 — Auto & Home
Net Income
Net income increased by $192 million, or 86%, to $416 million for the year ended December 31, 2006 from $224 million for the
comparable 2005 period.
The increase in net income was primarily attributable to a loss in the third quarter of 2005 from Hurricane Katrina of $124 million, net of
income tax, related to losses, loss adjusting expenses and reinstatement and additional reinsurance-related premiums and a loss in the
fourth quarter of 2005 related to losses and expenses from Hurricane Wilma of $32 million, net of income tax. Excluding the losses from
Hurricanes Katrina and Wilma, net income increased by $36 million for the year ended December 31, 2006 from the comparable 2005
period.
Favorable development of prior year loss reserves contributed $72 million, net of income tax, to the increase in net income. In addition,
an improvement in non-catastrophe loss experience, primarily due to improved frequencies, contributed $16 million, net of income tax and
a reduction in loss adjustment expenses, primarily due to improved claims handling practices, contributed $13 million, net of income tax, to
the increase. The increase in net income was offset by higher catastrophe losses in the current year, excluding the impact of Katrina and
Wilma, resulting in a decrease to net income of $49 million, net of income tax.
Also impacting net income was a decrease in net earned premiums, excluding the impact of Hurricane Katrina, of $19 million, net of
income tax, resulting primarily from an increase of $16 million, net of income tax, in catastrophe reinsurance costs and a reduction of
$4 million, net of income tax, in involuntary assumed business, offset by an increase in premiums of $1 million, net of income tax, primarily
from increased exposures, mostly offset by lower average premium per policy.
In addition, other revenues decreased by $7 million, net of income tax, due to slower than anticipated claims payments resulting in
slower recognition of deferred income related to a reinsurance contract. Net investment income decreased by $3 million, net of income tax,
due to a $12 million decrease in net investment income related to a realignment of economic capital, partially offset by a $9 million increase
in income as a result of a slightly higher asset base. Net investment gains (losses) increased $10 million, net of income tax, for the year
ended December 31, 2006 compared to the comparable 2005 period. Other expenses increased by $11 million, net of income tax,
primarily due to expenditures related to information technology, advertising and compensation costs.
The change in effective tax rates between periods accounted for the remainder of the increase in net income.
Revenues
Total revenues, excluding net investment gains (losses), decreased by $2 million, or less than 1%, to $3,123 million for the year ended
December 31, 2006 from $3,125 million for the comparable 2005 period.
Premiums increased by $13 million due principally to the existence of a $43 million charge for reinstatement and additional reinsurance
premiums in the third quarter of 2005 related to Hurricane Katrina. Premiums decreased by $30 million year over year after giving
consideration to this charge. This decrease resulted from $25 million in additional catastrophe reinsurance costs and a decrease of
$6 million in involuntary assumed business in 2006, mainly associated with the Massachusetts involuntary market. These changes were
partially offset by an increase in premiums of $35 million resulting from increased exposures, offset by a $34 million decrease in premiums
from a change in the average earned premium per policy.
Net investment income decreased by $4 million primarily due to an $18 million decrease in net investment income related to a
realignment of economic capital, mostly offset by a $14 million increase in income as a result of a slightly higher asset base with slightly
higher yields.
Other revenues decreased by $11 million due to slower than anticipated claims payments resulting in a slower recognition of deferred
income related to a reinsurance contract.
Expenses
Total expenses decreased by $257 million, or 9%, to $2,568 million for the year ended December 31, 2006 from $2,825 million for the
comparable 2005 period.
Policyholder benefits and claims decreased by $277 million which was primarily due to $196 million in claims and expenses related to
Hurricanes Katrina and Wilma incurred in 2005. The remainder of the decrease in policyholder benefits and claims for the year ended
December 31, 2006, as compared to the same period in 2005, can be attributed to $111 million in additional favorable development of
prior year losses, improvements in claim frequencies of $72 million and a decrease of $20 million in unallocated loss expense due primarily
to improved claims handling practices. These decreases in policyholder benefits and claims for the year ended December 31, 2006,
compared to the same period in 2005, were partially offset by $32 million of additional losses due to severity, $15 million of additional
losses due to exposure growth and a $75 million increase in catastrophe losses, excluding Hurricanes Katrina and Wilma.
Other expenses increased by $17 million primarily due to expenditures related to information technology, advertising and compensation
costs.
Underwriting results, excluding catastrophes, in the Auto & Home segment were favorable for the year ended December 31, 2006, as
the combined ratio, excluding catastrophes, decreased to 82.8% from 86.7% for the year ended December 31, 2005.
31MetLife, Inc.
International
The following table presents consolidated financial information for the International segment for the years indicated:
2007 2006 2005
Years Ended December 31,
(In millions)
Revenues
Premiums . . . . . . . . . . . . . . . . . . . . . . . . . . . . . . . . . . . . . . . . . . . . . . . . . . . . . $3,096 $2,722 $2,186
Universal life and investment-type product policy fees. . . . . . . . . . . . . . . . . . . . . . . . . 995 804 579
Net investment income . . . . . . . . . . . . . . . . . . . . . . . . . . . . . . . . . . . . . . . . . . . . . 1,248 950 794
Other revenues. . . . . . . . . . . . . . . . . . . . . . . . . . . . . . . . . . . . . . . . . . . . . . . . . . 23 28 20
Net investment gains (losses) . . . . . . . . . . . . . . . . . . . . . . . . . . . . . . . . . . . . . . . . 55 (10) 12
Total revenues . . . . . . . . . . . . . . . . . . . . . . . . . . . . . . . . . . . . . . . . . . . . . . . . . 5,417 4,494 3,591
Expenses
Policyholder benefits and claims. . . . . . . . . . . . . . . . . . . . . . . . . . . . . . . . . . . . . . . 2,458 2,411 2,128
Interest credited to policyholder account balances . . . . . . . . . . . . . . . . . . . . . . . . . . . 355 289 240
Policyholder dividends . . . . . . . . . . . . . . . . . . . . . . . . . . . . . . . . . . . . . . . . . . . . . 4 (2) 5
Other expenses . . . . . . . . . . . . . . . . . . . . . . . . . . . . . . . . . . . . . . . . . . . . . . . . . 1,748 1,529 997
Total expenses . . . . . . . . . . . . . . . . . . . . . . . . . . . . . . . . . . . . . . . . . . . . . . . . 4,565 4,227 3,370
Income from continuing operations before provision for income tax . . . . . . . . . . . . . . . . 852 267 221
Provision for income tax . . . . . . . . . . . . . . . . . . . . . . . . . . . . . . . . . . . . . . . . . . . . 208 95 35
Income from continuing operations . . . . . . . . . . . . . . . . . . . . . . . . . . . . . . . . . . . . . 644 172 186
Income (loss) from discontinued operations, net of income tax . . . . . . . . . . . . . . . . . . . (9) 28 6
Net income . . . . . . . . . . . . . . . . . . . . . . . . . . . . . . . . . . . . . . . . . . . . . . . . . . . . $ 635 $ 200 $ 192
Year ended December 31, 2007 compared with the year ended December 31, 2006 — International
Income from Continuing Operations
Income from continuing operations increased by $472 million, or 274%, to $644 million for the year ended December 31, 2007 from
$172 million for the comparable 2006 period. This increase includes the impact of net investment gains of $42 million, net of income tax.
Excluding the impact of net investment gains (losses), income from continuing operations increased by $430 million from the
comparable 2006 period.
Income from continuing operations increased in:
• Argentina by $146 million, net of income tax, primarily due to a net reduction of liabilities by $48 million, net of income tax, resulting
from pension reform. Additionally, $66 million of a valuation allowance related to a deferred tax asset established in connection with
such pension reform liabilities was reduced, resulting in a commensurate increase in income from continuing operations. Under the
reform plan, fund administrators are no longer liable for death and disability claims of the plan participants, however administrators
retain the obligation for administering certain existing and future participants’ accounts for which they receive no revenue. Also
contributing is the favorable impact of reductions in claim liabilities resulting from experience reviews in both the current and prior
years, higher premiums primarily due to higher pension contributions attributable to higher participant salaries, higher net investment
income resulting from capital contributions in the prior year, and a smaller increase in market indexed policyholder liabilities without a
corresponding decrease in net investment income, partially offset by the reduction of cost of insurance fees as a result of the new
pension system reform regulation, an increase in retention incentives related to pension reform, as well as lower trading portfolio
income. Argentina also benefited, in both the current and prior years, from the utilization of tax loss carryforwards against which
valuation allowances had previously been established, and in the current year from the reduction of valuation allowances due to
expected realizability of deferred tax assets.
• Mexico by $139 million, net of income tax, primarily due to a decrease in certain policyholder liabilities caused by a decrease in the
unrealized investment results on invested assets supporting those liabilities relative to the prior year, the favorable impact of
experience refunds during the first quarter of 2007 in its institutional business, a reduction in claim liabilities resulting from experience
reviews, the adverse impact in the prior year of an adjustment for experience refunds in its institutional business, a year over year
decrease in DAC amortization as a result of management’s update of assumptions used to determine estimated gross profits in both
the current and prior years, a decrease in liabilities based on a review of outstanding remittances, as well as growth in its institutional
and universal life businesses. These increases were offset by lower fees resulting from management’s update of assumptions used to
determine estimated gross profits, the favorable impact in the prior year associated with a large group policy that was not renewed by
the policyholder, a decrease in various one-time revenue items, lower investment yields, the favorable impact in the prior year of
liabilities related to employment matters that were reduced, and the benefit in the prior year from the elimination of liabilities for
pending claims that were determined to be invalid following a review.
• Taiwan by $51 million, net of income tax, primarily due to an increase in DAC amortization in the prior year due to a loss recognition
adjustment and prior year restructuring costs of $11 million associated with the termination of the agency distribution channel,
partially offset by the favorable impact of liability refinements in the prior year and higher policyholder liabilities related to loss
recognition in the prior year.
32 MetLife, Inc.
• Brazil by $37 million, net of income tax, due to the unfavorable impact of increases in policyholder liabilities due to higher than
expected mortality on specific blocks of business in the prior year, an increase in litigation liabilities in the prior year and the
unfavorable impact of the reversal of a tax credit in the prior year, as well as growth of the in-force business.
• Ireland by $19 million, net of income tax, primarily due to the utilization of net operating losses for which a valuation allowance had
been previously established as well as higher investment income resulting from higher invested assets from a capital contribution,
partially offset by higher start-up expenses and currency transaction losses.
• Japan by $22 million, net of income tax, due to improved hedge results and business growth, partially offset by the impact of foreign
currency transaction losses.
• Hong Kong by $9 million, net of income tax, due to the acquisition of the remaining 50% interest in MetLife Fubon and the resulting
consolidation of the operation, as well as business growth.
• Chile by $8 million, net of income tax, primarily due to continued growth of the in-force business, higher joint venture income and
higher returns on inflation indexed securities, partially offset by higher compensation, infrastructure and marketing expenses.
• The United Kingdom by $3 million, net of income tax, due to a reduction of claim liabilities resulting from an experience review, offset
by an unearned premium calculation refinement.
• Australia by $1 million, net of income tax, due to changes in foreign currency exchange rates offset by higher claims and business
growth.
Partially offsetting these increases, income from continuing operations decreased in:
• The home office by $9 million, net of income tax, due to higher economic capital charges and investment expenses of $16 million, net
of income tax, a $3 million increase in contingent tax expenses in the current year, as well as higher spending on growth and
initiatives, partially offset by the elimination of certain intercompany expenses previously charged to the International segment and a
tax benefit associated with a prior year income tax expense of $7 million related to a revision of an estimate.
• India by $3 million, net of income tax, primarily due to headcount increases and growth initiatives, as well as the impact of valuation
allowances established against losses in both years.
• South Korea by $4 million, net of income tax, due to a favorable impact in the prior year of $38 million, net of income tax, in DAC
amortization associated with the implementation of a more refined reserve valuation system, as well as additional expenses in the
current year associated with growth and infrastructure initiatives, partially offset by continued growth in its variable universal life
business, lower DAC amortization in the variable universal life business due to favorable market performance and a lower increase in
claim liabilities.
The remainder of the change in income from continuing operations can be attributed to contributions from the other countries.
Revenues
Total revenues, excluding net investment gains (losses), increased by $858 million, or 19%, to $5,362 million for the year ended
December 31, 2007 from $4,504 million for the comparable 2006 period.
Premiums, fees and other revenues increased by $560 million, or 16%, to $4,114 million for the year ended December 31, 2007 from
$3,554 million for the comparable 2006 period.
Premiums, fees and other revenues increased in:
• Mexico by $133 million primarily due to higher fees and growth in its institutional and universal life businesses, a decrease of
$13 million in experience refunds during the first quarter of 2007 on Mexico’s institutional business, as well as the adverse impact in
the prior year of an adjustment for experience refunds on Mexico’s institutional business. These increases were offset by lower fees
resulting from management’s update of assumptions used to determine estimated gross profits, and various one-time revenue items
for which the prior year benefited by $16 million and the current year benefited by $4 million.
• Hong Kong by $98 million due to the acquisition of the remaining 50% interest in MetLife Fubon and the resulting consolidation of the
operation, as well as business growth.
• Chile by $94 million primarily due to higher annuity sales resulting from a higher interest rate environment, improved competitive
conditions and an expected rate increase in 2008, higher institutional premiums from its traditional and bank distribution channels, as
well as the decrease in the prior year resulting from management’s decision not to match aggressive pricing in the marketplace.
• South Korea by $90 million primarily due to higher fees from growth in its guaranteed annuity business and variable universal life
business.
• Brazil by $35 million primarily due to changes in foreign currency exchange rates and business growth.
• The Company’s Japan operation by $31 million due to an increase in reinsurance assumed.
• Australia by $26 million as a result of growth in the institutional and reinsurance in-force business, an increase in retention levels and
changes in the foreign currency exchange rates.
• Argentina by $21 million primarily due to an increase in premiums and fees from higher pension contributions resulting from higher
participant salaries and a higher salary threshold subject to fees and growth in bancassurance, partially offset by the reduction of cost
of insurance fees as a result of the new pension system reform regulation.
• Taiwan and India by $21 million and $11 million, respectively, primarily due to business growth.
Partially offsetting these increases, premiums, fees and other revenues decreased in:
• The United Kingdom by $3 million due to an unearned premium calculation refinement partially offset by changes in foreign currency
rates.
The remainder of the change in premiums, fees and other revenues can be attributed to contributions from the other countries.
Net investment income increased by $298 million, or 31%, to $1,248 million for the year ended December 31, 2007 from $950 million
for the comparable 2006 period.
Net investment income increased in:
• Chile by $148 million due to the impact of higher inflation rates on indexed securities, the valuations and returns of which are linked to
inflation rates, higher joint venture income, as well as an increase in invested assets.
• Mexico by $46 million due to an increase in invested assets, partially offset by a decrease in yields, exclusive of inflation.
33MetLife, Inc.
• Hong Kong by $43 million primarily due to the acquisition of the remaining 50% interest in MetLife Fubon and the resulting
consolidation of the operation.
• Japan by $19 million due to an increase of $52 million from hedging activities associated with Japan’s guaranteed annuity, offset by a
decrease of $33 million, net of income tax, in the Company’s investment in Japan primarily due to an increase in the costs of
guaranteed annuity benefits and the impact of foreign currency transaction losses, partially offset by business growth.
• South Korea and Taiwan by $24 million and $6 million, respectively, primarily due to increases in invested assets.
• Brazil by $14 million primarily due to increases in invested assets as well as changes in foreign currency exchange rates.
• Australia by $12 million due to changes in foreign currency exchange rates, higher yields and increases in invested assets.
• Ireland by $9 million due to an increase in invested assets resulting from capital contributions.
• India by $4 million due to an increase in invested assets, as well as higher yields.
Partially offsetting these increases in net investment income was a decrease in:
• The home office of $25 million primarily due to an increase in the amount charged for economic capital and investment management
expenses.
• Argentina by $7 million primarily due to unfavorable results in the trading portfolio, partially offset by higher invested assets resulting
from capital contributions in the prior year. Additionally, net investment income in the prior year did not decrease correspondingly with
the decrease in policyholder benefits and claims discussed below because the prior year did not include interest- and inflation-
indexed assets to support such liabilities.
The remainder of the change in net investment income can be attributed to contributions from the other countries.
Changes in foreign currency exchange rates accounted for a $106 million increase in total revenues, excluding net investment gains
(losses).
Expenses
Total expenses increased by $338 million, or 8%, to $4,565 million for the year ended December 31, 2007 from $4,227 million for the
comparable 2006 period.
Policyholder benefits and claims, policyholder dividends and interest credited to policyholder account balances increased by
$119 million, or 4%, to $2,817 million for the year ended December 31, 2007 from $2,698 million for the comparable 2006 period.
Policyholder benefits and claims, policyholder dividends and interest credited to policyholder account balances increased in:
• Chile by $221 million primarily due to an increase in inflation indexed policyholder liabilities as well as growth in its annuity and
institutional businesses.
• Hong Kong by $119 million due to the acquisition of the remaining 50% interest in MetLife Fubon and the resulting consolidation of
the operation.
• Taiwan by $65 million primarily due to a decrease of $14 million in the prior year from liability refinements associated with the
conversion to a new valuation system, as well as higher policyholder liabilities related to loss recognition in the fourth quarter of 2006
and growth in the business.
• South Korea by $27 million primarily due to business growth as well as changes in foreign currency exchange rates, partially offset by
a lower increase in claims liabilities resulting from a change in the reinsurance allowance in the prior year.
• Australia by $23 million due to higher claims, an increase in retention levels, business growth and changes in foreign currency
exchange rates.
• India by $4 million due to higher claims and business growth, partially offset by management’s update of assumptions used to
determine estimated gross profits.
Partially offsetting these increases in policyholder benefits and claims, policyholder dividends and interest credited to policyholder
account balances were decreases in:
• Argentina by $250 million primarily due to the elimination of liabilities for claims and premium deficiencies of $208 million resulting
from pension reform. Under the reform plan, which is effective January 1, 2008, fund administrators are no longer liable for new death
and disability claims of the plan participants. Also contributing is a decrease in interest- and market-indexed policyholder liabilities
and the favorable impact of reductions in claim liabilities resulting from experience reviews in both the current and prior years.
• Mexico by $63 million, primarily due to a decrease in certain policyholder liabilities of $117 million caused by a decrease in the
unrealized investment results on the invested assets supporting those liabilities relative to the prior year and a reduction in claim
liabilities resulting from experience reviews, offset by an increase of $10 million due to a decrease in the prior year of policyholder
benefits associated with a large group policy that was not renewed by the policyholder, an increase of $6 million due to a benefit in
the prior year from the elimination of liabilities for pending claims that were determined to be invalid following a review, as well as
business growth.
• Brazil of $13 million primarily due to the impact in the prior year of increases in policyholder liabilities from higher than expected
mortality on specific blocks of business, partially offset by changes in foreign currency exchange rates.
• The United Kingdom by $8 million, due to a reduction of claim liabilities based on a review of experience.
Decreases in other countries accounted for the remainder of the change.
Other expenses increased by $219 million, or 14%, to $1,748 million for the year ended December 31, 2007 from $1,529 million for the
comparable 2006 period.
Other expenses increased in:
• Argentina by $153 million, primarily due to a liability of $128 million for servicing obligations that was established as a result of
pension reform. Under the reform plan, which is effective January 1, 2008, the Company retains the obligation for administering
certain existing and future participants’ accounts for which they receive no revenue. Also contributing is an increase in commissions
on bancassurance business, an increase in retention incentives related to pension reform, the impact of management’s update of
DAC assumptions as a result of pension reform and growth, partially offset by a lower increase in liabilities due to inflation and
exchange rate indexing.
• South Korea by $92 million, primarily due to the favorable impact in the prior year of $60 million in DAC amortization associated with
the implementation of a more refined reserve valuation system and additional expenses in the current year associated with growth
34 MetLife, Inc.
and infrastructure initiatives, as well as business growth and higher bank insurance fees, partially offset by a decrease in DAC
amortization related to market performance.
• Mexico by $27 million primarily due to higher expenses related to business growth and the favorable impact in the prior year of
liabilities related to employment matters that were reduced, offset by a decrease in DAC amortization resulting from management’s
update of assumptions used to determine estimated gross profits in both the current and prior years, and a decrease in liabilities
based on a review of outstanding remittances.
• India by $14 million primarily due to headcount increases and growth initiatives, partially offset by the impact of management’s update
of assumptions used to determine estimated gross profits.
• Australia by $12 million primarily due to business growth and changes in foreign currency exchange rates.
• Chile by $12 million primarily due to higher compensation costs, higher spending on infrastructure and marketing programs and
growth, partially offset by a decrease in DAC amortization related to inflation indexing.
• Hong Kong by $11 million due to the acquisition of the remaining 50% interest in MetLife Fubon and the resulting consolidation of the
operation.
• Ireland by $10 million due to additional start-up costs, as well as $5 million of foreign currency transaction losses.
• Brazil by $9 million primarily due to changes in foreign currency exchange rates, partially offset by an increase in litigation liabilities in
the prior year.
• The United Kingdom by $2 million due to changes in foreign currency rates and higher spending on business initiatives, partially offset
by lower DAC amortization resulting from calculation refinements.
Partially offsetting these increases in other expenses were decreases in:
• Taiwan by $118 million primarily due to a one-time increase in DAC amortization in the prior year of $77 million due to a loss
recognition adjustment resulting from low interest rates relative to product guarantees coupled with high persistency rates on certain
blocks of business, an increase in DAC amortization in the prior year associated with the implementation of a new valuation system,
expenses of $17 million in the prior year related the termination of the agency distribution channel and expense reductions
recognized in the current year due to elimination of the agency distribution channel.
• The home office of $4 million primarily due to the elimination of certain intercompany expenses previously charged to the International
Segment, offset by higher spending on growth and infrastructure initiatives.
Decreases in other countries accounted for the remainder of the change.
Changes in foreign currency exchange rates accounted for a $105 million increase in total expenses.
Year ended December 31, 2006 compared with the year ended December 31, 2005 — International
Income from Continuing Operations
Income from continuing operations decreased by $14 million, or 8%, to $172 million for the year ended December 31, 2006 from
$186 million for the comparable 2005 period. The acquisition of Travelers contributed $20 million during the first six months of 2006 to
income from continuing operations, which includes $3 million, net of income tax, of net investment gains. Included in the Travelers results is
an increase to policyholder benefits and claims of $10 million, net of income tax, resulting from the increase in policyholder liabilities due to
higher than expected mortality in Brazil on specific blocks of business written in the Travelers entity since the acquisition, and consistent
with the increase in the existing MetLife entity as described more fully below. Excluding the impact of Travelers, income from continuing
operations decreased by $34 million, or 18%, from the comparable 2005 period. This decrease includes the impact of net investment gains
(losses) of ($17) million, net of income tax. Excluding the impact of Travelers and of net investment gains (losses), income from continuing
operations decreased by $17 million from the comparable 2005 period.
Income from continuing operations decreased in:
• Taiwan by $59 million, net of income tax, due to a loss recognition adjustment (in the form of accelerated DAC amortization) of
$50 million, net of income tax, and restructuring costs of $11 million, net of income tax, partially offset by reserve refinements of
$3 million, net of income tax, associated with the conversion to a new valuation system.
• Canada by $19 million, net of income tax, primarily due to the realignment of economic capital in the prior year.
• Mexico by $12 million, net of income tax, due to an increase in amortization of DAC resulting from management’s update of
assumptions used to determine estimated gross margins in both years, higher operating expenses from the pension business, the
net impact of an adjustment to the liability for experience refunds on a block of business, a decrease in various one-time other
revenue items for which the prior year benefited by $13 million, net of income tax, and the current year benefited by $11 million, net of
income tax, as well as an increase of $27 million in tax due to tax benefits realized in the prior year from the American Jobs Creation
Act of 2004 (“AJCA”).These were partially offset by a decrease in certain policyholder liabilities caused by a decrease in unrealized
investment gains on invested assets supporting those liabilities relative to the prior year, a decrease in policyholder benefits
associated with a large group policy that was not renewed by the policyholder, a benefit in the current year from the elimination of
liabilities for pending claims that were determined to be invalid following a review, the unfavorable impact in the prior year of
contingent liabilities that were established related to potential employment matters in that year and which were eliminated in the
current year as well as overall business growth.
• Brazil by $7 million, net of income tax, primarily due to a $10 million, net of income tax, increase in policyholder benefits and claims
related to an increase in future policyholder benefit liabilities on specific blocks of business. This increase is due to significantly higher
than expected mortality experience, of which a total of $20 million, net of income tax, of additional liabilities were recorded,
$10 million, net of income tax, of which was associated with the acquired Travelers’ business, and of which $10 million, net of income
tax, was related to the existing MetLife entities. Brazil’s income from continuing operations was also impacted by an increase in
litigation liabilities, as well as adverse claim experience in the current year.
• The Company’s investment in Japan by $4 million, net of income tax, due to variability in the hedging program.
• The home office by $49 million primarily due to recorded higher infrastructure expenditures in support of segment growth of
$39 million, net of income tax, as well as a $23 million, net of income tax, contingent tax liability. This was offset by an increase in
income from continuing operations of $13 million, net of income tax, due to a reduction in the amount charged for economic capital.
35MetLife, Inc.
• The Company’s operation in Ireland reduced operating income by $34 million, net of income tax, due to start-up expenses in the
current year. A valuation allowance was established against the deferred income tax benefit resulting from the Ireland losses.
Partially offsetting these decreases in income from continuing operations were increases in:
• South Korea by $79 million, net of income tax, primarily due to continued growth of the in-force business, a one-time benefit of
$38 million, net of income tax, associated with the implementation of a more refined reserve valuation system, as well as a benefit of
$13 million from the impact of foreign currency exchange rates.
• Argentina by $61 million, net of income tax, due to higher net investment income resulting from capital contributions since the
completion of the Travelers acquisition, the release of liabilities for pending claims that were determined to be invalid following a
review, the favorable impact of foreign currency exchange rates and inflation rates on certain contingent liabilities, the utilization of
$4 million of net operating losses for which a valuation allowance had been previously established, a $12 million increase in the prior
year period of a deferred income tax valuation allowance established against tax benefits in that year, as well as business growth.
• Australia by $22 million, net of income tax, primarily due to reserve strengthening on a block of business in the prior year, as well as
business growth.
• Chile by $5 million, net of income tax, primarily due to growth in the institutional business of $2 million, as well as the favorable impact
of foreign currency exchange rates of $2 million.
• The United Kingdom by $5 million, net of income tax, primarily due to growth of the in-force business.
The remainder of the decrease in income from continuing operations can be attributed to other countries. Changes in foreign currency
exchange rates accounted for $2 million of the increase in income from continuing operations.
Revenues
Total revenues, excluding net investment gains (losses), increased by $925 million, or 26%, to $4,504 million for the year ended
December 31, 2006 from $3,579 million for the comparable 2005 period. The acquisition of Travelers contributed $366 million during the
first six months of 2006 to the period over period increase. Excluding the impact of Travelers, such revenues increased by $559 million, or
16%, over the comparable 2005 period.
Premiums, fees and other revenues increased by $469 million, or 17%, to $3,254 million for the year ended December 31, 2006 from
$2,785 million for the comparable 2005 period.
Premiums, fees and other revenues increased in:
• Mexico by $159 million, primarily due to higher fees and growth in its universal life and institutional business, partially offset by an
adjustment for experience refunds on a block of business and various one-time other revenue items for which the prior year benefited
by $19 million and the current year benefited by $16 million.
• South Korea by $156 million primarily due to business growth driven by strong sales of its variable universal life product, as well as the
favorable impact of foreign currency exchange rates of $56 million.
• Brazil by $49 million due to business growth and higher bancassurance business, as well as an increase in amounts retained under
reinsurance arrangements.
• Chile by $22 million primarily due to the favorable impact of foreign currency exchange rates of $14 million, as well as an increase in
institutional premiums through its bank distribution channel, partially offset by lower annuity sales due in part from management’s
decision not to match aggressive pricing in the marketplace.
• The United Kingdom, Argentina, Australia, and Taiwan by $21 million, $16 million, $15 million, and $12 million respectively, primarily
due to business growth.
Increases in other countries accounted for the remainder of the change.
Net investment income increased by $90 million, or 11%, to $884 million for the year ended December 31, 2006 from $794 million for
the comparable 2005 period.
Net investment income increased in:
• Argentina by $41 million primarily due to higher invested assets resulting from capital contributions since the completion of the
Travelers acquisition.
• Mexico by $28 million primarily due to higher inflation rates and increases in invested assets, partially offset by lower average
investment yields.
• South Korea, Brazil and Taiwan by $25 million, $14 million and $5 million, respectively, primarily due to increases in invested assets,
as well as the favorable impact of foreign currency exchange rates of $10 million.
• Home office by $17 million primarily due to a reduction in the amount charged for economic capital from the prior year.
Partially offsetting these increases in net investment income were decreases in:
• Chile by $8 million primarily due to a reduction in the inflation rate, partially offset by the favorable impact of foreign currency
exchange rates of $8 million and increases in invested assets. The invested asset valuations and returns on these invested assets are
linked to inflation rates in most of the Latin American countries in which the Company does business.
• Canada by $33 million due to the realignment of economic capital.
Increases in other countries accounted for the remainder of the change.
Changes in foreign currency exchange rates had a favorable impact of $105 million on total revenues, excluding net investment gains
(losses).
Expenses
Total expenses increased by $857 million, or 25%, to $4,227 million for the year ended December 31, 2006 from $3,370 million for the
comparable 2005 period. The acquisition of Travelers contributed $346 million during the first six months of 2006 to the year over year
increase. Excluding the impact of Travelers, total expenses increased by $511 million, or 15%, over the comparable 2005 period.
Policyholder benefits and claims, policyholder dividends and interest credited to policyholder account balances increased by
$187 million, or 8%, to $2,560 million for the year ended December 31, 2006 from $2,373 million for the comparable 2005 period.
Policyholder benefits and claims, policyholder dividends and interest credited to policyholder account balances increased in:
• Mexico by $113 million primarily due to an increase in other policyholder benefits and claims of $108 million and in interest credited to
policyholder account balances of $39 million commensurate with the growth in revenue discussed above. These increases in Mexico
36 MetLife, Inc.
were partially offset by a decrease in certain policyholder liabilities of $18 million caused by a decrease in the unrealized investment
gains on the invested assets supporting those liabilities, a $10 million benefit from a decrease in policyholder benefits associated with
a large group policy that was not renewed by the policyholder, and a $6 million benefit in the current year from the elimination of
liabilities for pending claims that were determined to be invalid following a review.
• Brazil by $49 million primarily due to an increase in policyholder liabilities on these specific blocks of business as discussed above, an
increase in amounts retained under reinsurance arrangements, as well as adverse claim experience in other lines of business.
• South Korea by $44 million commensurate with the business growth discussed above, as well as the impact of foreign currency
exchange rates of $33 million.
Partially offsetting these increases, policyholder benefits and claims, policyholder dividends, and interest credited to policyholder
account balances decreased in:
• Australia by $22 million due to reserve strengthening in the prior year on a block of reinsurance business.
• Chile by $7 million primarily due to a decrease in annuity liabilities related to the decrease in the inflation index and the decrease in
annuity premiums discussed above, partially offset by growth in the institutional business, as well as the impact of foreign currency
exchange rates of $17 million.
• Taiwan by $2 million primarily due to a decrease of $14 million from reserve refinements associated with the implementation of a new
valuation system, partially offset by an increase of $12 million primarily due to business growth.
• Argentina by $2 million primarily due to the elimination of liabilities for pending claims that were determined to be invalid following a
review, partially offset by business growth. Increases in other countries accounted for the remainder of the change.
Other expenses increased by $324 million, or 32%, to $1,321 million for the year ended December 31, 2006 from $997 million for the
comparable 2005 period.
Other expenses increased in:
• Taiwan by $110 million primarily due to a one-time increase in DAC amortization of $77 million due to a loss recognition adjustment
resulting from low interest rates relative to product guarantees coupled with high persistency rates on certain blocks of business, an
increase of $17 million related to the termination of the agency distribution channel in Taiwan, an increase of $9 million from
refinements associated with the implementation of a new valuation system, as well as business growth.
• Mexico by $49 million primarily due to an increase in commissions commensurate with the revenue growth discussed above, higher
DAC amortization resulting from management’s update of assumptions used to determine estimated gross profits in both the current
and prior years, higher expenses related to growth initiatives, and additional expenses associated with the Mexican pension
business, partially offset by the favorable impact of contingent liabilities that were established in the prior year related to potential
employment matters and which were eliminated in the current year.
• South Korea by $25 million, primarily due to an increase in DAC amortization and general expenses, which were both due to the
growth in business, the impact in the prior year of an accrual for an early retirement program and the impact of foreign currency
exchange rates of $15 million. These were partially offset by a decrease of $60 million in DAC amortization associated with the
implementation of a more refined reserve valuation system.
• Brazil by $25 million primarily due to the growth in business discussed above, as well as an increase in litigation liabilities.
• Chile by $13 million due to increased commissions and other expenses associated with its institutional business, as well as the
impact of foreign currency exchange rates of $4 million.
• The United Kingdom and Australia by $15 million and $3 million, respectively, primarily due to business growth.
• Home office by $57 million primarily due to an increase in expenditures for information technology projects, growth initiative projects
and integration costs, as well as an increase in compensation resulting from an increase in headcount from the comparable 2005
period.
• Ireland by $34 million primarily related to the start-up of the Company’s operation in Ireland.
Offsetting these increases, other expenses decreased in:
• Argentina by $9 million primarily due to the favorable impact of foreign currency exchange rates and inflation rates on certain
contingent liabilities.
Increases in other countries accounted for the remainder of the change.
Changes in foreign currency exchange rates accounted for $90 million of the increase in total expenses.
37MetLife, Inc.
Reinsurance
The following table presents consolidated financial information for the Reinsurance segment for the years indicated:
2007 2006 2005
Years Ended December 31,
(In millions)
Revenues
Premiums . . . . . . . . . . . . . . . . . . . . . . . . . . . . . . . . . . . . . . . . . . . . . . . . . . . . . $4,910 $4,348 $3,869
Net investment income . . . . . . . . . . . . . . . . . . . . . . . . . . . . . . . . . . . . . . . . . . . . . 871 732 606
Other revenues. . . . . . . . . . . . . . . . . . . . . . . . . . . . . . . . . . . . . . . . . . . . . . . . . . 77 66 58
Net investment gains (losses) . . . . . . . . . . . . . . . . . . . . . . . . . . . . . . . . . . . . . . . . (177) 7 22
Total revenues . . . . . . . . . . . . . . . . . . . . . . . . . . . . . . . . . . . . . . . . . . . . . . . . . 5,681 5,153 4,555
Expenses
Policyholder benefits and claims. . . . . . . . . . . . . . . . . . . . . . . . . . . . . . . . . . . . . . . 3,989 3,490 3,206
Interest credited to policyholder account balances . . . . . . . . . . . . . . . . . . . . . . . . . . . 262 254 220
Other expenses . . . . . . . . . . . . . . . . . . . . . . . . . . . . . . . . . . . . . . . . . . . . . . . . . 1,226 1,227 991
Total expenses . . . . . . . . . . . . . . . . . . . . . . . . . . . . . . . . . . . . . . . . . . . . . . . . 5,477 4,971 4,417
Income before provision for income tax . . . . . . . . . . . . . . . . . . . . . . . . . . . . . . . . . . 204 182 138
Provision for income tax . . . . . . . . . . . . . . . . . . . . . . . . . . . . . . . . . . . . . . . . . . . . 71 64 46
Net income . . . . . . . . . . . . . . . . . . . . . . . . . . . . . . . . . . . . . . . . . . . . . . . . . . . . $ 133 $ 118 $ 92
Year ended December 31, 2007 compared with the year ended December 31, 2006 — Reinsurance
Net Income
Net income increased by $15 million, or 13%, to $133 million for the twelve months ended December 31, 2007 from $118 million for the
comparable 2006 period.
The increase in net income was attributable to a 13% increase in premiums while policyholder benefits and claims increased by 14%, a
19% increase in net investment income while interest credited to policyholder account balances increased by 3%, and a 17% increase in
other revenues. The increase in premiums, net of the increase in policyholder benefits and claims, added $41 million to net income, net of
income tax, which was primarily due to additional business in-force from facultative and automatic treaties and renewal premiums on
existing blocks of business in the U.S. and international operations. Policyholder benefits and claims as a percentage of premiums were
81% and are comparable to the prior year. The increase in net investment income, net of interest credited to policyholder account
balances, added $85 million to net income and was due primarily to growth in the invested asset base. The increases in invested assets
and net investment income, net of interest credited to policyholder account balances were substantially derived from the issuance of
notes, which also increased interest expense within other expenses as described below. Additionally, positive operating cash flows and
additional policyholder account balances contributed to the growth in the invested asset base. The increase in other revenues added
$7 million to net income, net of income tax, and was primarily related to an increase in investment product fees on asset-intensive business
and financial reinsurance fees during 2007.
A decrease in other expenses added $1 million to net income, net of income tax. The decrease in other expenses was primarily related
to a reduction of expenses associated with DAC, including reinsurance allowances paid, offset by an increase in interest, expense
compensation and overhead-related expenses associated with RGA’s international expansion, and minority interest expense. The increase
in interest expense is associated with the issuance of $850 million 30-year notes in June 2006 by a subsidiary of RGA to provide long-term
collateral for Regulation XXX statutory reserves, RGA’s issuance of $300 million senior notes in March 2007, and FIN 48 interest expense.
These increases in net income were partially offset by a $120 million increase in net investment losses, net of income tax. The increase
in net investment losses was primarily due to a decrease in the fair value of embedded derivatives associated with the reinsurance of
annuity products on a funds withheld basis.
Additionally, a component of the increase in net income was a $4 million increase associated with foreign currency exchange rate
movements.
Revenues
Total revenues, excluding net investment gains (losses), increased by $712 million, or 14%, to $5,858 million for the twelve months
ended December 31, 2007 from $5,146 million for the comparable 2006 period.
The increase in revenues was primarily associated with growth in premiums of $562 million from new facultative and automatic treaties
and renewal premiums on existing blocks of business in all RGA operating segments, including the U.S., which contributed $221 million;
Asia Pacific, which contributed $192 million; Europe and South Africa, which contributed $91 million; and Canada, which contributed
$58 million. Premium levels are significantly influenced by large transactions and reporting practices of ceding companies and, as a result,
can fluctuate from period to period.
Net investment income increased by $139 million primarily due to growth in the invested asset base from net proceeds from the
aforementioned notes offerings by RGA and its subsidiary, positive cash flows from operations, additional deposits associated with the
coinsurance of annuity products, and a realignment of economic capital. The investment yield also increased slightly over the comparable
prior year.
Other revenues increased by $11 million primarily due to an increase in surrender charges on asset-intensive business reinsured and an
increase in fees associated with financial reinsurance.
38 MetLife, Inc.
Additionally, a component of the increase in total revenues, excluding net investment gains (losses), was a $128 million increase
associated with foreign currency exchange rate movements.
Expenses
Total expenses increased by $506 million, or 10%, to $5,477 million for the twelve months ended December 31, 2007 from
$4,971 million for the comparable 2006 period.
This increase in total expenses was primarily attributable to an increase of $499 million in policyholder benefits and claims, primarily
associated with a growth in insurance in-force of $179 billion, and an increase of $8 million in interest credited to policyholder account
balances. This increase in interest credited to policyholder account balances was more than offset by an increase in net investment
income. In addition to the in-force growth, favorable mortality in the prior year in the international operations added to the increase in
policyholder benefits and claims.
Other expenses decreased by $1 million due to a $79 million decrease in expenses associated with DAC, including reinsurance
allowances paid, offset by a $41 million increase in interest expense associated with the aforementioned notes offerings by RGA and its
subsidiary and the application of FIN 48, and an $7 million increase in minority interest expense. Included in the $79 million decrease in
expenses associated with DAC was a $113 million reduction of DAC amortization due to the change in the value of embedded derivatives
associated with modified coinsurance arrangements as a result of the impact of widening credit spreads in the U.S. debt markets. An
offsetting increase of $30 million was primarily due to compensation and overhead-related expenses associated with RGA’s international
expansion and general growth in operations, including equity compensation expense.
Additionally, a component of the increase in total expenses, was a $121 million increase associated with foreign currency exchange
rate movements.
Year ended December 31, 2006 compared with the year ended December 31, 2005 — Reinsurance
Net Income
Net income increased by $26 million, or 28%, to $118 million for the year ended December 31, 2006 from $92 million for the
comparable 2005 period.
The increase in net income was attributable to a 12% increase in premiums while policyholder benefits and claims increased by 9%, a
21% increase in net investment income while interest credited to policyholder account balances increased by 15%, and a 14% increase in
other revenues. The increase in premiums, net of the increase in policyholder benefits and claims, added $127 million to net income which
was primarily due to added business in-force from facultative and automatic treaties and renewal premiums on existing blocks of business
in the U.S. and international operations. The increase in policyholder benefits and claims was partially offset by unfavorable mortality and an
increase in the liabilities associated with RGA’s Argentine pension business, both in the prior-year period. The increase in net investment
income and interest credited to policyholder account balances added $60 million to net income and was due to growth in the invested
asset base. The increase in invested assets, and net investment income, substantially derived from the issuance of notes and a collateral
financing facility, which increased interest expense within other expenses as described below. The increase in other revenues added
$5 million to net income and was primarily related to an increase in investment product fees on asset-intensive business and financial
reinsurance fees during 2006, partially offset by a decrease in foreign currency transaction gains in the prior-year period.
These increases in net income were partially offset by a $153 million increase in other expenses and a $10 million decrease in net
investment gains (losses), all net of income tax. Additionally, a higher effective tax rate in 2006 reduced net income by $3 million. The
increase in other expenses was primarily related to expenses associated with DAC, including reinsurance allowances paid, interest
expense associated with RGA’s issuance of $850 million 30-year notes to provide long-term collateral for Regulation XXX statutory
reserves in June 2006 and $400 million of junior subordinated notes in December 2005, minority interest expense, and equity
compensation expense.
Revenues
Total revenues, excluding net investment gains (losses), increased by $613 million, or 14%, to $5,146 million for the year ended
December 31, 2006 from $4,533 million for the comparable 2005 period.
The increase in such revenues was primarily associated with growth in premiums of $479 million from new facultative and automatic
treaties and renewal premiums on existing blocks of business in all RGA operating segments, including the U.S., which contributed
$220 million; Asia Pacific, which contributed $138 million; Canada, which contributed $86 million; and Europe and South Africa, which
contributed $35 million. Premium levels were significantly influenced by large transactions and reporting practices of ceding companies
and, as a result, can fluctuate from period to period.
Net investment income increased by $126 million, primarily due to growth in the invested asset base from net proceeds of RGA’s
$850 million 30-year notes offering in June 2006 and $400 million junior subordinated note offering in December 2005, positive operating
cash inflows and additional deposits associated with the coinsurance of annuity products. Investment yields were down slightly compared
to the prior-year period. The increase in net investment income was partially offset by a decrease related to a realignment of economic
capital.
Other revenues increased by $8 million primarily due to an increase in investment product fees on asset-intensive business and
financial reinsurance fees during 2006, partially offset by a decrease in foreign currency transaction gains.
Additionally, a component of the increase in total revenues, excluding net investment gains (losses), was a $36 million increase
associated with foreign currency exchange rate movements.
Expenses
Total expenses increased by $554 million, or 13%, to $4,971 million for the year ended December 31, 2006 from $4,417 million for the
comparable 2005 period.
The increase in total expenses was commensurate with the growth in revenues and was primarily attributable to an increase of
$284 million in policyholder benefits and claims, primarily associated with growth in insurance in-force of $245 billion, and a $34 million
increase in interest credited due to growth in policyholder account balances associated with the coinsurance of annuity products, which is
generally offset by a corresponding increase in net investment income. The increase in policyholder benefits and claims of $284 million was
partially offset by favorable underwriting results in RGA’s international operations in the current year period, unfavorable mortality
39MetLife, Inc.
experience in the U.S. and the United Kingdom in the prior-year period, and a $33 million increase in the liabilities associated with the
Argentine pension business in the prior year period.
Other expenses increased by $236 million due to a $92 million increase in expenses associated with DAC, including reinsurance
allowances paid, a $47 million increase in interest expense primarily associated with RGA’s issuance of $850 million 30-year notes in June
2006 and $400 million of junior subordinated notes in December 2005, as well as a $47 million increase in minority interest expense on the
larger earnings base in the current period. The remaining increase of $50 million was primarily related to overhead-related expenses
associated with RGA’s international expansion and general growth in operations, including equity compensation expense.
Additionally, a component of the increase in total expenses was a $33 million increase associated with foreign currency exchange rate
movements.
40 MetLife, Inc.
Corporate & Other
The following table presents consolidated financial information for Corporate & Other for the years indicated:
2007 2006 2005
Years Ended December 31,
(In millions)
Revenues
Premiums . . . . . . . . . . . . . . . . . . . . . . . . . . . . . . . . . . . . . . . . . . . . . . . . . . . . . $ 35 $ 35 $ 22
Universal life and investment-type product policy fees. . . . . . . . . . . . . . . . . . . . . . . . . — — 1
Net investment income . . . . . . . . . . . . . . . . . . . . . . . . . . . . . . . . . . . . . . . . . . . . . 1,460 1,046 699
Other revenues. . . . . . . . . . . . . . . . . . . . . . . . . . . . . . . . . . . . . . . . . . . . . . . . . . 63 34 30
Net investment gains (losses) . . . . . . . . . . . . . . . . . . . . . . . . . . . . . . . . . . . . . . . . 47 (154) (48)
Total revenues . . . . . . . . . . . . . . . . . . . . . . . . . . . . . . . . . . . . . . . . . . . . . . . . . 1,605 961 704
Expenses
Policyholder benefits and claims. . . . . . . . . . . . . . . . . . . . . . . . . . . . . . . . . . . . . . . 47 37 (15)
Other expenses . . . . . . . . . . . . . . . . . . . . . . . . . . . . . . . . . . . . . . . . . . . . . . . . . 1,400 1,349 955
Total expenses . . . . . . . . . . . . . . . . . . . . . . . . . . . . . . . . . . . . . . . . . . . . . . . . 1,447 1,386 940
Income (loss) from continuing operations before provision (benefit) for income tax . . . . . . . 158 (425) (236)
Income tax benefit . . . . . . . . . . . . . . . . . . . . . . . . . . . . . . . . . . . . . . . . . . . . . . . . (114) (419) (215)
Income (loss) from continuing operations . . . . . . . . . . . . . . . . . . . . . . . . . . . . . . . . . 272 (6) (21)
Income from discontinued operations, net of income tax . . . . . . . . . . . . . . . . . . . . . . . 35 3,134 1,167
Net income . . . . . . . . . . . . . . . . . . . . . . . . . . . . . . . . . . . . . . . . . . . . . . . . . . . . 307 3,128 1,146
Preferred stock dividends . . . . . . . . . . . . . . . . . . . . . . . . . . . . . . . . . . . . . . . . . . . 137 134 63
Net income available to common shareholders . . . . . . . . . . . . . . . . . . . . . . . . . . . . . $ 170 $2,994 $1,083
Year ended December 31, 2007 compared with the year ended December 31, 2006 — Corporate & Other
Income from Continuing Operations
Income from continuing operations increased by $278 million, to a gain of $272 million for the year ended December 31, 2007 from a
loss of $6 million for the comparable 2006 period. Included in this increase were lower net investment losses of $132 million, net of income
tax, resulting in a net investment gain. Excluding the impact of net investment gains (losses), income from continuing operations increased
by $146 million.
The increase in income from continuing operations was primarily attributable to higher net investment income, lower corporate
expenses, higher other revenues, integration costs incurred in the prior year, and lower legal cost of $269 million, $56 million, $19 million,
$17 million, and $7 million, respectively, each of which were net of income tax. This was partially offset by higher interest expense on debt,
higher interest on tax contingencies, and higher interest credited to bankholder deposits of $86 million, $23 million, and $3 million
respectively, each of which were net of income tax. Tax benefits decreased by $103 million over the comparable 2006 period due to the
Company’s implementation of FIN 48, the difference of finalizing the Company’s 2006 tax return in 2007 when compared to finalizing the
Company’s 2005 tax return in 2006 and the difference between the actual and the estimated tax rate allocated to the various segments.
Revenues
Total revenues, excluding net investment gains (losses), increased by $443 million, or 40%, to $1,558 million for the year ended
December 31, 2007 from $1,115 million for the comparable 2006 period. This increase was primarily due to increased net investment
income of $414 million, mainly on fixed maturity securities, driven by a higher asset base related to the reinvestment of proceeds from the
sale of the Peter Cooper Village and Stuyvesant Town properties during the fourth quarter of 2006 and the investment of proceeds from
issuances of junior subordinated debt in December 2006 and December 2007 and collateral financing arrangements to support statutory
reserves in May 2007 and December 2007. Net investment income also increased on other limited partnerships, real estate and real estate
joint ventures, and mortgage loans. Other revenues increased by $29 million primarily related to the resolution of an indemnification claim
associated with the 2000 acquisition of GALIC, offset by an adjustment of surrender values on corporate-owned life insurance policies.
Also included as a component of total revenues was the elimination of intersegment amounts which was offset within total expenses.
Expenses
Total expenses increased by $61 million, or 4%, to $1,447 million for the year ended December 31, 2007 from $1,386 million for the
comparable 2006 period. Interest expense was higher by $133 million due to the issuances of junior subordinated debt in December 2006
and December 2007 and collateral financing arrangements in May 2007 and December 2007, respectively, and from settlement fees on
the prepayment of shares subject to mandatory redemption in October 2007, partially offset by the maturity of senior notes in December
2006 and the reduction of commercial paper outstanding. Interest on tax contingencies was higher by $35 million as a result of an increase
in published Internal Revenue Service (“IRS”) interest rates and a change in the method of estimating interest expense on tax contingencies
associated with the Company’s implementation of FIN 48. As a result of higher interest rates, interest credited on bank deposits increased
by $5 million at MetLife Bank. Corporate expenses are lower by $86 million primarily due to lower corporate support expenses of
$63 million, which included advertising, start-up costs for new products and information technology costs, and lower costs from
reductions of MetLife Foundation contributions of $23 million. Integration costs incurred in 2006 period were $25 million. Legal costs
were lower by $11 million primarily due to a reduction in the current year of $35 million of legal liabilities resulting from the settlement of
41MetLife, Inc.
certain cases, lower other legal costs of $3 million partially offset by higher amortization and valuation of an asbestos insurance recoverable
of $27 million. Also included as a component of total expenses were the elimination of intersegment amounts which were offset within total
revenues.
Year ended December 31, 2006 compared with the year ended December 31, 2005 — Corporate & Other
Income (Loss) from Continuing Operations
Income (loss) from continuing operations increased by $15 million, or 71%, to ($6) million for the year ended December 31, 2006 from
($21) million for the comparable 2005 period. The acquisition of Travelers, excluding Travelers financing and integration costs incurred by
the Company, contributed $111 million during the first six months of 2006 to income (loss) from continuing operations, which included
$3 million, net of income tax, of net investment losses. Excluding the impact of Travelers, income (loss) from continuing operations
decreased by $96 million for the year ended December 31, 2006 from the comparable 2005 period. Included in this decrease were higher
investment losses of $66 million, net of income tax. Excluding the impact of Travelers and the increase of net investment losses, income
(loss) from continuing operations decreased by $30 million.
The increase in income (loss) from continuing operations was primarily attributable to higher net investment income, lower integration
costs and higher other revenues of $104 million, $62 million, and $4 million, respectively, all of which were net of income tax. This was
partially offset by higher interest expense on debt (principally associated with the issuance of debt to finance the Travelers acquisition),
corporate support expenses, interest credited to bankholder deposits, policyholder benefits and claims and legal-related liabilities of
$125 million, $111 million, $55 million, $30 million and $5 million, respectively, all of which were net of income tax. Tax benefits increased
by $113 million over the comparable 2005 period due to the difference of finalizing the Company’s 2005 tax return in 2006 when compared
to finalizing the Company’s 2004 tax return in 2005 and the difference between the actual and the estimated tax rate allocated to the
various segments.
Revenues
Total revenues, excluding net investment gains (losses), increased by $363 million, or 48%, to $1,115 million for the year ended
December 31, 2006 from $752 million for the comparable 2005 period. The acquisition of Travelers contributed $200 million during the first
six months of 2006 to the period over period increase. Excluding the impact of Travelers, revenues increased by $163 million, or 22%, from
the comparable 2005 period. This increase was primarily attributable to increased net investment income of $171 million primarily from
increases in income on fixed maturity securities due to improved yields from lengthening of the duration and a higher asset base, and the
impact of higher short-term interest rates on cash equivalents and short-term investments. The increase also resulted from a higher asset
base invested in mortgage loans on real estate, real estate joint ventures, and other limited partnership interests and was partially offset by
a decline in securities lending results and leveraged leases. The remainder of the increase was primarily attributable to increased other
revenues of $5 million, which primarily consisted of increased surrender values on corporate owned life insurance policies. Also included
as a component of total revenues were the intersegment eliminations which were offset within total expenses.
Expenses
Total expenses increased by $446 million, or 47%, to $1,386 million for the year ended December 31, 2006 from $940 million for the
comparable 2005 period. The acquisition of Travelers, excluding Travelers financing and integration costs, contributed $59 million during
the first six months of 2006 to the period over period increase. Excluding the impact of Travelers, total expenses increased by $387 million,
or 41%, for the year ended December 31, 2006 from the comparable 2005 period.
This increase was primarily attributable to higher interest expense of $192 million. The principal reason was a result of the issuance of
senior notes in 2005, which included $119 million of expenses from the financing of the acquisition of Travelers. Additionally, as a result of
the issuance of commercial paper, short-term interest expense increased by $67 million. Corporate support expenses were higher by
$170 million primarily due to higher corporate support expenses of $107 million, which included advertising, start-up costs for new
products and information technology costs, a $35 million MetLife foundation contribution in the 2006 period and a $28 million benefit, in
the 2005 period, associated with the reduction of a previously established real estate transfer tax liability related to MLIC’s demutualization
in 2000. As a result of growth in the business and higher interest rates, interest credited to bankholder deposits increased by $85 million at
MetLife Bank. Policyholder benefits and claims increased $47 million from a 2005 period benefit associated with a reduction of a previously
established liability for settlement death benefits related to the Company’s sales practices class action settlement recorded in 1999. Legal-
related costs were higher by $8 million, predominantly from the reduction of previously established liabilities related to legal disputes during
the 2005 period. Integration costs were lower by $95 million. Also included as a component of total expenses were the elimination of
intersegment amounts which were offset within total revenues.
42 MetLife, Inc.
Liquidity and Capital Resources
The Company
Capital
RBC requirements are used as minimum capital requirements by the National Association of Insurance Commissioners (“NAIC”) and the
state insurance departments to identify companies that merit further regulatory action. RBC is based on a formula calculated by applying
factors to various asset, premium and statutory reserve items. The formula takes into account the risk characteristics of the insurer,
including asset risk, insurance risk, interest rate risk and business risk and is calculated on an annual basis. The formula is used as an early
warning regulatory tool to identify possible inadequately capitalized insurers for purposes of initiating regulatory action, and not as a means
to rank insurers generally. These rules apply to each of the Holding Company’s domestic insurance subsidiaries. State insurance laws
provide insurance regulators the authority to require various actions by, or take various actions against, insurers whose total adjusted
capital does not exceed certain RBC levels. As of the date of the most recent annual statutory financial statements filed with insurance
regulators, the total adjusted capital of each of these subsidiaries was in excess of each of those RBC levels.
Asset/Liability Management
The Company actively manages its assets using an approach that balances quality, diversification, asset/liability matching, liquidity and
investment return. The goals of the investment process are to optimize, net of income tax, risk-adjusted investment income and risk-
adjusted total return while ensuring that the assets and liabilities are managed on a cash flow and duration basis. The asset/liability
management process is the shared responsibility of the Portfolio Management Unit, the Financial Management and Oversight Asset/
Liability Management Unit, and the operating business segments under the supervision of the various product line specific Asset/Liability
Management Committees (“ALM Committees”). The ALM Committees’ duties include reviewing and approving target portfolios on a
periodic basis, establishing investment guidelines and limits and providing oversight of the asset/liability management process. The
portfolio managers and asset sector specialists, who have responsibility on a day-to-day basis for risk management of their respective
investing activities, implement the goals and objectives established by the ALM Committees.
The Company establishes target asset portfolios for each major insurance product, which represent the investment strategies used to
profitably fund its liabilities within acceptable levels of risk. These strategies are monitored through regular review of portfolio metrics, such
as effective duration, yield curve sensitivity, convexity, liquidity, asset sector concentration and credit quality. In executing these asset/
liability matching strategies, management regularly reevaluates the estimates used in determining the approximate amounts and timing of
payments to or on behalf of policyholders for insurance liabilities. Many of these estimates are inherently subjective and could impact the
Company’s ability to achieve its asset/liability management goals and objectives.
Liquidity
Liquidity refers to a company’s ability to generate adequate amounts of cash to meet its needs. The Company’s liquidity position (cash
and cash equivalents and short-term investments, excluding securities lending) was $12.3 billion and $7.7 billion at December 31, 2007
and 2006, respectively. Liquidity needs are determined from a rolling 12-month forecast by portfolio and are monitored daily. Asset mix and
maturities are adjusted based on forecast. Cash flow testing and stress testing provide additional perspectives on liquidity. The Company
believes that it has sufficient liquidity to fund its cash needs under various scenarios that include the potential risk of early contractholder
and policyholder withdrawal. The Company includes provisions limiting withdrawal rights on many of its products, including general
account institutional pension products (generally group annuities, including GICs, and certain deposit fund liabilities) sold to employee
benefit plan sponsors. Certain of these provisions prevent the customer from making withdrawals prior to the maturity date of the product.
In the event of significant unanticipated cash requirements beyond normal liquidity, the Company has multiple alternatives available
based on market conditions and the amount and timing of the liquidity need. These options include cash flows from operations, the sale of
liquid assets, global funding sources and various credit facilities.
The Company’s ability to sell investment assets could be limited by accounting rules including rules relating to the intent and ability to
hold impaired securities until the market value of those securities recovers.
In extreme circumstances, all general account assets within a statutory legal entity are available to fund any obligation of the general
account within that legal entity.
A disruption in the financial markets could limit the Holding Company’s access to or cost of liquidity.
Liquidity Sources
Cash Flows from Operations. The Company’s principal cash inflows from its insurance activities come from insurance premiums,
annuity considerations and deposit funds. A primary liquidity concern with respect to these cash inflows is the risk of early contractholder
and policyholder withdrawal.
The Company’s principal cash inflows from its investment activities come from repayments of principal, proceeds from maturities and
sales of invested assets and investment income. The primary liquidity concerns with respect to these cash inflows are the risk of default by
debtors and market volatilities. The Company closely monitors and manages these risks through its credit risk management process.
Liquid Assets. An integral part of the Company’s liquidity management is the amount of liquid assets it holds. Liquid assets include
cash, cash equivalents, short-term investments, and marketable fixed maturity and equity securities. Liquid assets exclude assets relating
to securities lending activities. At December 31, 2007 and 2006, the Company had $188.4 billion and $186.5 billion in liquid assets,
respectively.
Global Funding Sources. Liquidity is also provided by a variety of both short-term and long-term instruments, including repurchase
agreements, commercial paper, medium- and long-term debt, junior subordinated debt securities, shares subject to mandatory redemp-
tion, capital securities and stockholders’ equity. The diversity of the Company’s funding sources enhances funding flexibility, limits
dependence on any one source of funds and generally lowers the cost of funds.
At December 31, 2007 and 2006, the Company had outstanding $667 million and $1.4 billion in short-term debt, respectively, and at
December 31, 2007 and 2006, had outstanding $9.6 billion and $9.1 billion in long-term debt, respectively. At December 31, 2007 and
2006, the Company had outstanding $5.7 billion and $850 million in collateral financing arrangements, respectively. At December 31, 2007
43MetLife, Inc.
and 2006, the Company had outstanding $4.5 billion and $3.8 billion, respectively, in junior subordinated debt and $159 million and
$278 million, respectively, in shares subject to mandatory redemption.
Debt Issuances. In December 2007, MetLife Capital Trust IV (“Trust IV”), a variable interest entity (“VIE”) consolidated by the Company,
issued exchangeable surplus trust securities (the “Trust Securities”) with a face amount of $700 million and a discount of $6 million
($694 million). The Trust Securities will be exchanged into a like amount of Holding Company junior subordinated debentures on
December 15, 2037, the scheduled redemption date; mandatorily under certain circumstances; and at any time upon the Holding
Company exercising its option to redeem the securities. The Trust Securities will be exchanged for junior subordinated debentures prior to
repayment. The final maturity of the debentures is December 15, 2067. The Holding Company may cause the redemption of the
Trust Securities or debentures (i) in whole or in part, at any time on or after December 15, 2032 at their principal amount plus accrued and
unpaid interest to the date of redemption, or (ii) in certain circumstances, in whole or in part, prior to December 15, 2032 at their principal
amount plus accrued and unpaid interest to the date of redemption or, if greater, a make-whole price. Interest on the Trust Securities or
debentures is payable semi-annually at a fixed rate of 7.875% up to, but not including, December 15, 2037, the scheduled redemption
date. In the event the Trust Securities or debentures are not redeemed on or before the scheduled redemption date, interest will accrue at
an annual rate of 3-month LIBOR plus a margin equal to 3.96%, payable quarterly in arrears. The Holding Company has the right to, and in
certain circumstances the requirement to, defer interest payments on the Trust Securities or debentures for a period up to ten years.
Interest compounds during such periods of deferral. If interest is deferred for more than five consecutive years, the Holding Company may
be required to use proceeds from the sale of its common stock or warrants on common stock to satisfy its obligation. In connection with the
issuance of the Trust Securities, the Holding Company entered into a replacement capital covenant (“RCC”). As a part of the RCC, the
Holding Company agreed that it will not repay, redeem, or purchase the debentures on or before December 15, 2057, unless, subject to
certain limitations, it has received proceeds from the sale of specified capital securities. The RCC will terminate upon the occurrence of
certain events, including an acceleration of the debentures due to the occurrence of an event of default. The RCC is not intended for the
benefit of holders of the debentures and may not be enforced by them. The RCC is for the benefit of holders of one or more other
designated series of its indebtedness (which will initially be its 5.70% senior notes due June 15, 2035). The Holding Company also entered
into a replacement capital obligation which will commence in 2037 and under which the Holding Company must use reasonable
commercial efforts to raise replacement capital through the issuance of certain qualifying capital securities.
In December 2007, MLIC reinsured a portion of its closed block liabilities to MetLife Reinsurance Company of Charleston (“MRC”), a
wholly-owned subsidiary of the Company. In connection with this transaction, MRC issued, to investors placed by an unaffiliated financial
institution, $2.5 billion of 35-year surplus notes to provide statutory reserve support for the assumed closed block liabilities. Interest on the
surplus notes accrues at an annual rate of 3-month LIBOR plus 55 basis points, payable quarterly. The ability of MRC to make interest and
principal payments on the surplus notes is contingent upon South Carolina regulatory approval. Simultaneous with issuing the surplus
notes, the Holding Company entered into an agreement with the unaffiliated financial institution, under which the Holding Company is
entitled to the interest paid by MRC on the surplus notes of 3-month LIBOR plus 55 basis points in exchange for the payment of 3-month
LIBOR plus 112 basis points, payable quarterly. Under this agreement, the Holding Company may also be required to make payments to
the unaffiliated financial institution related to any decline in the market value of the surplus notes and in connection with any early
termination of this agreement. A majority of the proceeds from the offering of the surplus notes were placed in trust to support MRC’s
statutory obligations associated with the assumed closed block liabilities. The trust is a VIE which is consolidated by the Company. At
December 31, 2007, the Company held assets in trust of $1.9 billion associated with the transaction.
In May 2007, the Holding Company and MetLife Reinsurance Company of South Carolina (“MRSC”), a wholly-owned subsidiary of the
Company, entered into a 30-year collateral financing arrangement with an unaffiliated financial institution that provides up to $3.5 billion of
statutory reserve support for MRSC associated with reinsurance obligations under intercompany reinsurance agreements. Such statutory
reserves are associated with universal life secondary guarantees and are required under U.S. Valuation of Life Policies Model Regulation
(commonly referred to as Regulation A-XXX). At December 31, 2007, $2.4 billion had been drawn upon under the collateral financing
arrangement. The collateral financing arrangement may be extended by agreement of the Holding Company and the unaffiliated financial
institution on each anniversary of the closing. Proceeds from the collateral financing arrangement were placed in trust to support MRSC’s
statutory obligations associated with the reinsurance of secondary guarantees. The trust is a VIE which is consolidated by the Company.
The unaffiliated financial institution is entitled to the return on the investment portfolio held by the trust. Simultaneous with entering into the
collateral financing arrangement, the Holding Company entered into an agreement with the same unaffiliated financial institution under
which the Holding Company is entitled to the return on the investment portfolio held by the trust established in connection with this
collateral financing arrangement in exchange for the payment of a stated rate of return to the unaffiliated financial institution of 3-month
LIBOR plus 70 basis points, payable quarterly. The Holding Company may also be required to make payments to the unaffiliated financial
institution, for deposit into the trust, related to any decline in the market value of the assets held by the trust, as well as amounts
outstanding upon maturity or early termination of the collateral financing arrangement. At December 31, 2007, the Company held assets in
trust of $2.3 billion associated with this transaction.
In March 2007, RGA issued $300 million of 10-year senior notes with a fixed rate of 5.625%, payable semiannually. RGA used
$50 million of the net proceeds of the offering to repay existing debt during the year ended December 31, 2007.
In December 2006, the Holding Company issued junior subordinated debentures with a face amount of $1.25 billion. The debentures
are scheduled for redemption on December 15, 2036; the final maturity of the debentures is December 15, 2066. The Holding Company
may redeem the debentures (i) in whole or in part, at any time on or after December 15, 2031 at their principal amount plus accrued and
unpaid interest to the date of redemption, or (ii) in certain circumstances, in whole or in part, prior to December 15, 2031 at their principal
amount plus accrued and unpaid interest to the date of redemption or, if greater, a make-whole price. Interest is payable semi-annually at a
fixed rate of 6.40% up to, but not including, December 15, 2036, the scheduled redemption date. In the event the debentures are not
redeemed on or before the scheduled redemption date, interest will accrue at an annual rate of 3-month LIBOR plus a margin equal to
2.205%, payable quarterly in arrears. The Holding Company has the right to, and in certain circumstances the requirement to, defer interest
payments on the debentures for a period up to ten years. Interest compounds during such periods of deferral. If interest is deferred for
more than five consecutive years, the Holding Company may be required to use proceeds from the sale of its common stock or warrants on
common stock to satisfy its obligation. In connection with the issuance of the debentures, the Holding Company entered into a RCC. As
44 MetLife, Inc.
part of the RCC, the Holding Company agreed that it will not repay, redeem, or purchase the debentures on or before December 15, 2056,
unless, subject to certain limitations, it has received proceeds from the sale of specified capital securities. The RCC will terminate upon the
occurrence of certain events, including an acceleration of the debentures due to the occurrence of an event of default. The RCC is not
intended for the benefit of holders of the debentures and may not be enforced by them. The RCC is for the benefit of holders of one or more
other designated series of its indebtedness (which will initially be its 5.70% senior notes due June 15, 2035). The Holding Company also
entered into a replacement capital obligation which will commence in 2036 and under which the Holding Company must use reasonable
commercial efforts to raise replacement capital through the issuance of certain qualifying capital securities.
In June 2006, Timberlake Financial L.L.C., (“Timberlake Financial”), a subsidiary of RGA, completed an offering of $850 million of
Series A Floating Rate Insured Notes due June 2036 in a private placement. Interest on the notes accrues at an annual rate of 1-month
LIBOR plus 29 basis points payable monthly. The payment of interest and principal on the notes is insured through a financial guaranty
insurance policy with a third party. The notes represent senior, secured indebtedness of Timberlake Financial with no recourse to RGA or its
other subsidiaries. Up to $150 million of additional notes may be offered in the future. In order to make payments of principal and interest on
the notes, Timberlake Financial will rely upon the receipt of interest and principal payments on surplus note and dividend payments from its
wholly-owned subsidiary, Timberlake Reinsurance Company II (“Timberlake Re”), a South Carolina captive insurance company. The ability
of Timberlake Re to make interest and principal payments on the surplus note and dividend payments to Timberlake Financial is contingent
upon South Carolina regulatory approval and the performance of specified term life insurance policies with guaranteed level premiums
retroceded by RGA’s subsidiary, RGA Reinsurance Company (“RGA Reinsurance”), to Timberlake Re. Proceeds from the offering of the
notes, along with a $113 million direct investment by RGA, collateralize the notes and are not available to satisfy the general obligations of
RGA or the Company. Most of these assets were placed in a trust and provide long-term collateral as support for statutory reserves
required by U.S. Valuation of Life Policies Model Regulation (commonly referred to as Regulation XXX) on term life insurance policies with
guaranteed level premium periods reinsured by RGA Reinsurance. The trust is consolidated by Timberlake Re which in-turn is consolidated
by Timberlake Financial. Timberlake Financial is considered to be a VIE and RGA is considered to be the primary beneficiary. As such, the
results of Timberlake Financial have been consolidated by RGA and ultimately by the Company. At December 31, 2007, the Company held
assets in trust of $899 million associated with the transaction. In addition the Company held $50 million in custody as of December 31,
2007.
MetLife Bank has entered into several repurchase agreements with the Federal Home Loan Bank of New York (the “FHLB of NY”)
whereby MetLife Bank has issued repurchase agreements in exchange for cash and for which the FHLB of NY has been granted a blanket
lien on MetLife Bank’s residential mortgages and mortgage-backed securities to collateralize MetLife Bank’s obligations under the
repurchase agreements. The repurchase agreements and the related security agreement represented by this blanket lien provide that
upon any event of default by MetLife Bank, the FHLB of NY’s recovery is limited to the amount of MetLife Bank’s liability under the
outstanding repurchase agreements. During the years ended December 31, 2007, 2006, and 2005, MetLife Bank received advances
totaling $390 million, $260 million and $775 million, respectively, from the FHLB of NY, which were included in long-term debt. MetLife Bank
also made repayments of $175 million, $117 million and $25 million to the FHLB of NY during the years ended December 31, 2007, 2006
and 2005, respectively. The amount of the Company’s liability for repurchase agreements with the FHLB of NY was $1.2 billion and
$998 million at December 31, 2007 and 2006, respectively, which is included in long-term debt.
In December 2005, RGA issued junior subordinated debentures with a face amount of $400 million. Interest is payable semi-annually at
a fixed rate of 6.75% up to but not including the scheduled redemption date, December 15, 2015. The debentures may be redeemed (i) in
whole or in part, at any time on or after December 15, 2015 at their principal amount plus accrued and unpaid interest to the date of
redemption, or (ii) in whole or in part, prior to December 15, 2015 at their principal amount plus accrued and unpaid interest to the date of
redemption or, if greater, a make-whole price. In the event the debentures are not redeemed on or before the scheduled redemption date of
December 15, 2015, interest on these debentures will accrue at an annual rate of 3-month LIBOR plus a margin equal to 2.665%, payable
quarterly in arrears. The final maturity of the debentures is December 15, 2065. RGA has the right to, and in certain circumstances the
requirement to, defer interest payments on the debentures for a period up to ten years. Upon an optional or mandatory deferral of interest
payments, RGA is generally not permitted to pay common stock dividends or make payments of interest or principal on securities which
rank equal or junior to the subordinated debentures, until the accrued and unpaid interest on the subordinated debentures is paid. Interest
compounds during periods of deferral.
In June 2005, the Company issued, in connection with the common equity units more fully described in “— Liquidity and Capital
Resources — The Holding Company — Liquidity Sources — Common Equity Units”, $1,067 million 4.82% Series A and $1,067 million
4.91% Series B junior subordinated debentures due no later than February 15, 2039 and February 15, 2040, respectively, for a total of
$2,134 million.
In June 2005, the Holding Company issued 400 million pounds sterling ($729.2 million at issuance) aggregate principal amount of
5.25% senior notes due June 29, 2020 at a discount of 4.5 million pounds sterling ($8.1 million at issuance), for aggregate proceeds of
395.5 million pounds sterling ($721.1 million at issuance). The senior notes were initially offered and sold outside the United States in
reliance upon Regulation S under the Securities Act of 1933, as amended (the “Securities Act”).
In June 2005, the Holding Company issued $1.0 billion aggregate principal amount of 5.00% senior notes due June 15, 2015 at a
discount of $2.7 million ($997.3 million), and $1.0 billion aggregate principal amount of 5.70% senior notes due June 15, 2035 at a
discount of $2.4 million ($997.6 million).
MetLife Funding, Inc. (“MetLife Funding”), a subsidiary of MLIC, serves as a centralized finance unit for the Company. Pursuant to a
support agreement, MLIC has agreed to cause MetLife Funding to have a tangible net worth of at least one dollar. At December 31, 2007
and 2006, MetLife Funding had a tangible net worth of $12 million and $11 million, respectively. MetLife Funding raises cash from various
funding sources and uses the proceeds to extend loans, through MetLife Credit Corp., another subsidiary of MLIC, to the Holding
Company, MLIC and other affiliates. MetLife Funding manages its funding sources to enhance the financial flexibility and liquidity of MLIC
and other affiliated companies. At December 31, 2007 and 2006, MetLife Funding had total outstanding liabilities, including accrued
interest payable, of $358 million and $840 million, respectively, consisting primarily of commercial paper.
Credit Facilities. The Company maintains committed and unsecured credit facilities aggregating $4.0 billion as of December 31, 2007.
When drawn upon, these facilities bear interest at varying rates in accordance with the respective agreements. The facilities can be used
45MetLife, Inc.
for general corporate purposes and at December 31, 2007, $3.0 billion of the facilities also served as back-up lines of credit for the
Company’s commercial paper programs.
Information on these credit facilities as of December 31, 2007 is as follows:
Borrower(s) Expiration Capacity
Letter of
Credit
Issuances Drawdowns
Unused
Commitments
(In millions)
MetLife, Inc. and MetLife Funding, Inc. . . . . . . June 2012 (1) $3,000 $1,532 $— $1,468
MetLife Bank, N.A. . . . . . . . . . . . . . . . . . . . July 2008 (2) 200 — — 200
Reinsurance Group of America, Incorporated . . May 2008 30 — 30 —
Reinsurance Group of America, Incorporated . . September 2012(3) 750 406 — 344
Reinsurance Group of America, Incorporated . . March 2011 44 — — 44
Total . . . . . . . . . . . . . . . . . . . . . . . . . . . $4,024 $1,938 $30 $2,056
(1) In June 2007, the Holding Company and MetLife Funding entered into a $3.0 billion credit agreement with various financial institutions,
the proceeds of which are available to be used for general corporate purposes, to support their commercial paper programs and for the
issuance of letters of credit. All borrowings under the credit agreement must be repaid by June 2012, except that letters of credit
outstanding upon termination may remain outstanding until June 2013. The borrowers and the lenders under this facility may agree to
extend the term of all or part of the facility to no later than June 2014, except that letters of credit outstanding upon termination may
remain outstanding until June 2015. The $1.5 billion credit agreement, with an April 2009 expiration, and the $1.5 billion credit
agreement, with an April 2010 expiration, were both terminated in June 2007 and replaced by the aforementioned facility.
(2) In July 2007, the facility was extended for one year to July 2008.
(3) In September 2007, RGA and certain of its subsidiaries entered into a credit agreement with various financial institutions. Under the
credit agreement, RGA may borrow and obtain letters of credit for general corporate purposes for its own account or for the account of
its subsidiaries with an overall credit facility amount of up to $750 million. The credit agreement replaced a former credit agreement in
the amount of $600 million which was scheduled to expire on September 29, 2010.
Committed Facilities. Information on committed facilities as of December 31, 2007 is as follows:
Account Party/Borrower(s) Expiration Capacity Drawdowns
Letter of
Credit
Issuances
Unused
Commitments
Maturity
(Years)
(In millions)
Exeter Reassurance Company Ltd.,
MetLife, Inc., & Missouri Re . . . . . . . . . . . . . June 2016 (1) $ 500 $ — $ 490 $ 10 8
Exeter Reassurance Company Ltd. . . . . . . . . . December 2027 (2) 650 — 410 240 20
Timberlake Financial L.L.C. . . . . . . . . . . . . . . June 2036 (3) 1,000 850 — 150 29
MetLife Reinsurance Company of
South Carolina & MetLife, Inc. . . . . . . . . . . . June 2037 (4) 3,500 2,382 — 1,118 30
MetLife Reinsurance Company of
Vermont & MetLife, Inc. . . . . . . . . . . . . . . . December 2037 (2),(5) 2,896 — 1,235 1,661 30
Total . . . . . . . . . . . . . . . . . . . . . . . . . . . . $8,546 $3,232 $2,135 $3,179
(1) Letters of credit and replacements or renewals thereof issued under this facility of $280 million, $10 million and $200 million are set to
expire no later than December 2015, March 2016 and June 2016, respectively.
(2) The Holding Company is a guarantor under this agreement.
(3) As described under “— Liquidity and Capital Resources — The Company — Liquidity Sources — Debt Issuances”, RGA may, at its
option, offer up to $150 million of additional notes under this facility in the future.
(4) In May 2007, MRSC terminated the $2.0 billion amended and restated five-year letter of credit and reimbursement agreement entered
into among the Holding Company, MRSC and various financial institutions on April 25, 2005. In its place the Company entered into a
30-year collateral financing arrangement as described under “Liquidity Sources — Debt Issuances”, which may be extended by
agreement of the Company and the financial institution on each anniversary of the closing of the facility for an additional one-year
period. At December 31, 2007, $2.4 billion had been drawn upon under the collateral financing arrangement.
(5) In December 2007, Exeter Reassurance Company Ltd. (“Exeter”) terminated four letters of credit, with expirations from March 2025
through December 2026, that were issued under a letter of credit facility with an unaffiliated financial institution in an aggregate amount
of $1.7 billion. The letters of credit had served as collateral for Exeter’s obligations under a reinsurance agreement that was recaptured
by MetLife Investors USA Insurance Company (“MLI-USA”) in December 2007. MLI-USA immediately thereafter entered into a new
reinsurance agreement with MetLife Reinsurance Company of Vermont (“MRV”). To collateralize its reinsurance obligations, MRV and
the Holding Company entered into a 30-year, $2.9 billion letter of credit facility with an unaffiliated financial institution.
Letters of Credit. At December 31, 2007, the Company had outstanding $4.2 billion in letters of credit, all of which are associated with
the aforementioned credit facilities, from various financial institutions, of which $2.1 billion and $1.9 billion were part of committed and
credit facilities, respectively. As commitments associated with letters of credit and financing arrangements may expire unused, these
amounts do not necessarily reflect the Company’s actual future cash funding requirements.
46 MetLife, Inc.
Liquidity Uses
Debt Repayments. On October 31, 2007, the Company redeemed $125 million of 8.525% GenAmerica Capital I Capital Securities
which were due to mature on June 30, 2027. As a result of this repayment, the Company recognized additional interest expense of
$10 million.
During the year ended December 31, 2007, RGA repaid $50 million of long-term debt using the proceeds from its March 2007 10-year
senior notes offering. See “— Liquidity and Capital Resources — The Company — Liquidity Sources — Debt Issuances” for further
information.
During the years ended December 31, 2007, 2006 and 2005, MetLife Bank made repayments of $175 million, $117 million and
$25 million, respectively, to the FHLB of NY. See “— Liquidity and Capital Resources — The Company — Liquidity Sources — Debt
Issuances” for further information.
The Holding Company repaid a $500 million 5.25% senior note which matured in December 2006 and a $1,006 million 3.911% senior
note which matured in May 2005.RGA repaid a $100 million 7.25% senior note which matured in April 2006.
MLIC repaid a $250 million 7% surplus note which matured on November 1, 2005.
Insurance Liabilities. The Company’s principal cash outflows primarily relate to the liabilities associated with its various life insurance,
property and casualty, annuity and group pension products, operating expenses and income tax, as well as principal and interest on its
outstanding debt obligations. Liabilities arising from its insurance activities primarily relate to benefit payments under the aforementioned
products, as well as payments for policy surrenders, withdrawals and loans.
Investment and Other. Additional cash outflows include those related to obligations of securities lending activities, investments in real
estate, limited partnerships and joint ventures, as well as litigation-related liabilities.
The following table summarizes the Company’s major contractual obligations as of December 31, 2007:
Contractual Obligations Total
Less Than
One Year
More Than
One Year and
Less Than
Three Years
More Than
Three Years
and Less
Than Five
Years
More Than
Five Years
(In millions)
Future policy benefits . . . . . . . . . . . . . . . . . . . (1) $288,837 $ 6,823 $ 9,471 $ 9,742 $262,801
Policyholder account balances . . . . . . . . . . . . . (2) 212,049 25,640 29,028 28,278 129,103
Other policyholder liabilities . . . . . . . . . . . . . . . (3) 10,592 8,322 93 112 2,065
Short-term debt . . . . . . . . . . . . . . . . . . . . . . (4) 667 667 — — —
Long-term debt. . . . . . . . . . . . . . . . . . . . . . . (4) 16,832 975 1,797 2,330 11,730
Collateral financing arrangements . . . . . . . . . . . (4) 12,800 301 603 660 11,236
Junior subordinated debt securities . . . . . . . . . . (4) 8,758 1,314 1,398 324 5,722
Shares subject to mandatory redemption . . . . . . (4) 785 13 26 26 720
Payables for collateral under securities loaned
and other transactions . . . . . . . . . . . . . . . . . (5) 44,136 44,136 — — —
Commitments to lend funds . . . . . . . . . . . . . . . (6) 10,559 8,063 1,141 639 716
Operating leases . . . . . . . . . . . . . . . . . . . . . . (7) 2,167 254 442 316 1,155
Other . . . . . . . . . . . . . . . . . . . . . . . . . . . . . (8) 8,278 7,711 6 6 555
Total . . . . . . . . . . . . . . . . . . . . . . . . . . . . $616,460 $104,219 $44,005 $42,433 $425,803
(1) Future policyholder benefits include liabilities related to traditional whole life policies, term life policies, closeout and other group annuity
contracts, structured settlements, MTF agreements, single premium immediate annuities, long-term disability policies, individual
disability income policies, LTC policies and property and casualty contracts.
Included within future policyholder benefits are contracts where the Company is currently making payments and will continue to do so
until the occurrence of a specific event such as death as well as those where the timing of a portion of the payments has been
determined by the contract. Also included are contracts where the Company is not currently making payments and will not make
payments until the occurrence of an insurable event, such as death or illness, or where the occurrence of the payment triggering event,
such as a surrender of a policy or contract, is outside the control of the Company. The Company has estimated the timing of the cash
flows related to these contracts based on historical experience as well as its expectation of future payment patterns.
Liabilities related to accounting conventions, or which are not contractually due, such as shadow liabilities, excess interest reserves
and property and casualty loss adjustment expenses, of $1.1 billion have been excluded from amounts presented in the table above.
Amounts presented in the table above, excluding those related to property and casualty contracts, represent the estimated cash
payments for benefits under such contracts including assumptions related to the receipt of future premiums and assumptions related to
mortality, morbidity, policy lapse, renewal, retirement, inflation, disability incidence, disability terminations, policy loans and other
contingent events as appropriate to the respective product type. Payments for case reserve liabilities and incurred but not reported
liabilities associated with property and casualty contracts of $1.6 billion have been included using an estimate of the ultimate amount to
be settled under the policies based upon historical payment patterns. The ultimate amount to be paid under property and casualty
contracts is not determined until the Company reaches a settlement with the claimant, which may vary significantly from the liability or
contractual obligation presented above especially as it relates to incurred but not reported liabilities. All estimated cash payments
presented in the table above are undiscounted as to interest, net of estimated future premiums on policies currently in-force and gross
of any reinsurance recoverable. The more than five years category displays estimated payments due for periods extending for more
than 100 years from the present date.
The sum of the estimated cash flows shown for all years in the table of $288.8 billion exceeds the liability amount of $132.3 billion
included on the consolidated balance sheet principally due to the time value of money, which accounts for at least 80% of the
47MetLife, Inc.
difference, as well as differences in assumptions, most significantly mortality, between the date the liabilities were initially established
and the current date.
For the majority of the Company’s insurance operations, estimated contractual obligations for future policyholder benefits and
policyholder account balance liabilities as presented in the table above are derived from the annual asset adequacy analysis used
to develop actuarial opinions of statutory reserve adequacy for state regulatory purposes. These cash flows are materially repre-
sentative of the cash flows under generally accepted accounting principles.
Actual cash payments to policyholders may differ significantly from the liabilities as presented in the consolidated balance sheet and
the estimated cash payments as presented in the table above due to differences between actual experience and the assumptions used
in the establishment of these liabilities and the estimation of these cash payments. See “— Liquidity and Capital Resources — The
Company — Asset/Liability Management.”
(2) Policyholder account balances include liabilities related to conventional guaranteed investment contracts, guaranteed investment
contracts associated with formal offering programs, funding agreements, individual and group annuities, total control accounts, bank
deposits, individual and group universal life, variable universal life and company-owned life insurance.
Included within policyholder account balances are contracts where the amount and timing of the payment is essentially fixed and
determinable. These amounts relate to policies where the Company is currently making payments and will continue to do so, as well as
those where the timing of the payments has been determined by the contract. Other contracts involve payment obligations where the
timing of future payments is uncertain and where the Company is not currently making payments and will not make payments until the
occurrence of an insurable event, such as death, or where the occurrence of the payment triggering event, such as a surrender of or
partial withdrawal on a policy or deposit contract, is outside the control of the Company. The Company has estimated the timing of the
cash flows related to these contracts based on historical experience as well as its expectation of future payment patterns.
Excess interest reserves representing purchase accounting adjustments of $794 million have been excluded from amounts presented
in the table above as they represent an accounting convention and not a contractual obligation.
Amounts presented in the table above represent the estimated cash payments to be made to policyholders undiscounted as to interest
and including assumptions related to the receipt of future premiums and deposits; withdrawals, including unscheduled or partial
withdrawals; policy lapses; surrender charges; annuitization; mortality; future interest credited; policy loans and other contingent
events as appropriate to the respective product type. Such estimated cash payments are also presented net of estimated future
premiums on policies currently in-force and gross of any reinsurance recoverable. For obligations denominated in foreign currencies,
cash payments have been estimated using current spot rates.
The sum of the estimated cash flows shown for all years in the table of $212.0 billion exceeds the liability amount of $137.3 billion
included on the consolidated balance sheet principally due to the time value of money, which accounts for at least 80% of the
difference, as well as differences in assumptions between the date the liabilities were initially established and the current date. See also
comments under footnote 1 regarding the source and uncertainties associated with the estimation of the contractual obligations related
to future policyholder benefits and policyholder account balances.
(3) Other policyholder liabilities is comprised of other policyholder funds, policyholder dividends payable and the policyholder dividend
obligation. Amounts included in the table above related to these liabilities are as follows:
(a) Other policyholder funds includes liabilities for incurred but not reported claims and claims payable on group term life, long-term
disability, LTC and dental; policyholder dividends left on deposit and policyholder dividends due and unpaid related primarily to
traditional life and group life and health; and premiums received in advance. Liabilities related to unearned revenue of $2.0 billion
have been excluded from the cash payments presented in the table above because they reflect an accounting convention and not a
contractual obligation. With the exception of policyholder dividends left on deposit, and those items excluded as noted in the
preceding sentence, the contractual obligation presented in the table above related to other policyholder funds is equal to the
liability reflected in the consolidated balance sheet. Such amounts are reported in the less than one year category due to the short-
term nature of the liabilities. Contractual obligations on policyholder dividends left on deposit are projected based on assumptions
of policyholder withdrawal activity.
(b) Policyholder dividends payable consists of liabilities related to dividends payable in the following calendar year on participating
policies. As such, the contractual obligation related to policyholder dividends payable is presented in the table above in the less
than one year category at the amount of the liability presented in the consolidated balance sheet.
(c) The nature of the policyholder dividend obligation is described in Note 9 of the Notes to Consolidated Financial Statements.
Because the exact timing and amount of the ultimate policyholder dividend obligation is subject to significant uncertainty and the
amount of the policyholder dividend obligation is based upon a long-term projection of the performance of the closed block,
management has reflected the obligation at the amount of the liability presented in the consolidated balance sheet in the more than
five years category. This was done to reflect the long-duration of the liability and the uncertainty of the ultimate cash payment.
(4) Amounts presented in the table above for short-term debt, long-term debt, collateral financing arrangements, junior subordinated debt
securities and shares subject to mandatory redemption differ from the balances presented on the consolidated balance sheet as the
amounts presented in the table above do not include premiums or discounts upon issuance or purchase accounting fair value
adjustments. The amounts presented above also include interest on such obligations as described below.
Short-term debt consists principally of 90-day commercial paper, with a remaining maturity of 54 days, and carries a variable rate of
interest. The contractual obligation for short-term debt presented in the table above represents the amounts due upon maturity of the
commercial paper plus the related variable interest which is calculated using the prevailing rates at December 31, 2007 through the
date of maturity without consideration of any further issuances of commercial paper upon maturity of the amounts outstanding at
December 31, 2007.
Long-term debt bears interest at fixed and variable interest rates through their respective maturity dates. Interest on fixed rate debt was
computed using the stated rate on the obligations through maturity. Interest on variable rate debt is computed using prevailing rates at
December 31, 2007 and, as such, does not consider the impact of future rate movements.
Collateral financing arrangements bear interest at fixed and variable interest rates through their respective maturity dates. Interest on
fixed rate debt was computed using the stated rate on the obligations through maturity. Interest on variable rate debt is computed using
prevailing rates at December 31, 2007 and, as such, does not consider the impact of future rate movements.
48 MetLife, Inc.
Junior subordinated debt bears interest at fixed interest rates through their respective redemption dates. Interest was computed using
the stated rate on the obligation through the scheduled redemption date as it is the Company’s expectation that the debt will be
redeemed at that time. Inclusion of interest payments on junior subordinated debt through the final maturity date would increase the
contractual obligation by $6.2 billion.
Shares subject to mandatory redemption bear interest at fixed interest rates through their respective mandatory redemption dates.
Interest on shares subject to mandatory redemption was computed using the stated fixed rate on the obligation through maturity.
Long-term debt also includes payments under capital lease obligations of $13 million, $15 million, $3 million and $24 million, in the less
than one year, one to three years, three to five years and more than five years categories, respectively.
(5) The Company has accepted cash collateral in connection with securities lending and derivative transactions. As the securities lending
transactions expire within the next year or the timing of the return of the collateral is uncertain, the return of the collateral has been
included in the less than one year category in the table above. The Company also holds non-cash collateral, which is not reflected as a
liability in the consolidated balance sheet, of $718 million as of December 31, 2007.
(6) The Company commits to lend funds under mortgage loans, partnerships, bank credit facilities, bridge loans and private corporate
bond investments. In the table above, the timing of the funding of mortgage loans and private corporate bond investments is based on
the expiration date of the commitment. As it relates to commitments to lend funds to partnerships and under bank credit facilities, the
Company anticipates that these amounts could be invested any time over the next five years; however, as the timing of the fulfillment of
the obligation cannot be predicted, such obligations are presented in the less than one year category in the table above. Commitments
to fund bridge loans are short-term obligations and, as a result, are presented in the less than one year category in the table above. See
“— Off-Balance Sheet Arrangements.”
(7) As a lessee, the Company has various operating leases, primarily for office space. Contractual provisions exist that could increase or
accelerate those leases obligations presented, including various leases with early buyouts and/or escalation clauses. However, the
impact of any such transactions would not be material to the Company’s financial position or results of operations. See “— Off-Balance
Sheet Arrangements.”
(8) Other includes those other liability balances which represent contractual obligations, as well as other miscellaneous contractual
obligations of $32 million not included elsewhere in the table above. Other liabilities presented in the table above is principally
comprised of amounts due under reinsurance arrangements, payables related to securities purchased but not yet settled, securities
sold short, accrued interest on debt obligations, fair value of derivative obligations, deferred compensation arrangements, guaranty
liabilities, the fair value of forward stock purchase contracts, as well as general accruals and accounts payable due under contractual
obligations. If the timing of any of the other liabilities is sufficiently uncertain, the amounts are included within the less than one year
category.
The other liabilities presented in the table above differs from the amount presented in the consolidated balance sheet by $6.1 billion
due primarily to the exclusion of items such as minority interests, legal liabilities, pension and postretirement benefit obligations, taxes
due other than income tax, unrecognized tax benefits and related accrued interest, accrued severance and employee incentive
compensation and other liabilities such as deferred gains and losses. Such items have been excluded from the table above as they
represent accounting conventions or are not liabilities due under contractual obligations.
The net funded status of the Company’s pension and other postretirement liabilities included within other liabilities has been excluded
from the amounts presented in the table above. Rather, the amounts presented represent the discretionary contributions of $150 million
to be made by the Company to the pension plan in 2008 and the discretionary contributions of $116 million, based on the next year’s
expected gross benefit payments to participants, to be made by the Company to the postretirement benefit plans during 2008. Virtually
all contributions to the pension and postretirement benefit plans are made by the insurance subsidiaries of the Holding Company with
little impact on the Holding Company’s cash flows.
Excluded from the table above are deferred income tax liabilities, unrecognized tax benefits, and accrued interest of $2.5 billion,
$1.0 billion, and $252 million, respectively, for which the Company cannot reliably determine the timing of payment. Current income tax
payable is also excluded from the table.
See also “— Off-Balance Sheet Arrangements.”
Separate account liabilities are excluded from the table above. Separate account liabilities represent the fair market value of the funds
that are separately administered by the Company. Generally, the separate account owner, rather than the Company, bears the investment
risk of these funds. The separate account liabilities are legally segregated and are not subject to the claims that arise out of any other
business of the Company. Net deposits, net investment income and realized and unrealized capital gains and losses on the separate
accounts are not reflected in the consolidated statements of income. The separate account liabilities will be fully funded by cash flows from
the separate account assets.
The Company also enters into agreements to purchase goods and services in the normal course of business; however, these purchase
obligations are not material to its consolidated results of operations or financial position as of December 31, 2007.
Additionally, the Company has agreements in place for services it conducts, generally at cost, between subsidiaries relating to
insurance, reinsurance, loans, and capitalization. Intercompany transactions have appropriately been eliminated in consolidation. Inter-
company transactions among insurance subsidiaries and affiliates have been approved by the appropriate departments of insurance as
required.
Support Agreements. The Holding Company and several of its subsidiaries (each, an “Obligor”) are parties to various capital support
commitments, guarantees and contingent reinsurance agreements with certain subsidiaries of the Holding Company and a corporation in
which the Holding Company owns 50% of the equity. Under these arrangements, each Obligor, with respect to the applicable entity, has
agreed to cause such entity to meet specified capital and surplus levels, has guaranteed certain contractual obligations or has agreed to
provide, upon the occurrence of certain contingencies, reinsurance for such entity’s insurance liabilities or for certain policies reinsured by
such entity. Management does not anticipate that these arrangements will place any significant demands upon the Company’s liquidity
resources.
49MetLife, Inc.
Litigation. Putative or certified class action litigation and other litigation, and claims and assessments against the Company, in addition
to those discussed elsewhere herein and those otherwise provided for in the Company’s consolidated financial statements, have arisen in
the course of the Company’s business, including, but not limited to, in connection with its activities as an insurer, employer, investor,
investment advisor and taxpayer. Further, state insurance regulatory authorities and other federal and state authorities regularly make
inquiries and conduct investigations concerning the Company’s compliance with applicable insurance and other laws and regulations.
It is not possible to predict or determine the ultimate outcome of all pending investigations and legal proceedings or provide reasonable
ranges of potential losses except as noted elsewhere herein in connection with specific matters. In some of the matters referred to herein,
very large and/or indeterminate amounts, including punitive and treble damages, are sought. Although in light of these considerations, it is
possible that an adverse outcome in certain cases could have a material adverse effect upon the Company’s financial position, based on
information currently known by the Company’s management, in its opinion, the outcome of such pending investigations and legal
proceedings are not likely to have such an effect. However, given the large and/or indeterminate amounts sought in certain of these matters
and the inherent unpredictability of litigation, it is possible that an adverse outcome in certain matters could, from time to time, have a
material adverse effect on the Company’s consolidated net income or cash flows in particular quarterly or annual periods.
Other. Based on management’s analysis of its expected cash inflows from operating activities, the dividends it receives from
subsidiaries, including MLIC, that are permitted to be paid without prior insurance regulatory approval and its portfolio of liquid assets
and other anticipated cash flows, management believes there will be sufficient liquidity to enable the Company to make payments on debt,
make cash dividend payments on its common and preferred stock, pay all operating expenses, and meet its cash needs. The nature of the
Company’s diverse product portfolio and customer base lessens the likelihood that normal operations will result in any significant strain on
liquidity.
Consolidated Cash Flows. Net cash provided by operating activities increased by $3.4 billion to $10.0 billion for the year ended
December 31, 2007 as compared to $6.6 billion for the year ended December 31, 2006 primarily due to higher net investment income and
premiums, fees and other revenues.
Net cash provided by operating activities decreased by $1.4 billion to $6.6 billion for the year ended December 31, 2006 as compared
to $8.0 billion for the comparable 2005 period. The decrease in operating cash flows was primarily due to reinsurance receivables related
to the sale of certain small market recordkeeping businesses. Partially offsetting the decrease was an increase in operating cash flows in
2006 over the comparable 2005 period primarily attributable to the acquisition of Travelers.
Net cash provided by financing activities was $3.9 billion and $15.4 billion for the years ended December 31, 2007 and 2006,
respectively. Accordingly, net cash provided by financing activities decreased by $11.5 billion for the year ended December 31, 2007 as
compared to the prior year. Net cash provided by financing activities decreased primarily as a result of a decrease of $13.0 billion in the
amount of securities lending cash collateral received in connection with the Company’s securities lending program and other cash
collateral, $1.2 billion of an increase in shares acquired under the Company’s common stock repurchase program, a decrease in short-
term debt borrowings of $0.8 billion and a decrease of $0.6 billion in net cash provided by policyholder account balances. In addition, net
cash provided by financing activities was $0.5 billion lower than the comparable 2006 period due to the issuance of $0.7 billion of junior
subordinated debt securities in 2007 as compared to $1.2 billion issued in 2006. These decreases were partially offset by an increase in
the issuance of collateral financing arrangements of $4.0 billion and an increase in net issuances versus net repayments of long-term debt
of $0.9 billion.
Net cash provided by financing activities was $15.4 billion and $14.5 billion for the years ended December 31, 2006 and 2005,
respectively. Accordingly, net cash provided by financing activities increased by $0.9 billion primarily as a result of an increase of
$7.2 billion in the amount of securities lending cash collateral received in connection with the securities lending program, a decrease in
long-term debt repayments of $0.7 billion, an increase in the issuance of collateral financing arrangements of $0.9 billion and an increase in
short-term debt borrowings of $0.1 billion. Such increases were offset by decreases in financing cash flows resulting from a decrease in
issuance of preferred stock, junior subordinated debt securities, and long-term debt aggregating $6.6 billion which were principally used to
finance the acquisition of Travelers in 2005, combined with a decrease of $0.9 billion associated with a decrease in net policyholder
account balance deposits and an increase of $0.5 billion of shares acquired under the Company’s common stock repurchase program
which was resumed in the fourth quarter of 2006.
Net cash used in investing activities was $10.6 billion and $18.9 billion for the years ended December 31, 2007 and 2006, respectively.
Accordingly, net cash used in investing activities decreased by $8.3 billion for the year ended December 31, 2007 as compared to prior
year. In the current year, cash available for the purchase of invested assets decreased by $11.5 billion as a result of the reduction in cash
provided by financing activities discussed above. Also, partially offsetting this decrease was an increase of $3.4 billion in net cash provided
by operating activities discussed above. The lower amount of cash available for investing activities resulted in a decrease in net purchases
of fixed maturity securities of $15.9 billion, other invested assets of $1.4 billion, and a decrease in net origination of mortgage and
consumer loans of $0.6 billion. This was partially offset by increases in the net purchases of real estate and real estate joint ventures of
$6.3 billion, equity securities of $1.4 billion and other limited partnership interests of $0.8 billion. Also, there was a decrease in cash
provided by short-term investments of $0.5 billion. In addition, the 2007 period includes the sale of MetLife Australia’s annuities and
pension businesses and the acquisition of the remaining 50% interest in MetLife Fubon of $0.7 billion, while the 2006 period includes
additional consideration paid related to purchases of businesses $0.1 billion.
Net cash used in investing activities was $18.9 billion and $22.6 billion for the years ended December 31, 2006 and 2005, respectively.
Accordingly, net cash used in investing activities decreased by $3.7 billion for the year ended December 31, 2006 as compared to prior
year. Net cash used in investing activities in the prior year included cash used to acquire Travelers of $11.0 billion, less cash acquired of
$0.9 billion for a net total cash paid of $10.1 billion, which was funded by $6.8 billion in securities issuances and $4.2 billion of cash
provided by operations and the sale of invested assets. During the current year, cash available for investment as a result of cash collateral
received in connection with the securities lending program increased by $7.2 billion. Cash available from operations and available for
investment decreased by $1.4 billion. Cash available for the purchase of invested assets increased by $4.3 billion as a result of the
increase in securities lending activities of $7.2 billion as well as a decrease in the cash required for acquisitions of $4.2 billion, offset by the
decrease in issuance of preferred stock, junior subordinated debt securities, and long-term debt aggregating $6.6 billion as well as the
50 MetLife, Inc.
decrease in cash flow from operations of $1.4 billion. Cash available for investing activities was used to increase purchases of fixed
maturity securities, other invested assets, and short-term investments, as well as increase the origination of mortgage and consumer loans
and decrease net sales of real estate and real estate joint ventures and equity securities.
The Holding Company
Capital
Restrictions and Limitations on Bank Holding Companies and Financial Holding Companies — Capital. The Holding Company and its
insured depository institution subsidiary, MetLife Bank, are subject to risk-based and leverage capital guidelines issued by the federal
banking regulatory agencies for banks and financial holding companies. The federal banking regulatory agencies are required by law to
take specific prompt corrective actions with respect to institutions that do not meet minimum capital standards. As of their most recently
filed reports with the federal banking regulatory agencies, MetLife, Inc. and MetLife Bank met the minimum capital standards as per federal
banking regulatory agencies with all of MetLife Bank’s risk-based and leverage capital ratios meeting the federal banking regulatory
agencies’ “well capitalized” standards and all of MetLife, Inc.’s risk-based and leverage capital ratios meeting the “adequately capitalized”
standards.
The following table contains the RBC ratios and the regulatory requirements for MetLife, Inc., as a bank holding company, and MetLife
Bank:
MetLife, Inc.
RBC Ratios — Bank Holding Company
2007 2006
Regulatory
Requirements
Minimum
Regulatory
Requirements
“Well Capitalized”
December 31,
Total RBC Ratio . . . . . . . . . . . . . . . . . . . . . . . . . . . . . . . . . . 9.87% 9.89% 8.00% 10.00%
Tier 1 RBC Ratio . . . . . . . . . . . . . . . . . . . . . . . . . . . . . . . . . . 9.56% 9.51% 4.00% 6.00%
Tier 1 Leverage Ratio . . . . . . . . . . . . . . . . . . . . . . . . . . . . . . . 5.56% 5.55% 4.00% n/a
MetLife Bank
RBC Ratios — Bank
2007 2006
Regulatory
Requirements
Minimum
Regulatory
Requirements
“Well Capitalized”
December 31,
Total RBC Ratio . . . . . . . . . . . . . . . . . . . . . . . . . . . . . . . . . 12.60% 11.44% 8.00% 10.00%
Tier 1 RBC Ratio . . . . . . . . . . . . . . . . . . . . . . . . . . . . . . . . 12.03% 10.88% 4.00% 6.00%
Tier 1 Leverage Ratio . . . . . . . . . . . . . . . . . . . . . . . . . . . . . 6.32% 5.98% 4.00% 5.00%
Liquidity
Liquidity is managed to preserve stable, reliable and cost-effective sources of cash to meet all current and future financial obligations
and is provided by a variety of sources, including a portfolio of liquid assets, a diversified mix of short- and long-term funding sources from
the wholesale financial markets and the ability to borrow through committed credit facilities. The Holding Company is an active participant in
the global financial markets through which it obtains a significant amount of funding. These markets, which serve as cost-effective sources
of funds, are critical components of the Holding Company’s liquidity management. Decisions to access these markets are based upon
relative costs, prospective views of balance sheet growth and a targeted liquidity profile. A disruption in the financial markets could limit the
Holding Company’s access to liquidity.
The Holding Company’s ability to maintain regular access to competitively priced wholesale funds is fostered by its current high credit
ratings from the major credit rating agencies. Management views its capital ratios, credit quality, stable and diverse earnings streams,
diversity of liquidity sources and its liquidity monitoring procedures as critical to retaining high credit ratings.
Liquidity is monitored through the use of internal liquidity risk metrics, including the composition and level of the liquid asset portfolio,
timing differences in short-term cash flow obligations, access to the financial markets for capital and debt transactions and exposure to
contingent draws on the Holding Company’s liquidity.
Liquidity Sources
Dividends. The primary source of the Holding Company’s liquidity is dividends it receives from its insurance subsidiaries. The Holding
Company’s insurance subsidiaries are subject to regulatory restrictions on the payment of dividends imposed by the regulators of their
respective domiciles. The dividend limitation for U.S. insurance subsidiaries is based on the surplus to policyholders as of the immediately
preceding calendar year and statutory net gain from operations for the immediately preceding calendar year. Statutory accounting
practices, as prescribed by insurance regulators of various states in which the Company conducts business, differ in certain respects from
accounting principles used in financial statements prepared in conformity with GAAP. The significant differences relate to the treatment of
DAC, certain deferred income tax, required investment reserves, reserve calculation assumptions, goodwill and surplus notes. Manage-
ment of the Holding Company cannot provide assurances that the Holding Company’s insurance subsidiaries will have statutory earnings to
support payment of dividends to the Holding Company in an amount sufficient to fund its cash requirements and pay cash dividends and
that the applicable insurance departments will not disapprove any dividends that such insurance subsidiaries must submit for approval.
51MetLife, Inc.
The table below sets forth the dividends permitted to be paid by the respective insurance subsidiary without insurance regulatory
approval and the respective dividends paid:
Company
Permitted w/o
Approval(1) Paid(2)
Permitted w/o
Approval(3) Paid(2)
Permitted w/o
Approval(3)
200 8 2007 200 6
(In millions)
Metropolitan Life Insurance Company . . . . . . . . . . . . $1,299 $500 $919 $ 863 $863
MetLife Insurance Company of Connecticut . . . . . . . . $1,026 $690 (5) $690 $ 917 (4) $ —
Metropolitan Tower Life Insurance Company . . . . . . . . $ 113 $ — $104 $2,300 (6) $ 85
Metropolitan Property and Casualty Insurance
Company . . . . . . . . . . . . . . . . . . . . . . . . . . . . . $ — $400 $ 16 $ 300 $178
(1) Reflects dividend amounts that may be paid during 2008 without prior regulatory approval. However, if paid before a specified date
during 2008, some or all of such dividends may require regulatory approval.
(2) Includes amounts paid including those requiring regulatory approval.
(3) Reflects dividend amounts that could have been paid during the relevant year without prior regulatory approval.
(4) Includes a return of capital of $259 million.
(5) Includes a return of capital of $404 million as approved by the applicable insurance department, of which $350 million was paid to the
Holding Company.
(6) This dividend reflects the proceeds associated with the sale of Peter Cooper Village and Stuyvesant Town properties to be used for
general corporate purposes.
For the year ended December 31, 2007, $190 million in dividends from other subsidiaries were paid, of which $176 million were returns
of capital, to the Holding Company. MetLife Mexico S.A. paid $116 million in dividends to the Holding Company for the year ended
December 31, 2006. For the year ended December 31, 2006, there were returns of capital of $154 million to the Holding Company from
other subsidiaries.
Liquid Assets. An integral part of the Holding Company’s liquidity management is the amount of liquid assets it holds. Liquid assets
include cash, cash equivalents, short-term investments and marketable fixed maturity securities. Liquid assets exclude assets relating to
securities lending activities. At December 31, 2007 and 2006, the Holding Company had $2.3 billion and $3.9 billion in liquid assets,
respectively.
Global Funding Sources. Liquidity is also provided by a variety of both short-term and long-term instruments, commercial paper,
medium- and long-term debt, junior subordinated debt securities, collateral financing arrangements, capital securities and stockholders’
equity. The diversity of the Holding Company’s funding sources enhances funding flexibility and limits dependence on any one source of
funds and generally lowers the cost of funds. Other sources of the Holding Company’s liquidity include programs for short- and long-term
borrowing, as needed.
At December 31, 2007 and 2006, the Holding Company had $310 million and $616 million in short-term debt outstanding, respectively.
At both December 31, 2007 and 2006, the Holding Company had $7.0 billion of unaffiliated long-term debt outstanding. At both
December 31, 2007 and 2006, the Holding Company had $500 million of affiliated long-term debt outstanding. At both December 31,
2007 and 2006, the Holding Company had $3.4 billion of junior subordinated debt securities outstanding. At December 31, 2007, the
Holding Company had $2.4 billion in collateral financing arrangements outstanding. The Holding Company did not have any collateral
financing arrangements outstanding at December 31, 2006.
In November 2007, the Holding Company filed a shelf registration statement (the “2007 Registration Statement”) with the SEC, which
was automatically effective upon filing, in accordance with SEC rules which also allow for pay-as-you-go fees and the ability to add
securities by filing automatically effective amendment for companies, such as the Holding Company, which qualify as “Well-Known
Seasoned Issuers.” The 2007 Registration Statement registered an unlimited amount of debt and equity securities and supersedes the
shelf registration statement that the Holding Company filed in April 2005. The terms of any offering will be established at the time of the
offering.
Debt Issuances. As described more fully in “— Liquidity and Capital Resources — The Company — Liquidity Sources — Debt
Issuances”, during December 2007, Trust IV issued Trust Securities with a face amount of $700 million and a discount of $6 million
($694 million) and a fixed rate of interest of 7.875% up to, but not including, December 15, 2037, the scheduled redemption date. The
beneficial interest of Trust IV held by the Holding Company is not represented by an investment in Trust IV but rather by a financing
agreement between the Holding Company and Trust IV. The assets of Trust IV are $700 million of 7.375% surplus notes of MLIC, which are
scheduled to mature December 15, 2037, and rights under the financing agreement. Under the financing agreement, the Holding
Company has the obligation to make payments (i) semiannually at a fixed rate of 0.50% of the surplus notes outstanding and owned by
Trust IV or if greater (ii) equal to the difference between the Trust Securities interest payment and the interest received by Trust IV on the
surplus notes. The ability of MLIC to make interest and principal payments on the surplus notes to the Holding Company is contingent upon
regulatory approval. The Trust Securities, will be exchanged into a like amount of Holding Company junior subordinated debentures on
December 15, 2037, the scheduled redemption date; mandatorily under certain circumstances; and at any time upon the Holding
Company exercising its option to redeem the securities. The Trust Securities will be exchanged for junior subordinated debentures prior to
repayment and the Holding Company is ultimately responsible for repayment of the junior subordinated debentures. The Holding
Company’s other rights and obligations as it relates to the deferral of interest, redemption, replacement capital obligation and replacement
capital covenant associated with the issuance of the Trust Securities are more fully described in “— Liquidity and Capital Resources — The
Company — Liquidity Sources — Debt Issuances.”
52 MetLife, Inc.
As described more fully in “— Liquidity and Capital Resources — The Company — Liquidity Sources — Debt Issuances”:
• In December 2007, the Holding Company, in connection with the collateral financing arrangement associated with MRC’s reinsurance
of the closed block liabilities, entered into an agreement with an unaffiliated financial institution under which the Holding Company is
entitled to the interest paid by MRC on the surplus notes of 3-month LIBOR plus 55 basis points in exchange for the payment of
3-month LIBOR plus 112 basis points, payable quarterly. Under this agreement, the Holding Company may also be required to make
payments to the unaffiliated financial institution related to any decline in the market value of the surplus notes and in connection with
any early termination of this agreement. The Holding Company’s net cost of 57 basis points has been allocated to MRC. For the year
ended December 31, 2007, this amount was immaterial.
• In May 2007, the Holding Company, in connection with the collateral financing arrangement associated with MRSC’s reinsurance of
universal life secondary guarantees, entered into an agreement with an unaffiliated financial institution under which the Holding
Company is entitled to the return on the investment portfolio held by the trust established in connection with this collateral financing
arrangement in exchange for the payment of a stated rate of return to the unaffiliated financial institution of 3-month LIBOR plus
70 basis points, payable quarterly. The Holding Company may also be required to make payments to the unaffiliated financial
institution, for deposit into the trust, related to any decline in the market value of the assets held by the trust, as well as amounts
outstanding upon maturity or early termination of the collateral financing arrangement. As a result of this agreement, the Holding
Company effectively assumed the $2.4 billion liability under the collateral financing arrangement along with a beneficial interest in the
trust holding the associated assets. The Holding Company simultaneously contributed to MRSC its beneficial interest in the trust,
along with any return to be received on the investment portfolio held by the trust. The Holding Company allocates the financing costs
associated with the collateral financing arrangement to MRSC.
In December 2006, the Holding Company issued junior subordinated debentures with a face amount of $1.25 billion. See “— Liquidity
and Capital Resources — The Company — Liquidity Sources — Debt Issuances” for further information.
In September 2006, the Holding Company issued $204 million of affiliated long-term debt with an interest rate of 6.07% maturing in
2016.
In March 2006, the Holding Company issued $10 million of affiliated long-term debt with an interest rate of 5.70% maturing in 2016.
In December 2005, the Holding Company issued $286 million of affiliated long-term debt with an interest rate of 5.24% maturing in
2015.
In June 2005, the Holding Company issued $1.0 billion aggregate principal amount of 5.00% senior notes due June 15, 2015 at a
discount of $2.7 million ($997.3 million), and $1.0 billion aggregate principal amount of 5.70% senior notes due June 15, 2035 at a
discount of $2.4 million ($997.6 million).
In June 2005, the Holding Company issued 400 million pounds sterling ($729.2 million at issuance) aggregate principal amount of
5.25% senior notes due June 29, 2020 at a discount of 4.5 million pounds sterling ($8.1 million at issuance), for aggregate proceeds of
395.5 million pounds sterling ($721.1 million at issuance). These notes were initially offered and sold outside the United States in reliance
upon Regulation S under the Securities Act.
The following table summarizes the Holding Company’s outstanding senior notes issuances, excluding any premium or discount:
Issue Date Principal Interest Rate Maturity
(In millions)
June 2005 . . . . . . . . . . . . . . . . . . . . . . . . . . . . . . . . . . . . . . . . . . . . . . . . $1,000 5.00% 2015
June 2005 . . . . . . . . . . . . . . . . . . . . . . . . . . . . . . . . . . . . . . . . . . . . . . . . $1,000 5.70% 2035
June 2005(1) . . . . . . . . . . . . . . . . . . . . . . . . . . . . . . . . . . . . . . . . . . . . . . $ 794 5.25% 2020
December 2004(1) . . . . . . . . . . . . . . . . . . . . . . . . . . . . . . . . . . . . . . . . . . $ 695 5.38% 2024
June 2004 . . . . . . . . . . . . . . . . . . . . . . . . . . . . . . . . . . . . . . . . . . . . . . . . $ 350 5.50% 2014
June 2004 . . . . . . . . . . . . . . . . . . . . . . . . . . . . . . . . . . . . . . . . . . . . . . . . $ 750 6.38% 2034
November 2003 . . . . . . . . . . . . . . . . . . . . . . . . . . . . . . . . . . . . . . . . . . . . $ 500 5.00% 2013
November 2003 . . . . . . . . . . . . . . . . . . . . . . . . . . . . . . . . . . . . . . . . . . . . $ 200 5.88% 2033
December 2002 . . . . . . . . . . . . . . . . . . . . . . . . . . . . . . . . . . . . . . . . . . . . $ 400 5.38% 2012
December 2002 . . . . . . . . . . . . . . . . . . . . . . . . . . . . . . . . . . . . . . . . . . . . $ 600 6.50% 2032
November 2001 . . . . . . . . . . . . . . . . . . . . . . . . . . . . . . . . . . . . . . . . . . . . $ 750 6.13% 2011
(1) This amount represents the translation of pounds sterling into U.S. dollars using the noon buying rate on December 31, 2007 of
$1.9843 as announced by the Federal Reserve Bank of New York.
See also “— Liquidity and Capital Resources — The Holding Company — Liquidity Sources — Common Equity Units” for a description
of $2,134 million of junior subordinated debt securities issued in connection with the issuance of common equity units.
Preferred Stock. During the year ended December 31, 2007, the Holding Company issued no new preferred stock.
In June 2005, the Holding Company issued 24 million shares of Floating Rate Non-Cumulative Preferred Stock, Series A (the “Series A
preferred shares”) with a $0.01 par value per share, and a liquidation preference of $25 per share, for aggregate proceeds of $600 million.
In June 2005, the Holding Company issued 60 million shares of 6.50% Non-Cumulative Preferred Stock, Series B (the “Series B
preferred shares,” together with the Series A preferred shares, collectively, the “Preferred Shares”) with a $0.01 par value per share, and a
liquidation preference of $25 per share for aggregate proceeds of $1.5 billion.
The Preferred Shares rank senior to the common stock with respect to dividends and liquidation rights. Dividends on the Preferred
Shares are not cumulative. Holders of the Preferred Shares will be entitled to receive dividend payments only when, as and if declared by
the Holding Company’s Board of Directors or a duly authorized committee of the board. If dividends are declared on the Series A preferred
shares, they will be payable quarterly, in arrears, at an annual rate of the greater of: (i) 1.00% above 3-month LIBOR on the related LIBOR
determination date; or (ii) 4.00%. Any dividends declared on the Series B preferred shares will be payable quarterly, in arrears, at an annual
fixed rate of 6.50%. Accordingly, in the event that dividends are not declared on the Preferred Shares for payment on any dividend payment
date, then those dividends will cease to accrue and be payable. If a dividend is not declared before the dividend payment date, the Holding
53MetLife, Inc.
Company has no obligation to pay dividends accrued for that dividend period whether or not dividends are declared and paid in future
periods. No dividends may, however, be paid or declared on the Holding Company’s common stock — or any other securities ranking
junior to the Preferred Shares — unless the full dividends for the latest completed dividend period on all Preferred Shares, and any parity
stock, have been declared and paid or provided for.
The Holding Company is prohibited from declaring dividends on the Preferred Shares if it fails to meet specified capital adequacy, net
income and shareholders’ equity levels. In addition, under Federal Reserve Board policy, the Holding Company may not be able to pay
dividends if it does not earn sufficient operating income.
The Preferred Shares do not have voting rights except in certain circumstances where the dividends have not been paid for an
equivalent of six or more dividend payment periods whether or not those periods are consecutive. Under such circumstances, the holders
of the Preferred Shares have certain voting rights with respect to members of the Board of Directors of the Holding Company.
The Preferred Shares are not subject to any mandatory redemption, sinking fund, retirement fund, purchase fund or similar provisions.
The Preferred Shares are redeemable, but not prior to September 15, 2010. On and after that date, subject to regulatory approval, the
Preferred Shares will be redeemable at the Holding Company’s option in whole or in part, at a redemption price of $25 per Preferred Share,
plus declared and unpaid dividends.
See “— Liquidity and Capital Resources — The Holding Company — Liquidity Uses — Dividends” for dividends paid on the Company’s
preferred stock.
Common Equity Units. In connection with financing the acquisition of Travelers on July 1, 2005, the Holding Company distributed and
sold 82.8 million 6.375% common equity units for $2,070 million in proceeds in a registered public offering on June 21, 2005.
Each common equity unit has an initial stated amount of $25 per unit and consists of:
• a 1/80, or 1.25% ($12.50), undivided beneficial ownership interest in a series A trust preferred security of MetLife Capital Trust II
(“Series A Trust”), with an initial liquidation amount of $1,000.
• a 1/80, or 1.25% ($12.50), undivided beneficial ownership interest in a series B trust preferred security of MetLife Capital Trust III
(“Series B Trust” and, together with the Series A Trust, the “Capital Trusts”), with an initial liquidation amount of $1,000.
• a stock purchase contract under which the holder of the common equity unit will purchase and the Holding Company will sell, on
each of the initial stock purchase date and the subsequent stock purchase date, a variable number of shares of the Holding
Company’s common stock, par value $0.01 per share, for a purchase price of $12.50.
The Holding Company issued $1,067 million 4.82% Series A and $1,067 million 4.91% Series B junior subordinated debt securities due
no later than February 15, 2039 and February 15, 2040, respectively, for a total of $2,134 million, in exchange for $2,070 million in
aggregate proceeds from the sale of the trust preferred securities by the Capital Trusts and $64 million in trust common securities issued
equally by the Capital Trusts. The common and preferred securities of the Capital Trusts, totaling $2,134 million, represent undivided
beneficial ownership interests in the assets of the Capital Trusts, have no stated maturity and must be redeemed upon maturity of the
corresponding series of junior subordinated debt securities — the sole assets of the respective Capital Trusts. The Series A Trust and
Series B Trust will each make quarterly distributions on the common and preferred securities at an annual rate of 4.82% and 4.91%,
respectively.
The Holding Company has directly guaranteed the repayment of the trust preferred securities to the holders thereof to the extent that
there are funds available in the Capital Trusts. The guarantee will remain in place until the full redemption of the trust preferred securities.
The trust preferred securities held by the common equity unit holders are pledged to the Holding Company to collateralize the obligation of
the common equity unit holders under the related stock purchase contracts. The common equity unit holder may substitute certain zero
coupon treasury securities in place of the trust preferred securities as collateral under the stock purchase contract.
The trust preferred securities have remarketing dates which correspond with the initial and subsequent stock purchase dates to provide
the holders of the common equity units with the proceeds to exercise the stock purchase contracts. The initial stock purchase date is
expected to be August 15, 2008, but could be deferred for quarterly periods until February 15, 2009, and the subsequent stock purchase
date is expected to be February 15, 2009, but could be deferred for quarterly periods until February 15, 2010. At the remarketing date, the
remarketing agent will have the ability to reset the interest rate on the trust preferred securities to generate sufficient remarketing proceeds
to satisfy the common equity unit holder’s obligation under the stock purchase contract, subject to a reset cap for each of the first two
attempted remarketings of each series. The interest rate on the supporting junior subordinated debt securities issued by the Holding
Company will be reset at a commensurate rate. If the initial remarketing is unsuccessful, the remarketing agent will attempt to remarket the
trust preferred securities, as necessary, in subsequent quarters through February 15, 2009 for the Series A trust preferred securities and
through February 15, 2010 for the Series B trust preferred securities. The final attempt at remarketing will not be subject to the reset cap. If
all remarketing attempts are unsuccessful, the Holding Company has the right, as a secured party, to apply the liquidation amount on the
trust preferred securities to the common equity unit holders obligation under the stock purchase contract and to deliver to the common
equity unit holder a junior subordinated debt security payable on August 15, 2010 at an annual rate of 4.82% and 4.91% on the Series A
and Series B trust preferred securities, respectively, in payment of any accrued and unpaid distributions.
Each stock purchase contract requires (i) the Holding Company to pay the holder of the common equity unit quarterly contract
payments on the stock purchase contracts at the annual rate of 1.510% on the stated amount of $25 per stock purchase contract until the
initial stock purchase date and at the annual rate of 1.465% on the remaining stated amount of $12.50 per stock purchase contract
thereafter; and (ii) the holder of the common equity unit to purchase, and the Holding Company to sell, for $12.50, on each of the initial
stock purchase date and the subsequent stock purchase date, a number of newly issued or treasury shares of the Holding Company’s
common stock, par value $0.01 per share, equal to the applicable settlement rate. The settlement rate at the respective stock purchase
date will be calculated based on the closing price of the common stock during a specified 20-day period immediately preceding the
applicable stock purchase date. Accordingly, upon settlement in the aggregate, the Holding Company will receive proceeds of $2,070 mil-
lion and issue between 39.0 million and 47.8 million shares of its common stock. The stock purchase contract may be exercised at the
option of the holder at any time prior to the settlement date. However, upon early settlement, the holder will receive the minimum settlement
rate.
54 MetLife, Inc.
Credit Facilities. In June 2007, the Holding Company and MetLife Funding entered into a $3.0 billion credit agreement with various
financial institutions, the proceeds of which are available to be used for general corporate purposes, to support their commercial paper
programs and for the issuance of letters of credit. All borrowings under the credit agreement must be repaid by June 2012, except that
letters of credit outstanding upon termination may remain outstanding until June 2013. The borrowers and the lenders under this facility
may agree to extend the term of all or part of the facility to no later than June 2014, except that letters of credit outstanding upon
termination may remain outstanding until June 2015. The $1.5 billion credit agreement, with an April 2009 expiration, and the $1.5 billion
credit agreement, with an April 2010 expiration, were both terminated in June 2007 and replaced by the aforementioned facility.
At December 31, 2007, $1.5 billion of letters of credit have been issued under these unsecured credit facilities on behalf of the Holding
Company.
Committed Facilities. Information on committed facilities as of December 31, 2007 is as follows:
Account Party/Borrower(s) Expiration Capacity Drawdowns
Letter of
Credit
Issuances
Unused
Commitments
Maturity
(Years)
(In millions)
Exeter Reassurance Company Ltd., MetLife,
Inc., & Missouri Re . . . . . . . . . . . . . . . . . . June 2016 (1) $ 500 $ — $ 490 $ 10 8
Exeter Reassurance Company Ltd. . . . . . . . . . December 2027 (2) 650 — 410 240 20
MetLife Reinsurance Company of South
Carolina & MetLife, Inc. . . . . . . . . . . . . . . . June 2037 (3) 3,500 2,382 — 1,118 30
MetLife Reinsurance Company of Vermont &
MetLife, Inc. . . . . . . . . . . . . . . . . . . . . . . December 2037 (2),(4) 2,896 — 1,235 1,661 30
Total . . . . . . . . . . . . . . . . . . . . . . . . . . . . $7,546 $2,382 $2,135 $3,029
(1) Letters of credit and replacements or renewals thereof issued under this facility of $280 million, $10 million and $200 million are set to
expire no later than December 2015, March 2016 and June 2016, respectively.
(2) The Holding Company is a guarantor under this agreement.
(3) In May 2007, MRSC terminated the $2.0 billion amended and restated five-year letter of credit and reimbursement agreement entered
into among the Holding Company, MRSC and various institutional lenders on April 25, 2005. In its place the Company entered into a
30-year collateral financing arrangement as described under “— Liquidity and Capital Resources — The Company — Liquidity
Sources — Debt Issuances”, which may be extended by agreement of the Holding Company and the financial institution on each
anniversary of the closing of the facility for an additional one-year period. At December 31, 2007, $2.4 billion had been drawn upon
under the collateral financing arrangement.
(4) In December 2007, Exeter terminated four letters of credit, with expirations from March 2025 through December 2026, that were
issued under a letter of credit facility with an unaffiliated financial institution in an aggregate amount of $1.7 billion. The letters of credit
had served as collateral for Exeter’s obligations under a reinsurance agreement that was recaptured by MLI-USA in December 2007.
MLI-USA immediately thereafter entered into a new reinsurance agreement with MRV. To collateralize its reinsurance obligations, MRV
and the Holding Company entered into a 30-year, $2.9 billion letter of credit facility with an unaffiliated financial institution.
Letters of Credit. At December 31, 2007, the Holding Company had $1.5 billion in outstanding letters of credit, all of which are
associated with the aforementioned credit facilities, from various financial institutions. As commitments associated with letters of credit and
financing arrangements may expire unused, these amounts do not necessarily reflect the Holding Company’s actual future cash funding
requirements.
Liquidity Uses
The primary uses of liquidity of the Holding Company include debt service, cash dividends on common and preferred stock, capital
contributions to subsidiaries, payment of general operating expenses, acquisitions and the repurchase of the Holding Company’s common
stock.
Dividends. The table below presents declaration, record and payment dates, as well as per share and aggregate dividend amounts,
for the common stock:
Declaration Date Record Date Payment Date Per Share Aggregate
Dividend
(In millions, except
per share data)
October 23, 2007 . . . . . . . . . . . . . . . . . . . . . . . November 6, 2007 December 14, 2007 $0.74 $541
October 24, 2006 . . . . . . . . . . . . . . . . . . . . . . . November 6, 2006 December 15, 2006 $0.59 $450
October 25, 2005 . . . . . . . . . . . . . . . . . . . . . . . November 7, 2005 December 15, 2005 $0.52 $394
Future common stock dividend decisions will be determined by the Holding Company’s Board of Directors after taking into consid-
eration factors such as the Company’s current earnings, expected medium- and long-term earnings, financial condition, regulatory capital
position, and applicable governmental regulations and policies. Furthermore, the payment of dividends and other distributions to the
Holding Company by its insurance subsidiaries is regulated by insurance laws and regulations.
55MetLife, Inc.
Information on the declaration, record and payment dates, as well as per share and aggregate dividend amounts, for the Preferred
Shares is as follows:
Declaration Date Record Date Payment Date
Series A
Per Share
Series A
Aggregate
Series B
Per Share
Series B
Aggregate
Dividend
(In millions, except per share data)
November 15, 2007 . . . . . . . . . . November 30, 2007 December 17, 2007 $0.4230476 $11 $0.4062500 $24
August 15, 2007 . . . . . . . . . . . . August 31, 2007 September 17, 2007 $0.4063333 $10 $0.4062500 $24
May 15, 2007 . . . . . . . . . . . . . . May 31, 2007 June 15, 2007 $0.4060062 $10 $0.4062500 $24
March 5, 2007 . . . . . . . . . . . . . February 28, 2007 March 15, 2007 $0.3975000 $10 $0.4062500 $24
$41 $96
November 15, 2006 . . . . . . . . . . November 30, 2006 December 15, 2006 $0.4038125 $10 $0.4062500 $24
August 15, 2006 . . . . . . . . . . . . August 31, 2006 September 15, 2006 $0.4043771 $10 $0.4062500 $24
May 16, 2006 . . . . . . . . . . . . . . May 31, 2006 June 15, 2006 $0.3775833 $ 9 $0.4062500 $24
March 6, 2006 . . . . . . . . . . . . . February 28, 2006 March 15, 2006 $0.3432031 $ 9 $0.4062500 $24
$38 $96
November 15, 2005 . . . . . . . . . . November 30, 2005 December 15, 2005 $0.3077569 $ 8 $0.4062500 $24
August 22, 2005 . . . . . . . . . . . . August 31, 2005 September 15, 2005 $0.2865690 $ 7 $0.4017361 $24
$15 $48
See “— Subsequent Events.”
Affiliated Capital Transactions. During the years ended December 31, 2007 and 2006, the Holding Company invested an aggregate of
$2.8 billion and $1.8 billion, respectively, in various affiliates.
In December 2005, RGA repurchased 1.6 million shares of its outstanding common stock at an aggregate price of $76 million under an
accelerated share repurchase agreement with a major bank. The bank borrowed the stock sold to RGA from third parties and purchased
the shares in the open market over the subsequent few months to return to the lenders. RGA would either pay or receive an amount based
on the actual amount paid by the bank to purchase the shares. These repurchases resulted in an increase in the Company’s ownership
percentage of RGA to approximately 53% at December 31, 2005 from approximately 52% at December 31, 2004. In February 2006, the
final purchase price was determined, resulting in a cash settlement substantially equal to the aggregate cost. RGA recorded the initial
repurchase of shares as treasury stock and recorded the amount received as an adjustment to the cost of the treasury stock. At
December 31, 2007, the Company’s ownership was approximately 52% of RGA.
The Holding Company lends funds, as necessary, to its affiliates, some of which are regulated, to meet their capital requirements. Such
loans are included in loans to affiliates and consisted of the following at:
Affiliate
Interest
Rate Maturity Date 2007 2006
December 31,
(In millions)
MLIC . . . . . . . . . . . . . . . . . . . . . . . . . . . . . 3-month LIBOR + 1.15% December 31, 2009 $ 700 $ —
MLIC . . . . . . . . . . . . . . . . . . . . . . . . . . . . . 7.13% December 15, 2032 400 400
MLIC . . . . . . . . . . . . . . . . . . . . . . . . . . . . . 7.13% January 15, 2033 100 100
MLIC . . . . . . . . . . . . . . . . . . . . . . . . . . . . . 5.00% December 31, 2007 — 800
MetLife Investors USA Insurance Company . . . . . 7.35% April 1, 2035 400 400
Total . . . . . . . . . . . . . . . . . . . . . . . . . . . . $1,600 $1,700
Debt Repayments. The Holding Company repaid a $500 million 5.25% senior note which matured in December 2006 and a
$1,006 million 3.911% senior note which matured in May 2005.
Share Repurchase. In October 2004, the Holding Company’s Board of Directors authorized a $1 billion common stock repurchase
program. In February 2007, the Holding Company’s Board of Directors authorized an additional $1 billion common stock repurchase
program. In September 2007, the Holding Company’s Board of Directors authorized an additional $1 billion common stock repurchase
program which began after the completion of the $1 billion common stock repurchase program authorized in February 2007. In January
2008, the Holding Company’s Board of Directors authorized an additional $1 billion common stock repurchase program, which began after
the completion of the September 2007 program. (See “— Subsequent Events”). Under these authorizations, the Holding Company may
purchase its common stock from the MetLife Policyholder Trust, in the open market (including pursuant to the terms of a pre-set trading
plan meeting the requirements of Rule 10b5-1 under the Exchange Act and in privately negotiated transactions.
The Holding Company has entered into the following accelerated common stock repurchase agreements:
• In December 2007, the Holding Company entered into an accelerated common stock repurchase agreement with a major bank.
Under the terms of the agreement, the Holding Company paid the bank $450 million in cash in January 2008 in exchange for
6.6 million shares of its outstanding common stock that the bank borrowed from third parties. Also, in January 2008, the bank
delivered 1.1 million additional shares of Holding Company’s common stock to the Holding Company resulting in a total of 7.7 million
shares being repurchased under the agreement. At December 31, 2007, the Holding Company recorded the obligation to pay
$450 million to the bank as a reduction of additional paid-in capital. Upon settlement with the bank, the Holding Company increased
additional paid-in capital and reduced treasury stock.
56 MetLife, Inc.
• In November 2007, the Holding Company repurchased 11.6 million shares of its outstanding common stock at an initial cost of
$750 million under an accelerated common stock repurchase agreement with a major bank. The bank borrowed the stock sold to the
Holding Company from third parties and purchased the common stock in the open market to return to such third parties. Also, in
November 2007, the Holding Company received a cash adjustment of $19 million based on the trading price of the common stock
during the repurchase period, for a final purchase price of $731 million. The Holding Company recorded the shares initially
repurchased as treasury stock and recorded the amount received as an adjustment to the cost of the treasury stock.
• In March 2007, the Holding Company repurchased 11.9 million shares of its outstanding common stock at an aggregate cost of
$750 million under an accelerated common stock repurchase agreement with a major bank. The bank borrowed the common stock
sold to the Holding Company from third parties and purchased common stock in the open market to return to such third parties. In
June 2007, the Holding Company paid a cash adjustment of $17 million for a final purchase price of $767 million. The Holding
Company recorded the shares initially repurchased as treasury stock and recorded the amount paid as an adjustment to the cost of
the treasury stock.
• In December 2006, the Holding Company repurchased 4.0 million shares of its outstanding common stock at an aggregate cost of
$232 million under an accelerated common stock repurchase agreement with a major bank. The bank borrowed the common stock
sold to the Holding Company from third parties and purchased the common stock in the open market to return to such third parties. In
February 2007, the Holding Company paid a cash adjustment of $8 million for a final purchase price of $240 million. The Holding
Company recorded the shares initially repurchased as treasury stock and recorded the amount paid as an adjustment to the cost of
the treasury stock.
• In December 2004, the Holding Company repurchased 7.3 million shares of its outstanding common stock at an aggregate cost of
$300 million under an accelerated common stock repurchase agreement with a major bank. The bank borrowed the stock sold to the
Holding Company from third parties and purchased the common stock in the open market to return to such third parties. In April
2005, the Holding Company received a cash adjustment of $7 million based on the actual amount paid by the bank to purchase the
common stock, for a final purchase price of $293 million. The Holding Company recorded the shares initially repurchased as treasury
stock and recorded the amount received as an adjustment to the cost of the treasury stock.
The Company also repurchased 3.1 million and 4.6 million shares through open market purchases for $200 million and $268 million,
respectively, during the years ended December 31, 2007 and 2006, respectively.
Cumulatively, the Company repurchased 26.6 million and 8.6 million shares of its common stock for $1.7 billion and $500 million during
the years ended December 31, 2007 and 2006, respectively. The Company did not repurchase any shares of its common stock during the
year ended December 31, 2005. During the years ended December 31, 2007, 2006 and 2005, 3.9 million, 3.1 million and 25.0 million
shares of common stock were issued from treasury stock for $172 million, $102 million and $819 million, respectively, of which 22.4 million
shares with a market value of $1 billion were issued in connection with the acquisition of Travelers of July 1, 2005.
At December 31, 2006, the Company had $216 million remaining on the October 2004 common stock repurchase program which was
subsequently reduced by $8 million to $208 million after the February 2007 cash adjustment to the December 2006 accelerated common
stock repurchase agreement. The February 2007 stock repurchase program authorization was fully utilized during 2007. At December 31,
2007, $511 million remained on the Company’s September 2007 common stock repurchase program. The $511 million remaining on the
September 2007 common stock repurchase program was reduced by $450 million to $61 million upon settlement of the accelerated stock
repurchase agreement executed during December 2007 but for which no settlement occurred until January 2008. Subsequent to the
January 2008 authorization, the amount remaining under these repurchase programs was $1,061 million. After execution of the
accelerated stock repurchase agreement in February 2008 and certain open market purchases as more fully described in “— Subsequent
Events”, the Company’s remaining authorization is $261 million.
Future common stock repurchases will be dependent upon several factors, including the Company’s capital position, its financial
strength and credit ratings, general market conditions and the price of MetLife, Inc.’s common stock.
See “— Subsequent Events” for further information relating to common stock repurchases subsequent to December 31, 2007.
Support Agreements. The Holding Company is party to various capital support commitments with certain of its subsidiaries and a
corporation in which it owns 50% of the equity. Under these arrangements, the Holding Company has agreed to cause each such entity to
meet specified capital and surplus levels. Management does not anticipate that these arrangements will place any significant demands
upon the Holding Company’s liquidity resources.
Based on management’s analysis and comparison of its current and future cash inflows from the dividends it receives from subsidiaries
that are permitted to be paid without prior insurance regulatory approval, its portfolio of liquid assets, anticipated securities issuances and
other anticipated cash flows, management believes there will be sufficient liquidity to enable the Holding Company to make payments on
debt, make cash dividend payments on its common and preferred stock, contribute capital to its subsidiaries, pay all operating expenses
and meet its cash needs.
Subsequent Events
Dividends
On February 19, 2008, the Company’s Board of Directors announced dividends of $0.3785745 per share, for a total of $9 million, on its
Series A preferred shares, and $0.4062500 per share, for a total of $24 million, on its Series B preferred shares, subject to the final
confirmation that it has met the financial tests specified in the Series A and Series B preferred shares, which the Company anticipates will
be made on or about March 5, 2008, the earliest date permitted in accordance with the terms of the securities. Both dividends will be
payable March 17, 2008 to shareholders of record as of February 29, 2008.
Acquisitions
On February 1, 2008, the Company announced its completion of the acquisition of SafeGuard Health Enterprises, Inc. (“Safeguard”) for
approximately $190 million. Safeguard is primarily involved in providing dental and vision benefit plans, including health maintenance and
preferred provider organization plan designs and administrative services.
57MetLife, Inc.
On January 2, 2008, the Company completed its acquisition of AFORE Actinver, S.A. de C.V. (“Actinver”) for approximately $125 million.
Actinver manages retirement accounts for approximately 1.1 million individuals in Mexico.
Stock Repurchases
On January 15, 2008, the Company’s Board of Directors authorized a $1 billion common stock repurchase program, which began after
the completion of an earlier $1 billion authorization that was announced in September 2007.
As previously described, in December 2007, the Company entered into an accelerated common stock repurchase agreement with a
major bank. Under the terms of the agreement, the Company paid the bank $450 million in cash in January 2008 in exchange for 6.6 million
shares of the Company’s outstanding common stock that the bank borrowed from third parties. Also, in January 2008, the bank delivered
1.1 million additional shares of the Company’s common stock to the Company resulting in a total of 7.7 million shares being repurchased
under the agreement. Upon settlement with the bank, the Company increased additional paid-in capital and reduced treasury stock.
In February 2008, the Company entered into an accelerated common stock repurchase agreement with a major bank. Under the
agreement, the Company paid the bank $711 million in cash and the bank delivered an initial amount of 11.2 million shares of the
Company’s outstanding common stock that the bank borrowed from third parties. Final settlement of the agreement is scheduled to take
place during the first half of 2008. The final number of shares the Company is repurchasing under the terms of the agreement and the
timing of the final settlement will depend on, among other things, prevailing market conditions and the market prices of the common stock
during the repurchase period. The Company recorded the consideration paid as a reduction to stockholders’ equity.
From January 1, 2008 to February 25, 2008, the Company also repurchased 1.6 million of its shares through open market purchases
for $89 million.
Off-Balance Sheet Arrangements
Commitments to Fund Partnership Investments
The Company makes commitments to fund partnership investments in the normal course of business for the purpose of enhancing the
Company’s total return on its investment portfolio. The amounts of these unfunded commitments were $5.3 billion and $3.0 billion at
December 31, 2007 and 2006, respectively. The Company anticipates that these amounts will be invested in partnerships over the next
five years. There are no other obligations or liabilities arising from such arrangements that are reasonably likely to become material.
Mortgage Loan Commitments
The Company commits to lend funds under mortgage loan commitments. The amounts of these mortgage loan commitments were
$4.0 billion at both December 31, 2007 and 2006. The purpose of these loans is to enhance the Company’s total return on its investment
portfolio. There are no other obligations or liabilities arising from such arrangements that are reasonably likely to become material.
Commitments to Fund Bank Credit Facilities, Bridge Loans and Private Corporate Bond Investments
The Company commits to lend funds under bank credit facilities, bridge loans and private corporate bond investments. The amounts of
these unfunded commitments were $1.2 billion and $1.9 billion at December 31, 2007 and 2006, respectively. The purpose of these
commitments and any related fundings is to enhance the Company’s total return on its investment portfolio. There are no other obligations
or liabilities arising from such arrangements that are reasonably likely to become material.
Lease Commitments
The Company, as lessee, has entered into various lease and sublease agreements for office space, data processing and other
equipment. The Company’s commitments under such lease agreements are included within the contractual obligations table. See
“— Liquidity and Capital Resources — The Company — Liquidity Uses — Investment and Other.”
Credit Facilities and Letters of Credit
The Company maintains committed and unsecured credit facilities and letters of credit with various financial institutions. See
“— Liquidity and Capital Resources — The Company — Liquidity Sources — Credit Facilities” and “— Letters of Credit” for further
descriptions of such arrangements.
Share-Based Arrangements
In connection with the issuance of common equity units, the Holding Company issued forward stock purchase contracts under which
the Holding Company will issue, in 2008 and 2009, between 39.0 and 47.8 million shares of its common stock, depending upon whether
the share price is greater than $43.35 and less than $53.10. See “— Liquidity and Capital Resources — The Holding Company — Liquidity
Sources — Common Equity Units.”
Guarantees
In the normal course of its business, the Company has provided certain indemnities, guarantees and commitments to third parties
pursuant to which it may be required to make payments now or in the future. In the context of acquisition, disposition, investment and other
transactions, the Company has provided indemnities and guarantees, including those related to tax, environmental and other specific
liabilities, and other indemnities and guarantees that are triggered by, among other things, breaches of representations, warranties or
covenants provided by the Company. In addition, in the normal course of business, the Company provides indemnifications to counter-
parties in contracts with triggers similar to the foregoing, as well as for certain other liabilities, such as third party lawsuits. These
obligations are often subject to time limitations that vary in duration, including contractual limitations and those that arise by operation of
law, such as applicable statutes of limitation. In some cases, the maximum potential obligation under the indemnities and guarantees is
subject to a contractual limitation ranging from less than $1 million to $800 million, with a cumulative maximum of $2.3 billion, while in other
cases such limitations are not specified or applicable. Since certain of these obligations are not subject to limitations, the Company does
not believe that it is possible to determine the maximum potential amount that could become due under these guarantees in the future.
In addition, the Company indemnifies its directors and officers as provided in its charters and by-laws. Also, the Company indemnifies
its agents for liabilities incurred as a result of their representation of the Company’s interests. Since these indemnities are generally not
subject to limitation with respect to duration or amount, the Company does not believe that it is possible to determine the maximum
potential amount that could become due under these indemnities in the future.
58 MetLife, Inc.
The Company has also guaranteed minimum investment returns on certain international retirement funds in accordance with local laws.
Since these guarantees are not subject to limitation with respect to duration or amount, the Company does not believe that it is possible to
determine the maximum potential amount that could become due under these guarantees in the future.
During the year ended December 31, 2007, the Company recorded a $1 million liability with respect to a guarantee previously provided
to MLII, a former subsidiary. The Company’s recorded liabilities at December 31, 2007 and 2006 for indemnities, guarantees and
commitments were $6 million and $5 million, respectively.
In connection with synthetically created investment transactions, the Company writes credit default swap obligations that generally
require payment of principal outstanding due in exchange for the referenced credit obligation. If a credit event, as defined by the contract,
occurs the Company’s maximum amount at risk, assuming the value of the referenced credits becomes worthless, was $1.7 billion at
December 31, 2007. The credit default swaps expire at various times during the next ten years.
Other Commitments
MetLife Insurance Company of Connecticut (“MICC”) is a member of the Federal Home Loan Bank of Boston (the “FHLB of Boston”) and
holds $70 million of common stock of the FHLB of Boston at both December 31, 2007 and 2006, which is included in equity securities.
MICC has also entered into funding agreements with the FHLB of Boston whereby MICC has issued such funding agreements in exchange
for cash and for which the FHLB of Boston has been granted a blanket lien on certain MICC assets, including residential mortgage-backed
securities, to collateralize MICC’s obligations under the funding agreements. MICC maintains control over these pledged assets, and may
use, commingle, encumber or dispose of any portion of the collateral as long as there is no event of default and the remaining qualified
collateral is sufficient to satisfy the collateral maintenance level. Upon any event of default by MICC, the FHLB of Boston’s recovery on the
collateral is limited to the amount of MICC’s liability to the FHLB of Boston. The amount of the Company’s liability for funding agreements
with the FHLB of Boston was $726 million and $926 million at December 31, 2007 and 2006, respectively, which is included in policyholder
account balances. The advances on these funding agreements are collateralized by residential mortgage-backed securities with fair values
of $901 million and $1.1 billion at December 31, 2007 and 2006, respectively.
MLIC is a member of the FHLB of NY and holds $339 million and $136 million of common stock of the FHLB of NY at December 31, 2007
and 2006, respectively, which is included in equity securities. MLIC has also entered into funding agreements with the FHLB of NY whereby
MLIC has issued such funding agreements in exchange for cash and for which the FHLB of NY has been granted a lien on certain MLIC
assets, including residential mortgage-backed securities to collateralize MLIC’s obligations under the funding agreements. MLIC maintains
control over these pledged assets, and may use, commingle, encumber or dispose of any portion of the collateral as long as there is no
event of default and the remaining qualified collateral is sufficient to satisfy the collateral maintenance level. Upon any event of default by
MLIC, the FHLB of NY’s recovery on the collateral is limited to the amount of MLIC’s liability to the FHLB of NY. The amount of the
Company’s liability for funding agreements with the FHLB of NY was $4.6 billion at December 31, 2007, which is included in policyholder
account balances. The advances on these agreements are collateralized by residential mortgage-backed securities with fair values of
$4.8 billion at December 31, 2007. MLIC did not have any funding agreements with the FHLB of NY at December 31, 2006.
MetLife Bank is a member of the FHLB of NY and holds $64 million and $54 million of common stock of the FHLB of NY at December 31,
2007 and 2006, respectively, which is included in equity securities. MetLife Bank has also entered into repurchase agreements with the
FHLB of NY whereby MetLife Bank has issued repurchase agreements in exchange for cash and for which the FHLB of NY has been
granted a blanket lien on MetLife Bank’s residential mortgages and mortgage-backed securities to collateralize MetLife Bank’s obligations
under the repurchase agreements. MetLife Bank maintains control over these pledged assets, and may use, commingle, encumber or
dispose of any portion of the collateral as long as there is no event of default and the remaining qualified collateral is sufficient to satisfy the
collateral maintenance level. The repurchase agreements and the related security agreement represented by this blanket lien provide that
upon any event of default by MetLife Bank, the FHLB of NY’s recovery is limited to the amount of MetLife Bank’s liability under the
outstanding repurchase agreements. The amount of the Company’s liability for repurchase agreements with the FHLB of NY was $1.2 billion
and $998 million at December 31, 2007 and 2006, respectively, which is included in long-term debt. The advances on these repurchase
agreements are collateralized by residential mortgage-backed securities and residential mortgage loans with fair values of $1.3 billion at
both December 31, 2007 and 2006.
Collateral for Securities Lending
The Company has non-cash collateral for securities lending on deposit from customers, which cannot be sold or repledged, and which
has not been recorded on its consolidated balance sheets. The amount of this collateral was $40 million and $100 million at December 31,
2007 and 2006, respectively.
Pensions and Other Postretirement Benefit Plans
Description of Plans
Plan Description Overview
The Subsidiaries sponsor and/or administer various qualified and non-qualified defined benefit pension plans and other postretirement
employee benefit plans covering employees and sales representatives who meet specified eligibility requirements. Pension benefits are
provided utilizing either a traditional formula or cash balance formula. The traditional formula provides benefits based upon years of credited
service and either final average or career average earnings. The cash balance formula utilizes hypothetical or notional accounts, which
credit participants with benefits equal to a percentage of eligible pay, as well as earnings credits, determined annually based upon the
average annual rate of interest on 30-year U.S. Treasury securities, for each account balance. As of December 31, 2007, virtually all of the
Subsidiaries’ obligations have been calculated using the traditional formula. The non-qualified pension plans provide supplemental
benefits, in excess of amounts permitted by governmental agencies, to certain executive level employees.
The Subsidiaries also provide certain postemployment benefits and certain postretirement medical and life insurance benefits for retired
employees. Employees of the Subsidiaries who were hired prior to 2003 (or, in certain cases, rehired during or after 2003) and meet age
and service criteria while working for a covered subsidiary, may become eligible for these other postretirement benefits, at various levels, in
accordance with the applicable plans. Virtually all retirees, or their beneficiaries, contribute a portion of the total cost of postretirement
medical benefits. Employees hired after 2003 are not eligible for any employer subsidy for postretirement medical benefits.
59MetLife, Inc.
Financial Summary
Statement of Financial Accounting Standards (“SFAS”) No. 87, Employers’ Accounting for Pensions (“SFAS 87”), as amended,
establishes the accounting for pension plan obligations. Under SFAS 87, the projected pension benefit obligation (“PBO”) is defined
as the actuarially calculated present value of vested and non-vested pension benefits accrued based on future salary levels. The
accumulated pension benefit obligation (“ABO”) is the actuarial present value of vested and non-vested pension benefits accrued based on
current salary levels. The PBO and ABO of the pension plans are set forth in the following section.
Prior to December 31, 2006, SFAS 87 also required the recognition of an additional minimum pension liability and an intangible asset
(limited to unrecognized prior service cost) if the market value of pension plan assets was less than the ABO at the measurement date. The
excess of the additional minimum pension liability over the allowable intangible asset was charged, net of taxes, to accumulated other
comprehensive income. The Company’s additional minimum pension liability was $78 million, and the intangible asset was $12 million, at
December 31, 2005. The excess of the additional minimum pension liability over the intangible asset of $66 million ($41 million, net of
income tax) was recorded as a reduction of accumulated other comprehensive income. At December 31, 2006, the Company’s additional
minimum pension liability was $92 million. The additional minimum pension liability of $59 million, net of income tax of $33 million, was
recorded as a reduction of accumulated other comprehensive income.
SFAS No. 106, Employers Accounting for Postretirement Benefits Other than Pensions, as amended, (“SFAS 106”), establishes the
accounting for expected postretirement plan benefit obligations (“EPBO”) which represents the actuarial present value of all postretirement
benefits expected to be paid after retirement to employees and their dependents. Unlike the PBO for pensions, the EPBO is not recorded in
the financial statements but is used in measuring the periodic expense. The accumulated postretirement plan benefit obligation (“APBO”)
represents the actuarial present value of future postretirement benefits attributed to employee services rendered through a particular date.
The APBO is recorded in the financial statements and is set forth below.
As described more fully in “— Adoption of New Accounting Pronouncements”, the Company adopted SFAS No. 158, Employers’
Accounting for Defined Benefit Pension and Other Postretirement Plans — an amendment of FASB Statements No. 87, 88, 106, and
SFAS No. 132(r) (“SFAS 158”), effective December 31, 2006. Upon adoption, the Company was required to recognize in the consolidated
balance sheet the funded status of defined benefit pension and other postretirement plans. Funded status is measured as the difference
between the fair value of plan assets and the benefit obligation, which is the PBO for pension plans and the APBO for other postretirement
plans. The change to recognize funded status eliminated the additional minimum pension liability provisions of SFAS 87. In addition, the
Company recognized as an adjustment to accumulated other comprehensive income, net of income tax, those amounts of actuarial gains
and losses, prior service costs and credits, and the remaining net transition asset or obligation that had not yet been included in net
periodic benefit cost at the date of adoption. The adoption of SFAS 158 resulted in a reduction of $744 million, net of income tax, to
accumulated other comprehensive income, which is included as a component of total consolidated stockholders’ equity. The following
table summarizes the adjustments to the December 31, 2006 consolidated balance sheet in order to effect the adoption of SFAS 158.
Balance Sheet Caption
Pre
SFAS 158
Adjustments
Additional
Minimum
Pension
Liability
Adjustment
Adoption of
SFAS 158
Adjustment
Post
SFAS 158
Adjustments
December 31, 2006
(In millions)
Other assets: Prepaid pension benefit cost . . . . . . . . . . . . . . . . $1,937 $ — $ (993) $ 944
Other assets: Intangible asset . . . . . . . . . . . . . . . . . . . . . . . . $ 12 $(12) $ — $ —
Other liabilities: Accrued pension benefit cost . . . . . . . . . . . . . . $ (505) $(14) $ (79) $ (598)
Other liabilities: Accrued other postretirement benefit cost . . . . . . $ (802) $ — $ (99) $ (901)
Accumulated other comprehensive income, before income tax:
Defined benefit plans . . . . . . . . . . . . . . . . . . . . . . . . . . . . . $ (66) $(26) $(1,171) $(1,263)
Minority interest. . . . . . . . . . . . . . . . . . . . . . . . . . . . . . . . . . $ — $ 8
Deferred income tax . . . . . . . . . . . . . . . . . . . . . . . . . . . . . . . $ 8 $ 419
Accumulated other comprehensive income, net of income tax:
Defined benefit plans . . . . . . . . . . . . . . . . . . . . . . . . . . . . . $ (41) $(18) $ (744) $ (803)
A December 31 measurement date is used for all the Company’s defined benefit pension and other postretirement benefit plans.
The benefit obligations and funded status of the Subsidiaries’ defined benefit pension and other postretirement benefit plans, as
determined in accordance with the applicable provisions described above, were as follows:
2007 2006 2007 2006
Pension Benefits
Other
Postretirement
Benefits
December 31,
(In millions)
Benefit obligation at end of year . . . . . . . . . . . . . . . . . . . . . . . . . . . . . . . . $5,775 $5,959 $1,610 $2,073
Fair value of plan assets at end of year . . . . . . . . . . . . . . . . . . . . . . . . . . . . 6,550 6,305 1,183 1,172
Funded status at end of year . . . . . . . . . . . . . . . . . . . . . . . . . . . . . . . . . . $ 775 $ 346 $ (427) $ (901)
Amounts recognized in the consolidated balance sheet consist of:
Other assets . . . . . . . . . . . . . . . . . . . . . . . . . . . . . . . . . . . . . . . . . . . $1,393 $ 944 $ — $ —
Other liabilities . . . . . . . . . . . . . . . . . . . . . . . . . . . . . . . . . . . . . . . . . . (618) (598) (427) (901)
Net amount recognized . . . . . . . . . . . . . . . . . . . . . . . . . . . . . . . . . . . . $ 775 $ 346 $ (427) $ (901)
60 MetLife, Inc.
2007 2006 2007 2006
Pension Benefits
Other
Postretirement
Benefits
December 31,
(In millions)
Accumulated other comprehensive (income) loss:
Net actuarial (gains) losses . . . . . . . . . . . . . . . . . . . . . . . . . . . . . . . . . . $ 623 $1,123 $ (112) $ 328
Prior service cost (credit) . . . . . . . . . . . . . . . . . . . . . . . . . . . . . . . . . . . 64 41 (193) (230)
Net asset at transition . . . . . . . . . . . . . . . . . . . . . . . . . . . . . . . . . . . . . — — — 1
687 1,164 (305) 99
Deferred income tax and minority interest. . . . . . . . . . . . . . . . . . . . . . . . . (251) (423) 109 (37)
$ 436 $ 741 $ (196) $ 62
The aggregate projected benefit obligation and aggregate fair value of plan assets for the pension plans were as follows:
2007 2006 2007 2006 2007 2006
Qualified Plans
Non-Qualified
Plans Total
December 31,
(In millions)
Aggregate fair value of plan assets (principally Company contracts) . . . . . . $6,550 $6,305 $ — $ — $6,550 $6,305
Aggregate projected benefit obligation . . . . . . . . . . . . . . . . . . . . . . . . . 5,174 5,381 601 578 5,775 5,959
Over (under) funded . . . . . . . . . . . . . . . . . . . . . . . . . . . . . . . . . . . . . $1,376 $ 924 $(601) $(578) $ 775 $ 346
The accumulated benefit obligation for all defined benefit pension plans was $5,348 million and $5,505 million at December 31, 2007
and 2006, respectively.
Information for pension plans with an accumulated benefit obligation in excess of plan assets is as follows:
2007 2006
December 31,
(In millions)
Projected benefit obligation . . . . . . . . . . . . . . . . . . . . . . . . . . . . . . . . . . . . . . . . . . . . . . . . . . . $616 $594
Accumulated benefit obligation . . . . . . . . . . . . . . . . . . . . . . . . . . . . . . . . . . . . . . . . . . . . . . . . . $533 $501
Fair value of plan assets . . . . . . . . . . . . . . . . . . . . . . . . . . . . . . . . . . . . . . . . . . . . . . . . . . . . . $ — $ —
Information for pension and other postretirement plans with a projected benefit obligation in excess of plan assets is as follows:
2007 2006 2007 2006
Pension Benefits
Other
Postretirement
Benefits
December 31,
(In millions)
Projected benefit obligation . . . . . . . . . . . . . . . . . . . . . . . . . . . . . . . . . . . $ 646 $ 623 $1,610 $2,073
Fair value of plan assets . . . . . . . . . . . . . . . . . . . . . . . . . . . . . . . . . . . . . $ 28 $ 25 $1,183 $1,172
Pension and Other Postretirement Benefit Plan Obligations
Pension Plan Obligations
Obligations, both PBO and ABO, of the defined benefit pension plans are determined using a variety of actuarial assumptions, from
which actual results may vary. Some of the more significant of these assumptions include the discount rate used to determine the present
value of future benefit payments, the expected rate of compensation increases and average expected retirement age.
Assumptions used in determining pension plan obligations were as follows:
2007 2006
December 31,
Weighted average discount rate . . . . . . . . . . . . . . . . . . . . . . . . . . . . . . . . . . . . . . . . . . . 6.65% 6.00%
Rate of compensation increase . . . . . . . . . . . . . . . . . . . . . . . . . . . . . . . . . . . . . . . . . . . 3.5% - 8% 3% - 8%
Average expected retirement age . . . . . . . . . . . . . . . . . . . . . . . . . . . . . . . . . . . . . . . . . . 63 61
The discount rate is determined annually based on the yield, measured on a yield to worst basis, of a hypothetical portfolio constructed
of high-quality debt instruments available on the valuation date, which would provide the necessary future cash flows to pay the aggregate
PBO when due. The yield of this hypothetical portfolio, constructed of bonds rated AA or better by Moody’s Investors Services (“Moody’s)
resulted in a discount rate of approximately 6.65% and 6.00% for the defined pension plans as of December 31, 2007 and 2006,
respectively.
A decrease (increase) in the discount rate increases (decreases) the PBO. This increase (decrease) to the PBO is amortized into
earnings as an actuarial loss (gain). Based on the December 31, 2007 PBO, a 25 basis point decrease (increase) in the discount rate would
result in an increase (decrease) in the PBO of $159 million.
61MetLife, Inc.
At the end of 2007, total net actuarial losses were $623 million as compared to $1,123 million in 2006. In 2007, the majority of the
reduction in the actuarial losses is due to the increase in the discount rate to 6.65% in 2007 from 6.00% in 2006. These losses will be
amortized on a straight-line basis over the average remaining service period of active employees expected to receive benefits under the
benefit plans. At the end of 2007, the average remaining service period of active employees was 8.2 years for the pension plans.
As the benefits provided under the defined pension plans are calculated as a percentage of future earnings, an assumption of future
compensation increases is required to determine the projected benefit obligation. These rates are derived through periodic analysis of
historical demographic data conducted by an independent actuarial firm. The last review of such data was conducted using salary
information through 2006 and the Company believes that no circumstances have subsequently occurred that would result in a material
change to the compensation rate assumptions.
Other Postretirement Benefit Plan Obligations
The APBO is determined using a variety of actuarial assumptions, from which actual results may vary. Some of the more significant of
these assumptions include the discount rate, the healthcare cost trend rate and the average expected retirement age. The determination of
the discount rate and the average expected retirement age are substantially consistent with the determination described previously for the
pension plans.
The assumed healthcare cost trend rates used in measuring the APBO and net periodic benefit cost were as follows:
2007 2006
December 31,
Pre-Medicare eligible claims . . . . . . . . . . . . . . . . . . . . . 8.5% down to 5% in 2014 9.0% down to 5% in 2014
Medicare eligible claims . . . . . . . . . . . . . . . . . . . . . . . . 10.5% down to 5% in 2018 11.0% down to 5% in 2018
Assumed healthcare cost trend rates may have a significant effect on the amounts reported for healthcare plans. A one-percentage
point change in assumed healthcare cost trend rates would have the following effects:
One Percent
Increase
One Percent
Decrease
(In millions)
Effect on total of service and interest cost components. . . . . . . . . . . . . . . . . . . . . . . . . . $ 7 $ (6)
Effect of accumulated postretirement benefit obligation . . . . . . . . . . . . . . . . . . . . . . . . . . $63 $(62)
A decrease (increase) in the discount rate increases (decreases) the APBO. This increase (decrease) to the APBO is amortized into
earnings as an actuarial loss (gain). Based on the December 31, 2007 APBO, a 25 basis point decrease (increase) in the discount rate
would result in an increase (decrease) in the APBO of $44 million.
At the end of 2007, total net actuarial gains were $112 million as compared to net actuarial losses of $328 million in 2006. The majority
of the net actuarial gains are due to the increase in the discount rate, an increased number of retirees opting out of plan benefits and lower
than expected medical inflation. These gains will be amortized on a straight-line basis over the average remaining service period of active
employees expected to receive benefits under the other postretirement benefit plans. At the end of 2007, the average remaining service
period of active employees was 8.3 years for the other postretirement benefit plans.
In 2004, the Company adopted the guidance in FSP 106-2 Accounting and Disclosure Requirements Related to the Medicare
Prescription Drug, Improvement and Modernization Act of 2003 (“FSP 106-2”), to account for future subsidies to be received under the
Prescription Drug Act. The Company began receiving these subsidies during 2006. A summary of the reduction to the APBO and related
reduction to the components of net periodic other postretirement benefit cost is as follows:
2007 2006 2005
December 31,
(In millions)
Cumulative reduction in benefit obligation:
Beginning of year. . . . . . . . . . . . . . . . . . . . . . . . . . . . . . . . . . . . . . . . . . . . . . . . $328 $298 $230
Service cost . . . . . . . . . . . . . . . . . . . . . . . . . . . . . . . . . . . . . . . . . . . . . . . . . . . 7 6 6
Interest cost . . . . . . . . . . . . . . . . . . . . . . . . . . . . . . . . . . . . . . . . . . . . . . . . . . . 19 19 16
Net actuarial gains (losses) . . . . . . . . . . . . . . . . . . . . . . . . . . . . . . . . . . . . . . . . . (42) 15 46
Prescription drug subsidy . . . . . . . . . . . . . . . . . . . . . . . . . . . . . . . . . . . . . . . . . . (13) (10) —
End of year . . . . . . . . . . . . . . . . . . . . . . . . . . . . . . . . . . . . . . . . . . . . . . . . . . $299 $328 $298
2007 2006 2005
Years Ended
December 31,
(In millions)
Reduction in net periodic benefit cost:
Service cost . . . . . . . . . . . . . . . . . . . . . . . . . . . . . . . . . . . . . . . . . . . . . . . . . . . . $ 7 $ 6 $ 6
Interest cost . . . . . . . . . . . . . . . . . . . . . . . . . . . . . . . . . . . . . . . . . . . . . . . . . . . . 19 19 16
Amortization of net actuarial gains (losses) . . . . . . . . . . . . . . . . . . . . . . . . . . . . . . . . . 5 30 23
Total reduction in net periodic benefit cost . . . . . . . . . . . . . . . . . . . . . . . . . . . . . . . $31 $55 $45
The Company received subsidies of $10 million and $8 million for the years ended December 31, 2007 and 2006, respectively.
62 MetLife, Inc.
Pension and Other Postretirement Net Periodic Benefit Cost
Pension Cost
Net periodic pension cost is comprised of the following:
i) Service Cost — Service cost is the increase in the projected pension benefit obligation resulting from benefits payable to
employees of the Subsidiaries on service rendered during the current year.
ii) Interest Cost on the Liability — Interest cost is the time value adjustment on the projected pension benefit obligation at the end
of each year.
iii) Expected Return on Plan Assets — Expected return on plan assets is the assumed return earned by the accumulated pension
fund assets in a particular year.
iv) Amortization of Prior Service Cost — This cost relates to the increase or decrease to pension benefit cost for service provided
in prior years due to amendments in plans or initiation of new plans. As the economic benefits of these costs are realized in the
future periods, these costs are amortized to pension expense over the expected service years of the employees.
v) Amortization of Net Actuarial Gains or Losses — Actuarial gains and losses result from differences between the actual
experience and the expected experience on pension plan assets or projected pension benefit obligation during a particular
period. These gains and losses are accumulated and, to the extent they exceed 10% of the greater of the projected pension
benefit obligation or the market-related value of plan assets, they are amortized into pension expense over the expected
service years of the employees.
The Subsidiaries recognized pension expense of $98 million in 2007 as compared to $180 million in 2006 and $146 million in 2005. The
major components of net periodic pension cost described above were as follows:
2007 2006 2005
Years Ended December 31,
(In millions)
Service cost . . . . . . . . . . . . . . . . . . . . . . . . . . . . . . . . . . . . . . . . . . . . . . . . . . . . . . $ 166 $ 163 $ 142
Interest cost . . . . . . . . . . . . . . . . . . . . . . . . . . . . . . . . . . . . . . . . . . . . . . . . . . . . . . 354 335 318
Expected return on plan assets . . . . . . . . . . . . . . . . . . . . . . . . . . . . . . . . . . . . . . . . . . (507) (454) (446)
Amortization of net actuarial (gains) losses . . . . . . . . . . . . . . . . . . . . . . . . . . . . . . . . . . . 68 125 116
Amortization of prior service cost (credit) . . . . . . . . . . . . . . . . . . . . . . . . . . . . . . . . . . . . 17 11 16
Net periodic benefit cost . . . . . . . . . . . . . . . . . . . . . . . . . . . . . . . . . . . . . . . . . . . . . $ 98 $ 180 $ 146
The increase in expense from 2005 to 2006 was primarily a result of both increases in service and interest cost and amortization of net
actuarial losses resulting largely from lower discount rates, partially offset by the impact of an increase in the expected return on plan
assets due to a larger plan assets base.
The decrease in expense from 2006 to 2007 was primarily the result of an increase in the expected return on plan assets and a
decrease in amortization of net actuarial losses resulting from the $350 million contribution made in 2006. The increase in the interest cost
resulted from the increase in the discount rate.
The estimated net actuarial losses and prior service cost for the defined benefit pension plans that will be amortized from accumulated
other comprehensive income into net periodic benefit cost over the next year are both $14 million.
The weighted average discount rate used to calculate the net periodic pension cost was 6.00%, 5.82% and 5.83% for the years ended
December 31, 2007, 2006 and 2005, respectively.
The weighted average expected rate of return on pension plan assets used to calculate the net periodic pension cost for the years
ended December 31, 2007, 2006 and 2005 was 8.25%, 8.25% and 8.50%, respectively. The expected rate of return on plan assets is
based on anticipated performance of the various asset sectors in which the plan invests, weighted by target allocation percentages.
Anticipated future performance is based on long-term historical returns of the plan assets by sector, adjusted for the Subsidiaries’ long-
term expectations on the performance of the markets. While the precise expected return derived using this approach will fluctuate from
year to year, the Subsidiaries’ policy is to hold this long-term assumption constant as long as it remains within reasonable tolerance from
the derived rate. The actual net return on the investments has been an approximation of the estimated return for the pension plan in 2007,
2006 and 2005.
Based on the December 31, 2007 asset balances, a 25 basis point increase (decrease) in the expected rate of return on plan assets
would result in a decrease (increase) in net periodic benefit cost of $15 million for the pension plans.
Other Postretirement Benefit Cost
The net periodic other postretirement benefit cost consists of the following:
i) Service Cost — Service cost is the increase in the expected postretirement plan benefit obligation resulting from benefits
payable to employees of the Subsidiaries on service rendered during the current year.
ii) Interest Cost on the Liability — Interest cost is the time value adjustment on the expected postretirement benefit obligation at
the end of each year.
iii) Expected Return on Plan Assets — Expected return on plan assets is the assumed return earned by the accumulated other
postretirement fund assets in a particular year.
iv) Amortization of Prior Service Cost — This cost relates to the increase or decrease to other postretirement benefit cost for
service provided in prior years due to amendments in plans or initiation of new plans. As the economic benefits of these costs
are realized in the future periods these costs are amortized to other postretirement benefit expense over the expected service
years of the employees.
v) Amortization of Net Actuarial Gains or Losses — Actuarial gains and losses result from differences between the actual
experience and the expected experience on other postretirement benefit plan assets or expected postretirement plan benefit
obligation during a particular year. These gains and losses are accumulated and, to the extent they exceed 10% of the greater
63MetLife, Inc.
of the accumulated postretirement plan benefit obligation or the market-related value of plan assets, they are amortized into
other postretirement benefit expense over the expected service years of the employees.
The Subsidiaries recognized other postretirement benefit expense of $9 million in 2007 as compared to $60 million in 2006 and
$77 million in 2005. The major components of net periodic other postretirement benefit cost described above were as follows:
2007 2006 2005
Years Ended
December 31,
(In millions)
Service cost . . . . . . . . . . . . . . . . . . . . . . . . . . . . . . . . . . . . . . . . . . . . . . . . . . . . . . $ 27 $ 35 $ 37
Interest cost . . . . . . . . . . . . . . . . . . . . . . . . . . . . . . . . . . . . . . . . . . . . . . . . . . . . . . 104 117 121
Expected return on plan assets . . . . . . . . . . . . . . . . . . . . . . . . . . . . . . . . . . . . . . . . . . (86) (79) (79)
Amortization of net actuarial (gains) losses . . . . . . . . . . . . . . . . . . . . . . . . . . . . . . . . . . . — 23 15
Amortization of prior service cost (credit) . . . . . . . . . . . . . . . . . . . . . . . . . . . . . . . . . . . . (36) (36) (17)
Net periodic benefit cost . . . . . . . . . . . . . . . . . . . . . . . . . . . . . . . . . . . . . . . . . . . . . $ 9 $ 60 $ 77
The decrease in benefit cost from 2005 to 2006 was due to changes in plan benefits resulting in decreased service and interest cost
and increases in amortization of prior service costs. The continued decrease from 2006 to 2007 primarily resulted from a change in the
Medicare integration methodology for certain retirees.
The estimated net actuarial losses and prior service credit for the other postretirement benefit plans that will be amortized from
accumulated other comprehensive income into net periodic benefit cost over the next year are less than $1 million and $37 million,
respectively.
The weighted average discount rate used to calculate the net periodic postretirement cost was 6.00%, 5.82% and 5.98% for the years
ended December 31, 2007, 2006 and 2005, respectively.
The weighted average expected rate of return on plan assets used to calculate the net other postretirement benefit cost for the years
ended December 31, 2007, 2006 and 2005 was 7.47%, 7.42% and 7.51%, respectively. The expected rate of return on plan assets is
based on anticipated performance of the various asset sectors in which the plan invests, weighted by target allocation percentages.
Anticipated future performance is based on long-term historical returns of the plan assets by sector, adjusted for the Subsidiaries’ long-
term expectations on the performance of the markets. While the precise expected return derived using this approach will fluctuate from
year to year, the Subsidiaries’ policy is to hold this long-term assumption constant as long as it remains within reasonable tolerance from
the derived rate. The actual net return on the investments has been an approximation of the estimated return for the other postretirement
plans in 2007, 2006 and 2005.
Based on the December 31, 2007 asset balances, a 25 basis point increase (decrease) in the expected rate of return on plan assets
would result in a decrease (increase) in net periodic benefit cost of $3 million for the other postretirement plans.
Pension and Other Postretirement Benefit Plan Assets
Pension Plan Assets
Substantially all assets of the pension plans are invested within group annuity and life insurance contracts issued by the Subsidiaries.
The majority of assets are held in separate accounts established by the Subsidiaries. The account values of assets held with the
Subsidiaries were $6,440 million and $6,205 million as of December 31, 2007 and 2006, respectively. The terms of these contracts are
consistent in all material respects with those the Subsidiaries offer to unaffiliated parties that are similarly situated.
Net assets invested in separate accounts are stated at the aggregate fair value of units of participation. Such value reflects
accumulated contributions, dividends and realized and unrealized investment gains or losses apportioned to such contributions, less
withdrawals, distributions, allocable expenses relating to the purchase, sale and maintenance of the assets and an allocable part of such
separate accounts’ investment expenses.
Separate account investments in fixed income and equity securities are generally carried at published market value, or if published
market values are not readily available, at estimated market values. Investments in short-term fixed income securities are generally reflected
as cash equivalents and carried at fair value. Real estate investments are carried at estimated fair value based on appraisals performed by
third-party real estate appraisal firms, and generally, determined by discounting projected cash flows over periods of time and at interest
rates deemed appropriate for each investment. Information on the physical value of the property and the sales prices of comparable
properties is used to corroborate fair value estimates. Estimated fair value of hedge fund net assets is generally determined by third-party
pricing vendors using quoted market prices or through the use of pricing models which are affected by changes in interest rates, foreign
currency exchange rates, financial indices, credit spreads, market supply and demand, market volatility and liquidity.
The following table summarizes the actual and target weighted-average allocations of pension plan assets within the separate
accounts:
2007 2006 2008
Weighted
Average
Actual
Allocation
Weighted
Average
Target
Allocation
December 31,
Asset Category
Equity securities . . . . . . . . . . . . . . . . . . . . . . . . . . . . . . . . . . . . . . . . . . . . . . . . . . . 38% 42% 30%-55%
Fixed maturities . . . . . . . . . . . . . . . . . . . . . . . . . . . . . . . . . . . . . . . . . . . . . . . . . . . . 44% 42% 30%-65%
Other (Real Estate and Alternative investments) . . . . . . . . . . . . . . . . . . . . . . . . . . . . . . . 18% 16% 10%-25%
Total. . . . . . . . . . . . . . . . . . . . . . . . . . . . . . . . . . . . . . . . . . . . . . . . . . . . . . . . . . 100% 100%
64 MetLife, Inc.
Target allocations of assets are determined with the objective of maximizing returns and minimizing volatility of net assets through
adequate asset diversification. Adjustments are made to target allocations based on an assessment of the impact of economic factors and
market conditions.
Other Postretirement Benefit Plan Assets
Substantially all assets of the other postretirement benefit plans are invested within life insurance and reserve contracts issued by the
Subsidiaries. The majority of assets are held in separate accounts established by the Subsidiaries. The account values of assets held with
the Subsidiaries were $1,125 million and $1,116 million as of December 31, 2007 and 2006, respectively. The terms of these contracts are
consistent in all material respects with those the Subsidiaries offer to unaffiliated parties that are similarly situated.
The valuation of separate accounts and the investments within such separate accounts invested in by the other postretirement plans
are similar to that described in the preceding section on pension plans.
The following table summarizes the actual and target weighted-average allocations of other postretirement benefit plan assets within the
separate accounts:
2007 2006 2008
Weighted
Average
Actual
Allocation
Weighted
Average
Target
Allocation
December 31,
Asset Category
Equity securities . . . . . . . . . . . . . . . . . . . . . . . . . . . . . . . . . . . . . . . . . . . . . . . . . . . 37% 37% 30%-45%
Fixed maturities . . . . . . . . . . . . . . . . . . . . . . . . . . . . . . . . . . . . . . . . . . . . . . . . . . . . 58% 57% 45%-70%
Other (Real Estate and Alternative investments) . . . . . . . . . . . . . . . . . . . . . . . . . . . . . . . 5% 6% 0%-10%
Total. . . . . . . . . . . . . . . . . . . . . . . . . . . . . . . . . . . . . . . . . . . . . . . . . . . . . . . . . . 100% 100%
Target allocations of assets are determined with the objective of maximizing returns and minimizing volatility of net assets through
adequate asset diversification. Adjustments are made to target allocations based on an assessment of the impact of economic factors and
market conditions.
Funding and Cash Flows of Pension and Other Postretirement Benefit Plan Obligations
Pension Plan Obligations
It is the Subsidiaries’ practice to make contributions to the qualified pension plans to comply with minimum funding requirements of
ERISA, as amended. In accordance with such practice, no contributions were required for the years ended December 31, 2007 or 2006.
No contributions will be required for 2008. The Subsidiaries did not make any discretionary contributions to the qualified pension plans
during the year ended December 31, 2007. During the year ended December 31, 2006, the Subsidiaries made discretionary contributions
of $350 million. The Subsidiaries expect to make additional discretionary contributions of $150 million in 2008.
Benefit payments due under the non-qualified pension plans are funded from the Subsidiaries’ general assets as they become due
under the provision of the plans. These payments totaled $50 million and $38 million for the years ended December 31, 2007 and 2006,
respectively. These benefit payments are expected to be at approximately the same level in 2008.
Gross pension benefit payments for the next ten years, which reflect expected future service as appropriate, are expected to be as
follows:
Pension
Benefits
(In millions)
2008 . . . . . . . . . . . . . . . . . . . . . . . . . . . . . . . . . . . . . . . . . . . . . . . . . . . . . . . . . . . . . . . . . . . . $ 360
2009 . . . . . . . . . . . . . . . . . . . . . . . . . . . . . . . . . . . . . . . . . . . . . . . . . . . . . . . . . . . . . . . . . . . . $ 373
2010 . . . . . . . . . . . . . . . . . . . . . . . . . . . . . . . . . . . . . . . . . . . . . . . . . . . . . . . . . . . . . . . . . . . . $ 383
2011 . . . . . . . . . . . . . . . . . . . . . . . . . . . . . . . . . . . . . . . . . . . . . . . . . . . . . . . . . . . . . . . . . . . . $ 397
2012 . . . . . . . . . . . . . . . . . . . . . . . . . . . . . . . . . . . . . . . . . . . . . . . . . . . . . . . . . . . . . . . . . . . . $ 413
2013-2017 . . . . . . . . . . . . . . . . . . . . . . . . . . . . . . . . . . . . . . . . . . . . . . . . . . . . . . . . . . . . . . . . $2,288
Other Postretirement Benefit Plan Obligations
Other postretirement benefits represent a non-vested, non-guaranteed obligation of the Subsidiaries and current regulations do not
require specific funding levels for these benefits. While the Subsidiaries have funded such plans in advance, it has been the Subsidiaries’
practice to primarily use their general assets, net of participants’ contributions, to pay claims as they come due in lieu of utilizing plan
assets. Total payments equaled $174 million and $152 million for the years ended December 31, 2007 and 2006, respectively.
The Subsidiaries’ expect to make contributions of $116 million, net of participants’ contributions, towards the other postretirement plan
obligations in 2008. As noted previously, the Subsidiaries expect to receive subsidies under the Prescription Drug Act to partially offset
such payments.
65MetLife, Inc.
Gross other postretirement benefit payments for the next ten years, which reflect expected future service where appropriate, and gross
subsidies to be received under the Prescription Drug Act are expected to be as follows:
Gross
Prescription
Drug Subsidies Net
(In millions)
2008 . . . . . . . . . . . . . . . . . . . . . . . . . . . . . . . . . . . . . . . . . . . . . . . . . . . . . . . $116 $ (14) $102
2009 . . . . . . . . . . . . . . . . . . . . . . . . . . . . . . . . . . . . . . . . . . . . . . . . . . . . . . . $120 $ (15) $105
2010 . . . . . . . . . . . . . . . . . . . . . . . . . . . . . . . . . . . . . . . . . . . . . . . . . . . . . . . $124 $ (16) $109
2011 . . . . . . . . . . . . . . . . . . . . . . . . . . . . . . . . . . . . . . . . . . . . . . . . . . . . . . . $129 $ (16) $113
2012 . . . . . . . . . . . . . . . . . . . . . . . . . . . . . . . . . . . . . . . . . . . . . . . . . . . . . . . $132 $ (17) $115
2013-2017 . . . . . . . . . . . . . . . . . . . . . . . . . . . . . . . . . . . . . . . . . . . . . . . . . . . $713 $(100) $613
Insolvency Assessments
Most of the jurisdictions in which the Company is admitted to transact business require insurers doing business within the jurisdiction to
participate in guaranty associations, which are organized to pay contractual benefits owed pursuant to insurance policies issued by
impaired, insolvent or failed insurers. These associations levy assessments, up to prescribed limits, on all member insurers in a particular
state on the basis of the proportionate share of the premiums written by member insurers in the lines of business in which the impaired,
insolvent or failed insurer engaged. Some states permit member insurers to recover assessments paid through full or partial premium tax
offsets. Assets and liabilities held for insolvency assessments are as follows:
2007 2006
December 31,
(In millions)
Other Assets:
Premium tax offset for future undiscounted assessments . . . . . . . . . . . . . . . . . . . . . . . . . . . . . . . $40 $45
Premium tax offsets currently available for paid assessments . . . . . . . . . . . . . . . . . . . . . . . . . . . . . 6 7
Receivable for reimbursement of paid assessments(1) . . . . . . . . . . . . . . . . . . . . . . . . . . . . . . . . . 7 10
$53 $62
Liability:
Insolvency assessments . . . . . . . . . . . . . . . . . . . . . . . . . . . . . . . . . . . . . . . . . . . . . . . . . . . . $74 $90
(1) The Company holds a receivable from the seller of a prior acquisition in accordance with the purchase agreement.
Assessments levied against the Company were ($1) million, $2 million and $4 million for the years ended December 31, 2007, 2006 and
2005, respectively.
Effects of Inflation
The Company does not believe that inflation has had a material effect on its consolidated results of operations, except insofar as
inflation may affect interest rates.
Adoption of New Accounting Pronouncements
Income Taxes
Effective January 1, 2007, the Company adopted FIN 48. FIN 48 clarifies the accounting for uncertainty in income tax recognized in a
company’s financial statements. FIN 48 requires companies to determine whether it is “more likely than not” that a tax position will be
sustained upon examination by the appropriate taxing authorities before any part of the benefit can be recorded in the financial statements.
It also provides guidance on the recognition, measurement, and classification of income tax uncertainties, along with any related interest
and penalties. Previously recorded income tax benefits that no longer meet this standard are required to be charged to earnings in the
period that such determination is made.
As a result of the implementation of FIN 48, the Company recognized a $52 million increase in the liability for unrecognized tax benefits,
a $4 million decrease in the interest liability for unrecognized tax benefits, and a corresponding reduction to the January 1, 2007 balance of
retained earnings of $37 million, net of $11 million of minority interest.
Insurance Contracts
Effective January 1, 2007, the Company adopted SOP 05-1, Accounting by Insurance Enterprises for Deferred Acquisition Costs in
Connection with Modifications or Exchanges of Insurance Contracts. SOP 05-1 which provides guidance on accounting by insurance
enterprises for DAC on internal replacements of insurance and investment contracts other than those specifically described in SFAS
No. 97, Accounting and Reporting by Insurance Enterprises for Certain Long-Duration Contracts and for Realized Gains and Losses from
the Sale of Investments. SOP 05-1 defines an internal replacement and is effective for internal replacements occurring in fiscal years
beginning after December 15, 2006. In addition, in February 2007, the American Institute of Certified Public Accountants (“AICPA”) issued
related Technical Practice Aids (“TPAs”) to provide further clarification of SOP 05-1. The TPAs became effective concurrently with the
adoption of SOP 05-1.
As a result of the adoption of SOP 05-1 and the related TPAs, if an internal replacement modification substantially changes a contract,
then the DAC is written off immediately through income and any new deferrable costs associated with the new replacement are deferred. If
a contract modification does not substantially change the contract, the DAC amortization on the original contract will continue and any
acquisition costs associated with the related modification are immediately expensed.
The adoption of SOP 05-1 and the related TPAs resulted in a reduction to DAC and VOBA on January 1, 2007 and an acceleration of the
amortization period relating primarily to the Company’s group life and health insurance contracts that contain certain rate reset provisions.
Prior to the adoption of SOP 05-1, DAC on such contracts was amortized over the expected renewable life of the contract. Upon adoption
66 MetLife, Inc.
of SOP 05-1, DAC on such contracts is to be amortized over the rate reset period. The impact as of January 1, 2007 was a cumulative
effect adjustment of $292 million, net of income tax of $161 million, which was recorded as a reduction to retained earnings.
Defined Benefit and Other Postretirement Plans
Effective December 31, 2006, the Company adopted SFAS 158. The pronouncement revises financial reporting standards for defined
benefit pension and other postretirement plans by requiring the:
(i) recognition in the statement of financial position of the funded status of defined benefit plans measured as the difference
between the fair value of plan assets and the benefit obligation, which is the projected benefit obligation for pension plans
and the accumulated postretirement benefit obligation for other postretirement plans;
(ii) recognition as an adjustment to accumulated other comprehensive income (loss), net of income tax, those amounts of
actuarial gains and losses, prior service costs and credits, and net asset or obligation at transition that have not yet been
included in net periodic benefit costs as of the end of the year of adoption;
(iii) recognition of subsequent changes in funded status as a component of other comprehensive income;
(iv) measurement of benefit plan assets and obligations as of the date of the statement of financial position; and
(v) disclosure of additional information about the effects on the employer’s statement of financial position.
The adoption of SFAS 158 resulted in a reduction of $744 million, net of income tax, to accumulated other comprehensive income,
which is included as a component of total consolidated stockholders’ equity. As the Company’s measurement date for its pension and
other postretirement benefit plans is already December 31 there was no impact of adoption due to changes in measurement date. See also
“Summary of Critical Accounting Estimates.”
Stock Compensation Plans
As described previously, effective January 1, 2006, the Company adopted SFAS 123(r) including supplemental application guidance
issued by the SEC in Staff Accounting Bulletin (“SAB”) No. 107, Share-Based Payment (“SAB 107”) — using the modified prospective
transition method. In accordance with the modified prospective transition method, results for prior periods have not been restated.
SFAS 123(r) requires that the cost of all stock-based transactions be measured at fair value and recognized over the period during which a
grantee is required to provide goods or services in exchange for the award. The Company had previously adopted the fair value method of
accounting for stock-based awards as prescribed by SFAS No. 123, Accounting for Stock-Based Compensation (“SFAS 123”) on a
prospective basis effective January 1, 2003, and prior to January 1, 2003, accounted for its stock-based awards to employees under the
intrinsic value method prescribed by APB 25. The Company did not modify the substantive terms of any existing awards prior to adoption of
SFAS 123(r).
Under the modified prospective transition method, compensation expense recognized during the year ended December 31, 2006
includes: (a) compensation expense for all stock-based awards granted prior to, but not yet vested as of January 1, 2006, based on the
grant date fair value estimated in accordance with the original provisions of SFAS 123, and (b) compensation expense for all stock-based
awards granted beginning January 1, 2006, based on the grant date fair value estimated in accordance with the provisions of SFAS 123(r).
The adoption of SFAS 123(r) did not have a significant impact on the Company’s financial position or results of operations as all stock-
based awards accounted for under the intrinsic value method prescribed by APB 25 had vested prior to the adoption date and the
Company had adopted the fair value recognition provisions of SFAS 123 on January 1, 2003.
SFAS 123 allowed forfeitures of stock-based awards to be recognized as a reduction of compensation expense in the period in which
the forfeiture occurred. Upon adoption of SFAS 123(r), the Company changed its policy and now incorporates an estimate of future
forfeitures into the determination of compensation expense when recognizing expense over the requisite service period. The impact of this
change in accounting policy was not significant to the Company’s financial position or results of operations as of the date of adoption.
Additionally, for awards granted after adoption, the Company changed its policy from recognizing expense for stock-based awards over
the requisite service period to recognizing such expense over the shorter of the requisite service period or the period to attainment of
retirement-eligibility.
Prior to the adoption of SFAS 123(r), the Company presented tax benefits of deductions resulting from the exercise of stock options
within operating cash flows in the consolidated statements of cash flows. SFAS 123(r) requires tax benefits resulting from tax deductions in
excess of the compensation cost recognized for those options be classified and reported as a financing cash inflow upon adoption of
SFAS 123(r).
Derivative Financial Instruments
The Company has adopted guidance relating to derivative financial instruments as follows:
• Effective January 1, 2006, the Company adopted prospectively SFAS No. 155, Accounting for Certain Hybrid Instruments
(“SFAS 155”). SFAS 155 amends SFAS No. 133, Accounting for Derivative Instruments and Hedging (“SFAS 133”) and SFAS No. 140,
Accounting for Transfers and Servicing of Financial Assets and Extinguishments of Liabilities (“SFAS 140”). SFAS 155 allows financial
instruments that have embedded derivatives to be accounted for as a whole, eliminating the need to bifurcate the derivative from its
host, if the holder elects to account for the whole instrument on a fair value basis. In addition, among other changes, SFAS 155:
(i) clarifies which interest-only strips and principal-only strips are not subject to the requirements of SFAS 133;
(ii) establishes a requirement to evaluate interests in securitized financial assets to identify interests that are freestanding
derivatives or that are hybrid financial instruments that contain an embedded derivative requiring bifurcation;
(iii) clarifies that concentrations of credit risk in the form of subordination are not embedded derivatives; and
(iv) amends SFAS 140 to eliminate the prohibition on a qualifying special-purpose entity (“QSPE”) from holding a derivative financial
instrument that pertains to a beneficial interest other than another derivative financial interest.
The adoption of SFAS 155 did not have a material impact on the Company’s consolidated financial statements.
• Effective October 1, 2006, the Company adopted SFAS 133 Implementation Issue No. B40, Embedded Derivatives: Application of
Paragraph 13(b) to Securitized Interests in Prepayable Financial Assets (“Issue B40”). Issue B40 clarifies that a securitized interest in
prepayable financial assets is not subject to the conditions in paragraph 13(b) of SFAS 133, if it meets both of the following criteria:
(i) the right to accelerate the settlement if the securitized interest cannot be controlled by the investor; and (ii) the securitized interest
67MetLife, Inc.
itself does not contain an embedded derivative (including an interest rate-related derivative) for which bifurcation would be required
other than an embedded derivative that results solely from the embedded call options in the underlying financial assets. The adoption
of Issue B40 did not have a material impact on the Company’s consolidated financial statements.
• Effective January 1, 2006, the Company adopted prospectively SFAS 133 Implementation Issue No. B38, Embedded Derivatives:
Evaluation of Net Settlement with Respect to the Settlement of a Debt Instrument through Exercise of an Embedded Put Option or Call
Option (“Issue B38”) and SFAS 133 Implementation Issue No. B39, Embedded Derivatives: Application of Paragraph 13(b) to Call
Options That Are Exercisable Only by the Debtor (“Issue B39”). Issue B38 clarifies that the potential settlement of a debtor’s obligation
to a creditor occurring upon exercise of a put or call option meets the net settlement criteria of SFAS 133. Issue B39 clarifies that an
embedded call option, in which the underlying is an interest rate or interest rate index, that can accelerate the settlement of a debt
host financial instrument should not be bifurcated and fair valued if the right to accelerate the settlement can be exercised only by the
debtor (issuer/borrower) and the investor will recover substantially all of its initial net investment. The adoption of Issues B38 and B39
did not have a material impact on the Company’s consolidated financial statements.
Other
Effective January 1, 2007, the Company adopted FASB Staff Position (“FSP”) Emerging Issues Task Force (“EITF”) 00-19-2, Accounting
for Registration Payment Arrangements (“FSP EITF 00-19-2”). FSP EITF 00-19-2 specifies that the contingent obligation to make future
payments or otherwise transfer consideration under a registration payment arrangement should be separately recognized and measured in
accordance with SFAS No. 5, Accounting for Contingencies. The adoption of FSP EITF 00-19-2 did not have an impact on the Company’s
consolidated financial statements.
Effective January 1, 2007, the Company adopted FSP No. FAS 13-2, Accounting for a Change or Projected Change in the Timing of
Cash Flows Relating to Income Taxes Generated by a Leveraged Lease Transaction (“FSP 13-2”). FSP 13-2 amends SFAS No. 13,
Accounting for Leases, to require that a lessor review the projected timing of income tax cash flows generated by a leveraged lease
annually or more frequently if events or circumstances indicate that a change in timing has occurred or is projected to occur. In addition,
FSP 13-2 requires that the change in the net investment balance resulting from the recalculation be recognized as a gain or loss from
continuing operations in the same line item in which leveraged lease income is recognized in the year in which the assumption is changed.
The adoption of FSP 13-2 did not have a material impact on the Company’s consolidated financial statements.
Effective January 1, 2007, the Company adopted SFAS No. 156, Accounting for Servicing of Financial Assets — an amendment of
FASB Statement No. 140 (“SFAS 156”). Among other requirements, SFAS 156 requires an entity to recognize a servicing asset or servicing
liability each time it undertakes an obligation to service a financial asset by entering into a servicing contract in certain situations. The
adoption of SFAS 156 did not have an impact on the Company’s consolidated financial statements.
Effective November 15, 2006, the Company adopted SAB No. 108, Considering the Effects of Prior Year Misstatements when
Quantifying Misstatements in Current Year Financial Statements (“SAB 108”). SAB 108 provides guidance on how prior year misstatements
should be considered when quantifying misstatements in current year financial statements for purposes of assessing materiality. SAB 108
requires that registrants quantify errors using both a balance sheet and income statement approach and evaluate whether either approach
results in quantifying a misstatement that, when relevant quantitative and qualitative factors are considered, is material. SAB 108 permits
companies to initially apply its provisions by either restating prior financial statements or recording a cumulative effect adjustment to the
carrying values of assets and liabilities as of January 1, 2006 with an offsetting adjustment to retained earnings for errors that were
previously deemed immaterial but are material under the guidance in SAB 108. The adoption of SAB 108 did not have a material impact on
the Company’s consolidated financial statements.
Effective January 1, 2006, the Company adopted prospectively EITF Issue No. 05-7, Accounting for Modifications to Conversion
Options Embedded in Debt Instruments and Related Issues (“EITF 05-7”). EITF 05-7 provides guidance on whether a modification of
conversion options embedded in debt results in an extinguishment of that debt. In certain situations, companies may change the terms of
an embedded conversion option as part of a debt modification. The EITF concluded that the change in the fair value of an embedded
conversion option upon modification should be included in the analysis of EITF Issue No. 96-19, Debtor’s Accounting for a Modification or
Exchange of Debt Instruments, to determine whether a modification or extinguishment has occurred and that a change in the fair value of a
conversion option should be recognized upon the modification as a discount (or premium) associated with the debt, and an increase (or
decrease) in additional paid-in capital. The adoption of EITF 05-7 did not have a material impact on the Company’s consolidated financial
statements.
Effective January 1, 2006, the Company adopted EITF Issue No. 05-8, Income Tax Consequences of Issuing Convertible Debt with a
Beneficial Conversion Feature (“EITF 05-8”). EITF 05-8 concludes that: (i) the issuance of convertible debt with a beneficial conversion
feature results in a basis difference that should be accounted for as a temporary difference; and (ii) the establishment of the deferred tax
liability for the basis difference should result in an adjustment to additional paid-in capital. EITF 05-8 was applied retrospectively for all
instruments with a beneficial conversion feature accounted for in accordance with EITF Issue No. 98-5, Accounting for Convertible
Securities with Beneficial Conversion Features or Contingently Adjustable Conversion Ratios, and EITF Issue No. 00-27, Application of
Issue No. 98-5 to Certain Convertible Instruments. The adoption of EITF 05-8 did not have a material impact on the Company’s
consolidated financial statements.
Effective January 1, 2006, the Company adopted SFAS No. 154, Accounting Changes and Error Corrections, a replacement of APB
Opinion No. 20 and FASB Statement No. 3 (“SFAS 154”). SFAS 154 requires retrospective application to prior periods’ financial statements
for a voluntary change in accounting principle unless it is deemed impracticable. It also requires that a change in the method of
depreciation, amortization, or depletion for long-lived, non-financial assets be accounted for as a change in accounting estimate rather
than a change in accounting principle. The adoption of SFAS 154 did not have a material impact on the Company’s consolidated financial
statements.
In June 2005, the EITF reached consensus on Issue No. 04-5, Determining Whether a General Partner, or the General Partners as a
Group, Controls a Limited Partnership or Similar Entity When the Limited Partners Have Certain Rights (“EITF 04-5”). EITF 04-5 provides a
framework for determining whether a general partner controls and should consolidate a limited partnership or a similar entity in light of
certain rights held by the limited partners. The consensus also provides additional guidance on substantive rights. EITF 04-5 was effective
after June 29, 2005 for all newly formed partnerships and for any pre-existing limited partnerships that modified their partnership
68 MetLife, Inc.
agreements after that date. For all other limited partnerships, EITF 04-5 required adoption by January 1, 2006 through a cumulative effect
of a change in accounting principle recorded in opening equity or applied retrospectively by adjusting prior period financial statements. The
adoption of the provisions of EITF 04-5 did not have a material impact on the Company’s consolidated financial statements.
Effective November 9, 2005, the Company prospectively adopted the guidance in FSP No. FAS 140-2, Clarification of the Application of
Paragraphs 40(b) and 40(c) of FAS 140 (“FSP 140-2”). FSP 140-2 clarified certain criteria relating to derivatives and beneficial interests
when considering whether an entity qualifies as a QSPE. Under FSP 140-2, the criteria must only be met at the date the QSPE issues
beneficial interests or when a derivative financial instrument needs to be replaced upon the occurrence of a specified event outside the
control of the transferor. The adoption of FSP 140-2 did not have a material impact on the Company’s consolidated financial statements.
Effective July 1, 2005, the Company adopted SFAS No. 153, Exchanges of Nonmonetary Assets, an amendment of APB Opinion No. 29
(“SFAS 153”). SFAS 153 amended prior guidance to eliminate the exception for nonmonetary exchanges of similar productive assets and
replaced it with a general exception for exchanges of nonmonetary assets that do not have commercial substance. A nonmonetary
exchange has commercial substance if the future cash flows of the entity are expected to change significantly as a result of the exchange.
The provisions of SFAS 153 were required to be applied prospectively for fiscal periods beginning after June 15, 2005. The adoption of
SFAS 153 did not have a material impact on the Company’s consolidated financial statements.
Effective July 1, 2005, the Company adopted EITF Issue No. 05-6, Determining the Amortization Period for Leasehold Improvements
(“EITF 05-6”). EITF 05-6 provides guidance on determining the amortization period for leasehold improvements acquired in a business
combination or acquired subsequent to lease inception. As required by EITF 05-6, the Company adopted this guidance on a prospective
basis which had no material impact on the Company’s consolidated financial statements.
In June 2005, the FASB completed its review of EITF Issue No. 03-1, The Meaning of Other-Than-Temporary Impairment and Its
Application to Certain Investments (“EITF 03-1”). EITF 03-1 provides accounting guidance regarding the determination of when an
impairment of debt and marketable equity securities and investments accounted for under the cost method should be considered other-
than-temporary and recognized in income. EITF 03-1 also requires certain quantitative and qualitative disclosures for debt and marketable
equity securities classified as available-for-sale or held-to-maturity under SFAS No. 115, Accounting for Certain Investments in Debt and
Equity Securities, that are impaired at the balance sheet date but for which an other-than-temporary impairment has not been recognized.
The FASB decided not to provide additional guidance on the meaning of other-than-temporary impairment but has issued FSP Nos.
FAS 115-1 and FAS 124-1, The Meaning of Other-Than-Temporary Impairment and its Application to Certain Investments (“FSP 115-1”),
which nullifies the accounting guidance on the determination of whether an investment is other-than-temporarily impaired as set forth in
EITF 03-1. As required by FSP 115-1, the Company adopted this guidance on a prospective basis, which had no material impact on the
Company’s consolidated financial statements, and has provided the required disclosures.
In December 2004, the FASB issued FSP No. FAS 109-2, Accounting and Disclosure Guidance for the Foreign Earnings Repatriation
Provision within the American Jobs Creation Act of 2004 (“FSP 109-2”). The AJCA introduced a one-time dividend received deduction on
the repatriation of certain earnings to a U.S. taxpayer. FSP 109-2 provides companies additional time beyond the financial reporting period
of enactment to evaluate the effects of the AJCA on their plans to repatriate foreign earnings for purposes of applying SFAS No. 109,
Accounting for Income Taxes. During 2005, the Company recorded a $27 million income tax benefit related to the repatriation of foreign
earnings pursuant to Internal Revenue Code Section 965 for which a U.S. deferred income tax provision had previously been recorded. As
of January 1, 2006, the repatriation provision of the AJCA no longer applies to the Company.
Future Adoption of New Accounting Pronouncements
Fair Value
In September 2006, the FASB issued SFAS No. 157, Fair Value Measurements (“SFAS 157”). SFAS 157 defines fair value, establishes a
framework for measuring fair value and requires enhanced disclosures about fair value measurements. Effective January 1, 2008, the
Company adopted SFAS 157 and applied the provisions of the statement prospectively to assets and liabilities measured and disclosed at
fair value. In addition to new disclosure requirements, the adoption of SFAS 157 changes the valuation of certain freestanding derivatives
by moving from a mid to bid pricing convention as well as changing the valuation of embedded derivatives associated with annuity
contracts. The change in valuation of embedded derivatives associated with annuity contracts results from the incorporation of risk margins
and the Company’s own credit standing in their valuation. While the Company does not expect such changes in valuation to have a material
impact on the Company’s financial statements at January 1, 2008, the addition of risk margins and the Company’s own credit spread in the
valuation of embedded derivatives associated with annuity contracts may result in significant volatility in the Company’s consolidated net
income.
In February 2007, the FASB issued SFAS No. 159, The Fair Value Option for Financial Assets and Financial Liabilities (“SFAS 159”).
SFAS 159 permits entities the option to measure most financial instruments and certain other items at fair value at specified election dates
and to report related unrealized gains and losses in earnings. The fair value option is generally applied on an instrument-by-instrument
basis and is generally an irrevocable election. Effective January 1, 2008, the Company has elected the fair value option on fixed maturity
securities backing certain pension products sold in Brazil. Previously, these fixed maturity securities were accounted for as available-for-
sale securities in accordance with FAS 115. The Company’s insurance joint venture in Japan also elected the fair value option for its single
premium deferred annuities and supporting assets. These elections are not expected to have a material impact on the Company’s retained
earnings or equity as of January 1, 2008.
In June 2007, the AICPA issued SOP 07-1, Clarification of the Scope of the Audit and Accounting Guide Investment Companies and
Accounting by Parent Companies and Equity Method Investors for Investments in Investment Companies (“SOP 07-1”) . Upon adoption of
SOP 07-1, the Company must also adopt the provisions of FASB Staff Position No. FSP FIN 46(r)-7, Application of FASB Interpretation
No. 46 to Investment Companies (“FSP FIN 46(r)-7”), which permanently exempts investment companies from applying the provisions of
FIN No. 46(r), Consolidation of Variable Interest Entities — An Interpretation of Accounting Research Bulletin No. 51, and its December
2003 revision (“FIN 46(r)”) to investments carried at fair value. SOP 07-1 provides guidance for determining whether an entity falls within the
scope of the AICPA Audit and Accounting Guide Investment Companies and whether investment company accounting should be retained
by a parent company upon consolidation of an investment company subsidiary or by an equity method investor in an investment company.
In certain circumstances, SOP 07-1 precludes retention of specialized accounting for investment companies (i.e., fair value accounting),
when similar direct investments exist in the consolidated group and are measured on a basis inconsistent with that applied to investment
69MetLife, Inc.
companies. Additionally, SOP 07-1 precludes retention of specialized accounting for investment companies if the reporting entity does not
distinguish through documented policies the nature and type of investments to be held in the investment companies from those made in
the consolidated group where other accounting guidance is being applied. In February 2008, the FASB issued FSP No. SOP 7-1-1,
Effective Date of AICPA Statement of Position 07-1, which delays indefinitely the effective date of SOP 07-1. The Company is closely
monitoring further FASB developments.
In May 2007, the FASB issued FSP No. FIN 39-1, Amendment of FASB Interpretation No. 39 (“FSP 39-1”). FSP 39-1 amends FIN No. 39,
Offsetting of Amounts Related to Certain Contracts (“FIN 39”), to permit a reporting entity to offset fair value amounts recognized for the
right to reclaim cash collateral (a receivable) or the obligation to return cash collateral (a payable) against fair value amounts recognized for
derivative instruments executed with the same counterparty under the same master netting arrangement that have been offset in
accordance with FIN 39. FSP 39-1 also amends FIN 39 for certain terminology modifications. FSP 39-1 applies to fiscal years beginning
after November 15, 2007. FSP 39-1 will be applied retrospectively, unless it is impracticable to do so. Upon adoption of FSP 39-1, the
Company is permitted to change its accounting policy to offset or not offset fair value amounts recognized for derivative instruments under
master netting arrangements. The adoption of FSP 39-1 will not have an impact on the Company’s financial statements.
Business Combinations
In December 2007, the FASB issued SFAS No. 141 (revised 2007), Business Combinations — A Replacement of FASB Statement
No. 141 (“SFAS 141(r)”) and SFAS No. 160, Noncontrolling Interests in Consolidated Financial Statements — An Amendment of ARB
No. 51 (“SFAS 160”) which are effective for fiscal years beginning after December 15, 2008. Under SFAS 141(r) and SFAS 160:
• All business combinations (whether full, partial, or “step” acquisitions) result in all assets and liabilities of an acquired business being
recorded at fair value, with limited exceptions.
• Acquisition costs are generally expensed as incurred; restructuring costs associated with a business combination are generally
expensed as incurred subsequent to the acquisition date.
• The fair value of the purchase price, including the issuance of equity securities, is determined on the acquisition date.
• Certain acquired contingent liabilities are recorded at fair value at the acquisition date and subsequently measured at either the higher
of such amount or the amount determined under existing guidance for non-acquired contingencies.
• Changes in deferred tax asset valuation allowances and income tax uncertainties after the acquisition date generally affect income
tax expense.
• Noncontrolling interests (formerly known as “minority interests”) are valued at fair value at the acquisition date and are presented as
equity rather than liabilities.
• When control is attained on previously noncontrolling interests, the previously held equity interests are remeasured at fair value and a
gain or loss is recognized.
• Purchases or sales of equity interests that do not result in a change in control are accounted for as equity transactions.
• When control is lost in a partial disposition, realized gains or losses are recorded on equity ownership sold and the remaining
ownership interest is remeasured and holding gains or losses are recognized.
The pronouncements are effective for fiscal years beginning on or after December 15, 2008 and apply prospectively to business
combinations. Presentation and disclosure requirements related to noncontrolling interests must be retrospectively applied. The Company
is currently evaluating the impact of SFAS 141(r) on its accounting for future acquisitions and the impact of SFAS 160 on its consolidated
financial statements.
Other
In February 2008, the FASB issued FSP No. FAS 140-3, Accounting for Transfers of Financial Assets and Repurchase Financing
Transactions (“FSP 140-3”). FSP 140-3 provides guidance for evaluating whether to account for a transfer of a financial asset and
repurchase financing as a single transaction or as two separate transactions. FSP 140-3 is effective prospectively for financial statements
issued for fiscal years beginning after November 15, 2008. The Company is currently evaluating the impact of FSP FAS 140-3 on its
consolidated financial statements.
In January 2008, the FASB cleared SFAS 133 Implementation Issue E23, Clarification of the Application of the Shortcut Method (“Issue
E23”). Issue E23 amends SFAS 133 by permitting interest rate swaps to have a non-zero fair value at inception, as long as the difference
between the transaction price (zero) and the fair value (exit price), as defined by SFAS 157, is solely attributable to a bid-ask spread. In
addition, entities would not be precluded from assuming no ineffectiveness in a hedging relationship of interest rate risk involving an
interest bearing asset or liability in situations where the hedged item is not recognized for accounting purposes until settlement date as long
as the period between trade date and settlement date of the hedged item is consistent with generally established conventions in the
marketplace. Issue E23 is effective for hedging relationships designated on or after January 1, 2008. The Company does not expect the
adoption of Issue E23 to have a material impact on its consolidated financial statements.
In December 2007, the FASB ratified as final the consensus on EITF Issue No. 07-6, Accounting for the Sale of Real Estate When the
Agreement Includes a Buy-Sell Clause (“EITF 07-6”). EITF 07-6 addresses whether the existence of a buy-sell arrangement would preclude
partial sales treatment when real estate is sold to a jointly owned entity. The consensus concludes that the existence of a buy-sell clause
does not necessarily preclude partial sale treatment under current guidance. EITF 07-6 applies prospectively to new arrangements entered
into and assessments on existing transactions performed in fiscal years beginning after December 15, 2008. The Company does not
expect the adoption of EITF 07-6 to have a material impact on its consolidated financial statements.
In November 2007, the SEC issued SAB No. 109, Written Loan Commitments Recorded at Fair Value through Earnings (“SAB 109”),
which amends SAB No. 105, Application of Accounting Principles to Loan Commitments. SAB 109 provides guidance on: (i) incorporating
expected net future cash flows when related to the associated servicing of a loan when measuring fair value; and (ii) broadening the SEC
staff’s view that internally-developed intangible assets should not be recorded as part of the fair value of a derivative loan commitment or to
written loan commitments that are accounted for at fair value through earnings. Internally-developed intangible assets are not considered a
component of the related instruments. SAB 109 is effective for derivative loan commitments issued or modified in fiscal quarters beginning
after December 15, 2007. The adoption of SAB 109 will not have an impact on the Company’s consolidated financial statements.
70 MetLife, Inc.
Investments
The Company’s primary investment objective is to optimize, net of income tax, risk-adjusted investment income and risk-adjusted total
return while ensuring that assets and liabilities are managed on a cash flow and duration basis. The Company is exposed to three primary
sources of investment risk:
• credit risk, relating to the uncertainty associated with the continued ability of a given obligor to make timely payments of principal and
interest;
• interest rate risk, relating to the market price and cash flow variability associated with changes in market interest rates; and
• market valuation risk.
The Company manages risk through in-house fundamental analysis of the underlying obligors, issuers, transaction structures and real
estate properties. The Company also manages credit risk and market valuation risk through industry and issuer diversification and asset
allocation. For real estate and agricultural assets, the Company manages credit risk and market valuation risk through geographic, property
type and product type diversification and asset allocation. The Company manages interest rate risk as part of its asset and liability
management strategies; product design, such as the use of market value adjustment features and surrender charges; and proactive
monitoring and management of certain non-guaranteed elements of its products, such as the resetting of credited interest and dividend
rates for policies that permit such adjustments. The Company also uses certain derivative instruments in the management of credit and
interest rate risks.
71MetLife, Inc.
Composition of Investment Portfolio Results
The following table illustrates the net investment income, net investment gains (losses), annualized yields on average ending assets and
ending carrying value for each of the components of the Company’s investment portfolio at:
2007 2006 2005
December 31,
(In millions)
FIXED MATURITY SECURITIES
Yield(1) . . . . . . . . . . . . . . . . . . . . . . . . . . . . . . . . . . . . . . . . . . . . . . . . . . 6.34% 6.16% 6.41%
Investment income(2). . . . . . . . . . . . . . . . . . . . . . . . . . . . . . . . . . . . . . . . . $ 12,882 $ 11,977 $ 10,351
Investment gains (losses) . . . . . . . . . . . . . . . . . . . . . . . . . . . . . . . . . . . . . . $ (622) $ (1,120) $ (868)
Ending carrying value(2) . . . . . . . . . . . . . . . . . . . . . . . . . . . . . . . . . . . . . . . $243,021 $242,687 $229,303
MORTGAGE AND CONSUMER LOANS
Yield(1) . . . . . . . . . . . . . . . . . . . . . . . . . . . . . . . . . . . . . . . . . . . . . . . . . . 6.55% 6.60% 6.81%
Investment income(3). . . . . . . . . . . . . . . . . . . . . . . . . . . . . . . . . . . . . . . . . $ 2,701 $ 2,411 $ 2,236
Investment gains (losses) . . . . . . . . . . . . . . . . . . . . . . . . . . . . . . . . . . . . . . $ 2 $ (8) $ 17
Ending carrying value . . . . . . . . . . . . . . . . . . . . . . . . . . . . . . . . . . . . . . . . $ 47,030 $ 42,239 $ 37,190
REAL ESTATE AND REAL ESTATE JOINT VENTURES(4)
Yield(1) . . . . . . . . . . . . . . . . . . . . . . . . . . . . . . . . . . . . . . . . . . . . . . . . . . 10.28% 11.55% 10.59%
Investment income . . . . . . . . . . . . . . . . . . . . . . . . . . . . . . . . . . . . . . . . . . $ 607 $ 549 $ 467
Investment gains (losses) . . . . . . . . . . . . . . . . . . . . . . . . . . . . . . . . . . . . . . $ 57 $ 4,898 $ 2,139
Ending carrying value . . . . . . . . . . . . . . . . . . . . . . . . . . . . . . . . . . . . . . . . $ 6,769 $ 4,986 $ 4,665
POLICY LOANS
Yield(1) . . . . . . . . . . . . . . . . . . . . . . . . . . . . . . . . . . . . . . . . . . . . . . . . . . 6.21% 5.99% 6.00%
Investment income . . . . . . . . . . . . . . . . . . . . . . . . . . . . . . . . . . . . . . . . . . $ 637 $ 603 $ 572
Ending carrying value . . . . . . . . . . . . . . . . . . . . . . . . . . . . . . . . . . . . . . . . $ 10,419 $ 10,228 $ 9,981
EQUITY SECURITIES AND OTHER LIMITED PARTNERSHIP INTERESTS
Yield(1) . . . . . . . . . . . . . . . . . . . . . . . . . . . . . . . . . . . . . . . . . . . . . . . . . . 15.59% 14.90% 12.83%
Investment income . . . . . . . . . . . . . . . . . . . . . . . . . . . . . . . . . . . . . . . . . . $ 1,567 $ 1,067 $ 798
Investment gains (losses) . . . . . . . . . . . . . . . . . . . . . . . . . . . . . . . . . . . . . . $ 180 $ 85 $ 159
Ending carrying value . . . . . . . . . . . . . . . . . . . . . . . . . . . . . . . . . . . . . . . . $ 12,205 $ 9,875 $ 7,614
CASH AND SHORT-TERM INVESTMENTS
Yield(1) . . . . . . . . . . . . . . . . . . . . . . . . . . . . . . . . . . . . . . . . . . . . . . . . . . 4.74% 5.51% 3.66%
Investment income . . . . . . . . . . . . . . . . . . . . . . . . . . . . . . . . . . . . . . . . . . $ 437 $ 442 $ 362
Investment gains (losses) . . . . . . . . . . . . . . . . . . . . . . . . . . . . . . . . . . . . . . $ 3 $ (2) $ (2)
Ending carrying value . . . . . . . . . . . . . . . . . . . . . . . . . . . . . . . . . . . . . . . . $ 13,016 $ 9,816 $ 7,324
OTHER INVESTED ASSETS(5)
Yield(1) . . . . . . . . . . . . . . . . . . . . . . . . . . . . . . . . . . . . . . . . . . . . . . . . . . 8.98% 9.60% 8.96%
Investment income . . . . . . . . . . . . . . . . . . . . . . . . . . . . . . . . . . . . . . . . . . $ 887 $ 821 $ 570
Investment gains (losses) . . . . . . . . . . . . . . . . . . . . . . . . . . . . . . . . . . . . . . $ (627) $ (736) $ 508
Ending carrying value . . . . . . . . . . . . . . . . . . . . . . . . . . . . . . . . . . . . . . . . $ 12,642 $ 10,428 $ 8,078
TOTAL INVESTMENTS
Gross investment income yield(1) . . . . . . . . . . . . . . . . . . . . . . . . . . . . . . . . . 6.81% 6.62% 6.66%
Investment fees and expenses yield . . . . . . . . . . . . . . . . . . . . . . . . . . . . . . . (0.15)% (0.15)% (0.15)%
NET INVESTMENT INCOME YIELD . . . . . . . . . . . . . . . . . . . . . . . . . . . . . 6.66% 6.47% 6.51%
Gross investment income . . . . . . . . . . . . . . . . . . . . . . . . . . . . . . . . . . . . . . $ 19,718 $ 17,870 $ 15,356
Investment fees and expenses. . . . . . . . . . . . . . . . . . . . . . . . . . . . . . . . . . . (440) (404) (339)
NET INVESTMENT INCOME . . . . . . . . . . . . . . . . . . . . . . . . . . . . . . . . . . $ 19,278 $ 17,466 $ 15,017
Ending carrying value . . . . . . . . . . . . . . . . . . . . . . . . . . . . . . . . . . . . . . . . $345,102 $330,259 $304,155
Gross investment gains . . . . . . . . . . . . . . . . . . . . . . . . . . . . . . . . . . . . . . . $ 1,440 $ 5,754 $ 3,340
Gross investment losses . . . . . . . . . . . . . . . . . . . . . . . . . . . . . . . . . . . . . . (1,765) (2,036) (1,578)
Writedowns . . . . . . . . . . . . . . . . . . . . . . . . . . . . . . . . . . . . . . . . . . . . . . . (148) (136) (116)
Subtotal . . . . . . . . . . . . . . . . . . . . . . . . . . . . . . . . . . . . . . . . . . . . . . . . . $ (473) $ 3,582 $ 1,646
Derivative and other instruments not qualifying for hedge accounting . . . . . . . . . . (534) (465) 307
INVESTMENT GAINS (LOSSES) . . . . . . . . . . . . . . . . . . . . . . . . . . . . . . . . $ (1,007) $ 3,117 $ 1,953
Minority interest — investment gains (losses) . . . . . . . . . . . . . . . . . . . . . . . . . 33 — (9)
Investment gains (losses) tax benefit (provision) . . . . . . . . . . . . . . . . . . . . . . . . 326 (1,114) (681)
INVESTMENT GAINS (LOSSES), NET OF INCOME TAX . . . . . . . . . . . . . . . $ (648) $ 2,003 $ 1,263
(1) Yields are based on quarterly average asset carrying values, excluding recognized and unrealized investment gains (losses), and for yield
calculation purposes, average assets exclude collateral associated with the Company’s securities lending program.
(2) Fixed maturity securities include $779 million, $759 million and $825 million in ending carrying value related to trading securities at
December 31, 2007, 2006 and 2005, respectively. Fixed maturity securities include $50 million, $71 million and $14 million of investment
income related to trading securities for the years ended December 31, 2007, 2006 and 2005, respectively.
(3) Investment income from mortgage and consumer loans includes prepayment fees.
72 MetLife, Inc.
(4) Included in investment income from real estate and real estate joint ventures is $16 million, $94 million and $162 million related to
discontinued operations for the years ended December 31, 2007, 2006 and 2005, respectively. Included in investment gains (losses)
from real estate and real estate joint ventures is $13 million, $4.8 billion and $2.1 billion of gains related to discontinued operations for the
years ended December 31, 2007, 2006 and 2005, respectively.
(5) Included in investment income from other invested assets are scheduled periodic settlement payments on derivative instruments that do
not qualify for hedge accounting under SFAS No. 133, Accounting for Derivative Instruments and Hedging, of $256 million, $290 million
and $99 million for the years ended December 31, 2007, 2006 and 2005, respectively. These amounts are excluded from investment
gains (losses). Additionally, excluded from investment gains (losses) is $26 million, $6 million and ($13) million for the years ended
December 31, 2007, 2006 and 2005, respectively, related to settlement payments on derivatives used to hedge interest rate and
currency risk on policyholders account balances that do not qualify for hedge accounting. Such amounts are included within interest
credited to policyholders account balances.
Fixed Maturity and Equity Securities Available-for-Sale
Fixed maturity securities consisted principally of publicly traded and privately placed debt securities, and represented 70% and 73% of
total cash and invested assets at December 31, 2007 and 2006, respectively. Based on estimated fair value, public fixed maturity
securities represented $205.4 billion, or 85%, and $209.2 billion, or 86%, of total fixed maturity securities at December 31, 2007 and
2006, respectively. Based on estimated fair value, private fixed maturity securities represented $36.8 billion, or 15%, and $32.7 billion, or
14%, of total fixed maturity securities at December 31, 2007 and 2006, respectively.
In cases where quoted market prices are not available, fair values are estimated using present value or valuation techniques. The fair
value estimates are made at a specific point in time, based on available market information and judgments about the financial instruments,
including estimates of the timing and amounts of expected future cash flows and the credit standing of the issuer or counterparty. Factors
considered in estimating fair value include: coupon rate, maturity, estimated duration, call provisions, sinking fund requirements, credit
rating, industry sector of the issuer and quoted market prices of comparable securities.
The Securities Valuation Office of the NAIC evaluates the fixed maturity investments of insurers for regulatory reporting purposes and
assigns securities to one of six investment categories called “NAIC designations.” The NAIC ratings are similar to the rating agency
designations of the Nationally Recognized Statistical Rating Organizations (“NRSROs”) for marketable bonds. NAIC ratings 1 and 2 include
bonds generally considered investment grade (rated “Baa3” or higher by Moody’s, or rated “BBB-” or higher by Standard & Poor’s (“S&P”)
and Fitch Ratings Insurance Group (“Fitch”)), by such rating organizations. NAIC ratings 3 through 6 include bonds generally considered
below investment grade (rated “Ba1” or lower by Moody’s, or rated “BB+” or lower by S&P and Fitch).
The following table presents the Company’s total fixed maturity securities by NRSRO designation and the equivalent ratings of the NAIC,
as well as the percentage, based on estimated fair value, that each designation is comprised of at:
NAIC
Rating Rating Agency Designation(1)
Cost or
Amortized
Cost
Estimated
Fair Value
% of
Total
Cost or
Amortized
Cost
Estimated
Fair Value
% of
Total
December 31, 2007 December 31, 2006
(In millions)
1 Aaa/Aa/A . . . . . . . . . . . . . . . . . . . . . . $172,711 $175,651 72.5% $174,430 $177,969 73.6%
2 Baa . . . . . . . . . . . . . . . . . . . . . . . . . . 48,265 48,914 20.2 45,897 46,881 19.4
3 Ba . . . . . . . . . . . . . . . . . . . . . . . . . . . 10,676 10,738 4.4 9,332 9,738 4.0
4 B . . . . . . . . . . . . . . . . . . . . . . . . . . . 6,632 6,481 2.7 6,814 7,030 2.9
5 Caa and lower . . . . . . . . . . . . . . . . . . . 476 445 0.2 283 294 0.1
6 In or near default . . . . . . . . . . . . . . . . . 1 13 — 12 16 —
Total fixed maturity securities . . . . . . . . . . $238,761 $242,242 100.0% $236,768 $241,928 100.0%
(1) Amounts presented are based on rating agency designations. Comparisons between NAIC ratings and rating agency designations are
published by the NAIC. The rating agency designations are based on availability and the midpoint of the applicable ratings among
Moody’s, S&P and Fitch. If no rating is available from a rating agency, then the MetLife rating is used.
The Company held fixed maturity securities at estimated fair values that were below investment grade or not rated by an independent
rating agency that totaled $17.7 billion and $17.3 billion at December 31, 2007 and 2006, respectively. These securities had net unrealized
gains (losses) of ($108) million and $627 million at December 31, 2007 and 2006, respectively. Non-income producing fixed maturity
securities were $13 million and $16 million at December 31, 2007 and 2006, respectively. Net unrealized gains associated with non-
income producing fixed maturity securities were $12 million and $4 million at December 31, 2007 and 2006, respectively.
73MetLife, Inc.
The amortized cost and estimated fair value of fixed maturity securities, by contractual maturity date (excluding scheduled sinking
funds), are as follows:
Amortized
Cost
Estimated
Fair Value
Amortized
Cost
Estimated
Fair Value
2007 2006
December 31,
(In millions)
Due in one year or less . . . . . . . . . . . . . . . . . . . . . . . . . . . . . . . $ 4,537 $ 4,628 $ 6,923 $ 7,011
Due after one year through five years . . . . . . . . . . . . . . . . . . . . . . 42,453 43,167 45,331 45,928
Due after five years through ten years . . . . . . . . . . . . . . . . . . . . . 40,783 41,046 39,571 40,200
Due after ten years . . . . . . . . . . . . . . . . . . . . . . . . . . . . . . . . . . 65,496 68,143 63,023 66,728
Subtotal . . . . . . . . . . . . . . . . . . . . . . . . . . . . . . . . . . . 153,269 156,984 154,848 159,867
Mortgage-backed and asset-backed securities . . . . . . . . . . . . . . . 85,492 85,258 81,920 82,061
Total fixed maturity securities . . . . . . . . . . . . . . . . . . . . . $238,761 $242,242 $236,768 $241,928
Fixed maturity securities not due at a single maturity date have been included in the above table in the year of final contractual maturity.
Actual maturities may differ from contractual maturities due to the exercise of prepayment options.
Sales or disposals of fixed maturity and equity securities classified as available-for-sale are as follows:
2007 2006 2005
Years Ended December 31,
(In millions)
Proceeds . . . . . . . . . . . . . . . . . . . . . . . . . . . . . . . . . . . . . . . . . . . . . . . . . . $80,685 $89,869 $127,709
Gross investment gains . . . . . . . . . . . . . . . . . . . . . . . . . . . . . . . . . . . . . . . . . $ 831 $ 580 $ 704
Gross investment losses . . . . . . . . . . . . . . . . . . . . . . . . . . . . . . . . . . . . . . . . $ (1,183) $ (1,533) $ (1,391)
The following tables present the cost or amortized cost, gross unrealized gain and loss, and estimated fair value of the Company’s fixed
maturity and equity securities, the percentage that each sector represents by the total fixed maturity securities holdings and by the total
equity securities holdings at:
Cost or
Amortized
Cost Gain Loss
Estimated
Fair Value
% of
Total
Gross Unrealized
December 31, 2007
(In millions)
U.S. corporate securities . . . . . . . . . . . . . . . . . . . . . . . . . . . $ 77,875 $1,725 $2,174 $ 77,426 32.0%
Residential mortgage-backed securities . . . . . . . . . . . . . . . . . . 56,267 611 389 56,489 23.3
Foreign corporate securities . . . . . . . . . . . . . . . . . . . . . . . . . 37,359 1,740 794 38,305 15.8
U.S. Treasury/agency securities . . . . . . . . . . . . . . . . . . . . . . . 19,771 1,487 13 21,245 8.8
Commercial mortgage-backed securities . . . . . . . . . . . . . . . . . 17,676 251 199 17,728 7.3
Foreign government securities . . . . . . . . . . . . . . . . . . . . . . . . 13,535 1,924 188 15,271 6.3
Asset-backed securities . . . . . . . . . . . . . . . . . . . . . . . . . . . . 11,549 41 549 11,041 4.6
State and political subdivision securities . . . . . . . . . . . . . . . . . 4,394 140 115 4,419 1.8
Other fixed maturity securities . . . . . . . . . . . . . . . . . . . . . . . . 335 13 30 318 0.1
Total fixed maturity securities . . . . . . . . . . . . . . . . . . . . . . . $238,761 $7,932 $4,451 $242,242 100.0%
Common stock . . . . . . . . . . . . . . . . . . . . . . . . . . . . . . . . . . $ 2,488 $ 568 $ 108 $ 2,948 48.7%
Non-redeemable preferred stock . . . . . . . . . . . . . . . . . . . . . . 3,403 61 362 3,102 51.3
Total equity securities(1) . . . . . . . . . . . . . . . . . . . . . . $ 5,891 $ 629 $ 470 $ 6,050 100.0%
74 MetLife, Inc.
Cost or
Amortized
Cost Gain Loss
Estimated
Fair Value
% of
Total
Gross Unrealized
December 31, 2006
(In millions)
U.S. corporate securities . . . . . . . . . . . . . . . . . . . . . . . . . . . $ 74,010 $2,047 $ 983 $ 75,074 31.0%
Residential mortgage-backed securities . . . . . . . . . . . . . . . . . . 51,602 385 321 51,666 21.4
Foreign corporate securities . . . . . . . . . . . . . . . . . . . . . . . . . 33,029 1,687 378 34,338 14.2
U.S. Treasury/agency securities . . . . . . . . . . . . . . . . . . . . . . . 29,897 984 248 30,633 12.7
Commercial mortgage-backed securities . . . . . . . . . . . . . . . . . 16,467 193 138 16,522 6.8
Foreign government securities . . . . . . . . . . . . . . . . . . . . . . . . 11,406 1,835 34 13,207 5.4
Asset-backed securities . . . . . . . . . . . . . . . . . . . . . . . . . . . . 13,851 75 53 13,873 5.7
State and political subdivision securities . . . . . . . . . . . . . . . . . 6,121 230 51 6,300 2.6
Other fixed maturity securities . . . . . . . . . . . . . . . . . . . . . . . . 385 7 77 315 0.2
Total fixed maturity securities . . . . . . . . . . . . . . . . . . . . . . . $236,768 $7,443 $2,283 $241,928 100.0%
Common stock . . . . . . . . . . . . . . . . . . . . . . . . . . . . . . . . . . $ 1,798 $ 487 $ 16 $ 2,269 44.5%
Non-redeemable preferred stock . . . . . . . . . . . . . . . . . . . . . . 2,751 103 29 2,825 55.5
Total equity securities(1) . . . . . . . . . . . . . . . . . . . . . . $ 4,549 $ 590 $ 45 $ 5,094 100.0%
(1) Equity securities primarily consist of investments in common and preferred stocks and mutual fund interests. Such securities include
private equity securities with an estimated fair value of $599 million and $238 million at December 31, 2007 and 2006, respectively.
The Company is not exposed to any significant concentrations of credit risk in its equity securities portfolio. The Company is exposed to
concentrations of credit risk related to U.S. Treasury securities and obligations of U.S. government corporations and agencies. Addi-
tionally, at December 31, 2007 and 2006, the Company had exposure to fixed maturity securities backed by sub-prime mortgages with
estimated fair values of $2.2 billion and $3.0 billion, respectively, and unrealized losses of $219 million and $5 million, respectively. These
securities are classified within asset-backed securities in the immediately preceding table. At December 31, 2007, 32% have been
guaranteed by financial guarantors, of which 55% was guaranteed by financial guarantors who remain Aaa rated in 2008. Overall, at
December 31, 2007, $6.7 billion of the estimated fair value of the Company’s fixed maturity securities were credit enhanced by financial
guarantors of which $2.5 billion, $2.5 billion and $1.7 billion at December 31, 2007, are included within state and political subdivisions,
corporate securities and asset-backed securities, respectively, and 80% were guaranteed by financial guarantors who remain Aaa rated in
2008.
Fixed Maturity and Equity Security Impairment. The Company classifies all of its fixed maturity and equity securities as available-for-
sale and marks them to market through other comprehensive income, except for non-marketable private equities, which are generally
carried at cost and trading securities which are carried at fair value with subsequent changes in fair value recognized in net investment
income. All securities with gross unrealized losses at the consolidated balance sheet date are subjected to the Company’s process for
identifying other-than-temporary impairments. The Company writes down to fair value securities that it deems to be other-than-temporarily
impaired in the period the securities are deemed to be so impaired. The assessment of whether such impairment has occurred is based on
management’s case-by-case evaluation of the underlying reasons for the decline in fair value. Management considers a wide range of
factors, as described in “— Summary of Critical Accounting Estimates — Investments,” about the security issuer and uses its best
judgment in evaluating the cause of the decline in the estimated fair value of the security and in assessing the prospects for near-term
recovery. Inherent in management’s evaluation of the security are assumptions and estimates about the operations of the issuer and its
future earnings potential.
The Company’s review of its fixed maturity and equity securities for impairments includes an analysis of the total gross unrealized losses
by three categories of securities: (i) securities where the estimated fair value had declined and remained below cost or amortized cost by
less than 20%; (ii) securities where the estimated fair value had declined and remained below cost or amortized cost by 20% or more for
less than six months; and (iii) securities where the estimated fair value had declined and remained below cost or amortized cost by 20% or
more for six months or greater. While all of these securities are monitored for potential impairment, the Company’s experience indicates that
the first two categories do not present as great a risk of impairment and, often, fair values recover over time as the factors that caused the
declines improve.
The Company records impairments as investment losses and adjusts the cost basis of the fixed maturity and equity securities
accordingly. The Company does not change the revised cost basis for subsequent recoveries in value. Impairments of fixed maturity and
equity securities were $106 million, $82 million and $64 million for the years ended December 31, 2007, 2006 and 2005, respectively. The
Company’s credit-related impairments of fixed maturity and equity securities were $86 million, $82 million and $64 million for the years
ended December 31, 2007, 2006 and 2005, respectively. The Company’s three largest impairments totaled $19 million, $33 million and
$40 million for the years ended December 31, 2007, 2006 and 2005, respectively. The circumstances that gave rise to these impairments
were financial restructurings, bankruptcy filings or difficult underlying operating environments for the entities concerned. During the years
ended December 31, 2007, 2006 and 2005, the Company sold or disposed of fixed maturity and equity securities at a loss that had a fair
value of $46.8 billion, $70.3 billion and $93.9 billion, respectively. Gross losses excluding impairments for fixed maturity and equity
securities were $1.2 billion, $1.5 billion and $1.4 billion for the years ended December 31, 2007, 2006 and 2005, respectively.
75MetLife, Inc.
The following tables present the cost or amortized cost, gross unrealized loss and number of securities for fixed maturity and equity
securities, where the estimated fair value had declined and remained below cost or amortized cost by less than 20%, or 20% or more at:
Less than
20%
20% or
more
Less than
20%
20% or
more
Less than
20%
20% or
more
Cost or Amortized Cost
Gross Unrealized
Loss
Number of
Securities
December 31, 2007
(In millions, except number of securities)
Less than six months . . . . . . . . . . . . . . . . . . . . . . . . . . . . . . . . . . . $ 49,463 $1,943 $1,670 $555 6,339 644
Six months or greater but less than nine months. . . . . . . . . . . . . . . . . . 17,353 23 844 7 1,461 31
Nine months or greater but less than twelve months . . . . . . . . . . . . . . . 9,410 7 568 2 791 1
Twelve months or greater . . . . . . . . . . . . . . . . . . . . . . . . . . . . . . . . . 31,731 50 1,262 13 3,192 32
Total . . . . . . . . . . . . . . . . . . . . . . . . . . . . . . . . . . . . . . . . $107,957 $2,023 $4,344 $577
Less than
20%
20% or
more
Less than
20%
20% or
more
Less than
20%
20% or
more
Cost or Amortized
Cost
Gross Unrealized
Loss
Number of
Securities
December 31, 2006
(In millions, except number of securities)
Less than six months . . . . . . . . . . . . . . . . . . . . . . . . . . . . . . . . . . $ 52,222 $35 $ 547 $12 9,093 81
Six months or greater but less than nine months . . . . . . . . . . . . . . . . . 2,682 3 42 1 415 2
Nine months or greater but less than twelve months . . . . . . . . . . . . . . 12,049 14 204 4 937 1
Twelve months or greater . . . . . . . . . . . . . . . . . . . . . . . . . . . . . . . . 47,462 29 1,511 7 4,634 6
Total. . . . . . . . . . . . . . . . . . . . . . . . . . . . . . . . . . . . . . . . $114,415 $81 $2,304 $24
At December 31, 2007 and 2006, $4.3 billion and $2.3 billion, respectively, of unrealized losses related to securities with an unrealized
loss position of less than 20% of cost or amortized cost, which represented 4% and 2%, respectively, of the cost or amortized cost of such
securities.
At December 31, 2007, $577 million of unrealized losses related to securities with an unrealized loss position of 20% or more of cost or
amortized cost, which represented 29% of the cost or amortized cost of such securities. Of such unrealized losses of $577 million,
$555 million related to securities that were in an unrealized loss position for a period of less than six months. At December 31, 2006,
$24 million of unrealized losses related to securities with an unrealized loss position of 20% or more of cost or amortized cost, which
represented 30% of the cost or amortized cost of such securities. Of such unrealized losses of $24 million, $12 million related to securities
that were in an unrealized loss position for a period of less than six months.
The Company held 30 fixed maturity and equity securities, each with a gross unrealized loss at December 31, 2007 of greater than
$10 million. These securities represented 9%, or $459 million in the aggregate, of the gross unrealized loss on fixed maturity and equity
securities. The Company held eight fixed maturity and equity securities, each with a gross unrealized loss at December 31, 2006 of greater
than $10 million. These securities represented 7%, or $169 million in the aggregate, of the gross unrealized loss on fixed maturity and
equity securities.
At December 31, 2007 and 2006, the Company had $4.9 billion and $2.3 billion, respectively, of gross unrealized losses related to its
fixed maturity and equity securities. These securities are concentrated, calculated as a percentage of gross unrealized loss, as follows:
2007 2006
December 31,
Sector:
U.S. corporate securities . . . . . . . . . . . . . . . . . . . . . . . . . . . . . . . . . . . . . . . . . . . . . . . . . . . . . 44% 42%
Foreign corporate securities . . . . . . . . . . . . . . . . . . . . . . . . . . . . . . . . . . . . . . . . . . . . . . . . . . . 16 16
Asset-backed securities . . . . . . . . . . . . . . . . . . . . . . . . . . . . . . . . . . . . . . . . . . . . . . . . . . . . . . 11 2
Residential mortgage-backed securities . . . . . . . . . . . . . . . . . . . . . . . . . . . . . . . . . . . . . . . . . . . . 8 14
Foreign government securities . . . . . . . . . . . . . . . . . . . . . . . . . . . . . . . . . . . . . . . . . . . . . . . . . . 4 1
Commercial mortgage-backed securities . . . . . . . . . . . . . . . . . . . . . . . . . . . . . . . . . . . . . . . . . . . 4 6
U.S. Treasury/agency securities . . . . . . . . . . . . . . . . . . . . . . . . . . . . . . . . . . . . . . . . . . . . . . . . . — 11
Other . . . . . . . . . . . . . . . . . . . . . . . . . . . . . . . . . . . . . . . . . . . . . . . . . . . . . . . . . . . . . . . . . . 13 8
Total . . . . . . . . . . . . . . . . . . . . . . . . . . . . . . . . . . . . . . . . . . . . . . . . . . . . . . . . . . . . . 100% 100%
Industry:
Finance. . . . . . . . . . . . . . . . . . . . . . . . . . . . . . . . . . . . . . . . . . . . . . . . . . . . . . . . . . . . . . . . . 34% 10%
Industrial . . . . . . . . . . . . . . . . . . . . . . . . . . . . . . . . . . . . . . . . . . . . . . . . . . . . . . . . . . . . . . . . 18 23
Mortgage-backed . . . . . . . . . . . . . . . . . . . . . . . . . . . . . . . . . . . . . . . . . . . . . . . . . . . . . . . . . . 12 20
Utility . . . . . . . . . . . . . . . . . . . . . . . . . . . . . . . . . . . . . . . . . . . . . . . . . . . . . . . . . . . . . . . . . . 8 11
Government . . . . . . . . . . . . . . . . . . . . . . . . . . . . . . . . . . . . . . . . . . . . . . . . . . . . . . . . . . . . . . 4 12
Other . . . . . . . . . . . . . . . . . . . . . . . . . . . . . . . . . . . . . . . . . . . . . . . . . . . . . . . . . . . . . . . . . . 24 24
Total . . . . . . . . . . . . . . . . . . . . . . . . . . . . . . . . . . . . . . . . . . . . . . . . . . . . . . . . . . . . . 100% 100%
76 MetLife, Inc.
As described previously, the Company performs a regular evaluation, on a security-by-security basis, of its investment holdings in
accordance with its impairment policy in order to evaluate whether such securities are other-than-temporarily impaired. One of the criteria
which the Company considers in its other-than-temporary impairment analysis is its intent and ability to hold securities for a period of time
sufficient to allow for the recovery of their value to an amount equal to or greater than cost or amortized cost. The Company’s intent and
ability to hold securities considers broad portfolio management objectives such as asset/liability duration management, issuer and industry
segment exposures, interest rate views and the overall total return focus. In following these portfolio management objectives, changes in
facts and circumstances that were present in past reporting periods may trigger a decision to sell securities that were held in prior reporting
periods. Decisions to sell are based on current conditions or the Company’s need to shift the portfolio to maintain its portfolio management
objectives including liquidity needs or duration targets on asset/liability managed portfolios. The Company attempts to anticipate these
types of changes and if a sale decision has been made on an impaired security and that security is not expected to recover prior to the
expected time of sale, the security will be deemed other-than-temporarily impaired in the period that the sale decision was made and an
other-than-temporary impairment loss will be recognized.
Based upon the Company’s current evaluation of the securities in accordance with its impairment policy, the cause of the decline being
principally attributable to the general rise in interest rates during the holding period, and the Company’s current intent and ability to hold the
fixed maturity and equity securities with unrealized losses for a period of time sufficient for them to recover, the Company has concluded
that the aforementioned securities are not other-than-temporarily impaired.
Corporate Fixed Maturity Securities. The table below shows the major industry types that comprise the corporate fixed maturity
holdings at:
Estimated
Fair Value
% of
Total
Estimated
Fair Value
% of
Total
December 31, 2007 December 31, 2006
(In millions)
Industrial . . . . . . . . . . . . . . . . . . . . . . . . . . . . . . . . . . . . . . . . . . . . . $ 40,399 34.9% $ 39,296 35.9%
Foreign(1) . . . . . . . . . . . . . . . . . . . . . . . . . . . . . . . . . . . . . . . . . . . . 38,305 33.1 34,338 31.5
Finance . . . . . . . . . . . . . . . . . . . . . . . . . . . . . . . . . . . . . . . . . . . . . . 22,013 19.0 21,559 19.7
Utility . . . . . . . . . . . . . . . . . . . . . . . . . . . . . . . . . . . . . . . . . . . . . . . . 13,780 11.9 13,038 11.9
Other . . . . . . . . . . . . . . . . . . . . . . . . . . . . . . . . . . . . . . . . . . . . . . . 1,234 1.1 1,181 1.0
Total . . . . . . . . . . . . . . . . . . . . . . . . . . . . . . . . . . . . . . . . . . $115,731 100.0% $109,412 100.0%
(1) Includes U.S. dollar-denominated debt obligations of foreign obligors, and other foreign investments.
The Company maintains a diversified corporate fixed maturity portfolio across industries and issuers. The portfolio does not have
exposure to any single issuer in excess of 1% of the total invested assets of the portfolio. At December 31, 2007 and 2006, the Company’s
combined holdings in the ten issuers to which it had the greatest exposure totaled $7.8 billion and $6.8 billion, respectively, each less than
3% of the Company’s total invested assets at such dates. The exposure to the largest single issuer of corporate fixed maturity securities
held at December 31, 2007 and 2006 was $1.2 billion and $970 million, respectively.
The Company has hedged all of its material exposure to foreign currency risk in its corporate fixed maturity portfolio. In the Company’s
international insurance operations, both its assets and liabilities are generally denominated in local currencies.
Structured Securities. The following table shows the types of structured securities the Company held at:
Estimated
Fair Value
% of
Total
Estimated
Fair Value
% of
Total
December 31, 2007 December 31, 2006
(In millions)
Residential mortgage-backed securities:
Collateralized mortgage obligations . . . . . . . . . . . . . . . . . . . . . . . . . . . . $37,372 43.8% $33,034 40.3%
Pass-through securities . . . . . . . . . . . . . . . . . . . . . . . . . . . . . . . . . . . 19,117 22.4 18,632 22.7
Total residential mortgage-backed securities . . . . . . . . . . . . . . . . . . . . . . . 56,489 66.2 51,666 63.0
Commercial mortgage-backed securities . . . . . . . . . . . . . . . . . . . . . . . . . . 17,728 20.8 16,522 20.1
Asset-backed securities . . . . . . . . . . . . . . . . . . . . . . . . . . . . . . . . . . . . 11,041 13.0 13,873 16.9
Total . . . . . . . . . . . . . . . . . . . . . . . . . . . . . . . . . . . . . . . . . . . . . . $85,258 100.0% $82,061 100.0%
The majority of the residential mortgage-backed securities are guaranteed or otherwise supported by the Federal National Mortgage
Association, the Federal Home Loan Mortgage Corporation or the Government National Mortgage Association. Alternative residential
mortgage loans (“Alt-A”) are a classification of mortgage loans where the risk profile of the borrower falls between prime and sub-prime. At
December 31, 2007 and 2006, $56.2 billion and $51.0 billion, respectively, or 99% for both, of the residential mortgage-backed securities
were rated Aaa/AAA by Moody’s, S&P or Fitch. At December 31, 2007 and 2006, the Company’s Alt-A residential mortgage-backed
securities exposure was $6.4 billion and $4.8 billion, respectively, with an unrealized loss of $143 million and $4 million, respectively.
At December 31, 2007 and 2006, $15.5 billion and $13.7 billion, respectively, or 87% and 83%, respectively, of the commercial
mortgage-backed securities were rated Aaa/AAA by Moody’s, S&P or Fitch.
The Company’s asset-backed securities are diversified both by sector and by issuer. Credit card receivables and automobile
receivables, accounting for about 36% and 11% of the total asset-backed holdings, respectively, constitute the largest exposures in
the Company’s asset-backed securities portfolio. At December 31, 2007 and 2006, $6.0 billion and $7.9 billion, respectively, or 54% and
57%, respectively, of total asset-backed securities were rated Aaa/AAA by Moody’s, S&P or Fitch.
77MetLife, Inc.
The Company’s asset-backed securities included in the structured securities table above include exposure to sub-prime residential
mortgage-backed securities. Sub-prime mortgage lending is the origination of residential mortgage loans to customers with weak credit
profiles. The Company is not an originator of below-prime mortgages. The Company’s exposure exists through investment in asset-backed
securities which are supported by sub-prime mortgages. The slowing U.S. housing market, greater use of affordable mortgage products,
and relaxed underwriting standards for some originators of below-prime loans have recently led to higher delinquency and loss rates,
especially within the 2006 vintage year. These factors have caused a pull-back in market liquidity and repricing of risk, which has led to an
increase in unrealized losses from December 31, 2006 to December 31, 2007. Based upon the analysis of the Company’s exposure to
sub-prime mortgages through its investment in asset-backed securities, the Company expects to receive payments in accordance with the
contractual terms of the securities.
The following table shows the Company’s exposure to asset-backed securities supported by sub-prime mortgage loans by credit
quality:
Cost or
Amortized
Cost
Fair
Value
Cost or
Amortized
Cost
Fair
Value
Cost or
Amortized
Cost
Fair
Value
Cost or
Amortized
Cost
Fair
Value
Cost or
Amortized
Cost
Fair
Value
Cost or
Amortized
Cost
Fair
Value
Aaa Aa A Baa
Below
Investment
Grade Total
December 31, 2007
(In millions)
2003 & Prior . . . . . . . . . . . . . . . . $ 234 $ 223 $132 $125 $19 $17 $14 $13 $ 4 $ 2 $ 403 $ 380
2004 . . . . . . . . . . . . . . . . . . . . . 212 195 446 414 27 24 — — 1 — 686 633
2005 . . . . . . . . . . . . . . . . . . . . . 551 502 278 252 22 18 5 4 — — 856 776
2006 . . . . . . . . . . . . . . . . . . . . . 258 235 69 47 — — — — — — 327 282
2007 . . . . . . . . . . . . . . . . . . . . . 152 142 17 9 — — — — — — 169 151
Total . . . . . . . . . . . . . . . . . . . $1,407 $1,297 $942 $847 $68 $59 $19 $17 $ 5 $ 2 $2,441 $2,222
Cost or
Amortized
Cost
Fair
Value
Cost or
Amortized
Cost
Fair
Value
Cost or
Amortized
Cost
Fair
Value
Cost or
Amortized
Cost
Fair
Value
Cost or
Amortized
Cost
Fair
Value
Cost or
Amortized
Cost
Fair
Value
Aaa Aa A Baa
Below
Investment
Grade Total
December 31, 2006
(In millions)
2003 & Prior. . . . . . . . . . . . . . . $ 319 $ 317 $ 285 $ 285 $ 60 $ 60 $33 $33 $— $— $ 697 $ 695
2004 . . . . . . . . . . . . . . . . . . . 307 305 456 458 47 47 15 15 — — 825 825
2005 . . . . . . . . . . . . . . . . . . . 736 730 305 306 22 22 — — — — 1,063 1,058
2006 . . . . . . . . . . . . . . . . . . . 321 322 42 43 57 57 32 32 — — 452 454
Total . . . . . . . . . . . . . . . . . . $1,683 $1,674 $1,088 $1,092 $186 $186 $80 $80 $— $— $3,037 $3,032
At December 31, 2007 and 2006, the Company had $2.2 billion and $3.0 billion, respectively, of asset-backed securities supported by
sub-prime mortgage loans as outlined in the tables above. At December 31, 2007, approximately 96% of the portfolio is rated Aaa, Aa or
better of which 80% was in vintage year 2005 and prior. At December 31, 2006, approximately 91% of the portfolio was rated Aaa, Aa or
better of which 87% was in vintage year 2005 and prior. These older vintages benefit from better underwriting, improved enhancement
levels and higher house price appreciation.
Asset-backed securities also include collateralized debt obligations backed by sub-prime mortgages at an aggregate cost of $64 million
with a fair value of $48 million at December 31, 2007 and an aggregate cost of $93 million with a fair value of $92 million at December 31,
2006, which are not included in the tables above.
Assets on Deposit and Held in Trust and Assets Pledged as Collateral
The Company had investment assets on deposit with regulatory agencies with a fair market value of $1.8 billion and $1.3 billion at
December 31, 2007 and 2006, respectively, consisting primarily of fixed maturity and equity securities. Company securities held in trust to
satisfy collateral requirements had a cost or amortized cost of $7.1 billion and $3.0 billion at December 31, 2007 and 2006, respectively,
consisting primarily of fixed maturity and equity securities.
Certain of the Company’s fixed maturity securities are pledged as collateral for various transactions as described in “ — Composition of
Investment Portfolio Results — Derivative Financial Instruments — Credit Risk.” Additionally, the Company has pledged certain of its fixed
maturity securities in support of its debt and funding agreements as described in “ — Off-Balance Sheet Arrangements — Other
Commitments.”
Trading Securities
The Company has a trading securities portfolio to support investment strategies that involve the active and frequent purchase and sale
of securities, the execution of short sale agreements and asset and liability matching strategies for certain insurance products. Trading
securities and short sale agreement liabilities are recorded at fair value with subsequent changes in fair value recognized in net investment
income related to fixed maturity securities.
At December 31, 2007 and 2006, trading securities were $779 million and $759 million, respectively, and liabilities associated with the
short sale agreements in the trading securities portfolio, which were included in other liabilities, were $107 million and $387 million,
respectively. The Company had pledged $407 million and $614 million of its assets, primarily consisting of trading securities, as collateral
78 MetLife, Inc.
to secure the liabilities associated with the short sale agreements in the trading securities portfolio at December 31, 2007 and 2006,
respectively.
During the years ended December 31, 2007, 2006 and 2005, interest and dividends earned on trading securities in addition to the net
realized and unrealized gains (losses) recognized on the trading securities and the related short sale agreement liabilities included within
net investment income totaled $50 million, $71 million and $14 million, respectively. Included within unrealized gains (losses) on such
trading securities and short sale agreement liabilities, are changes in fair value of ($4) million, $26 million and less than $1 million for the
years ended December 31, 2007, 2006 and 2005, respectively.
As part of the acquisition of Travelers on July 1, 2005, the Company acquired Travelers’ investment in Tribeca Citigroup Investments
Ltd. (“Tribeca”). Tribeca was a feeder fund investment structure whereby the feeder fund invests substantially all of its assets in the master
fund, Tribeca Global Convertible Instruments Ltd. The primary investment objective of the master fund is to achieve enhanced risk-adjusted
return by investing in domestic and foreign equities and equity-related securities utilizing such strategies as convertible securities arbitrage.
At December 31, 2005, MetLife was the majority owner of the feeder fund and consolidated the fund within its consolidated financial
statements. Net investment income related to the trading activities of Tribeca, which included interest and dividends earned on trading
securities in addition to the net realized and unrealized gains, was $12 million and $6 million for the six months ended December 31, 2006
and 2005, respectively.
During the second quarter of 2006, MetLife’s ownership interests in Tribeca declined to a position whereby Tribeca is no longer
consolidated and, as of June 30, 2006, was accounted for under the equity method of accounting. The equity method investment at
December 31, 2006 of $82 million was included in other limited partnership interests. Net investment income related to the Company’s
equity method investment in Tribeca was $9 million for the six months ended December 31, 2006.
Mortgage and Consumer Loans
The Company’s mortgage and consumer loans are principally collateralized by commercial, agricultural and residential properties, as
well as automobiles. Mortgage and consumer loans comprised 13.6% and 12.7% of the Company’s total cash and invested assets at
December 31, 2007 and 2006, respectively. The carrying value of mortgage and consumer loans is stated at original cost net of
repayments, amortization of premiums, accretion of discounts and valuation allowances. The following table shows the carrying value of
the Company’s mortgage and consumer loans by type at:
Carrying
Value
% of
Total
Carrying
Value
% of
Total
December 31, 2007 December 31, 2006
(In millions)
Commercial mortgage loans . . . . . . . . . . . . . . . . . . . . . . . . . . . . . . . . . . $35,501 75.5% $31,847 75.4%
Agricultural mortgage loans . . . . . . . . . . . . . . . . . . . . . . . . . . . . . . . . . . . 10,484 22.3 9,213 21.8
Consumer loans . . . . . . . . . . . . . . . . . . . . . . . . . . . . . . . . . . . . . . . . . . 1,045 2.2 1,179 2.8
Total . . . . . . . . . . . . . . . . . . . . . . . . . . . . . . . . . . . . . . . . . . . . . . . . $47,030 100.0% $42,239 100.0%
Commercial Mortgage Loans. The Company diversifies its commercial mortgage loans by both geographic region and property type.
The following table presents the distribution across geographic regions and property types for commercial mortgage loans at:
Carrying
Value
% of
Total
Carrying
Value
% of
Total
December 31, 2007 December 31, 2006
(In millions)
Region
Pacific . . . . . . . . . . . . . . . . . . . . . . . . . . . . . . . . . . . . . . . . . . . . . . . . $ 8,620 24.3% $ 7,663 24.0%
South Atlantic . . . . . . . . . . . . . . . . . . . . . . . . . . . . . . . . . . . . . . . . . . . . 8,021 22.6 6,881 21.6
Middle Atlantic . . . . . . . . . . . . . . . . . . . . . . . . . . . . . . . . . . . . . . . . . . . 5,110 14.4 4,858 15.3
International . . . . . . . . . . . . . . . . . . . . . . . . . . . . . . . . . . . . . . . . . . . . . 3,642 10.3 2,832 8.9
East North Central . . . . . . . . . . . . . . . . . . . . . . . . . . . . . . . . . . . . . . . . . 2,957 8.3 2,879 9.0
West South Central . . . . . . . . . . . . . . . . . . . . . . . . . . . . . . . . . . . . . . . . 2,925 8.2 2,631 8.3
New England . . . . . . . . . . . . . . . . . . . . . . . . . . . . . . . . . . . . . . . . . . . . 1,499 4.2 1,301 4.1
Mountain . . . . . . . . . . . . . . . . . . . . . . . . . . . . . . . . . . . . . . . . . . . . . . . 1,086 3.1 859 2.7
West North Central . . . . . . . . . . . . . . . . . . . . . . . . . . . . . . . . . . . . . . . . 1,046 2.9 799 2.5
East South Central . . . . . . . . . . . . . . . . . . . . . . . . . . . . . . . . . . . . . . . . 503 1.4 452 1.4
Other . . . . . . . . . . . . . . . . . . . . . . . . . . . . . . . . . . . . . . . . . . . . . . . . . 92 0.3 692 2.2
Total . . . . . . . . . . . . . . . . . . . . . . . . . . . . . . . . . . . . . . . . . . . . . . . . $35,501 100.0% $31,847 100.0%
79MetLife, Inc.
Carrying
Value
% of
Total
Carrying
Value
% of
Total
December 31, 2007 December 31, 2006
(In millions)
Property Type
Office . . . . . . . . . . . . . . . . . . . . . . . . . . . . . . . . . . . . . . . . . . . . . . . . . $15,471 43.6% $15,083 47.4%
Retail . . . . . . . . . . . . . . . . . . . . . . . . . . . . . . . . . . . . . . . . . . . . . . . . . 7,557 21.3 6,552 20.6
Apartments . . . . . . . . . . . . . . . . . . . . . . . . . . . . . . . . . . . . . . . . . . . . . 4,437 12.5 3,772 11.8
Hotel . . . . . . . . . . . . . . . . . . . . . . . . . . . . . . . . . . . . . . . . . . . . . . . . . 3,282 9.2 2,120 6.7
Industrial . . . . . . . . . . . . . . . . . . . . . . . . . . . . . . . . . . . . . . . . . . . . . . . 2,880 8.1 2,850 8.9
Other . . . . . . . . . . . . . . . . . . . . . . . . . . . . . . . . . . . . . . . . . . . . . . . . . 1,874 5.3 1,470 4.6
Total . . . . . . . . . . . . . . . . . . . . . . . . . . . . . . . . . . . . . . . . . . . . . . . . $35,501 100.0% $31,847 100.0%
The following table presents the scheduled maturities for the Company’s commercial mortgage loans at:
Carrying
Value
% of
Total
Carrying
Value
% of
Total
December 31, 2007 December 31, 2006
(In millions)
Due in one year or less . . . . . . . . . . . . . . . . . . . . . . . . . . . . . . . . . . . . . . $ 2,963 8.3% $ 1,772 5.6%
Due after one year through two years . . . . . . . . . . . . . . . . . . . . . . . . . . . . 4,247 12.0 3,006 9.4
Due after two years through three years . . . . . . . . . . . . . . . . . . . . . . . . . . . 4,151 11.7 4,173 13.1
Due after three years through four years . . . . . . . . . . . . . . . . . . . . . . . . . . . 3,892 11.0 3,822 12.0
Due after four years through five years . . . . . . . . . . . . . . . . . . . . . . . . . . . . 4,589 12.9 4,769 15.0
Due after five years . . . . . . . . . . . . . . . . . . . . . . . . . . . . . . . . . . . . . . . . 15,659 44.1 14,305 44.9
Total . . . . . . . . . . . . . . . . . . . . . . . . . . . . . . . . . . . . . . . . . . . . $35,501 100.0% $31,847 100.0%
Restructured, Potentially Delinquent, Delinquent or Under Foreclosure. The Company monitors its mortgage loan investments on an
ongoing basis, including reviewing loans that are restructured, potentially delinquent, delinquent or under foreclosure. These loan
classifications are consistent with those used in industry practice.
The Company defines restructured mortgage loans as loans in which the Company, for economic or legal reasons related to the
debtor’s financial difficulties, grants a concession to the debtor that it would not otherwise consider. The Company defines potentially
delinquent loans as loans that, in management’s opinion, have a high probability of becoming delinquent. The Company defines delinquent
mortgage loans, consistent with industry practice, as loans in which two or more interest or principal payments are past due. The Company
defines mortgage loans under foreclosure as loans in which foreclosure proceedings have formally commenced.
The Company reviews all mortgage loans on an ongoing basis. These reviews may include an analysis of the property financial
statements and rent roll, lease rollover analysis, property inspections, market analysis and tenant creditworthiness.
The Company records valuation allowances for certain loans that it deems impaired. The Company’s valuation allowances are
established both on a loan specific basis for those loans where a property or market specific risk has been identified that could likely
result in a future default, as well as for pools of loans with similar high risk characteristics where a property specific or market risk has not
been identified. Loan specific valuation allowances are established for the excess carrying value of the mortgage loan over the present
value of expected future cash flows discounted at the loan’s original effective interest rate, the value of the loan’s collateral, or the loan’s
market value if the loan is being sold. Valuation allowances for pools of loans are established based on property types and loan to value risk
factors. The Company records valuation allowances as investment losses. The Company records subsequent adjustments to allowances
as investment gains (losses).
The following table presents the amortized cost and valuation allowance for commercial mortgage loans distributed by loan classi-
fication at:
Amortized
Cost(1)
% of
Total
Valuation
Allowance
% of
Amortized
Cost
Amortized
Cost (1)
% of
Total
Valuation
Allowance
% of
Amortized
Cost
December 31, 2007 December 31, 2006
(In millions)
Performing . . . . . . . . . . . . . $35,665 100.0% $168 0.5% $31,996 100.0% $153 0.5%
Potentially delinquent . . . . . . 3 — — — 3 — — —
Delinquent or under
foreclosure . . . . . . . . . . . . 1 — — — 1 — — —
Total . . . . . . . . . . . . . . . . $35,669 100.0% $168 0.5% $32,000 100.0% $153 0.5%
(1) Amortized cost is the carrying value before valuation allowances.
80 MetLife, Inc.
The following table presents the changes in valuation allowances for commercial mortgage loans for the:
2007 2006 2005
Years Ended December 31,
(In millions)
Balance, beginning of period . . . . . . . . . . . . . . . . . . . . . . . . . . . . . . . . . . . . . . . . . . . $153 $147 $149
Additions . . . . . . . . . . . . . . . . . . . . . . . . . . . . . . . . . . . . . . . . . . . . . . . . . . . . . . . . 69 25 43
Deductions . . . . . . . . . . . . . . . . . . . . . . . . . . . . . . . . . . . . . . . . . . . . . . . . . . . . . . . (54) (19) (45)
Balance, end of period . . . . . . . . . . . . . . . . . . . . . . . . . . . . . . . . . . . . . . . . . . . . . . . $168 $153 $147
Agricultural Mortgage Loans. The Company diversifies its agricultural mortgage loans by both geographic region and product type.
Of the $10.5 billion of agricultural mortgage loans outstanding at December 31, 2007, 58%, were subject to rate resets prior to maturity.
A substantial portion of these loans has been successfully renegotiated and remain outstanding to maturity. The process and policies for
monitoring the agricultural mortgage loans and classifying them by performance status are generally the same as those for the commercial
loans.
The following table presents the amortized cost and valuation allowances for agricultural mortgage loans distributed by loan classi-
fication at:
Amortized
Cost (1)
% of
Total
Valuation
Allowance
% of
Amortized
Cost
Amortized
Cost(1)
% of
Total
Valuation
Allowance
% of
Amortized
Cost
December 31, 2007 December 31, 2006
(In millions)
Performing . . . . . . . . . . . . . $10,440 99.4% $12 0.1% $9,172 99.4% $11 0.1%
Restructured . . . . . . . . . . . . 2 — — — 9 0.1 — —
Potentially delinquent . . . . . . 47 0.4 4 8.5 2 — — —
Delinquent or under
foreclosure . . . . . . . . . . . . 19 0.2 8 42.1 48 0.5 7 14.6
Total . . . . . . . . . . . . . . . . $10,508 100.0% $24 0.2% $9,231 100.0% $18 0.2%
(1) Amortized cost is equal to carrying value before valuation allowances.
The following table presents the changes in valuation allowances for agricultural mortgage loans for the:
2007 2006 2005
Years Ended
December 31,
(In millions)
Balance, beginning of period . . . . . . . . . . . . . . . . . . . . . . . . . . . . . . . . . . . . . . . . . . . . . . . $18 $11 $ 7
Additions . . . . . . . . . . . . . . . . . . . . . . . . . . . . . . . . . . . . . . . . . . . . . . . . . . . . . . . . . . . . 8 10 4
Deductions . . . . . . . . . . . . . . . . . . . . . . . . . . . . . . . . . . . . . . . . . . . . . . . . . . . . . . . . . . (2) (3) —
Balance, end of period . . . . . . . . . . . . . . . . . . . . . . . . . . . . . . . . . . . . . . . . . . . . . . . . . . . $24 $18 $11
Consumer Loans. Consumer loans consist of residential mortgages and auto loans.
The following table presents the amortized cost and valuation allowances for consumer loans distributed by loan classification at:
Amortized
Cost(1)
% of
Total
Valuation
Allowance
% of
Amortized
Cost
Amortized
Cost(1)
% of
Total
Valuation
Allowance
% of
Amortized
Cost
December 31, 2007 December 31, 2006
(In millions)
Performing . . . . . . . . . . . . . $1,006 95.7% $ 5 0.5% $1,155 97.1% $10 0.9%
Potentially delinquent . . . . . . 19 1.8 — — 17 1.4 — —
Delinquent or under
foreclosure . . . . . . . . . . . . 26 2.5 1 4.0 18 1.5 1 5.6
Total . . . . . . . . . . . . . . . . $1,051 100.0% $ 6 0.6% $1,190 100.0% $11 0.9%
(1) Amortized cost is equal to carrying value before valuation allowances.
81MetLife, Inc.
The following table presents the changes in valuation allowances for consumer loans for the:
2007 2006 2005
Years Ended
December 31,
(In millions)
Balance, beginning of period . . . . . . . . . . . . . . . . . . . . . . . . . . . . . . . . . . . . . . . . . . . . . . . $11 $15 $ 1
Additions . . . . . . . . . . . . . . . . . . . . . . . . . . . . . . . . . . . . . . . . . . . . . . . . . . . . . . . . . . . . — — 17
Deductions . . . . . . . . . . . . . . . . . . . . . . . . . . . . . . . . . . . . . . . . . . . . . . . . . . . . . . . . . . (5) (4) (3)
Balance, end of period . . . . . . . . . . . . . . . . . . . . . . . . . . . . . . . . . . . . . . . . . . . . . . . . . . . $ 6 $11 $15
Real Estate Holdings
The Company’s real estate holdings consist of commercial properties located primarily in the United States. At December 31, 2007 and
2006, the carrying value of the Company’s real estate, real estate joint ventures and real estate held-for-sale was $6.8 billion and
$5.0 billion, respectively, or 2.0% and 1.5%, of total cash and invested assets, respectively. The carrying value of real estate is stated at
depreciated cost net of impairments and valuation allowances. The carrying value of real estate joint ventures is stated at the Company’s
equity in the real estate joint ventures net of impairments and valuation allowances.
The following table presents the carrying value of the Company’s real estate holdings at:
Type
Carrying
Value
% of
Total
Carrying
Value
% of
Total
December 31, 2007 December 31, 2006
(In millions)
Real estate . . . . . . . . . . . . . . . . . . . . . . . . . . . . . . . . . . . . . . . . . . . . . . . $3,823 56.5% $3,322 66.6%
Real estate joint ventures . . . . . . . . . . . . . . . . . . . . . . . . . . . . . . . . . . . . . 2,771 40.9 1,477 29.6
Foreclosed real estate . . . . . . . . . . . . . . . . . . . . . . . . . . . . . . . . . . . . . . . 3 0.1 3 0.1
6,597 97.5 4,802 96.3
Real estate held-for-sale . . . . . . . . . . . . . . . . . . . . . . . . . . . . . . . . . . . . . . 172 2.5 184 3.7
Total real estate holdings . . . . . . . . . . . . . . . . . . . . . . . . . . . . . . . . . . . . . . $6,769 100.0% $4,986 100.0%
The Company’s carrying value of real estate held-for-sale of $172 million and $184 million at December 31, 2007 and 2006,
respectively, have been reduced by impairments of $1 million and $17 million at December 31, 2007 and 2006, respectively.
The Company records real estate acquired upon foreclosure of commercial and agricultural mortgage loans at the lower of estimated
fair value or the carrying value of the mortgage loan at the date of foreclosure.
Real estate holdings were categorized as follows:
Amount Percent Amount Percent
2007 2006
December 31,
(In millions)
Office . . . . . . . . . . . . . . . . . . . . . . . . . . . . . . . . . . . . . . . . . . . . . . . . . $3,126 46% $2,709 55%
Apartments . . . . . . . . . . . . . . . . . . . . . . . . . . . . . . . . . . . . . . . . . . . . . . 1,264 19 739 15
Development joint ventures. . . . . . . . . . . . . . . . . . . . . . . . . . . . . . . . . . . . 743 11 169 3
Retail . . . . . . . . . . . . . . . . . . . . . . . . . . . . . . . . . . . . . . . . . . . . . . . . . . 574 8 513 10
Real estate investment funds . . . . . . . . . . . . . . . . . . . . . . . . . . . . . . . . . . 516 8 401 8
Industrial . . . . . . . . . . . . . . . . . . . . . . . . . . . . . . . . . . . . . . . . . . . . . . . 283 4 291 6
Land . . . . . . . . . . . . . . . . . . . . . . . . . . . . . . . . . . . . . . . . . . . . . . . . . . 174 3 71 1
Agriculture . . . . . . . . . . . . . . . . . . . . . . . . . . . . . . . . . . . . . . . . . . . . . . 29 — 32 1
Other . . . . . . . . . . . . . . . . . . . . . . . . . . . . . . . . . . . . . . . . . . . . . . . . . . 60 1 61 1
Total real estate holdings . . . . . . . . . . . . . . . . . . . . . . . . . . . . . . . . . . . . $6,769 100% $4,986 100%
The Company’s real estate holdings are primarily located in the United States. At December 31, 2007, 22%, 11%, 10% and 9% of the
Company’s real estate holdings were located in California, New York, Florida and Texas, respectively.
Certain of the Company’s investments in real estate joint ventures meet the definition of a VIE under FIN 46(r). See “— Composition of
Investment Portfolio Results — Variable Interest Entities.”
In the fourth quarter of 2006, the Company sold its Peter Cooper Village and Stuyvesant Town properties located in Manhattan, New
York for $5.4 billion. The Peter Cooper Village and Stuyvesant Town properties together make up the largest apartment complex in
Manhattan, New York totaling over 11,000 units, spread over 80 contiguous acres. The properties were owned by the Holding Company’s
subsidiary, Metropolitan Tower Life Insurance Company. The sale resulted in a gain of $3 billion, net of income tax, and is included in
income from discontinued operations in the consolidated statements of income.
In the second quarter of 2005, the Company sold its One Madison Avenue and 200 Park Avenue properties in Manhattan, New York for
$918 million and $1.72 billion, respectively, resulting in gains, net of income tax, of $431 million and $762 million, respectively, and is
included in income from discontinued operations in the consolidated statements of income. In connection with the sale of the 200 Park
82 MetLife, Inc.
Avenue property, the Company has retained rights to existing signage and is leasing space for associates in the property for 20 years with
optional renewal periods through 2205.
Leveraged Leases
Investment in leveraged leases, included in other invested assets, consisted of the following:
2007 2006
December 31,
(In millions)
Rental receivables, net . . . . . . . . . . . . . . . . . . . . . . . . . . . . . . . . . . . . . . . . . . . . . . . . . . . $ 1,491 $1,055
Estimated residual values . . . . . . . . . . . . . . . . . . . . . . . . . . . . . . . . . . . . . . . . . . . . . . . . . 1,881 887
Subtotal . . . . . . . . . . . . . . . . . . . . . . . . . . . . . . . . . . . . . . . . . . . . . . . . . . . . . . . . . . . 3,372 1,942
Unearned income . . . . . . . . . . . . . . . . . . . . . . . . . . . . . . . . . . . . . . . . . . . . . . . . . . . . . . (1,313) (694)
Investment in leveraged leases . . . . . . . . . . . . . . . . . . . . . . . . . . . . . . . . . . . . . . . . . . . . $ 2,059 $1,248
The Company’s deferred income tax liability related to leveraged leases was $1.0 billion and $670 million at December 31, 2007 and
2006, respectively. The rental receivables set forth above are generally due in periodic installments. The payment periods range from one
to 15 years, but in certain circumstances are as long as 30 years.
The components of net income from investment in leveraged leases are as follows:
2007 2006 2005
Years Ended
December 31,
(In millions)
Income from investment in leveraged leases (included in net investment income). . . . . . . . . . . . . $ 67 $ 51 $ 54
Less: Income tax expense on leveraged leases . . . . . . . . . . . . . . . . . . . . . . . . . . . . . . . . . . (24) (18) (19)
Net income from investment in leveraged leases . . . . . . . . . . . . . . . . . . . . . . . . . . . . . . . . . $ 43 $ 33 $ 35
Other Limited Partnership Interests
The carrying value of other limited partnership interests (which primarily represent ownership interests in pooled investment funds that
make private equity investments in companies in the United States and overseas) was $6.2 billion and $4.8 billion at December 31, 2007
and 2006, respectively. Included within other limited partnership interests at December 31, 2007 and 2006 are $1.6 billion and $1.2 billion,
respectively, of hedge funds. For the years ended December 31, 2007, 2006 and 2005, net investment income from other limited
partnership interests included $89 million, $98 million and $24 million, respectively, related to hedge funds. The Company uses the equity
method of accounting for investments in limited partnership interests in which it has more than a minor interest, has influence over the
partnership’s operating and financial policies, but does not have a controlling interest and is not the primary beneficiary. The Company uses
the cost method for minor interest investments and when it has virtually no influence over the partnership’s operating and financial policies.
The Company’s investments in other limited partnership interests represented 1.8% and 1.4% of cash and invested assets at December 31,
2007 and 2006, respectively.
Management anticipates that investment income and the related yields on other limited partnership interests may decline during 2008
due to increased volatility in the equity and credit markets during 2007.
Some of the Company’s investments in other limited partnership interests meet the definition of a VIE under FIN 46(r). See
“— Composition of Investment Portfolio Results — Variable Interest Entities.”
Other Invested Assets
The Company’s other invested assets consisted principally of leveraged leases of $2.2 billion and $1.3 billion, funds withheld at interest
of $4.5 billion and $4.0 billion, and standalone derivatives with positive fair values and the fair value of embedded derivatives related to
funds withheld and modified coinsurance contracts of $4.1 billion and $2.5 billion at December 31, 2007 and 2006, respectively. The
leveraged leases are recorded net of non-recourse debt. The Company participates in lease transactions, which are diversified by industry,
asset type and geographic area. The Company regularly reviews residual values and writes down residuals to expected values as needed.
Funds withheld represent amounts contractually withheld by ceding companies in accordance with reinsurance agreements. For agree-
ments written on a modified coinsurance basis and certain agreements written on a coinsurance basis, assets supporting the reinsured
policies equal to the net statutory reserves are withheld and continue to be legally owned by the ceding company. Interest accrues to these
funds withheld at rates defined by the treaty terms and may be contractually specified or directly related to the investment portfolio. The
Company’s other invested assets represented 3.7% and 3.2% of cash and invested assets at December 31, 2007 and 2006, respectively.
Derivative Financial Instruments
The Company uses a variety of derivatives, including swaps, forwards, futures and option contracts, to manage its various risks.
Additionally, the Company uses derivatives to synthetically create investments as permitted by its insurance subsidiaries’ Derivatives Use
Plans approved by the applicable state insurance departments.
83MetLife, Inc.
The following table presents the notional amount and current market or fair value of derivative financial instruments held at:
Notional
Amount Assets Liabilities
Notional
Amount Assets Liabilities
Current Market
or Fair Value
Current Market
or Fair Value
December 31, 2007 December 31, 2006
(In millions)
Interest rate swaps . . . . . . . . . . . . . . . . . . . . . . $ 62,519 $ 785 $ 768 $ 27,148 $ 639 $ 150
Interest rate floors . . . . . . . . . . . . . . . . . . . . . . 48,937 621 — 37,437 279 —
Interest rate caps . . . . . . . . . . . . . . . . . . . . . . . 45,498 50 — 26,468 125 —
Financial futures . . . . . . . . . . . . . . . . . . . . . . . 10,817 89 57 8,432 64 39
Foreign currency swaps . . . . . . . . . . . . . . . . . . 21,399 1,480 1,724 19,627 986 1,174
Foreign currency forwards . . . . . . . . . . . . . . . . . 4,185 76 16 2,934 31 27
Options . . . . . . . . . . . . . . . . . . . . . . . . . . . . . 2,043 713 1 587 306 8
Financial forwards . . . . . . . . . . . . . . . . . . . . . . 4,600 122 2 3,800 12 40
Credit default swaps . . . . . . . . . . . . . . . . . . . . . 6,850 58 35 6,357 5 21
Synthetic GICs . . . . . . . . . . . . . . . . . . . . . . . . 3,670 — — 3,739 — —
Other . . . . . . . . . . . . . . . . . . . . . . . . . . . . . . . 250 43 — 250 56 —
Total . . . . . . . . . . . . . . . . . . . . . . . . . . . . . . $210,768 $4,037 $2,603 $136,779 $2,503 $1,459
The above table does not include notional amounts for equity futures, equity variance swaps, and equity options. At December 31,
2007 and 2006, the Company owned 4,658 and 2,749 equity futures, respectively. Fair values of equity futures are included in financial
futures in the preceding table. At December 31, 2007 and 2006, the Company owned 695,485 and 225,000 equity variance swaps,
respectively. Fair values of equity variance swaps are included in financial forwards in the preceding table. At December 31, 2007 and
2006, the Company owned 77,374,937 and 74,864,483 equity options, respectively. Fair values of equity options are included in options
in the preceding table.
Credit Risk. The Company may be exposed to credit-related losses in the event of nonperformance by counterparties to derivative
financial instruments. Generally, the current credit exposure of the Company’s derivative contracts is limited to the fair value at the reporting
date. The credit exposure of the Company’s derivative transactions is represented by the fair value of contracts with a net positive fair value
at the reporting date.
The Company manages its credit risk related to over-the-counter derivatives by entering into transactions with creditworthy counter-
parties, maintaining collateral arrangements and through the use of master agreements that provide for a single net payment to be made by
one counterparty to another at each due date and upon termination. Because exchange traded futures are effected through regulated
exchanges, and positions are marked to market on a daily basis, the Company has minimal exposure to credit-related losses in the event of
nonperformance by counterparties to such derivative instruments.
The Company enters into various collateral arrangements, which require both the pledging and accepting of collateral in connection
with its derivative instruments. As of December 31, 2007 and 2006, the Company was obligated to return cash collateral under its control
of $833 million and $428 million, respectively. This unrestricted cash collateral is included in cash and cash equivalents and the obligation
to return it is included in payables for collateral under securities loaned and other transactions in the consolidated balance sheets. As of
December 31, 2007 and 2006, the Company had also accepted collateral consisting of various securities with a fair market value of
$678 million and $453 million, respectively, which are held in separate custodial accounts. The Company is permitted by contract to sell or
repledge this collateral, but as of December 31, 2007 and 2006, none of the collateral had been sold or repledged.
As of December 31, 2007 and 2006, the Company provided collateral of $162 million and $80 million, respectively, which is included in
fixed maturity securities in the consolidated balance sheets. In addition, the Company has exchange traded futures, which require the
pledging of collateral. As of December 31, 2007 and 2006, the Company pledged collateral of $167 million and $105 million, respectively,
which is included in fixed maturity securities. The counterparties are permitted by contract to sell or repledge this collateral.
84 MetLife, Inc.
Variable Interest Entities
The following table presents the total assets of and maximum exposure to loss relating to VIEs for which the Company has concluded
that: (i) it is the primary beneficiary and which are consolidated in the Company’s consolidated financial statements at December 31, 2007;
and (ii) it holds significant variable interests but it is not the primary beneficiary and which have not been consolidated:
Total
Assets(1)
Maximum
Exposure to
Loss(2)
Total
Assets(1)
Maximum
Exposure to
Loss(2)
Primary Beneficiary Not Primary Beneficiary
December 31, 2007
(In millions)
Asset-backed securitizations and collateralized debt obligations . . . . . $1,167 $1,167 $ 1,591 $ 184
Real estate joint ventures(3) . . . . . . . . . . . . . . . . . . . . . . . . . . . . . 48 26 276 42
Other limited partnership interests(4) . . . . . . . . . . . . . . . . . . . . . . . 2 1 42,141 2,080
Trust preferred securities(5) . . . . . . . . . . . . . . . . . . . . . . . . . . . . . 105 105 48,232 3,369
Other investments(6) . . . . . . . . . . . . . . . . . . . . . . . . . . . . . . . . . 1,119 1,119 3,258 260
Total. . . . . . . . . . . . . . . . . . . . . . . . . . . . . . . . . . . . . . . . . . . $2,441 $2,418 $95,498 $5,935
(1) The assets of the asset-backed securitizations and collateralized debt obligations are reflected at fair value. The assets of the real estate
joint ventures, other limited partnership interests, trust preferred securities and other investments are reflected at the carrying amounts at
which such assets would have been reflected on the Company’s consolidated balance sheet had the Company consolidated the VIE from
the date of its initial investment in the entity.
(2) The maximum exposure to loss relating to the asset-backed securitizations and collateralized debt obligations is equal to the carrying
amounts of retained interests. In addition, the Company provides collateral management services for certain of these structures for which
it collects a management fee. The maximum exposure to loss relating to real estate joint ventures, other limited partnership interests, trust
preferred securities and other investments is equal to the carrying amounts plus any unfunded commitments, reduced by amounts
guaranteed by other partners. Such a maximum loss would be expected to occur only upon bankruptcy of the issuer or investee.
(3) Real estate joint ventures include partnerships and other ventures which engage in the acquisition, development, management and
disposal of real estate investments.
(4) Other limited partnership interests include partnerships established for the purpose of investing in public and private debt and equity
securities.
(5) Trust preferred securities are complex, uniquely structured investments which contain features of both equity and debt, may have an
extended or no stated maturity, and may be callable at the issuer’s option after a defined period of time.
(6) Other investments include securities that are not trust preferred securities, asset-backed securitizations or collateralized debt
obligations.
Securities Lending
The Company participates in a securities lending program whereby blocks of securities, which are included in fixed maturity and equity
securities, are loaned to third parties, primarily major brokerage firms. The Company requires a minimum of 102% of the fair value of the
loaned securities to be separately maintained as collateral for the loans. Securities with a cost or amortized cost of $41.1 billion and
$43.3 billion and an estimated fair value of $42.1 billion and $44.1 billion were on loan under the program at December 31, 2007 and 2006,
respectively. Securities loaned under such transactions may be sold or repledged by the transferee. The Company was liable for cash
collateral under its control of $43.3 billion and $45.4 billion at December 31, 2007 and 2006, respectively. Security collateral of $40 million
and $100 million on deposit from customers in connection with the securities lending transactions at December 31, 2007 and 2006,
respectively, may not be sold or repledged and is not reflected in the consolidated financial statements.
Separate Accounts
The Company held $160.2 billion and $144.4 billion in separate accounts, for which the Company does not bear investment risk, as of
December 31, 2007 and 2006, respectively. The Company manages each separate account’s assets in accordance with the prescribed
investment policy that applies to that specific separate account. The Company establishes separate accounts on a single client and multi-
client commingled basis in compliance with insurance laws. Effective with the adoption of SOP 03-1, Accounting and Reporting by
Insurance Enterprises for Certain Nontraditional Long-Duration Contracts and for Separate Accounts, on January 1, 2004, the Company
reported separately, as assets and liabilities, investments held in separate accounts and liabilities of the separate accounts if:
• such separate accounts are legally recognized;
• assets supporting the contract liabilities are legally insulated from the Company’s general account liabilities;
• investments are directed by the contractholder; and
• all investment performance, net of contract fees and assessments, is passed through to the contractholder.
The Company reports separate account assets meeting such criteria at their fair value. Investment performance (including investment
income, net investment gains (losses) and changes in unrealized gains (losses)) and the corresponding amounts credited to contrac-
tholders of such separate accounts are offset within the same line in the consolidated statements of income.
The Company’s revenues reflect fees charged to the separate accounts, including mortality charges, risk charges, policy administration
fees, investment management fees and surrender charges. Separate accounts not meeting the above criteria are combined on a
line-by-line basis with the Company’s general account assets, liabilities, revenues and expenses.
Quantitative and Qualitative Disclosures About Market Risk
The Company must effectively manage, measure and monitor the market risk associated with its invested assets and interest rate
sensitive insurance contracts. It has developed an integrated process for managing risk, which it conducts through its Corporate Risk
85MetLife, Inc.
Management Department, ALM Committees and additional specialists at the business segment level. The Company has established and
implemented comprehensive policies and procedures at both the corporate and business segment level to minimize the effects of potential
market volatility.
The Company regularly analyzes its exposure to interest rate, equity market and foreign currency exchange risks. As a result of that
analysis, the Company has determined that the fair value of its interest rate sensitive invested assets is materially exposed to changes in
interest rates. The equity and foreign currency portfolios do not expose the Company to material market risks (as described below).
MetLife generally uses option adjusted duration to manage interest rate risk and the methods and assumptions used are generally
consistent with those used by the Company in 2006. The Company analyzes interest rate risk using various models, including multi-
scenario cash flow projection models that forecast cash flows of the liabilities and their supporting investments, including derivative
instruments. The Company uses a variety of strategies to manage interest rate, equity market, and foreign currency exchange risk,
including the use of derivative instruments.
Market Risk Exposures
The Company has exposure to market risk through its insurance operations and investment activities. For purposes of this disclosure,
“market risk” is defined as the risk of loss resulting from changes in interest rates, equity market prices and foreign currency exchange
rates.
Interest Rates. The Company’s exposure to interest rate changes results from its significant holdings of fixed maturity securities, as
well as its interest rate sensitive liabilities. The fixed maturity securities include U.S. and foreign government bonds, securities issued by
government agencies, corporate bonds and mortgage-backed securities, all of which are mainly exposed to changes in medium- and long-
term treasury rates. The interest rate sensitive liabilities for purposes of this disclosure include GICs and annuities, which have the same
type of interest rate exposure (medium- and long-term treasury rates) as fixed maturity securities. The Company employs product design,
pricing and asset/liability management strategies to reduce the adverse effects of interest rate movements. Product design and pricing
strategies include the use of surrender charges or restrictions on withdrawals in some products. Asset/liability management strategies
include the use of derivatives, the purchase of securities structured to protect against prepayments, prepayment restrictions and related
fees on mortgage loans and consistent monitoring of the pricing of the Company’s products in order to better match the duration of the
assets and the liabilities they support. See also “Risk Factors — Changes in Market Interest Rates May Significantly Affect Our Profitability’’
in MetLife, Inc.’s Annual Report on Form 10-K for the year ended December 31, 2007.
Equity Market Prices. The Company’s investments in equity securities and equity-based fixed maturity securities expose it to changes
in equity prices, as do certain liabilities that involve long-term guarantees on equity performance. It manages this risk on an integrated basis
with other risks through its asset/liability management strategies. The Company also manages equity market price risk through industry and
issuer diversification, asset allocation techniques and the use of derivatives.
Foreign Currency Exchange Rates. The Company’s exposure to fluctuations in foreign currency exchange rates against the U.S. dollar
results from its holdings in non-U.S. dollar denominated fixed maturity securities, equity securities and liabilities, as well as through its
investments in foreign subsidiaries. The principal currencies that create foreign currency exchange rate risk in the Company’s investment
portfolios are the Euro, the Canadian dollar and the British pound. The Company mitigates its fixed maturity securities’ foreign currency
exchange rate risk through the utilization of foreign currency swaps and forward contracts. Through its investments in foreign subsidiaries,
the Company is primarily exposed to the Canadian dollar, the Mexican peso, the Australian dollar, the Argentinean peso, the South Korean
won, the Chilean peso, the Taiwanese dollar and the Japanese yen. The Company has matched substantially all of its foreign currency
liabilities in its foreign subsidiaries with their respective foreign currency assets, thereby reducing its risk to currency exchange rate
fluctuation. Selectively, the Company uses U.S. dollar assets to support certain long duration foreign currency liabilities. Additionally, in
some countries, local surplus is held entirely or in part in U.S. dollar assets which further minimizes exposure to exchange rate fluctuation
risk.
Risk Management
Corporate Risk Management. MetLife has established several financial and non-financial senior management committees as part of its
risk management process. These committees manage capital and risk positions, approve asset/liability management strategies and
establish appropriate corporate business standards.
MetLife also has a separate Corporate Risk Management Department, which is responsible for risk throughout MetLife and reports to
MetLife’s Chief Financial Officer. The Corporate Risk Management Department’s primary responsibilities consist of:
• implementing a Board of Directors-approved corporate risk framework, which outlines the Company’s approach for managing risk on
an enterprise-wide basis;
• developing policies and procedures for managing, measuring and monitoring those risks identified in the corporate risk framework;
• establishing appropriate corporate risk tolerance levels;
• deploying capital on an economic capital basis; and
• reporting on a periodic basis to the Governance Committee of the Holding Company’s Board of Directors and various financial and
non-financial senior management committees.
Asset/Liability Management. The Company actively manages its assets using an approach that balances quality, diversification, asset/
liability matching, liquidity and investment return. The goals of the investment process are to optimize, net of income tax, risk-adjusted
investment income and risk-adjusted total return while ensuring that the assets and liabilities are managed on a cash flow and duration
basis. The asset/liability management process is the shared responsibility of the Portfolio Management Unit, the Financial Management and
Oversight Asset/Liability Management Unit, and the operating business segments under the supervision of the various product line specific
ALM Committees. The ALM Committees’ duties include reviewing and approving target portfolios on a periodic basis, establishing
investment guidelines and limits and providing oversight of the asset/liability management process. The portfolio managers and asset
sector specialists, who have responsibility on a day-to-day basis for risk management of their respective investing activities, implement the
goals and objectives established by the ALM Committees.
86 MetLife, Inc.
Each of MetLife’s business segments has an asset/liability officer who works with portfolio managers in the investment department to
monitor investment, product pricing, hedge strategy and liability management issues. MetLife establishes target asset portfolios for each
major insurance product, which represent the investment strategies used to profitably fund its liabilities within acceptable levels of risk.
These strategies are monitored through regular review of portfolio metrics, such as effective duration, yield curve sensitivity, convexity,
liquidity, asset sector concentration and credit quality.
To manage interest rate risk, the Company performs periodic projections of asset and liability cash flows to evaluate the potential
sensitivity of its investments and liabilities to interest rate movements. These projections involve evaluating the potential gain or loss on
most of the Company’s in-force business under various increasing and decreasing interest rate environments. Department regulations
require that MetLife perform some of these analyses annually as part of MetLife’s review of the sufficiency of its regulatory reserves. For
several of its legal entities, the Company maintains segmented operating and surplus asset portfolios for the purpose of asset/liability
management and the allocation of investment income to product lines. For each segment, invested assets greater than or equal to the
GAAP liabilities less the DAC asset and any non-invested assets allocated to the segment are maintained, with any excess swept to the
surplus segment. The operating segments may reflect differences in legal entity, statutory line of business and any product market
characteristic which may drive a distinct investment strategy with respect to duration, liquidity or credit quality of the invested assets.
Certain smaller entities make use of unsegmented general accounts for which the investment strategy reflects the aggregate charac-
teristics of liabilities in those entities. The Company measures relative sensitivities of the value of its assets and liabilities to changes in key
assumptions utilizing Company models. These models reflect specific product characteristics and include assumptions based on current
and anticipated experience regarding lapse, mortality and interest crediting rates. In addition, these models include asset cash flow
projections reflecting interest payments, sinking fund payments, principal payments, bond calls, mortgage prepayments and defaults.
Common industry metrics, such as duration and convexity, are also used to measure the relative sensitivity of assets and liability values
to changes in interest rates. In computing the duration of liabilities, consideration is given to all policyholder guarantees and to how the
Company intends to set indeterminate policy elements such as interest credits or dividends. Each asset portfolio has a duration constraint
based on the liability duration and the investment objectives of that portfolio. Where a liability cash flow may exceed the maturity of available
assets, as is the case with certain retirement and non-medical health products, the Company may support such liabilities with equity
investments or curve mismatch strategies.
Hedging Activities. To reduce interest rate risk, MetLife’s risk management strategies incorporate the use of various interest rate
derivatives to adjust the overall duration and cash flow profile of its invested asset portfolios to better match the duration and cash flow
profile of its liabilities. Such instruments include financial futures, financial forwards, interest rate and credit default swaps, caps, floors and
options. MetLife also uses foreign currency swaps and forwards to hedge its foreign currency denominated fixed income investments.
Risk Measurement: Sensitivity Analysis
The Company measures market risk related to its holdings of invested assets and other financial instruments, including certain market
risk sensitive insurance contracts, based on changes in interest rates, equity market prices and currency exchange rates, utilizing a
sensitivity analysis. This analysis estimates the potential changes in fair value based on a hypothetical 10% change (increase or decrease)
in interest rates, equity market prices and currency exchange rates. The Company believes that a 10% change (increase or decrease) in
these market rates and prices is reasonably possible in the near-term. In performing this analysis, the Company used market rates at
December 31, 2007 to re-price its invested assets and other financial instruments. The sensitivity analysis separately calculated each of
MetLife’s market risk exposures (interest rate, equity market price and foreign currency exchange rate) related to its trading and non-trading
invested assets and other financial instruments. The sensitivity analysis performed included the market risk sensitive holdings described
above. The Company modeled the impact of changes in market rates and prices on the fair values of its invested assets as follows:
• the net present values of its interest rate sensitive exposures resulting from a 10% change (increase or decrease) in interest rates;
• the market value of its equity positions due to a 10% change (increase or decrease) in equity prices; and
• the U.S. dollar equivalent balances of the Company’s currency exposures due to a 10% change (increase or decrease) in currency
exchange rates.
The sensitivity analysis is an estimate and should not be viewed as predictive of the Company’s future financial performance. The
Company cannot assure that its actual losses in any particular year will not exceed the amounts indicated in the table below. Limitations
related to this sensitivity analysis include:
• the market risk information is limited by the assumptions and parameters established in creating the related sensitivity analysis,
including the impact of prepayment rates on mortgages;
• for derivatives that qualify as hedges, the impact on reported earnings may be materially different from the change in market values;
• the analysis excludes other significant real estate holdings and liabilities pursuant to insurance contracts; and
• the model assumes that the composition of assets and liabilities remains unchanged throughout the year.
Accordingly, the Company uses such models as tools and not substitutes for the experience and judgment of its corporate risk and
asset/liability management personnel. Based on its analysis of the impact of a 10% change (increase or decrease) in market rates and
prices, MetLife has determined that such a change could have a material adverse effect on the fair value of its interest rate sensitive
invested assets. The equity and foreign currency portfolios do not expose the Company to material market risk.
87MetLife, Inc.
The table below illustrates the potential loss in fair value of the Company’s interest rate sensitive financial instruments at December 31,
2007. In addition, the potential loss with respect to the fair value of currency exchange rates and the Company’s equity price sensitive
positions at December 31, 2007 is set forth in the table below.
The potential loss in fair value for each market risk exposure of the Company’s portfolio at December 31, 2007 was:
December 31, 2007
(In millions)
Non-trading:
Interest rate risk . . . . . . . . . . . . . . . . . . . . . . . . . . . . . . . . . . . . . . . . . . . . . . . . . . . . . . . $5,170
Equity price risk . . . . . . . . . . . . . . . . . . . . . . . . . . . . . . . . . . . . . . . . . . . . . . . . . . . . . . . $ 96
Foreign currency exchange rate risk . . . . . . . . . . . . . . . . . . . . . . . . . . . . . . . . . . . . . . . . . . $ 711
Trading:
Interest rate risk . . . . . . . . . . . . . . . . . . . . . . . . . . . . . . . . . . . . . . . . . . . . . . . . . . . . . . . $ 18
The table below provides additional detail regarding the potential loss in fair value of the Company’s non-trading interest sensitive
financial instruments at December 31, 2007 by type of asset or liability:
Notional
Amount
Estimated
Fair Value
Assuming a
10% increase
in the yield
curve
December 31, 2007
(In millions)
Assets
Fixed maturity securities . . . . . . . . . . . . . . . . . . . . . . . . . . . . . . . . . . . . . . . . . . . . . . . $242,242 $(5,177)
Equity securities . . . . . . . . . . . . . . . . . . . . . . . . . . . . . . . . . . . . . . . . . . . . . . . . . . . . 6,050 —
Mortgage and consumer loans . . . . . . . . . . . . . . . . . . . . . . . . . . . . . . . . . . . . . . . . . . . 47,599 (594)
Policy loans . . . . . . . . . . . . . . . . . . . . . . . . . . . . . . . . . . . . . . . . . . . . . . . . . . . . . . . 10,419 (235)
Short-term investments . . . . . . . . . . . . . . . . . . . . . . . . . . . . . . . . . . . . . . . . . . . . . . . . 2,648 (15)
Cash and cash equivalents . . . . . . . . . . . . . . . . . . . . . . . . . . . . . . . . . . . . . . . . . . . . . 10,368 —
Mortgage loan commitments . . . . . . . . . . . . . . . . . . . . . . . . . . . . . . . . . . . . . . . . . . . . $ 4,035 (43) (50)
Commitments to fund bank credit facilities, bridge loans and
private corporate bond investments . . . . . . . . . . . . . . . . . . . . . . . . . . . . . . . . . . . . . . $ 1,196 (59) —
Total assets . . . . . . . . . . . . . . . . . . . . . . . . . . . . . . . . . . . . . . . . . . . . . . . . . . . . . . $(6,071)
Liabilities
Policyholder account balances . . . . . . . . . . . . . . . . . . . . . . . . . . . . . . . . . . . . . . . . . . . $114,466 $ 840
Short-term debt . . . . . . . . . . . . . . . . . . . . . . . . . . . . . . . . . . . . . . . . . . . . . . . . . . . . 667 —
Long-term debt . . . . . . . . . . . . . . . . . . . . . . . . . . . . . . . . . . . . . . . . . . . . . . . . . . . . . 9,532 307
Collateral financing arrangements . . . . . . . . . . . . . . . . . . . . . . . . . . . . . . . . . . . . . . . . . 5,365 —
Junior subordinated debt securities . . . . . . . . . . . . . . . . . . . . . . . . . . . . . . . . . . . . . . . . 4,338 136
Shares subject to mandatory redemption . . . . . . . . . . . . . . . . . . . . . . . . . . . . . . . . . . . . 178 —
Payables for collateral under securities loaned and other transactions . . . . . . . . . . . . . . . . . . 44,136 —
Total liabilities . . . . . . . . . . . . . . . . . . . . . . . . . . . . . . . . . . . . . . . . . . . . . . . . . . . . $ 1,283
Other
Derivative instruments (designated hedges or otherwise)
Interest rate swaps . . . . . . . . . . . . . . . . . . . . . . . . . . . . . . . . . . . . . . . . . . . . . . . . . $62,519 $ 17 $ (132)
Interest rate floors . . . . . . . . . . . . . . . . . . . . . . . . . . . . . . . . . . . . . . . . . . . . . . . . . . 48,937 621 (47)
Interest rate caps . . . . . . . . . . . . . . . . . . . . . . . . . . . . . . . . . . . . . . . . . . . . . . . . . . 45,498 50 33
Financial futures . . . . . . . . . . . . . . . . . . . . . . . . . . . . . . . . . . . . . . . . . . . . . . . . . . . 10,817 32 (41)
Foreign currency swaps . . . . . . . . . . . . . . . . . . . . . . . . . . . . . . . . . . . . . . . . . . . . . . 21,399 (244) (97)
Foreign currency forwards . . . . . . . . . . . . . . . . . . . . . . . . . . . . . . . . . . . . . . . . . . . . 4,185 60 —
Options . . . . . . . . . . . . . . . . . . . . . . . . . . . . . . . . . . . . . . . . . . . . . . . . . . . . . . . . 2,043 712 (93)
Financial forwards . . . . . . . . . . . . . . . . . . . . . . . . . . . . . . . . . . . . . . . . . . . . . . . . . . 4,600 120 (5)
Credit default swaps . . . . . . . . . . . . . . . . . . . . . . . . . . . . . . . . . . . . . . . . . . . . . . . . 6,850 23 (1)
Synthetic GICs . . . . . . . . . . . . . . . . . . . . . . . . . . . . . . . . . . . . . . . . . . . . . . . . . . . . 3,670 — —
Other . . . . . . . . . . . . . . . . . . . . . . . . . . . . . . . . . . . . . . . . . . . . . . . . . . . . . . . . . . 250 43 1
Total other . . . . . . . . . . . . . . . . . . . . . . . . . . . . . . . . . . . . . . . . . . . . . . . . . . . . . $ (382)
Net change . . . . . . . . . . . . . . . . . . . . . . . . . . . . . . . . . . . . . . . . . . . . . . . . . . . . . . . . $(5,170)
This quantitative measure of risk has decreased by $805 million, or 13%, to $5,170 million at December 31, 2007 from $5,975 million at
December 31, 2006. A decrease in the yield curve has decreased our sensitivity by $1.5 billion. This decrease was partially offset by
$140 million due to increased asset size, $270 million due to increased derivative usage and $285 million due to duration charges and
other.
In addition to the analysis above, as part of its asset liability management program, the Company also performs an analysis of the
sensitivity to changes in interest rates, including both insurance liabilities and financial instruments. As of December 31, 2007, a
hypothetical instantaneous 10% decrease in interest rates applied to the Company’s liabilities, insurance and associated asset portfolios
would reduce the fair value of equity by $12 million. Management does not expect that this sensitivity would produce a liquidity strain on the
Company.
88 MetLife, Inc.
Changes in and Disagreements With Accountants on Accounting and Financial Disclosure
None.
Management’s Annual Report on Internal Control Over Financial Reporting
Management of MetLife, Inc. and subsidiaries is responsible for establishing and maintaining adequate internal control over financial
reporting. In fulfilling this responsibility, estimates and judgments by management are required to assess the expected benefits and related
costs of control procedures. The objectives of internal control include providing management with reasonable, but not absolute, assurance
that assets are safeguarded against loss from unauthorized use or disposition, and that transactions are executed in accordance with
management’s authorization and recorded properly to permit the preparation of consolidated financial statements in conformity with GAAP.
Financial management has documented and evaluated the effectiveness of the internal control of the Company as of December 31,
2007 pertaining to financial reporting in accordance with the criteria established in Internal Control — Integrated Framework issued by the
Committee of Sponsoring Organizations of the Treadway Commission.
In the opinion of management, MetLife, Inc. maintained effective internal control over financial reporting as of December 31, 2007.
Deloitte & Touche LLP, an independent registered public accounting firm, has audited the consolidated financial statements and
consolidated financial statement schedules included in the Annual Report on Form 10-K for the year ended December 31, 2007. The
Report of the Independent Registered Public Accounting Firm on their audit of the consolidated financial statements and consolidated
financial statement schedules is included at page F-1.
Attestation Report of the Company’s Registered Public Accounting Firm
The Company’s independent registered public accounting firm, Deloitte & Touche LLP, has issued their attestation report on
management’s internal control over financial reporting which is set forth below.
89MetLife, Inc.
REPORT OF INDEPENDENT REGISTERED PUBLIC ACCOUNTING FIRM
To the Board of Directors and Stockholders of
MetLife, Inc.:
We have audited the internal control over financial reporting of MetLife, Inc. and subsidiaries (the “Company”) as of December 31, 2007,
based on criteria established in Internal Control — Integrated Framework issued by the Committee of Sponsoring Organizations of the
Treadway Commission. The Company’s management is responsible for maintaining effective internal control over financial reporting and for
its assessment of the effectiveness of internal control over financial reporting, included in the accompanying Management’s Annual Report
on Internal Control over Financial Reporting. Our responsibility is to express an opinion on the Company’s internal control over financial
reporting based on our audit.
We conducted our audit in accordance with the standards of the Public Company Accounting Oversight Board (United States). Those
standards require that we plan and perform the audit to obtain reasonable assurance about whether effective internal control over financial
reporting was maintained in all material respects. Our audit included obtaining an understanding of internal control over financial reporting,
assessing the risk that a material weakness exists, testing and evaluating the design and operating effectiveness of internal control based
on the assessed risk, and performing such other procedures as we considered necessary in the circumstances. We believe that our audit
provides a reasonable basis for our opinion.
A company’s internal control over financial reporting is a process designed by, or under the supervision of, the company’s principal
executive and principal financial officers, or persons performing similar functions, and effected by the company’s board of directors,
management, and other personnel to provide reasonable assurance regarding the reliability of financial reporting and the preparation of
financial statements for external purposes in accordance with generally accepted accounting principles. A company’s internal control over
financial reporting includes those policies and procedures that (1) pertain to the maintenance of records that, in reasonable detail,
accurately and fairly reflect the transactions and dispositions of the assets of the company; (2) provide reasonable assurance that
transactions are recorded as necessary to permit preparation of financial statements in accordance with generally accepted accounting
principles, and that receipts and expenditures of the company are being made only in accordance with authorizations of management and
directors of the company; and (3) provide reasonable assurance regarding prevention or timely detection of unauthorized acquisition, use,
or disposition of the company’s assets that could have a material effect on the financial statements.
Because of the inherent limitations of internal control over financial reporting, including the possibility of collusion or improper
management override of controls, material misstatements due to error or fraud may not be prevented or detected on a timely basis.
Also, projections of any evaluation of the effectiveness of the internal control over financial reporting to future periods are subject to the risk
that the controls may become inadequate because of changes in conditions, or that the degree of compliance with the policies or
procedures may deteriorate.
In our opinion, the Company maintained, in all material respects, effective internal control over financial reporting as of December 31,
2007, based on the criteria established in Internal Control — Integrated Framework issued by the Committee of Sponsoring Organizations
of the Treadway Commission.
We have also audited, in accordance with the standards of the Public Company Accounting Oversight Board (United States), the
consolidated financial statements as of and for the year ended December 31, 2007, of the Company, and our report dated February 28,
2008, expressed an unqualified opinion on those consolidated financial statements and included an explanatory paragraph regarding
changes in the Company’s method of accounting for deferred acquisition costs and for income taxes as required by accounting guidance
adopted on January 1, 2007.
/s/ DELOITTE & TOUCHE LLP
DELOITTE & TOUCHE LLP
New York, New York
February 28, 2008
90 MetLife, Inc.
Financial Statements
INDEX TO CONSOLIDATED FINANCIAL STATEMENTS
Page
Report of Independent Registered Public Accounting Firm . . . . . . . . . . . . . . . . . . . . . . . . . . . . . . . . . . . . . . . . . . . . . . . F-1
Financial Statements at December 31, 2007 and 2006 and for the Years Ended December 31, 2007, 2006 and 2005:
Consolidated Balance Sheets . . . . . . . . . . . . . . . . . . . . . . . . . . . . . . . . . . . . . . . . . . . . . . . . . . . . . . . . . . . . . . . F-2
Consolidated Statements of Income . . . . . . . . . . . . . . . . . . . . . . . . . . . . . . . . . . . . . . . . . . . . . . . . . . . . . . . . . . . F-3
Consolidated Statements of Stockholders’ Equity . . . . . . . . . . . . . . . . . . . . . . . . . . . . . . . . . . . . . . . . . . . . . . . . . . . F-4
Consolidated Statements of Cash Flows . . . . . . . . . . . . . . . . . . . . . . . . . . . . . . . . . . . . . . . . . . . . . . . . . . . . . . . . F-5
Notes to Consolidated Financial Statements . . . . . . . . . . . . . . . . . . . . . . . . . . . . . . . . . . . . . . . . . . . . . . . . . . . . . . F-7
91MetLife, Inc.
[This Page Intentionally Left Blank.]
REPORT OF INDEPENDENT REGISTERED PUBLIC ACCOUNTING FIRM
To the Board of Directors and Stockholders of
MetLife, Inc.:
We have audited the accompanying consolidated balance sheets of MetLife, Inc. and subsidiaries (the “Company”) as of December 31,
2007 and 2006, and the related consolidated statements of income, stockholders’ equity, and cash flows for each of the three years in the
period ended December 31, 2007. These consolidated financial statements are the responsibility of the Company’s management. Our
responsibility is to express an opinion on the consolidated financial statements based on our audits.
We conducted our audits in accordance with the standards of the Public Company Accounting Oversight Board (United States). Those
standards require that we plan and perform the audit to obtain reasonable assurance about whether the consolidated financial statements
are free of material misstatement. An audit includes examining, on a test basis, evidence supporting the amounts and disclosures in the
consolidated financial statements. An audit also includes assessing the accounting principles used and significant estimates made by
management, as well as evaluating the overall financial statement presentation. We believe that our audits provide a reasonable basis for
our opinion.
In our opinion, such consolidated financial statements present fairly, in all material respects, the financial position of MetLife, Inc. and
subsidiaries as of December 31, 2007 and 2006, and the results of their operations and their cash flows for each of the three years in the
period ended December 31, 2007, in conformity with accounting principles generally accepted in the United States of America.
As discussed in Note 1, the Company changed its method of accounting for deferred acquisition costs and for income taxes as required
by accounting guidance adopted on January 1, 2007, and changed its method of accounting for defined benefit pension and other
postretirement plans as required by accounting guidance adopted on December 31, 2006.
We have also audited, in accordance with the standards of the Public Company Accounting Oversight Board (United States), the
Company’s internal control over financial reporting as of December 31, 2007, based on the criteria established in Internal Control —
Integrated Framework issued by the Committee of Sponsoring Organizations of the Treadway Commission, and our report, dated
February 28, 2008, expressed an unqualified opinion on the Company’s internal control over financial reporting.
/s/ DELOITTE & TOUCHE LLP
DELOITTE & TOUCHE LLP
New York, New York
February 28, 2008
F-1MetLife, Inc.
MetLife, Inc.
Consolidated Balance Sheets
December 31, 2007 and 2006
(In millions, except share and per share data)
2007 2006
Assets
Investments:
Fixed maturity securities available-for-sale, at estimated fair value (amortized cost: $238,761 and
$236,768, respectively) . . . . . . . . . . . . . . . . . . . . . . . . . . . . . . . . . . . . . . . . . . . . . . . . . . . . . . . $242,242 $241,928
Equity securities available-for-sale, at estimated fair value (cost: $5,891 and $4,549, respectively) . . . . . . . . 6,050 5,094
Trading securities, at estimated fair value (cost: $768 and $727, respectively) . . . . . . . . . . . . . . . . . . . . . 779 759
Mortgage and consumer loans . . . . . . . . . . . . . . . . . . . . . . . . . . . . . . . . . . . . . . . . . . . . . . . . . . . . 47,030 42,239
Policy loans . . . . . . . . . . . . . . . . . . . . . . . . . . . . . . . . . . . . . . . . . . . . . . . . . . . . . . . . . . . . . . . . 10,419 10,228
Real estate and real estate joint ventures held-for-investment . . . . . . . . . . . . . . . . . . . . . . . . . . . . . . . . 6,597 4,802
Real estate held-for-sale . . . . . . . . . . . . . . . . . . . . . . . . . . . . . . . . . . . . . . . . . . . . . . . . . . . . . . . . 172 184
Other limited partnership interests . . . . . . . . . . . . . . . . . . . . . . . . . . . . . . . . . . . . . . . . . . . . . . . . . . 6,155 4,781
Short-term investments . . . . . . . . . . . . . . . . . . . . . . . . . . . . . . . . . . . . . . . . . . . . . . . . . . . . . . . . 2,648 2,709
Other invested assets . . . . . . . . . . . . . . . . . . . . . . . . . . . . . . . . . . . . . . . . . . . . . . . . . . . . . . . . . 12,642 10,428
Total investments . . . . . . . . . . . . . . . . . . . . . . . . . . . . . . . . . . . . . . . . . . . . . . . . . . . . . . . . 334,734 323,152
Cash and cash equivalents . . . . . . . . . . . . . . . . . . . . . . . . . . . . . . . . . . . . . . . . . . . . . . . . . . . . . . . 10,368 7,107
Accrued investment income . . . . . . . . . . . . . . . . . . . . . . . . . . . . . . . . . . . . . . . . . . . . . . . . . . . . . . . 3,630 3,347
Premiums and other receivables . . . . . . . . . . . . . . . . . . . . . . . . . . . . . . . . . . . . . . . . . . . . . . . . . . . . 14,607 14,490
Deferred policy acquisition costs and value of business acquired . . . . . . . . . . . . . . . . . . . . . . . . . . . . . . . 21,521 20,838
Current income tax recoverable . . . . . . . . . . . . . . . . . . . . . . . . . . . . . . . . . . . . . . . . . . . . . . . . . . . . . 303 —
Goodwill. . . . . . . . . . . . . . . . . . . . . . . . . . . . . . . . . . . . . . . . . . . . . . . . . . . . . . . . . . . . . . . . . . . . 4,910 4,897
Assets of subsidiaries held-for-sale . . . . . . . . . . . . . . . . . . . . . . . . . . . . . . . . . . . . . . . . . . . . . . . . . . — 1,563
Other assets . . . . . . . . . . . . . . . . . . . . . . . . . . . . . . . . . . . . . . . . . . . . . . . . . . . . . . . . . . . . . . . . . 8,330 7,956
Separate account assets . . . . . . . . . . . . . . . . . . . . . . . . . . . . . . . . . . . . . . . . . . . . . . . . . . . . . . . . . 160,159 144,365
Total assets . . . . . . . . . . . . . . . . . . . . . . . . . . . . . . . . . . . . . . . . . . . . . . . . . . . . . . . . . . . . $558,562 $527,715
Liabilities and Stockholders’ Equity
Liabilities:
Future policy benefits . . . . . . . . . . . . . . . . . . . . . . . . . . . . . . . . . . . . . . . . . . . . . . . . . . . . . . . . . . $132,262 $127,489
Policyholder account balances . . . . . . . . . . . . . . . . . . . . . . . . . . . . . . . . . . . . . . . . . . . . . . . . . . . . 137,349 131,948
Other policyholder funds . . . . . . . . . . . . . . . . . . . . . . . . . . . . . . . . . . . . . . . . . . . . . . . . . . . . . . . . 10,176 9,139
Policyholder dividends payable. . . . . . . . . . . . . . . . . . . . . . . . . . . . . . . . . . . . . . . . . . . . . . . . . . . . 994 960
Policyholder dividend obligation . . . . . . . . . . . . . . . . . . . . . . . . . . . . . . . . . . . . . . . . . . . . . . . . . . . 789 1,063
Short-term debt . . . . . . . . . . . . . . . . . . . . . . . . . . . . . . . . . . . . . . . . . . . . . . . . . . . . . . . . . . . . . 667 1,449
Long-term debt . . . . . . . . . . . . . . . . . . . . . . . . . . . . . . . . . . . . . . . . . . . . . . . . . . . . . . . . . . . . . . 9,628 9,129
Collateral financing arrangements . . . . . . . . . . . . . . . . . . . . . . . . . . . . . . . . . . . . . . . . . . . . . . . . . . 5,732 850
Junior subordinated debt securities . . . . . . . . . . . . . . . . . . . . . . . . . . . . . . . . . . . . . . . . . . . . . . . . . 4,474 3,780
Shares subject to mandatory redemption . . . . . . . . . . . . . . . . . . . . . . . . . . . . . . . . . . . . . . . . . . . . . 159 278
Liabilities of subsidiaries held-for-sale . . . . . . . . . . . . . . . . . . . . . . . . . . . . . . . . . . . . . . . . . . . . . . . — 1,595
Current income tax payable . . . . . . . . . . . . . . . . . . . . . . . . . . . . . . . . . . . . . . . . . . . . . . . . . . . . . . — 1,465
Deferred income tax liability . . . . . . . . . . . . . . . . . . . . . . . . . . . . . . . . . . . . . . . . . . . . . . . . . . . . . . 2,457 2,278
Payables for collateral under securities loaned and other transactions . . . . . . . . . . . . . . . . . . . . . . . . . . 44,136 45,846
Other liabilities . . . . . . . . . . . . . . . . . . . . . . . . . . . . . . . . . . . . . . . . . . . . . . . . . . . . . . . . . . . . . . 14,401 12,283
Separate account liabilities . . . . . . . . . . . . . . . . . . . . . . . . . . . . . . . . . . . . . . . . . . . . . . . . . . . . . . 160,159 144,365
Total liabilities. . . . . . . . . . . . . . . . . . . . . . . . . . . . . . . . . . . . . . . . . . . . . . . . . . . . . . . . . . . 523,383 493,917
Contingencies, Commitments and Guarantees (Note 16)
Stockholders’ Equity:
Preferred stock, par value $0.01 per share; 200,000,000 shares authorized; 84,000,000 shares issued and
outstanding; $2,100 aggregate liquidation preference . . . . . . . . . . . . . . . . . . . . . . . . . . . . . . . . . . . . . 1 1
Common stock, par value $0.01 per share; 3,000,000,000 shares authorized; 786,766,664 shares issued;
729,223,440 and 751,984,799 shares outstanding at December 31, 2007 and 2006, respectively. . . . . . . . 8 8
Additional paid-in capital . . . . . . . . . . . . . . . . . . . . . . . . . . . . . . . . . . . . . . . . . . . . . . . . . . . . . . . . . 17,098 17,454
Retained earnings . . . . . . . . . . . . . . . . . . . . . . . . . . . . . . . . . . . . . . . . . . . . . . . . . . . . . . . . . . . . . 19,884 16,574
Treasury stock, at cost; 57,543,224 shares and 34,781,865 shares at December 31, 2007 and 2006,
respectively . . . . . . . . . . . . . . . . . . . . . . . . . . . . . . . . . . . . . . . . . . . . . . . . . . . . . . . . . . . . . . . . (2,890) (1,357)
Accumulated other comprehensive income . . . . . . . . . . . . . . . . . . . . . . . . . . . . . . . . . . . . . . . . . . . . . 1,078 1,118
Total stockholders’ equity . . . . . . . . . . . . . . . . . . . . . . . . . . . . . . . . . . . . . . . . . . . . . . . . . . . . . . 35,179 33,798
Total liabilities and stockholders’ equity . . . . . . . . . . . . . . . . . . . . . . . . . . . . . . . . . . . . . . . . . . . . . $558,562 $527,715
See accompanying notes to consolidated financial statements.
F-2 MetLife, Inc.
MetLife, Inc.
Consolidated Statements of Income
For the Years Ended December 31, 2007, 2006 and 2005
(In millions, except per share data)
2007 2006 2005
Revenues
Premiums . . . . . . . . . . . . . . . . . . . . . . . . . . . . . . . . . . . . . . . . . . . . . . . . . . . . . . . . . . . . . $27,895 $26,412 $24,860
Universal life and investment-type product policy fees . . . . . . . . . . . . . . . . . . . . . . . . . . . . . . . . 5,311 4,780 3,828
Net investment income . . . . . . . . . . . . . . . . . . . . . . . . . . . . . . . . . . . . . . . . . . . . . . . . . . . . 19,006 17,082 14,756
Other revenues . . . . . . . . . . . . . . . . . . . . . . . . . . . . . . . . . . . . . . . . . . . . . . . . . . . . . . . . . 1,533 1,362 1,271
Net investment gains (losses) . . . . . . . . . . . . . . . . . . . . . . . . . . . . . . . . . . . . . . . . . . . . . . . . (738) (1,382) (86)
Total revenues . . . . . . . . . . . . . . . . . . . . . . . . . . . . . . . . . . . . . . . . . . . . . . . . . . . . 53,007 48,254 44,629
Expenses
Policyholder benefits and claims . . . . . . . . . . . . . . . . . . . . . . . . . . . . . . . . . . . . . . . . . . . . . . 27,828 26,431 25,506
Interest credited to policyholder account balances . . . . . . . . . . . . . . . . . . . . . . . . . . . . . . . . . . 5,741 5,171 3,887
Policyholder dividends . . . . . . . . . . . . . . . . . . . . . . . . . . . . . . . . . . . . . . . . . . . . . . . . . . . . . 1,726 1,701 1,679
Other expenses . . . . . . . . . . . . . . . . . . . . . . . . . . . . . . . . . . . . . . . . . . . . . . . . . . . . . . . . . 11,673 10,783 9,264
Total expenses . . . . . . . . . . . . . . . . . . . . . . . . . . . . . . . . . . . . . . . . . . . . . . . . . . . . 46,968 44,086 40,336
Income from continuing operations before provision for income tax . . . . . . . . . . . . . . . . . . . . . . . . 6,039 4,168 4,293
Provision for income tax . . . . . . . . . . . . . . . . . . . . . . . . . . . . . . . . . . . . . . . . . . . . . . . . . . . . 1,759 1,097 1,222
Income from continuing operations . . . . . . . . . . . . . . . . . . . . . . . . . . . . . . . . . . . . . . . . . . . . . 4,280 3,071 3,071
Income from discontinued operations, net of income tax . . . . . . . . . . . . . . . . . . . . . . . . . . . . . . . 37 3,222 1,643
Net income . . . . . . . . . . . . . . . . . . . . . . . . . . . . . . . . . . . . . . . . . . . . . . . . . . . . . . . . . . . . 4,317 6,293 4,714
Preferred stock dividends . . . . . . . . . . . . . . . . . . . . . . . . . . . . . . . . . . . . . . . . . . . . . . . . . . . 137 134 63
Net income available to common shareholders . . . . . . . . . . . . . . . . . . . . . . . . . . . . . . . . . . . . . $ 4,180 $ 6,159 $ 4,651
Income from continuing operations available to common shareholders per common share
Basic . . . . . . . . . . . . . . . . . . . . . . . . . . . . . . . . . . . . . . . . . . . . . . . . . . . . . . . . . . . . . . $ 5.57 $ 3.85 $ 4.02
Diluted . . . . . . . . . . . . . . . . . . . . . . . . . . . . . . . . . . . . . . . . . . . . . . . . . . . . . . . . . . . . . $ 5.44 $ 3.81 $ 3.98
Net income available to common shareholders per common share
Basic . . . . . . . . . . . . . . . . . . . . . . . . . . . . . . . . . . . . . . . . . . . . . . . . . . . . . . . . . . . . . . $ 5.62 $ 8.09 $ 6.21
Diluted . . . . . . . . . . . . . . . . . . . . . . . . . . . . . . . . . . . . . . . . . . . . . . . . . . . . . . . . . . . . . $ 5.48 $ 7.99 $ 6.16
Cash dividends per common share . . . . . . . . . . . . . . . . . . . . . . . . . . . . . . . . . . . . . . . . . . . . $ 0.74 $ 0.59 $ 0.52
See accompanying notes to consolidated financial statements.
F-3MetLife, Inc.
MetLife, Inc.
Consolidated Statements of Stockholders’ Equity
For the Years Ended December 31, 2007, 2006 and 2005
(In millions)
Preferred
Stock
Common
Stock
Additional
Paid-in
Capital
Retained
Earnings
Treasury
Stock
at Cost
Net
Unrealized
Investment
Gains (Losses)
Foreign
Currency
Translation
Adjustments
Defined
Benefit
Plans
Adjustment Total
Accumulated Other
Comprehensive Income
Balance at January 1, 2005 . . . . . . . . . . . . . $— $8 $15,037 $ 6,608 (1,785) $ 2,994 $ 92 $(130) $22,824
Treasury stock transactions, net . . . . . . . . . . 58 99 157
Common stock issued in connection with
acquisition . . . . . . . . . . . . . . . . . . . . . . 283 727 1,010
Issuance of preferred stock . . . . . . . . . . . . . 1 2,042 2,043
Issuance of stock purchase contracts related to
common equity units . . . . . . . . . . . . . . . . (146) (146)
Dividends on preferred stock . . . . . . . . . . . . (63) (63)
Dividends on common stock . . . . . . . . . . . . (394) (394)
Comprehensive income:
Net income . . . . . . . . . . . . . . . . . . . . . . 4,714 4,714
Other comprehensive income (loss):
Unrealized gains (losses) on derivative
instruments, net of income tax . . . . . . . 233 233
Unrealized investment gains (losses), net of
related offsets and income tax . . . . . . . (1,285) (1,285)
Foreign currency translation adjustments,
net of income tax . . . . . . . . . . . . . . . (81) (81)
Additional minimum pension liability
adjustment, net of income tax . . . . . . . . 89 89
Other comprehensive income (loss). . . . . . . . . (1,044)
Comprehensive income . . . . . . . . . . . . . . 3,670
Balance at December 31, 2005. . . . . . . . . . . 1 8 17,274 10,865 (959) 1,942 11 (41) 29,101
Treasury stock transactions, net . . . . . . . . . . 180 (398) (218)
Dividends on preferred stock . . . . . . . . . . . . (134) (134)
Dividends on common stock . . . . . . . . . . . . (450) (450)
Comprehensive income:
Net income . . . . . . . . . . . . . . . . . . . . . . 6,293 6,293
Other comprehensive income (loss):
Unrealized gains (losses) on derivative
instruments, net of income tax . . . . . . . (43) (43)
Unrealized investment gains (losses), net of
related offsets and income tax . . . . . . . (35) (35)
Foreign currency translation adjustments,
net of income tax . . . . . . . . . . . . . . . 46 46
Additional minimum pension liability
adjustment, net of income tax . . . . . . . . (18) (18)
Other comprehensive income (loss). . . . . . . . . (50)
Comprehensive income . . . . . . . . . . . . . . 6,243
Adoption of SFAS 158, net of income tax . . . (744) (744)
Balance at December 31, 2006. . . . . . . . . . . 1 8 17,454 16,574 (1,357) 1,864 57 (803) 33,798
Cumulative effect of changes in accounting
principles, net of income tax (Note 1) . . . . . . (329) (329)
Balance at January 1, 2007 . . . . . . . . . . . . . 1 8 17,454 16,245 (1,357) 1,864 57 (803) 33,469
Treasury stock transactions, net . . . . . . . . . . 94 (1,533) (1,439)
Obligation under accelerated common stock
repurchase agreement (Note 18) . . . . . . . . (450) (450)
Dividends on preferred stock . . . . . . . . . . . . (137) (137)
Dividends on common stock . . . . . . . . . . . . (541) (541)
Comprehensive income:
Net income . . . . . . . . . . . . . . . . . . . . . . 4,317 4,317
Other comprehensive income (loss):
Unrealized gains (losses) on derivative
instruments, net of income tax . . . . . . . (40) (40)
Unrealized investment gains (losses), net of
related offsets and income tax . . . . . . . (853) (853)
Foreign currency translation adjustments,
net of income tax . . . . . . . . . . . . . . . 290 290
Defined benefit plans adjustment, net of
income tax . . . . . . . . . . . . . . . . . . . . 563 563
Other comprehensive income (loss) . . . . . (40)
Comprehensive income . . . . . . . . . . . . . . 4,277
Balance at December 31, 2007. . . . . . . . . . . $ 1 $8 $17,098 $19,884 $(2,890) $ 971 $347 $(240) $35,179
See accompanying notes to consolidated financial statements.
F-4 MetLife, Inc.
MetLife, Inc.
Consolidated Statements of Cash Flows
For the Years Ended December 31, 2007, 2006 and 2005
(In millions)
2007 2006 2005
Cash flows from operating activities
Net income . . . . . . . . . . . . . . . . . . . . . . . . . . . . . . . . . . . . . . . . . . . . . . . . . . . . . . . . $ 4,317 $ 6,293 $ 4,714
Adjustments to reconcile net income to net cash provided by operating activities:
Depreciation and amortization expenses . . . . . . . . . . . . . . . . . . . . . . . . . . . . . . . . . . 457 394 352
Amortization of premiums and accretion of discounts associated with investments, net . . . . (955) (618) (201)
(Gains) losses from sales of investments and businesses, net . . . . . . . . . . . . . . . . . . . . . 619 (3,492) (2,271)
Undistributed equity earnings of real estate joint ventures
and other limited partnership interests. . . . . . . . . . . . . . . . . . . . . . . . . . . . . . . . . . . (606) (459) (416)
Interest credited to policyholder account balances . . . . . . . . . . . . . . . . . . . . . . . . . . . . 5,790 5,246 3,925
Interest credited to bank deposits . . . . . . . . . . . . . . . . . . . . . . . . . . . . . . . . . . . . . . . 200 193 106
Universal life and investment-type product policy fees . . . . . . . . . . . . . . . . . . . . . . . . . . (5,311) (4,780) (3,828)
Change in accrued investment income . . . . . . . . . . . . . . . . . . . . . . . . . . . . . . . . . . . (275) (315) (157)
Change in premiums and other receivables . . . . . . . . . . . . . . . . . . . . . . . . . . . . . . . . . (283) (2,655) (37)
Change in deferred policy acquisition costs, net . . . . . . . . . . . . . . . . . . . . . . . . . . . . . (1,178) (1,317) (1,043)
Change in insurance-related liabilities . . . . . . . . . . . . . . . . . . . . . . . . . . . . . . . . . . . . 5,463 5,031 5,709
Change in trading securities . . . . . . . . . . . . . . . . . . . . . . . . . . . . . . . . . . . . . . . . . . 200 (432) (244)
Change in income tax payable . . . . . . . . . . . . . . . . . . . . . . . . . . . . . . . . . . . . . . . . . 101 2,039 528
Change in other assets . . . . . . . . . . . . . . . . . . . . . . . . . . . . . . . . . . . . . . . . . . . . . 643 1,712 347
Change in other liabilities . . . . . . . . . . . . . . . . . . . . . . . . . . . . . . . . . . . . . . . . . . . . 729 (202) 506
Other, net . . . . . . . . . . . . . . . . . . . . . . . . . . . . . . . . . . . . . . . . . . . . . . . . . . . . . . 51 (38) 29
Net cash provided by operating activities . . . . . . . . . . . . . . . . . . . . . . . . . . . . . . . . . . . . . 9,962 6,600 8,019
Cash flows from investing activities
Sales, maturities and repayments of:
Fixed maturity securities . . . . . . . . . . . . . . . . . . . . . . . . . . . . . . . . . . . . . . . . . . . . 112,062 113,321 155,709
Equity securities . . . . . . . . . . . . . . . . . . . . . . . . . . . . . . . . . . . . . . . . . . . . . . . . . . 1,738 1,313 1,062
Mortgage and consumer loans . . . . . . . . . . . . . . . . . . . . . . . . . . . . . . . . . . . . . . . . . 9,854 8,348 8,462
Real estate and real estate joint ventures . . . . . . . . . . . . . . . . . . . . . . . . . . . . . . . . . . 664 6,211 3,668
Other limited partnership interests. . . . . . . . . . . . . . . . . . . . . . . . . . . . . . . . . . . . . . . 1,121 1,768 1,132
Purchases of:
Fixed maturity securities . . . . . . . . . . . . . . . . . . . . . . . . . . . . . . . . . . . . . . . . . . . . . (112,534) (129,644) (169,111)
Equity securities . . . . . . . . . . . . . . . . . . . . . . . . . . . . . . . . . . . . . . . . . . . . . . . . . . (2,883) (1,052) (1,509)
Mortgage and consumer loans . . . . . . . . . . . . . . . . . . . . . . . . . . . . . . . . . . . . . . . . . (14,365) (13,472) (10,902)
Real estate and real estate joint ventures . . . . . . . . . . . . . . . . . . . . . . . . . . . . . . . . . . (2,228) (1,523) (1,451)
Other limited partnership interests. . . . . . . . . . . . . . . . . . . . . . . . . . . . . . . . . . . . . . . (2,041) (1,915) (1,105)
Net change in short-term investments . . . . . . . . . . . . . . . . . . . . . . . . . . . . . . . . . . . . . 55 595 2,267
Additional consideration related to purchases of businesses . . . . . . . . . . . . . . . . . . . . . . . — (115) —
Purchases of businesses, net of cash received of $13, $0 and $852, respectively . . . . . . . . . (43) — (10,160)
Proceeds from sales of businesses, net of cash disposed of $763, $0 and $43, respectively. . (694) 48 260
Net change in other invested assets . . . . . . . . . . . . . . . . . . . . . . . . . . . . . . . . . . . . . . (1,020) (2,411) (450)
Other, net . . . . . . . . . . . . . . . . . . . . . . . . . . . . . . . . . . . . . . . . . . . . . . . . . . . . . . . . (330) (358) (489)
Net cash used in investing activities . . . . . . . . . . . . . . . . . . . . . . . . . . . . . . . . . . . . . . . . $ (10,644) $ (18,886) $ (22,617)
See accompanying notes to consolidated financial statements.
F-5MetLife, Inc.
2007 2006 2005
Cash flows from financing activities
Policyholder account balances:
Deposits . . . . . . . . . . . . . . . . . . . . . . . . . . . . . . . . . . . . . . . . . . . . . . . . . . . . . . . . . $ 58,026 $ 53,947 $ 52,077
Withdrawals . . . . . . . . . . . . . . . . . . . . . . . . . . . . . . . . . . . . . . . . . . . . . . . . . . . . . . . (55,256) (50,574) (47,827)
Net change in payables for collateral under securities loaned and other transactions . . . . . . . . . (1,710) 11,331 4,138
Net change in short-term debt . . . . . . . . . . . . . . . . . . . . . . . . . . . . . . . . . . . . . . . . . . . . (782) 35 (56)
Long-term debt issued . . . . . . . . . . . . . . . . . . . . . . . . . . . . . . . . . . . . . . . . . . . . . . . . . 726 284 3,541
Long-term debt repaid. . . . . . . . . . . . . . . . . . . . . . . . . . . . . . . . . . . . . . . . . . . . . . . . . . (286) (732) (1,430)
Collateral financing arrangements issued . . . . . . . . . . . . . . . . . . . . . . . . . . . . . . . . . . . . . . 4,882 850 —
Shares subject to mandatory redemption. . . . . . . . . . . . . . . . . . . . . . . . . . . . . . . . . . . . . . (131) — —
Preferred stock issued . . . . . . . . . . . . . . . . . . . . . . . . . . . . . . . . . . . . . . . . . . . . . . . . . — — 2,100
Dividends on preferred stock . . . . . . . . . . . . . . . . . . . . . . . . . . . . . . . . . . . . . . . . . . . . . (137) (134) (63)
Junior subordinated debt securities issued . . . . . . . . . . . . . . . . . . . . . . . . . . . . . . . . . . . . 694 1,248 2,533
Treasury stock acquired . . . . . . . . . . . . . . . . . . . . . . . . . . . . . . . . . . . . . . . . . . . . . . . . . (1,705) (500) —
Dividends on common stock . . . . . . . . . . . . . . . . . . . . . . . . . . . . . . . . . . . . . . . . . . . . . . (541) (450) (394)
Stock options exercised . . . . . . . . . . . . . . . . . . . . . . . . . . . . . . . . . . . . . . . . . . . . . . . . 110 83 72
Debt and equity issuance costs. . . . . . . . . . . . . . . . . . . . . . . . . . . . . . . . . . . . . . . . . . . . (14) (25) (128)
Other, net . . . . . . . . . . . . . . . . . . . . . . . . . . . . . . . . . . . . . . . . . . . . . . . . . . . . . . . . . . 67 12 (53)
Net cash provided by financing activities . . . . . . . . . . . . . . . . . . . . . . . . . . . . . . . . . . . . . . . 3,943 15,375 14,510
Change in cash and cash equivalents . . . . . . . . . . . . . . . . . . . . . . . . . . . . . . . . . . . . . . . . . 3,261 3,089 (88)
Cash and cash equivalents, beginning of year . . . . . . . . . . . . . . . . . . . . . . . . . . . . . . . . . . . . 7,107 4,018 4,106
Cash and cash equivalents, end of year . . . . . . . . . . . . . . . . . . . . . . . . . . . . . . . . . . . . . $ 10,368 $ 7,107 $ 4,018
Cash and cash equivalents, subsidiaries held-for-sale, beginning of year . . . . . . . . . . . . . . . . . . $ — $ — $ 58
Cash and cash equivalents, subsidiaries held-for-sale, end of year . . . . . . . . . . . . . . . . . $ — $ — $ —
Cash and cash equivalents, from continuing operations, beginning of year . . . . . . . . . . . . . . . . . $ 7,107 $ 4,018 $ 4,048
Cash and cash equivalents, from continuing operations, end of year. . . . . . . . . . . . . . . . $ 10,368 $ 7,107 $ 4,018
Supplemental disclosures of cash flow information:
Net cash paid during the year for:
Interest . . . . . . . . . . . . . . . . . . . . . . . . . . . . . . . . . . . . . . . . . . . . . . . . . . . . . . . . . . $ 1,011 $ 819 $ 579
Income tax . . . . . . . . . . . . . . . . . . . . . . . . . . . . . . . . . . . . . . . . . . . . . . . . . . . . . . . . $ 2,128 $ 409 $ 1,391
Non-cash transactions during the year:
Business acquisitions:
Assets acquired . . . . . . . . . . . . . . . . . . . . . . . . . . . . . . . . . . . . . . . . . . . . . . . . . . . $ — $ — $102,112
Less: liabilities assumed. . . . . . . . . . . . . . . . . . . . . . . . . . . . . . . . . . . . . . . . . . . . . . — — 90,090
Net assets acquired . . . . . . . . . . . . . . . . . . . . . . . . . . . . . . . . . . . . . . . . . . . . . . . . — — 12,022
Less: cash paid . . . . . . . . . . . . . . . . . . . . . . . . . . . . . . . . . . . . . . . . . . . . . . . . . . . — — 11,012
Business acquisition, common stock issued . . . . . . . . . . . . . . . . . . . . . . . . . . . . . . . . . $ — $ — $ 1,010
Business dispositions:
Assets disposed. . . . . . . . . . . . . . . . . . . . . . . . . . . . . . . . . . . . . . . . . . . . . . . . . . . $ — $ — $ 366
Less: liabilities disposed . . . . . . . . . . . . . . . . . . . . . . . . . . . . . . . . . . . . . . . . . . . . . — — 269
Net assets disposed . . . . . . . . . . . . . . . . . . . . . . . . . . . . . . . . . . . . . . . . . . . . . . . . — — 97
Plus: equity securities received . . . . . . . . . . . . . . . . . . . . . . . . . . . . . . . . . . . . . . . . . — — 43
Less: cash disposed . . . . . . . . . . . . . . . . . . . . . . . . . . . . . . . . . . . . . . . . . . . . . . . . — — 43
Business disposition, net of cash disposed . . . . . . . . . . . . . . . . . . . . . . . . . . . . . . . . . $ — $ — $ 97
Contribution of equity securities to MetLife Foundation . . . . . . . . . . . . . . . . . . . . . . . . . . $ 12 $ — $ 1
Accrual for stock purchase contracts related to common equity units . . . . . . . . . . . . . . . . $ — $ — $ 97
Real estate acquired in satisfaction of debt . . . . . . . . . . . . . . . . . . . . . . . . . . . . . . . . . $ 1 $ 6 $ 1
See accompanying notes to consolidated financial statements.
F-6 MetLife, Inc.
MetLife, Inc.
Consolidated Statements of Cash Flows — (Continued)
For the Years Ended December 31, 2007, 2006 and 2005
(In millions)
MetLife, Inc.
Notes to Consolidated Financial Statements
1. Business, Basis of Presentation, and Summary of Significant Accounting Policies
Business
“MetLife” or the “Company” refers to MetLife, Inc., a Delaware corporation incorporated in 1999 (the “Holding Company”), and its
subsidiaries, including Metropolitan Life Insurance Company (“MLIC”). MetLife is a leading provider of insurance and other financial
services with operations throughout the United States and the regions of Latin America, Europe, and Asia Pacific. Through its domestic and
international subsidiaries and affiliates, MetLife offers life insurance, annuities, automobile and homeowners insurance, retail banking and
other financial services to individuals, as well as group insurance, reinsurance and retirement & savings products and services to
corporations and other institutions.
Basis of Presentation
The accompanying consolidated financial statements include the accounts of (i) the Holding Company and its subsidiaries; (ii) part-
nerships and joint ventures in which the Company has control; and (iii) variable interest entities (“VIEs”) for which the Company is deemed to
be the primary beneficiary. Closed block assets, liabilities, revenues and expenses are combined on a line-by-line basis with the assets,
liabilities, revenues and expenses outside the closed block based on the nature of the particular item. See Note 9. Intercompany accounts
and transactions have been eliminated.
The Company uses the equity method of accounting for investments in equity securities in which it has more than a 20% interest and for
real estate joint ventures and other limited partnership interests in which it has more than a minor equity interest or more than a minor
influence over the joint venture’s or partnership’s operations, but does not have a controlling interest and is not the primary beneficiary. The
Company uses the cost method of accounting for investments in real estate joint ventures and other limited partnership interests in which it
has a minor equity investment and virtually no influence over the joint venture’s or partnership’s operations.
Minority interest related to consolidated entities included in other liabilities was $1.8 billion and $1.4 billion at December 31, 2007 and
2006, respectively.
Certain amounts in the prior year periods’ consolidated financial statements have been reclassified to conform with the 2007 presen-
tation. Such reclassifications include $850 million relating to long-term debt reclassified to collateral financing arrangements on the
consolidated balance sheet at December 31, 2006 and the consolidated statement of cash flow for the year ended December 31,
2006. See Note 11 for a description of the transaction. See also Note 23 for reclassifications related to discontinued operations.
On July 1, 2005, the Holding Company completed the acquisition of The Travelers Insurance Company, excluding certain assets, most
significantly, Primerica, from Citigroup Inc. (“Citigroup”), and substantially all of Citigroup’s international insurance businesses (collectively,
“Travelers”), which is described in Note 2. The acquisition was accounted for using the purchase method of accounting. Travelers’ assets,
liabilities and results of operations were included in the Company’s results beginning July 1, 2005. The accounting policies of Travelers
were conformed to those of MetLife upon acquisition.
Summary of Significant Accounting Policies and Critical Accounting Estimates
The preparation of financial statements in conformity with accounting principles generally accepted in the United States of America
(“GAAP”) requires management to adopt accounting policies and make estimates and assumptions that affect amounts reported in the
consolidated financial statements. The most critical estimates include those used in determining:
i) the fair value of investments in the absence of quoted market values;
ii) investment impairments;
iii) the recognition of income on certain investments;
iv) the application of the consolidation rules to certain investments;
v) the fair value of and accounting for derivatives;
vi) the capitalization and amortization of deferred policy acquisition costs (“DAC”) and the establishment and amortization of
value of business acquired (“VOBA”);
vii) the measurement of goodwill and related impairment, if any;
viii) the liability for future policyholder benefits;
ix) accounting for income taxes and the valuation of deferred tax assets;
x) accounting for reinsurance transactions;
xi) accounting for employee benefit plans; and
xii) the liability for litigation and regulatory matters.
A description of such critical estimates is incorporated within the discussion of the related accounting policies which follow. The
application of purchase accounting requires the use of estimation techniques in determining the fair values of assets acquired and liabilities
assumed — the most significant of which relate to the aforementioned critical estimates. In applying these policies, management makes
subjective and complex judgments that frequently require estimates about matters that are inherently uncertain. Many of these policies,
estimates and related judgments are common in the insurance and financial services industries; others are specific to the Company’s
businesses and operations. Actual results could differ from these estimates.
Investments
The Company’s principal investments are in fixed maturity and equity securities, mortgage and consumer loans, policy loans, real
estate, real estate joint ventures and other limited partnerships, short-term investments, and other invested assets. The accounting
policies related to each are as follows:
Fixed Maturity and Equity Securities. The Company’s fixed maturity and equity securities are classified as available-for-sale,
except for trading securities, and are reported at their estimated fair value. Unrealized investment gains and losses on these securities
are recorded as a separate component of other comprehensive income or loss, net of policyholder related amounts and deferred
F-7MetLife, Inc.
income taxes. All security transactions are recorded on a trade date basis. Investment gains and losses on sales of securities are
determined on a specific identification basis.
Interest income on fixed maturity securities is recorded when earned using an effective yield method giving effect to amortization
of premiums and accretion of discounts. Dividends on equity securities are recorded when declared. These dividends and interest
income are recorded as part of net investment income.
Included within fixed maturity securities are loan-backed securities including mortgage-backed and asset-backed securities.
Amortization of the premium or discount from the purchase of these securities considers the estimated timing and amount of
prepayments of the underlying loans. Actual prepayment experience is periodically reviewed and effective yields are recalculated
when differences arise between the prepayments originally anticipated and the actual prepayments received and currently antic-
ipated. Prepayment assumptions for single class and multi-class mortgage-backed and asset-backed securities are obtained from
broker-dealer survey values or internal estimates. For credit-sensitive mortgage-backed and asset-backed securities and certain
prepayment-sensitive securities, the effective yield is recalculated on a prospective basis. For all other mortgage-backed and asset-
backed securities, the effective yield is recalculated on a retrospective basis.
The cost of fixed maturity and equity securities is adjusted for impairments in value deemed to be other-than-temporary in the
period in which the determination is made. These impairments are included within net investment gains (losses) and the cost basis of
the fixed maturity and equity securities is reduced accordingly. The Company does not change the revised cost basis for subsequent
recoveries in value.
The assessment of whether impairments have occurred is based on management’s case-by-case evaluation of the underlying
reasons for the decline in fair value. The Company’s review of its fixed maturity and equity securities for impairments includes an
analysis of the total gross unrealized losses by three categories of securities: (i) securities where the estimated fair value had declined
and remained below cost or amortized cost by less than 20%; (ii) securities where the estimated fair value had declined and remained
below cost or amortized cost by 20% or more for less than six months; and (iii) securities where the estimated fair value had declined
and remained below cost or amortized cost by 20% or more for six months or greater.
Additionally, management considers a wide range of factors about the security issuer and uses its best judgment in evaluating
the cause of the decline in the estimated fair value of the security and in assessing the prospects for near-term recovery. Inherent in
management’s evaluation of the security are assumptions and estimates about the operations of the issuer and its future earnings
potential. Considerations used by the Company in the impairment evaluation process include, but are not limited to: (i) the length of
time and the extent to which the market value has been below cost or amortized cost; (ii) the potential for impairments of securities
when the issuer is experiencing significant financial difficulties; (iii) the potential for impairments in an entire industry sector or
sub-sector; (iv) the potential for impairments in certain economically depressed geographic locations; (v) the potential for impair-
ments of securities where the issuer, series of issuers or industry has suffered a catastrophic type of loss or has exhausted natural
resources; (vi) the Company’s ability and intent to hold the security for a period of time sufficient to allow for the recovery of its value to
an amount equal to or greater than cost or amortized cost (See also Note 3); (vii) unfavorable changes in forecasted cash flows on
mortgage-backed and asset-backed securities; and (viii) other subjective factors, including concentrations and information obtained
from regulators and rating agencies.
The Company purchases and receives beneficial interests in special purpose entities (“SPEs”), which enhance the Company’s
total return on its investment portfolio principally by providing equity-based returns on debt securities. These investments are
generally made through structured notes and similar instruments (collectively, “Structured Investment Transactions”). The Company
has not guaranteed the performance, liquidity or obligations of the SPEs and its exposure to loss is limited to its carrying value of the
beneficial interests in the SPEs. The Company does not consolidate such SPEs as it has determined it is not the primary beneficiary.
These Structured Investment Transactions are included in fixed maturity securities and their income is generally recognized using the
retrospective interest method. Impairments of these investments are included in net investment gains (losses).
Trading Securities. The Company’s trading securities portfolio, principally consisting of fixed maturity and equity securities,
supports investment strategies that involve the active and frequent purchase and sale of securities and the execution of short sale
agreements, and supports asset and liability matching strategies for certain insurance products. Trading securities and short sale
agreement liabilities are recorded at fair value with subsequent changes in fair value recognized in net investment income. Related
dividends and investment income are also included in net investment income.
Securities Lending. Securities loaned transactions are treated as financing arrangements and are recorded at the amount of
cash received. The Company obtains collateral in an amount equal to 102% of the fair value of the securities loaned. The Company
monitors the market value of the securities loaned on a daily basis with additional collateral obtained as necessary. Substantially all of
the Company’s securities loaned transactions are with large brokerage firms. Income and expenses associated with securities loaned
transactions are reported as investment income and investment expense, respectively, within net investment income.
Mortgage and Consumer Loans. Mortgage and consumer loans are stated at unpaid principal balance, adjusted for any
unamortized premium or discount, deferred fees or expenses, net of valuation allowances. Interest income is accrued on the principal
amount of the loan based on the loan’s contractual interest rate. Amortization of premiums and discounts is recorded using the
effective yield method. Interest income, amortization of premiums and discounts, and prepayment fees are reported in net investment
income. Loans are considered to be impaired when it is probable that, based upon current information and events, the Company will
be unable to collect all amounts due under the contractual terms of the loan agreement. Valuation allowances are established for the
excess carrying value of the loan over the present value of expected future cash flows discounted at the loan’s original effective
F-8 MetLife, Inc.
MetLife, Inc.
Notes to Consolidated Financial Statements — (Continued)
interest rate, the value of the loan’s collateral if the loan is in the process of foreclosure or otherwise collateral dependent, or the loan’s
market value if the loan is being sold. The Company also establishes allowances for loan losses when a loss contingency exists for
pools of loans with similar characteristics, such as mortgage loans based on similar property types or loan to value risk factors. A loss
contingency exists when the likelihood that a future event will occur is probable based on past events. Interest income earned on
impaired loans is accrued on the principal amount of the loan based on the loan’s contractual interest rate. However, interest ceases
to be accrued for loans on which interest is generally more than 60 days past due and/or where the collection of interest is not
considered probable. Cash receipts on such impaired loans are recorded as a reduction of the recorded investment. Gains and
losses from the sale of loans and changes in valuation allowances are reported in net investment gains (losses).
Policy Loans. Policy loans are stated at unpaid principal balances. Interest income on such loans is recorded as earned using
the contractually agreed upon interest rate. Generally, interest is capitalized on the policy’s anniversary date.
Real Estate. Real estate held-for-investment, including related improvements, is stated at cost less accumulated depreciation.
Depreciation is provided on a straight-line basis over the estimated useful life of the asset (typically 20 to 55 years). Rental income is
recognized on a straight-line basis over the term of the respective leases. The Company classifies a property as held-for-sale if it
commits to a plan to sell a property within one year and actively markets the property in its current condition for a price that is
reasonable in comparison to its fair value. The Company classifies the results of operations and the gain or loss on sale of a property
that either has been disposed of or classified as held-for-sale as discontinued operations, if the ongoing operations of the property will
be eliminated from the ongoing operations of the Company and if the Company will not have any significant continuing involvement in
the operations of the property after the sale. Real estate held-for-sale is stated at the lower of depreciated cost or fair value less
expected disposition costs. Real estate is not depreciated while it is classified as held-for-sale. The Company periodically reviews its
properties held-for-investment for impairment and tests properties for recoverability whenever events or changes in circumstances
indicate the carrying amount of the asset may not be recoverable and the carrying value of the property exceeds its fair value.
Properties whose carrying values are greater than their undiscounted cash flows are written down to their fair value, with the
impairment loss included in net investment gains (losses). Impairment losses are based upon the estimated fair value of real estate,
which is generally computed using the present value of expected future cash flows from the real estate discounted at a rate
commensurate with the underlying risks. Real estate acquired upon foreclosure of commercial and agricultural mortgage loans is
recorded at the lower of estimated fair value or the carrying value of the mortgage loan at the date of foreclosure.
Real Estate Joint Ventures and Other Limited Partnership Interests. The Company uses the equity method of accounting for
investments in real estate joint ventures and other limited partnership interests in which it has more than a minor equity interest or more
than a minor influence over the joint ventures or partnership’s operations, but does not have a controlling interest and is not the
primary beneficiary. The Company uses the cost method of accounting for investments in real estate joint ventures and other limited
partnership interests in which it has a minor equity investment and virtually no influence over the joint ventures or the partnership’s
operations. In addition to the investees performing regular evaluations for the impairment of underlying investments, the Company
routinely evaluates its investments in real estate joint ventures and other limited partnerships for impairments. For its cost method
investments, the Company follows an impairment analysis which is similar to the process followed for its fixed maturity and equity
securities as described previously. For equity method investees, the Company considers financial and other information provided by
the investee, other known information and inherent risks in the underlying investments, as well as future capital commitments, in
determining whether an impairment has occurred. When an other-than-temporary impairment is deemed to have occurred, the
Company records a realized capital loss within net investment gains (losses) to record the investment at its fair value.
Short-term Investments. Short-term investments include investments with remaining maturities of one year or less, but greater
than three months, at the time of acquisition and are stated at amortized cost, which approximates fair value.
Other Invested Assets. Other invested assets consist principally of leveraged leases and funds withheld at interest. Leveraged
leases are recorded net of non-recourse debt. The Company participates in lease transactions which are diversified by industry, asset
type and geographic area. The Company recognizes income on the leveraged leases by applying the leveraged lease’s estimated rate
of return to the net investment in the lease. The Company regularly reviews residual values and impairs them to expected values as
needed.
Funds withheld represent amounts contractually withheld by ceding companies in accordance with reinsurance agreements.
For agreements written on a modified coinsurance basis and certain agreements written on a coinsurance basis, assets supporting
the reinsured policies, and equal to the net statutory reserves, are withheld and continue to be legally owned by the ceding
companies. The Company records a funds withheld receivable rather than the underlying investments. The Company recognizes
interest on funds withheld at rates defined by the treaty terms which may be contractually specified or directly related to the
investment portfolio and records it in net investment income.
Other invested assets also include stand-alone derivatives with positive fair values and the fair value of embedded derivatives
related to funds withheld and modified coinsurance contracts.
Estimates and Uncertainties. The Company’s investments are exposed to three primary sources of risk: credit, interest rate
and market valuation. The financial statement risks, stemming from such investment risks, are those associated with the recognition
of impairments, the recognition of income on certain investments, and the determination of fair values.
F-9MetLife, Inc.
MetLife, Inc.
Notes to Consolidated Financial Statements — (Continued)
The determination of the amount of allowances and impairments, as applicable, are described previously by investment type.
The determination of such allowances and impairments is highly subjective and is based upon the Company’s periodic evaluation and
assessment of known and inherent risks associated with the respective asset class. Such evaluations and assessments are revised
as conditions change and new information becomes available. Management updates its evaluations regularly and reflects changes in
allowances and impairments in operations as such evaluations are revised.
The recognition of income on certain investments (e.g. loan-backed securities, including mortgage-backed and asset-backed
securities, certain investment transactions, trading securities, etc.) is dependent upon market conditions, which could result in
prepayments and changes in amounts to be earned.
The fair values of publicly held fixed maturity securities and publicly held equity securities are based on quoted market prices or
estimates from independent pricing services. However, in cases where quoted market prices are not available, such as for private
fixed maturity securities, fair values are estimated using present value or valuation techniques. The determination of fair values is
based on: (i) valuation methodologies; (ii) securities the Company deems to be comparable; and (iii) assumptions deemed
appropriate given the circumstances. The fair value estimates are made at a specific point in time, based on available market
information and judgments about financial instruments, including estimates of the timing and amounts of expected future cash flows
and the credit standing of the issuer or counterparty. Factors considered in estimating fair value include: coupon rate, maturity,
estimated duration, call provisions, sinking fund requirements, credit rating, industry sector of the issuer, and quoted market prices of
comparable securities. The use of different methodologies and assumptions may have a material effect on the estimated fair value
amounts.
Additionally, when the Company enters into certain structured investment transactions, real estate joint ventures and other
limited partnerships for which the Company may be deemed to be the primary beneficiary under Financial Accounting Standards
Board (“FASB”) Interpretation (“FIN”) No. 46(r), Consolidation of Variable Interest Entities — An Interpretation of ARB No. 51, it may be
required to consolidate such investments. The accounting rules for the determination of the primary beneficiary are complex and
require evaluation of the contractual rights and obligations associated with each party involved in the entity, an estimate of the entity’s
expected losses and expected residual returns and the allocation of such estimates to each party.
The use of different methodologies and assumptions as to the determination of the fair value of investments, the timing and
amount of impairments, the recognition of income, or consolidation of investments may have a material effect on the amounts
presented within the consolidated financial statements.
Derivative Financial Instruments
Derivatives are financial instruments whose values are derived from interest rates, foreign currency exchange rates, or other financial
indices. Derivatives may be exchange-traded or contracted in the over-the-counter market. The Company uses a variety of derivatives,
including swaps, forwards, futures and option contracts, to manage the risk associated with variability in cash flows or changes in fair
values related to the Company’s financial instruments. The Company also uses derivative instruments to hedge its currency exposure
associated with net investments in certain foreign operations. To a lesser extent, the Company uses credit derivatives, such as credit
default swaps, to synthetically replicate investment risks and returns which are not readily available in the cash market. The Company also
purchases certain securities, issues certain insurance policies and investment contracts and engages in certain reinsurance contracts that
have embedded derivatives.
Freestanding derivatives are carried on the Company’s consolidated balance sheet either as assets within other invested assets or as
liabilities within other liabilities at fair value as determined by quoted market prices or through the use of pricing models. The determination
of fair value, when quoted market values are not available, is based on valuation methodologies and assumptions deemed appropriate
under the circumstances. Derivative valuations can be affected by changes in interest rates, foreign currency exchange rates, financial
indices, credit spreads, market volatility, and liquidity. Values can also be affected by changes in estimates and assumptions used in
pricing models. Such assumptions include estimates of volatility, interest rates, foreign currency exchange rates, other financial indices
and credit ratings. Essential to the analysis of the fair value is risk of counterparty default. The use of different assumptions may have a
material effect on the estimated derivative fair value amounts, as well as the amount of reported net income.
If a derivative is not designated as an accounting hedge or its use in managing risk does not qualify for hedge accounting, changes in
the fair value of the derivative are generally reported in net investment gains (losses) except for those (i) in policyholder benefits and claims
for economic hedges of liabilities embedded in certain variable annuity products offered by the Company, and (ii) in net investment income
for economic hedges of equity method investments in joint ventures, or for all derivatives held in relation to the trading portfolios. The
fluctuations in fair value of derivatives which have not been designated for hedge accounting can result in significant volatility in net income.
To qualify for hedge accounting, at the inception of the hedging relationship, the Company formally documents its risk management
objective and strategy for undertaking the hedging transaction, as well as its designation of the hedge as either (i) a hedge of the fair value
of a recognized asset or liability or an unrecognized firm commitment (“fair value hedge”); (ii) a hedge of a forecasted transaction or of the
variability of cash flows to be received or paid related to a recognized asset or liability (“cash flow hedge”); or (iii) a hedge of a net
investment in a foreign operation. In this documentation, the Company sets forth how the hedging instrument is expected to hedge the
designated risks related to the hedged item and sets forth the method that will be used to retrospectively and prospectively assess the
hedging instrument’s effectiveness and the method which will be used to measure ineffectiveness. A derivative designated as a hedging
instrument must be assessed as being highly effective in offsetting the designated risk of the hedged item. Hedge effectiveness is formally
assessed at inception and periodically throughout the life of the designated hedging relationship. Assessments of hedge effectiveness and
measurements of ineffectiveness are also subject to interpretation and estimation and different interpretations or estimates may have a
material effect on the amount reported in net income.
The accounting for derivatives is complex and interpretations of the primary accounting standards continue to evolve in practice.
Judgment is applied in determining the availability and application of hedge accounting designations and the appropriate accounting
F-10 MetLife, Inc.
MetLife, Inc.
Notes to Consolidated Financial Statements — (Continued)
treatment under these accounting standards. If it was determined that hedge accounting designations were not appropriately applied,
reported net income could be materially affected. Differences in judgment as to the availability and application of hedge accounting
designations and the appropriate accounting treatment may result in a differing impact on the consolidated financial statements of the
Company from that previously reported.
Under a fair value hedge, changes in the fair value of the hedging derivative, including amounts measured as ineffectiveness, and
changes in the fair value of the hedged item related to the designated risk being hedged, are reported within net investment gains (losses).
The fair values of the hedging derivatives are exclusive of any accruals that are separately reported in the consolidated statement of income
within interest income or interest expense to match the location of the hedged item.
Under a cash flow hedge, changes in the fair value of the hedging derivative measured as effective are reported within other
comprehensive income (loss), a separate component of stockholders’ equity, and the deferred gains or losses on the derivative are
reclassified into the consolidated statement of income when the Company’s earnings are affected by the variability in cash flows of the
hedged item. Changes in the fair value of the hedging instrument measured as ineffectiveness are reported within net investment gains
(losses). The fair values of the hedging derivatives are exclusive of any accruals that are separately reported in the consolidated statement
of income within interest income or interest expense to match the location of the hedged item.
In a hedge of a net investment in a foreign operation, changes in the fair value of the hedging derivative that are measured as effective
are reported within other comprehensive income (loss) consistent with the translation adjustment for the hedged net investment in the
foreign operation. Changes in the fair value of the hedging instrument measured as ineffectiveness are reported within net investment gains
(losses).
The Company discontinues hedge accounting prospectively when: (i) it is determined that the derivative is no longer highly effective in
offsetting changes in the fair value or cash flows of a hedged item; (ii) the derivative expires, is sold, terminated, or exercised; (iii) it is no
longer probable that the hedged forecasted transaction will occur; (iv) a hedged firm commitment no longer meets the definition of a firm
commitment; or (v) the derivative is de-designated as a hedging instrument.
When hedge accounting is discontinued because it is determined that the derivative is not highly effective in offsetting changes in the
fair value or cash flows of a hedged item, the derivative continues to be carried on the consolidated balance sheet at its fair value, with
changes in fair value recognized currently in net investment gains (losses). The carrying value of the hedged recognized asset or liability
under a fair value hedge is no longer adjusted for changes in its fair value due to the hedged risk, and the cumulative adjustment to its
carrying value is amortized into income over the remaining life of the hedged item. Provided the hedged forecasted transaction is still
probable of occurrence, the changes in fair value of derivatives recorded in other comprehensive income (loss) related to discontinued
cash flow hedges are released into the consolidated statement of income when the Company’s earnings are affected by the variability in
cash flows of the hedged item.
When hedge accounting is discontinued because it is no longer probable that the forecasted transactions will occur by the end of the
specified time period or the hedged item no longer meets the definition of a firm commitment, the derivative continues to be carried on the
consolidated balance sheet at its fair value, with changes in fair value recognized currently in net investment gains (losses). Any asset or
liability associated with a recognized firm commitment is derecognized from the consolidated balance sheet, and recorded currently in net
investment gains (losses). Deferred gains and losses of a derivative recorded in other comprehensive income (loss) pursuant to the cash
flow hedge of a forecasted transaction are recognized immediately in net investment gains (losses).
In all other situations in which hedge accounting is discontinued, the derivative is carried at its fair value on the consolidated balance
sheet, with changes in its fair value recognized in the current period as net investment gains (losses).
The Company is also a party to financial instruments that contain terms which are deemed to be embedded derivatives. The Company
assesses each identified embedded derivative to determine whether it is required to be bifurcated. If the instrument would not be
accounted for in its entirety at fair value and it is determined that the terms of the embedded derivative are not clearly and closely related to
the economic characteristics of the host contract, and that a separate instrument with the same terms would qualify as a derivative
instrument, the embedded derivative is bifurcated from the host contract and accounted for as a freestanding derivative. Such embedded
derivatives are carried on the consolidated balance sheet at fair value with the host contract and changes in their fair value are reported
currently in net investment gains (losses). If the Company is unable to properly identify and measure an embedded derivative for separation
from its host contract, the entire contract is carried on the balance sheet at fair value, with changes in fair value recognized in the current
period in net investment gains (losses). Additionally, the Company may elect to carry an entire contract on the balance sheet at fair value,
with changes in fair value recognized in the current period in net investment gains (losses) if that contract contains an embedded derivative
that requires bifurcation. There is a risk that embedded derivatives requiring bifurcation may not be identified and reported at fair value in
the consolidated financial statements and that their related changes in fair value could materially affect reported net income.
Cash and Cash Equivalents
The Company considers all highly liquid investments purchased with an original or remaining maturity of three months or less at the date
of purchase to be cash equivalents.
Property, Equipment, Leasehold Improvements and Computer Software
Property, equipment and leasehold improvements, which are included in other assets, are stated at cost, less accumulated depre-
ciation and amortization. Depreciation is determined using either the straight-line or sum-of-the-years-digits method over the estimated
useful lives of the assets, as appropriate. The estimated life for company occupied real estate property is generally 40 years. Estimated
lives generally range from five to ten years for leasehold improvements and three to seven years for all other property and equipment. The
cost basis of the property, equipment and leasehold improvements was $1.6 billion and $1.5 billion at December 31, 2007 and 2006,
respectively. Accumulated depreciation and amortization of property, equipment and leasehold improvements was $828 million and
F-11MetLife, Inc.
MetLife, Inc.
Notes to Consolidated Financial Statements — (Continued)
$721 million at December 31, 2007 and 2006, respectively. Related depreciation and amortization expense was $136 million, $129 million
and $117 million for the years ended December 31, 2007, 2006 and 2005, respectively.
Computer software, which is included in other assets, is stated at cost, less accumulated amortization. Purchased software costs, as
well as certain internal and external costs incurred to develop internal-use computer software during the application development stage,
are capitalized. Such costs are amortized generally over a four-year period using the straight-line method. The cost basis of computer
software was $1.4 billion and $1.2 billion at December 31, 2007 and 2006, respectively. Accumulated amortization of capitalized software
was $876 million and $752 million at December 31, 2007 and 2006, respectively. Related amortization expense was $126 million,
$112 million and $111 million for the years ended December 31, 2007, 2006 and 2005, respectively.
Deferred Policy Acquisition Costs and Value of Business Acquired
The Company incurs significant costs in connection with acquiring new and renewal insurance business. Costs that vary with and relate
to the production of new business are deferred as DAC. Such costs consist principally of commissions and agency and policy issue
expenses. VOBA is an intangible asset that reflects the estimated fair value of in-force contracts in a life insurance company acquisition and
represents the portion of the purchase price that is allocated to the value of the right to receive future cash flows from the business in-force
at the acquisition date. VOBA is based on actuarially determined projections, by each block of business, of future policy and contract
charges, premiums, mortality and morbidity, separate account performance, surrenders, operating expenses, investment returns and other
factors. Actual experience on the purchased business may vary from these projections. The recovery of DAC and VOBA is dependent upon
the future profitability of the related business. DAC and VOBA are aggregated in the financial statements for reporting purposes.
DAC for property and casualty insurance contracts, which is primarily composed of commissions and certain underwriting expenses, is
amortized on a pro rata basis over the applicable contract term or reinsurance treaty.
DAC and VOBA on life insurance or investment-type contracts are amortized in proportion to gross premiums, gross margins or gross
profits, depending on the type of contract as described below.
The Company amortizes DAC and VOBA related to non-participating and non-dividend-paying traditional contracts (term insurance,
non-participating whole life insurance, non-medical health insurance, and traditional group life insurance) over the entire premium paying
period in proportion to the present value of actual historic and expected future gross premiums. The present value of expected premiums is
based upon the premium requirement of each policy and assumptions for mortality, morbidity, persistency, and investment returns at policy
issuance, or policy acquisition, as it relates to VOBA, that include provisions for adverse deviation and are consistent with the assumptions
used to calculate future policyholder benefit liabilities. These assumptions are not revised after policy issuance or acquisition unless the
DAC or VOBA balance is deemed to be unrecoverable from future expected profits. Absent a premium deficiency, variability in amortization
after policy issuance or acquisition is caused only by variability in premium volumes.
The Company amortizes DAC and VOBA related to participating, dividend-paying traditional contracts over the estimated lives of the
contracts in proportion to actual and expected future gross margins. The amortization includes interest based on rates in effect at inception
or acquisition of the contracts. The future gross margins are dependent principally on investment returns, policyholder dividend scales,
mortality, persistency, expenses to administer the business, creditworthiness of reinsurance counterparties, and certain economic
variables, such as inflation. For participating contracts (dividend paying traditional contracts within the closed block) future gross margins
are also dependent upon changes in the policyholder dividend obligation. Of these factors, the Company anticipates that investment
returns, expenses, persistency, and other factor changes and policyholder dividend scales are reasonably likely to impact significantly the
rate of DAC and VOBA amortization. Each reporting period, the Company updates the estimated gross margins with the actual gross
margins for that period. When the actual gross margins change from previously estimated gross margins, the cumulative DAC and VOBA
amortization is re-estimated and adjusted by a cumulative charge or credit to current operations. When actual gross margins exceed those
previously estimated, the DAC and VOBA amortization will increase, resulting in a current period charge to earnings. The opposite result
occurs when the actual gross margins are below the previously estimated gross margins. Each reporting period, the Company also
updates the actual amount of business in-force, which impacts expected future gross margins.
The Company amortizes DAC and VOBA related to fixed and variable universal life contracts and fixed and variable deferred annuity
contracts over the estimated lives of the contracts in proportion to actual and expected future gross profits. The amortization includes
interest based on rates in effect at inception or acquisition of the contracts. The amount of future gross profits is dependent principally
upon returns in excess of the amounts credited to policyholders, mortality, persistency, interest crediting rates, expenses to administer the
business, creditworthiness of reinsurance counterparties, the effect of any hedges used, and certain economic variables, such as inflation.
Of these factors, the Company anticipates that investment returns, expenses, and persistency are reasonably likely to impact significantly
the rate of DAC and VOBA amortization. Each reporting period, the Company updates the estimated gross profits with the actual gross
profits for that period. When the actual gross profits change from previously estimated gross profits, the cumulative DAC and VOBA
amortization is re-estimated and adjusted by a cumulative charge or credit to current operations. When actual gross profits exceed those
previously estimated, the DAC and VOBA amortization will increase, resulting in a current period charge to earnings. The opposite result
occurs when the actual gross profits are below the previously estimated gross profits. Each reporting period, the Company also updates
the actual amount of business remaining in-force, which impacts expected future gross profits.
Separate account rates of return on variable universal life contracts and variable deferred annuity contracts affect in-force account
balances on such contracts each reporting period. Returns that are higher than the Company’s long-term expectation produce higher
account balances, which increases the Company’s future fee expectations and decreases future benefit payment expectations on
minimum death benefit guarantees, resulting in higher expected future gross profits. The opposite result occurs when returns are lower
than the Company’s long-term expectation. The Company’s practice to determine the impact of gross profits resulting from returns on
separate accounts assumes that long-term appreciation in equity markets is not changed by short-term market fluctuations, but is only
changed when sustained interim deviations are expected. The Company monitors these changes and only changes the assumption when
its long-term expectation changes.
F-12 MetLife, Inc.
MetLife, Inc.
Notes to Consolidated Financial Statements — (Continued)
The Company also reviews periodically other long-term assumptions underlying the projections of estimated gross margins and profits.
These include investment returns, policyholder dividend scales, interest crediting rates, mortality, persistency, and expenses to administer
business. Management annually updates assumptions used in the calculation of estimated gross margins and profits which may have
significantly changed. If the update of assumptions causes expected future gross margins and profits to increase, DAC and VOBA
amortization will decrease, resulting in a current period increase to earnings. The opposite result occurs when the assumption update
causes expected future gross margins and profits to decrease.
Prior to 2007, DAC related to any internally replaced contract was generally expensed at the date of replacement. As described more
fully in “Adoption of New Accounting Pronouncements”, effective January 1, 2007, the Company adopted Statement of Position (“SOP”)
05-1, Accounting by Insurance Enterprises for Deferred Acquisition Costs in Connection with Modifications or Exchanges of Insurance
Contracts (“SOP 05-1”). Under SOP 05-1, an internal replacement is defined as a modification in product benefits, features, rights or
coverages that occur by the exchange of a contract for a new contract, or by amendment, endorsement, or rider to a contract, or by
election or coverage within a contract. If the modification substantially changes the contract, the DAC is written off immediately through
income and any new deferrable costs associated with the replacement contract are deferred. If the modification does not substantially
change the contract, the DAC amortization on the original contract will continue and any acquisition costs associated with the related
modification are expensed.
Sales Inducements
The Company has two different types of sales inducements which are included in other assets: (i) the policyholder receives a bonus
whereby the policyholder’s initial account balance is increased by an amount equal to a specified percentage of the customer’s deposit;
and (ii) the policyholder receives a higher interest rate using a dollar cost averaging method than would have been received based on the
normal general account interest rate credited. The Company defers sales inducements and amortizes them over the life of the policy using
the same methodology and assumptions used to amortize DAC.
Goodwill
Goodwill is the excess of cost over the fair value of net assets acquired. Goodwill is not amortized but is tested for impairment at least
annually or more frequently if events or circumstances, such as adverse changes in the business climate, indicate that there may be
justification for conducting an interim test. Impairment testing is performed using the fair value approach, which requires the use of
estimates and judgment, at the “reporting unit” level. A reporting unit is the operating segment or a business one level below the operating
segment, if discrete financial information is prepared and regularly reviewed by management at that level. For purposes of goodwill
impairment testing, goodwill within Corporate & Other is allocated to reporting units within the Company’s business segments. If the
carrying value of a reporting unit’s goodwill exceeds its fair value, the excess is recognized as an impairment and recorded as a charge
against net income. The fair values of the reporting units are determined using a market multiple, a discounted cash flow model, or a cost
approach. The critical estimates necessary in determining fair value are projected earnings, comparative market multiples and the discount
rate.
Liability for Future Policy Benefits and Policyholder Account Balances
The Company establishes liabilities for amounts payable under insurance policies, including traditional life insurance, traditional
annuities and non-medical health insurance. Generally, amounts are payable over an extended period of time and related liabilities are
calculated as the present value of future expected benefits to be paid reduced by the present value of future expected premiums. Such
liabilities are established based on methods and underlying assumptions in accordance with GAAP and applicable actuarial standards.
Principal assumptions used in the establishment of liabilities for future policy benefits are mortality, morbidity, policy lapse, renewal,
retirement, disability incidence, disability terminations, investment returns, inflation, expenses and other contingent events as appropriate
to the respective product type. Utilizing these assumptions, liabilities are established on a block of business basis.
Future policy benefit liabilities for participating traditional life insurance policies are equal to the aggregate of (i) net level premium
reserves for death and endowment policy benefits (calculated based upon the non-forfeiture interest rate, ranging from 3% to 10% for
domestic business and 3% to 10% for international business, and mortality rates guaranteed in calculating the cash surrender values
described in such contracts); and (ii) the liability for terminal dividends.
Future policy benefits for non-participating traditional life insurance policies are equal to the aggregate of the present value of expected
future benefit payments and related expenses less the present value of expected future net premiums. Assumptions as to mortality and
persistency are based upon the Company’s experience when the basis of the liability is established. Interest rates for the aggregate future
policy benefit liabilities range from 3% to 10% for domestic business and 3% to 12% for international business.
Participating business represented approximately 9% and 10% of the Company’s life insurance in-force, and 33% and 38% of the
number of life insurance policies in-force, at December 31, 2007 and 2006, respectively. Participating policies represented approximately
31% and 30%, 30% and 29%, and 31% and 30% of gross and net life insurance premiums for the years ended December 31, 2007, 2006
and 2005, respectively. The percentages indicated are calculated excluding the business of the reinsurance segment.
Future policy benefit liabilities for individual and group traditional fixed annuities after annuitization are equal to the present value of
expected future payments. Interest rates used in establishing such liabilities range from 3% to 11% for domestic business and 4% to 10%
for international business.
Future policy benefit liabilities for non-medical health insurance are calculated using the net level premium method and assumptions as
to future morbidity, withdrawals and interest, which provide a margin for adverse deviation. Interest rates used in establishing such liabilities
range from 3% to 7% for domestic business and 3% to 10% for international business.
F-13MetLife, Inc.
MetLife, Inc.
Notes to Consolidated Financial Statements — (Continued)
Future policy benefit liabilities for disabled lives are estimated using the present value of benefits method and experience assumptions
as to claim terminations, expenses and interest. Interest rates used in establishing such liabilities range from 3% to 8% for domestic
business and 2% to 10% for international business.
Liabilities for unpaid claims and claim expenses for property and casualty insurance are included in future policyholder benefits and
represent the amount estimated for claims that have been reported but not settled and claims incurred but not reported. Liabilities for
unpaid claims are estimated based upon the Company’s historical experience and other actuarial assumptions that consider the effects of
current developments, anticipated trends and risk management programs, reduced for anticipated salvage and subrogation. The effects of
changes in such estimated liabilities are included in the results of operations in the period in which the changes occur.
The Company establishes future policy benefit liabilities for minimum death and income benefit guarantees relating to certain annuity
contracts and secondary and paid-up guarantees relating to certain life policies as follows:
• Annuity guaranteed minimum death benefit (“GMDB”) liabilities are determined by estimating the expected value of death benefits in
excess of the projected account balance and recognizing the excess ratably over the accumulation period based on total expected
assessments. The Company regularly evaluates estimates used and adjusts the additional liability balance, with a related charge or
credit to benefit expense, if actual experience or other evidence suggests that earlier assumptions should be revised. The
assumptions used in estimating the GMDB liabilities are consistent with those used for amortizing DAC, and are thus subject to
the same variability and risk. The assumptions of investment performance and volatility are consistent with the historical experience of
the Standard & Poor’s 500 Index (“S&P”). The benefits used in calculating the liabilities are based on the average benefits payable
over a range of scenarios.
• Guaranteed minimum income benefit (“GMIB”) liabilities are determined by estimating the expected value of the income benefits in
excess of the projected account balance at any future date of annuitization and recognizing the excess ratably over the accumulation
period based on total expected assessments. The Company regularly evaluates estimates used and adjusts the additional liability
balance, with a related charge or credit to benefit expense, if actual experience or other evidence suggests that earlier assumptions
should be revised. The assumptions used for estimating the GMIB liabilities are consistent with those used for estimating the GMDB
liabilities. In addition, the calculation of guaranteed annuitization benefit liabilities incorporates an assumption for the percentage of
the potential annuitizations that may be elected by the contractholder.
Liabilities for universal and variable life secondary guarantees and paid-up guarantees are determined by estimating the expected value
of death benefits payable when the account balance is projected to be zero and recognizing those benefits ratably over the accumulation
period based on total expected assessments. The Company regularly evaluates estimates used and adjusts the additional liability
balances, with a related charge or credit to benefit expense, if actual experience or other evidence suggests that earlier assumptions
should be revised. The assumptions used in estimating the secondary and paid-up guarantee liabilities are consistent with those used for
amortizing DAC, and are thus subject to the same variability and risk. The assumptions of investment performance and volatility for variable
products are consistent with historical S&P experience. The benefits used in calculating the liabilities are based on the average benefits
payable over a range of scenarios.
The Company establishes policyholder account balances for guaranteed minimum benefit riders relating to certain variable annuity
products as follows:
• Guaranteed minimum withdrawal benefit riders (“GMWB”) guarantee the contractholder a return of their purchase payment via partial
withdrawals, even if the account value is reduced to zero, provided that the contractholder’s cumulative withdrawals in a contract
year do not exceed a certain limit. The initial guaranteed withdrawal amount is equal to the initial benefit base as defined in the
contract (typically, the initial purchase payments plus applicable bonus amounts). The GMWB is an embedded derivative, which is
measured at fair value separately from the host variable annuity product.
• Guaranteed minimum accumulation benefit riders (“GMAB”) provide the contractholder, after a specified period of time determined at
the time of issuance of the variable annuity contract, with a minimum accumulation of their purchase payments even if the account
value is reduced to zero. The initial guaranteed accumulation amount is equal to the initial benefit base as defined in the contract
(typically, the initial purchase payments plus applicable bonus amounts). The GMAB is also an embedded derivative, which is
measured at fair value separately from the host variable annuity product.
• For both GMWB and GMAB, the initial benefit base is increased by additional purchase payments made within a certain time period
and decreases by benefits paid and/or withdrawal amounts. After a specified period of time, the benefit base may also increase as a
result of an optional reset as defined in the contract.
The fair values of the GMWB and GMAB riders are calculated based on actuarial and capital market assumptions related to the
projected cash flows, including benefits and related contract charges, over the lives of the contracts, incorporating expectations
concerning policyholder behavior. In measuring the fair value of GMWBs and GMABs, the Company attributes a portion of the fees
collected from the policyholder equal to the present value of expected future guaranteed minimum withdrawal and accumulation benefits
(at inception). The changes in fair value are reported in net investment gains (losses). Any additional fees represent “excess” fees and are
reported in universal life and investment-type product policy fees. These riders may be more costly than expected in volatile or declining
markets, causing an increase in liabilities for future policy benefits, negatively affecting net income.
The Company periodically reviews its estimates of actuarial liabilities for future policy benefits and compares them with its actual
experience. Differences between actual experience and the assumptions used in pricing these policies, guarantees and riders and in the
establishment of the related liabilities result in variances in profit and could result in losses. The effects of changes in such estimated
liabilities are included in the results of operations in the period in which the changes occur.
Policyholder account balances relate to investment-type contracts and universal life-type policies. Investment-type contracts principally
include traditional individual fixed annuities in the accumulation phase and non-variable group annuity contracts. Policyholder account
balances are equal to (i) policy account values, which consist of an accumulation of gross premium payments; (ii) credited interest, ranging
F-14 MetLife, Inc.
MetLife, Inc.
Notes to Consolidated Financial Statements — (Continued)
from 1% to 17% for domestic business and 1% to 15% for international business, less expenses, mortality charges, and withdrawals; and
(iii) fair value adjustments relating to business combinations. Bank deposits are also included in policyholder account balances.
Other Policyholder Funds
Other policyholder funds include policy and contract claims, unearned revenue liabilities, premiums received in advance, policyholder
dividends due and unpaid, and policyholder dividends left on deposit.
The liability for policy and contract claims generally relates to incurred but not reported death, disability, long-term care and dental
claims as well as claims which have been reported but not yet settled. The liability for these claims is based on the Company’s estimated
ultimate cost of settling all claims. The Company derives estimates for the development of incurred but not reported claims principally from
actuarial analyses of historical patterns of claims and claims development for each line of business. The methods used to determine these
estimates are continually reviewed. Adjustments resulting from this continuous review process and differences between estimates and
payments for claims are recognized in policyholder benefits and claims expense in the period in which the estimates are changed or
payments are made.
The unearned revenue liability relates to universal life-type and investment-type products and represents policy charges for services to
be provided in future periods. The charges are deferred as unearned revenue and amortized using the product’s estimated gross profits
and margins, similar to DAC. Such amortization is recorded in universal life and investment-type product policy fees.
The Company accounts for the prepayment of premiums on its individual life, group life and health contracts as premium received in
advance and applies the cash received to premiums when due.
Also included in other policyholder funds are policyholder dividends due and unpaid on participating policies and policyholder dividends
left on deposit. Such liabilities are presented at amounts contractually due to policyholders.
Recognition of Insurance Revenue and Related Benefits
Premiums related to traditional life and annuity policies with life contingencies are recognized as revenues when due from policyholders.
Policyholder benefits and expenses are provided against such revenues to recognize profits over the estimated lives of the policies. When
premiums are due over a significantly shorter period than the period over which benefits are provided, any excess profit is deferred and
recognized into operations in a constant relationship to insurance in-force or, for annuities, the amount of expected future policy benefit
payments.
Premiums related to non-medical health and disability contracts are recognized on a pro rata basis over the applicable contract term.
Deposits related to universal life-type and investment-type products are credited to policyholder account balances. Revenues from
such contracts consist of amounts assessed against policyholder account balances for mortality, policy administration and surrender
charges and are recorded in universal life and investment-type product policy fees in the period in which services are provided. Amounts
that are charged to operations include interest credited and benefit claims incurred in excess of related policyholder account balances.
Premiums related to property and casualty contracts are recognized as revenue on a pro rata basis over the applicable contract term.
Unearned premiums, representing the portion of premium written relating to the unexpired coverage, are included in future policy benefits.
Premiums, policy fees, policyholder benefits and expenses are presented net of reinsurance.
Other Revenues
Other revenues include advisory fees, broker-dealer commissions and fees, and administrative service fees. Such fees and com-
missions are recognized in the period in which services are performed. Other revenues also include changes in account value relating to
corporate-owned life insurance (“COLI”). Under certain COLI contracts, if the Company reports certain unlikely adverse results in its
consolidated financial statements, withdrawals would not be immediately available and would be subject to market value adjustment, which
could result in a reduction of the account value.
Policyholder Dividends
Policyholder dividends are approved annually by the insurance subsidiaries’ boards of directors. The aggregate amount of policyholder
dividends is related to actual interest, mortality, morbidity and expense experience for the year, as well as management’s judgment as to
the appropriate level of statutory surplus to be retained by the insurance subsidiaries.
Income Taxes
The Holding Company and its includable life insurance and non-life insurance subsidiaries file a consolidated U.S. federal income tax
return in accordance with the provisions of the Internal Revenue Code of 1986, as amended (the “Code”). Non-includable subsidiaries file
either separate individual corporate tax returns or separate consolidated tax returns.
The Company’s accounting for income taxes represents management’s best estimate of various events and transactions.
Deferred tax assets and liabilities resulting from temporary differences between the financial reporting and tax bases of assets and
liabilities are measured at the balance sheet date using enacted tax rates expected to apply to taxable income in the years the temporary
differences are expected to reverse.
The realization of deferred tax assets depends upon the existence of sufficient taxable income within the carryback or carryforward
periods under the tax law in the applicable tax jurisdiction. Valuation allowances are established when management determines, based on
available information, that it is more likely than not that deferred income tax assets will not be realized. Significant judgment is required in
determining whether valuation allowances should be established as well as the amount of such allowances. When making such
determination, consideration is given to, among other things, the following:
(i) future taxable income exclusive of reversing temporary differences and carryforwards;
(ii) future reversals of existing taxable temporary differences;
F-15MetLife, Inc.
MetLife, Inc.
Notes to Consolidated Financial Statements — (Continued)
(iii) taxable income in prior carryback years; and
(iv) tax planning strategies.
The Company may be required to change its provision for income taxes in certain circumstances. Examples of such circumstances
include when the ultimate deductibility of certain items is challenged by taxing authorities (See also Note 15) or when estimates used in
determining valuation allowances on deferred tax assets significantly change or when receipt of new information indicates the need for
adjustment in valuation allowances. Additionally, future events, such as changes in tax laws, tax regulations, or interpretations of such laws
or regulations, could have an impact on the provision for income tax and the effective tax rate. Any such changes could significantly affect
the amounts reported in the consolidated financial statements in the year these changes occur.
As described more fully in “Adoption of New Accounting Pronouncements”, the Company adopted FIN No. 48, Accounting for
Uncertainty in Income Taxes — An Interpretation of FASB Statement No. 109 (“FIN 48”) effective January 1, 2007. Under FIN 48, the
Company determines whether it is more-likely-than-not that a tax position will be sustained upon examination by the appropriate taxing
authorities before any part of the benefit can be recorded in the financial statements. A tax position is measured at the largest amount of
benefit that is greater than 50 percent likely of being realized upon settlement. Unrecognized tax benefits due to tax uncertainties that do
not meet the threshold are included within other liabilities and are charged to earnings in the period that such determination is made.
The Company classifies interest recognized as interest expense and penalties recognized as a component of income tax.
Reinsurance
The Company enters into reinsurance transactions as both a provider and a purchaser of reinsurance for its life and property and
casualty insurance products.
For each of its reinsurance contracts, the Company determines if the contract provides indemnification against loss or liability relating to
insurance risk in accordance with applicable accounting standards. The Company reviews all contractual features, particularly those that
may limit the amount of insurance risk to which the reinsurer is subject or features that delay the timely reimbursement of claims.
For reinsurance of existing in-force blocks of long-duration contracts that transfer significant insurance risk, the difference, if any,
between the amounts paid (received), and the liabilities ceded (assumed) related to the underlying contracts is considered the net cost of
reinsurance at the inception of the contract. The net cost of reinsurance is recorded as an adjustment to DAC and recognized as a
component of other expenses on a basis consistent with the way the acquisition costs on the underlying reinsured contracts would be
recognized. Subsequent amounts paid (received) on the reinsurance of in-force blocks, as well as amounts paid (received) related to new
business, are recorded as ceded (assumed) premiums and ceded (assumed) future policy benefit liabilities are established.
For prospective reinsurance of short-duration contracts that meet the criteria for reinsurance accounting, amounts paid (received) are
recorded as ceded (assumed) premiums and ceded (assumed) unearned premiums and are reflected as a component of premiums and
other receivables (future policy benefits). Such amounts are amortized through earned premiums over the remaining contract period in
proportion to the amount of protection provided. For retroactive reinsurance of short-duration contracts that meet the criteria of
reinsurance accounting, amounts paid (received) in excess of (which do not exceed) the related insurance liabilities ceded (assumed)
are recognized immediately as a loss. Any gains on such retroactive contracts are deferred and recorded in other liabilities. The gains are
amortized primarily using the recovery method.
The assumptions used to account for both long and short-duration reinsurance contracts are consistent with those used for the
underlying contracts. Ceded policyholder and contract related liabilities, other than those currently due, are reported gross on the balance
sheet.
Amounts currently recoverable under reinsurance contracts are included in premiums and other receivables and amounts currently
payable are included in other liabilities. Such assets and liabilities relating to reinsurance contracts with the same reinsurer may be
recorded net on the balance sheet, if a right of offset exists within the reinsurance contract.
Premiums, fees and policyholder benefits and claims include amounts assumed under reinsurance contracts and are net of reinsurance
ceded.
If the Company determines that a reinsurance contract does not expose the reinsurer to a reasonable possibility of a significant loss
from insurance risk, the Company records the contract using the deposit method of accounting. Deposits received are included in other
liabilities and deposits made are included within other assets. As amounts are paid or received, consistent with the underlying contracts,
the deposit assets or liabilities are adjusted. Interest on such deposits is recorded as other revenues or other expenses, as appropriate.
Periodically, the Company evaluates the adequacy of the expected payments or recoveries and adjusts the deposit asset or liability through
other revenues or other expenses, as appropriate.
Amounts received from reinsurers for policy administration are reported in other revenues.
Accounting for reinsurance requires extensive use of assumptions and estimates, particularly related to the future performance of the
underlying business and the potential impact of counterparty credit risks. The Company periodically reviews actual and anticipated
experience compared to the aforementioned assumptions used to establish assets and liabilities relating to ceded and assumed
reinsurance and evaluates the financial strength of counterparties to its reinsurance agreements using criteria similar to that evaluated
in the security impairment process discussed previously.
Separate Accounts
Separate accounts are established in conformity with insurance laws and are generally not chargeable with liabilities that arise from any
other business of the Company. Separate account assets are subject to general account claims only to the extent the value of such assets
exceeds the separate account liabilities. The Company reports separately, as assets and liabilities, investments held in separate accounts
and liabilities of the separate accounts if (i) such separate accounts are legally recognized; (ii) assets supporting the contract liabilities are
legally insulated from the Company’s general account liabilities; (iii) investments are directed by the contractholder; and (iv) all investment
performance, net of contract fees and assessments, is passed through to the contractholder. The Company reports separate account
F-16 MetLife, Inc.
MetLife, Inc.
Notes to Consolidated Financial Statements — (Continued)
assets meeting such criteria at their fair value. Investment performance (including investment income, net investment gains (losses) and
changes in unrealized gains (losses)) and the corresponding amounts credited to contractholders of such separate accounts are offset
within the same line in the consolidated statements of income.
The Company’s revenues reflect fees charged to the separate accounts, including mortality charges, risk charges, policy administration
fees, investment management fees and surrender charges. Separate accounts not meeting the above criteria are combined on a
line-by-line basis with the Company’s general account assets, liabilities, revenues and expenses.
Employee Benefit Plans
Certain subsidiaries of the Holding Company (the “Subsidiaries”) sponsor and/or administer various plans that provide defined benefit
pension and other postretirement benefits covering eligible employees and sales representatives. A December 31 measurement date is
used for all of the Subsidiaries’ defined benefit pension and other postretirement benefit plans.
Pension benefits are provided utilizing either a traditional formula or cash balance formula. The traditional formula provides benefits
based upon years of credited service and either final average or career average earnings. The cash balance formula utilizes hypothetical or
notional accounts which credit participants with benefits equal to a percentage of eligible pay as well as earnings credits, determined
annually based upon the average annual rate of interest on 30-year Treasury securities, for each account balance. As of December 31,
2007, virtually all the obligations are calculated using the traditional formula.
The Subsidiaries also provide certain postemployment benefits and certain postretirement medical and life insurance benefits for retired
employees. Employees of the Subsidiaries who were hired prior to 2003 (or, in certain cases, rehired during or after 2003) and meet age
and service criteria while working for one of the Subsidiaries, may become eligible for these other postretirement benefits, at various levels,
in accordance with the applicable plans. Virtually all retirees, or their beneficiaries, contribute a portion of the total cost of postretirement
medical benefits. Employees hired after 2003 are not eligible for any employer subsidy for postretirement medical benefits.
SFAS No. 87, Employers’ Accounting for Pensions (“SFAS 87”), as amended, established the accounting for pension plan obligations.
Under SFAS 87, the projected pension benefit obligation (“PBO”) is defined as the actuarially calculated present value of vested and non-
vested pension benefits accrued based on future salary levels. The accumulated pension benefit obligation (“ABO”) is the actuarial present
value of vested and non-vested pension benefits accrued based on current salary levels. Obligations, both PBO and ABO, of the defined
benefit pension plans are determined using a variety of actuarial assumptions, from which actual results may vary, as described below.
SFAS No. 106, Employers’ Accounting for Postretirement Benefits Other than Pensions (“SFAS 106”), as amended, established the
accounting for expected postretirement plan benefit obligations (“EPBO”) which represents the actuarial present value of all other
postretirement benefits expected to be paid after retirement to employees and their dependents. Unlike for pensions, the EPBO is not
recorded in the financial statements but is used in measuring the periodic expense. The accumulated postretirement plan benefit
obligations (“APBO”) represents the actuarial present value of future other postretirement benefits attributed to employee services rendered
through a particular date and is the valuation basis upon which liabilities are established. The APBO is determined using a variety of
actuarial assumptions, from which actual results may vary, as described below.
Prior to December 31, 2006, the funded status of the pension and other postretirement plans, which is the difference between the fair
value of plan assets and the PBO for pension plans and the APBO for other postretirement plans (collectively, the “Benefit Obligations”),
were offset by the unrecognized actuarial gains or losses, prior service cost and transition obligations to determine prepaid or accrued
benefit cost, as applicable. The net amount was recorded as a prepaid or accrued benefit cost, as applicable. Further, for pension plans, if
the ABO exceeded the fair value of the plan assets, that excess was recorded as an additional minimum pension liability with a
corresponding intangible asset. Recognition of the intangible asset was limited to the amount of any unrecognized prior service cost.
Any additional minimum pension liability in excess of the allowable intangible asset was charged, net of income tax, to accumulated other
comprehensive income.
As described more fully in “Adoption of New Accounting Pronouncements”, effective December 31, 2006, the Company adopted
SFAS No. 158, Employers’ Accounting for Defined Benefit Pension and Other Postretirement Plans — an amendment of FASB Statements
No. 87, 88, 106, and SFAS No. 132(r) (“SFAS 158”). Effective with the adoption of SFAS 158 on December 31, 2006, the Company
recognizes the funded status of the Benefit Obligations for each of its plans on the consolidated balance sheet. The actuarial gains or
losses, prior service costs and credits, and the remaining net transition asset or obligation that had not yet been included in net periodic
benefit costs as of December 31, 2006 are now charged, net of income tax, to accumulated other comprehensive income. Additionally,
these changes eliminated the additional minimum pension liability provisions of SFAS 87.
Net periodic benefit cost is determined using management estimates and actuarial assumptions to derive service cost, interest cost,
and expected return on plan assets for a particular year. Net periodic benefit cost also includes the applicable amortization of any prior
service cost (credit) arising from the increase (decrease) in prior years’ benefit costs due to plan amendments or initiation of new plans.
These costs are amortized into net periodic benefit cost over the expected service years of employees whose benefits are affected by such
plan amendments. Actual experience related to plan assets and/or the benefit obligations may differ from that originally assumed when
determining net periodic benefit cost for a particular period, resulting in gains or losses. To the extent such aggregate gains or losses
exceed 10 percent of the greater of the benefit obligations or the market-related asset value of the plans, they are amortized into net
periodic benefit cost over the expected service years of employees expected to receive benefits under the plans.
The obligations and expenses associated with these plans require an extensive use of assumptions such as the discount rate,
expected rate of return on plan assets, rate of future compensation increases, healthcare cost trend rates, as well as assumptions
regarding participant demographics such as rate and age of retirements, withdrawal rates and mortality. Management, in consultation with
its external consulting actuarial firm, determines these assumptions based upon a variety of factors such as historical performance of the
plan and its assets, currently available market and industry data, and expected benefit payout streams. The assumptions used may differ
materially from actual results due to, among other factors, changing market and economic conditions and changes in participant
demographics. These differences may have a significant effect on the Company’s consolidated financial statements and liquidity.
F-17MetLife, Inc.
MetLife, Inc.
Notes to Consolidated Financial Statements — (Continued)
The Subsidiaries also sponsor defined contribution savings and investment plans (“SIP”) for substantially all employees under which a
portion of employee contributions are matched. Applicable matching contributions are made each payroll period. Accordingly, the
Company recognizes compensation cost for current matching contributions. As all contributions are transferred currently as earned to
the SIP trust, no liability for matching contributions is recognized in the consolidated balance sheets.
Stock-Based Compensation
Stock-based compensation grants prior to January 1, 2003 were accounted for using the intrinsic value method prescribed by
Accounting Principles Board (“APB”) Opinion No. 25, Accounting for Stock Issued to Employees (“APB 25”), and related interpretations.
Compensation expense, if any, was recorded based upon the excess of the quoted market price at grant date over the amount the
employee was required to pay to acquire the stock. Under the provisions of APB 25, there was no compensation expense resulting from
the issuance of stock options as the exercise price was equivalent to the fair market value at the date of grant. Compensation expense was
recognized under the Long-Term Performance Compensation Plan (“LTPCP”), as described more fully in Note 18.
Stock-based awards granted after December 31, 2002 but prior to January 1, 2006 were accounted for on a prospective basis using
the fair value accounting method prescribed by SFAS No. 123, Accounting for Stock-Based Compensation (“SFAS 123”), as amended by
SFAS No. 148, Accounting for Stock-Based Compensation — Transition and Disclosure (“SFAS 148”). The fair value method of SFAS 123
required compensation expense to be measured based on the fair value of the equity instrument at the grant or award date. Stock-based
compensation was accrued over the vesting period of the grant or award, including grants or awards to retirement-eligible employees. As
required by SFAS 148, the Company discloses the pro forma impact as if the stock options granted prior to January 1, 2003 had been
accounted for using the fair value provisions of SFAS 123 rather than the intrinsic value method prescribed by APB 25. See Note 18.
Effective January 1, 2006, the Company adopted, using the modified prospective transition method, SFAS No. 123 (revised 2004),
Share-Based Payment (“SFAS 123(r)”), which replaces SFAS 123 and supersedes APB 25. The adoption of SFAS 123(r) did not have a
significant impact on the Company’s financial position or results of operations. SFAS 123(r) requires that the cost of all stock-based
transactions be measured at fair value and recognized over the period during which a grantee is required to provide goods or services in
exchange for the award. Although the terms of the Company’s stock-based plans do not accelerate vesting upon retirement, or the
attainment of retirement eligibility, the requisite service period subsequent to attaining such eligibility is considered nonsubstantive.
Accordingly, the Company recognizes compensation expense related to stock-based awards over the shorter of the requisite service
period or the period to attainment of retirement eligibility. SFAS 123(r) also requires an estimation of future forfeitures of stock-based
awards to be incorporated into the determination of compensation expense when recognizing expense over the requisite service period.
Foreign Currency
Balance sheet accounts of foreign operations are translated at the exchange rates in effect at each year-end and income and expense
accounts are translated at the average rates of exchange prevailing during the year. The local currencies of foreign operations generally are
the functional currencies unless the local economy is highly inflationary. Translation adjustments are charged or credited directly to other
comprehensive income or loss. Gains and losses from foreign currency transactions are reported as net investment gains (losses) in the
period in which they occur.
Discontinued Operations
The results of operations of a component of the Company that either has been disposed of or is classified as held-for-sale are reported
in discontinued operations if the operations and cash flows of the component have been or will be eliminated from the ongoing operations
of the Company as a result of the disposal transaction and the Company will not have any significant continuing involvement in the
operations of the component after the disposal transaction.
Earnings Per Common Share
Basic earnings per common share are computed based on the weighted average number of common shares outstanding during the period. The
difference between the number of shares assumed issued and number of shares assumed purchased represents the dilutive shares. Diluted earnings per
common share include the dilutive effect of the assumed: (i) exercise or issuance of stock-based awards using the treasury stock method; (ii) settlement of
stock purchase contracts underlying common equity units using the treasury stock method; and (iii) settlement of accelerated common stock repurchase
contract. Under the treasury stock method, exercise or issuance of stock-based awards and settlement of the stock purchase contracts underlying
common equity units is assumed to occur with the proceeds used to purchase common stock at the average market price for the period. See Notes 13,
18 and 20.
Litigation Contingencies
The Company is a party to a number of legal actions and is involved in a number of regulatory investigations. Given the inherent
unpredictability of these matters, it is difficult to estimate the impact on the Company’s financial position. Liabilities are established when it
is probable that a loss has been incurred and the amount of the loss can be reasonably estimated. On a quarterly and annual basis, the
Company reviews relevant information with respect to liabilities for litigation, regulatory investigations and litigation-related contingencies to
be reflected in the Company’s consolidated financial statements. It is possible that an adverse outcome in certain of the Company’s
litigation and regulatory investigations, or the use of different assumptions in the determination of amounts recorded could have a material
effect upon the Company’s consolidated net income or cash flows in particular quarterly or annual periods.
F-18 MetLife, Inc.
MetLife, Inc.
Notes to Consolidated Financial Statements — (Continued)
Adoption of New Accounting Pronouncements
Income Taxes
Effective January 1, 2007, the Company adopted FIN 48. FIN 48 clarifies the accounting for uncertainty in income tax recognized in a
company’s financial statements. FIN 48 requires companies to determine whether it is “more likely than not” that a tax position will be
sustained upon examination by the appropriate taxing authorities before any part of the benefit can be recorded in the financial statements.
It also provides guidance on the recognition, measurement, and classification of income tax uncertainties, along with any related interest
and penalties. Previously recorded income tax benefits that no longer meet this standard are required to be charged to earnings in the
period that such determination is made.
As a result of the implementation of FIN 48, the Company recognized a $52 million increase in the liability for unrecognized tax benefits,
a $4 million decrease in the interest liability for unrecognized tax benefits, and a corresponding reduction to the January 1, 2007 balance of
retained earnings of $37 million, net of $11 million of minority interest. See also Note 15.
Insurance Contracts
Effective January 1, 2007, the Company adopted SOP 05-1 which provides guidance on accounting by insurance enterprises for DAC
on internal replacements of insurance and investment contracts other than those specifically described in SFAS 97, Accounting and
Reporting by Insurance Enterprises for Certain Long-Duration Contracts and for Realized Gains and Losses from the Sale of Investments.
SOP 05-1 defines an internal replacement and is effective for internal replacements occurring in fiscal years beginning after December 15,
2006. In addition, in February 2007, the American Institute of Certified Public Accountants (“AICPA”) issued related Technical Practice Aids
(“TPAs”) to provide further clarification of SOP 05-1. The TPAs became effective concurrently with the adoption of SOP 05-1.
As a result of the adoption of SOP 05-1 and the related TPAs, if an internal replacement modification substantially changes a contract,
then the DAC is written off immediately through income and any new deferrable costs associated with the new replacement are deferred. If
a contract modification does not substantially change the contract, the DAC amortization on the original contract will continue and any
acquisition costs associated with the related modification are immediately expensed.
The adoption of SOP 05-1 and the related TPAs resulted in a reduction to DAC and VOBA on January 1, 2007 and an acceleration of the
amortization period relating primarily to the Company’s group life and health insurance contracts that contain certain rate reset provisions.
Prior to the adoption of SOP 05-1, DAC on such contracts was amortized over the expected renewable life of the contract. Upon adoption
of SOP 05-1, DAC on such contracts is to be amortized over the rate reset period. The impact as of January 1, 2007 was a cumulative
effect adjustment of $292 million, net of income tax of $161 million, which was recorded as a reduction to retained earnings.
Defined Benefit and Other Postretirement Plans
Effective December 31, 2006, the Company adopted SFAS 158. The pronouncement revises financial reporting standards for defined
benefit pension and other postretirement plans by requiring the:
(i) recognition in the statement of financial position of the funded status of defined benefit plans measured as the difference
between the fair value of plan assets and the benefit obligation, which is the projected benefit obligation for pension plans and the
accumulated postretirement benefit obligation for other postretirement plans;
(ii) recognition as an adjustment to accumulated other comprehensive income (loss), net of income tax, those amounts of actuarial
gains and losses, prior service costs and credits, and net asset or obligation at transition that have not yet been included in net
periodic benefit costs as of the end of the year of adoption;
(iii) recognition of subsequent changes in funded status as a component of other comprehensive income;
(iv) measurement of benefit plan assets and obligations as of the date of the statement of financial position; and
(v) disclosure of additional information about the effects on the employer’s statement of financial position.
The adoption of SFAS 158 resulted in a reduction of $744 million, net of income tax, to accumulated other comprehensive income,
which is included as a component of total consolidated stockholders’ equity. As the Company’s measurement date for its pension and
other postretirement benefit plans is already December 31 there was no impact of adoption due to changes in measurement date. See also
“Summary of Significant Accounting Policies and Critical Accounting Estimates” and Note 17.
Stock Compensation Plans
As described previously, effective January 1, 2006, the Company adopted SFAS 123(r) including supplemental application guidance
issued by the U.S. Securities and Exchange Commission (“SEC”) in Staff Accounting Bulletin (“SAB”) No. 107, Share-Based Payment
(“SAB 107”) — using the modified prospective transition method. In accordance with the modified prospective transition method, results
for prior periods have not been restated. SFAS 123(r) requires that the cost of all stock-based transactions be measured at fair value and
recognized over the period during which a grantee is required to provide goods or services in exchange for the award. The Company had
previously adopted the fair value method of accounting for stock-based awards as prescribed by SFAS 123 on a prospective basis
effective January 1, 2003, and prior to January 1, 2003, accounted for its stock-based awards to employees under the intrinsic value
method prescribed by APB 25. The Company did not modify the substantive terms of any existing awards prior to adoption of SFAS 123(r).
Under the modified prospective transition method, compensation expense recognized during the year ended December 31, 2006
includes: (a) compensation expense for all stock-based awards granted prior to, but not yet vested as of January 1, 2006, based on the
grant date fair value estimated in accordance with the original provisions of SFAS 123, and (b) compensation expense for all stock-based
awards granted beginning January 1, 2006, based on the grant date fair value estimated in accordance with the provisions of SFAS 123(r).
The adoption of SFAS 123(r) did not have a significant impact on the Company’s financial position or results of operations as all stock-
based awards accounted for under the intrinsic value method prescribed by APB 25 had vested prior to the adoption date and the
Company had adopted the fair value recognition provisions of SFAS 123 on January 1, 2003. As required by SFAS 148, and carried
F-19MetLife, Inc.
MetLife, Inc.
Notes to Consolidated Financial Statements — (Continued)
forward in the provisions of SFAS 123(r), the Company discloses the pro forma impact as if stock-based awards accounted for under APB
25 had been accounted for under the fair value method in Note 18.
SFAS 123 allowed forfeitures of stock-based awards to be recognized as a reduction of compensation expense in the period in which
the forfeiture occurred. Upon adoption of SFAS 123(r), the Company changed its policy and now incorporates an estimate of future
forfeitures into the determination of compensation expense when recognizing expense over the requisite service period. The impact of this
change in accounting policy was not significant to the Company’s financial position or results of operations as of the date of adoption.
Additionally, for awards granted after adoption, the Company changed its policy from recognizing expense for stock-based awards over
the requisite service period to recognizing such expense over the shorter of the requisite service period or the period to attainment of
retirement-eligibility. The pro forma impact of this change in expense recognition policy for stock-based compensation is detailed in
Note 18.
Prior to the adoption of SFAS 123(r), the Company presented tax benefits of deductions resulting from the exercise of stock options
within operating cash flows in the consolidated statements of cash flows. SFAS 123(r) requires tax benefits resulting from tax deductions in
excess of the compensation cost recognized for those options be classified and reported as a financing cash inflow upon adoption of
SFAS 123(r).
Derivative Financial Instruments
The Company has adopted guidance relating to derivative financial instruments as follows:
k Effective January 1, 2006, the Company adopted prospectively SFAS No. 155, Accounting for Certain Hybrid Instruments
(“SFAS 155”). SFAS 155 amends SFAS 133 and SFAS No. 140, Accounting for Transfers and Servicing of Financial Assets and
Extinguishments of Liabilities (“SFAS 140”). SFAS 155 allows financial instruments that have embedded derivatives to be accounted
for as a whole, eliminating the need to bifurcate the derivative from its host, if the holder elects to account for the whole instrument on
a fair value basis. In addition, among other changes, SFAS 155:
(i) clarifies which interest-only strips and principal-only strips are not subject to the requirements of SFAS 133;
(ii) establishes a requirement to evaluate interests in securitized financial assets to identify interests that are freestanding derivatives
or that are hybrid financial instruments that contain an embedded derivative requiring bifurcation;
(iii) clarifies that concentrations of credit risk in the form of subordination are not embedded derivatives; and
(iv) amends SFAS 140 to eliminate the prohibition on a qualifying special-purpose entity (“QSPE”) from holding a derivative financial
instrument that pertains to a beneficial interest other than another derivative financial interest.
The adoption of SFAS 155 did not have a material impact on the Company’s consolidated financial statements.
k Effective October 1, 2006, the Company adopted SFAS 133 Implementation Issue No. B40, Embedded Derivatives: Application of
Paragraph 13(b) to Securitized Interests in Prepayable Financial Assets (“Issue B40”). Issue B40 clarifies that a securitized interest in
prepayable financial assets is not subject to the conditions in paragraph 13(b) of SFAS 133, if it meets both of the following criteria:
(i) the right to accelerate the settlement if the securitized interest cannot be controlled by the investor; and (ii) the securitized interest
itself does not contain an embedded derivative (including an interest rate-related derivative) for which bifurcation would be required
other than an embedded derivative that results solely from the embedded call options in the underlying financial assets. The adoption
of Issue B40 did not have a material impact on the Company’s consolidated financial statements.
k Effective January 1, 2006, the Company adopted prospectively SFAS 133 Implementation Issue No. B38, Embedded Derivatives:
Evaluation of Net Settlement with Respect to the Settlement of a Debt Instrument through Exercise of an Embedded Put Option or Call
Option (“Issue B38”) and SFAS 133 Implementation Issue No. B39, Embedded Derivatives: Application of Paragraph 13(b) to Call
Options That Are Exercisable Only by the Debtor (“Issue B39”). Issue B38 clarifies that the potential settlement of a debtor’s obligation
to a creditor occurring upon exercise of a put or call option meets the net settlement criteria of SFAS 133. Issue B39 clarifies that an
embedded call option, in which the underlying is an interest rate or interest rate index, that can accelerate the settlement of a debt
host financial instrument should not be bifurcated and fair valued if the right to accelerate the settlement can be exercised only by the
debtor (issuer/borrower) and the investor will recover substantially all of its initial net investment. The adoption of Issues B38 and B39
did not have a material impact on the Company’s consolidated financial statements.
Other
Effective January 1, 2007, the Company adopted FASB Staff Position (“FSP”) Emerging Issues Task Force (“EITF”) 00-19-2, Accounting
for Registration Payment Arrangements (“FSP EITF 00-19-2”). FSP EITF 00-19-2 specifies that the contingent obligation to make future
payments or otherwise transfer consideration under a registration payment arrangement should be separately recognized and measured in
accordance with SFAS No. 5, Accounting for Contingencies. The adoption of FSP EITF 00-19-2 did not have an impact on the Company’s
consolidated financial statements.
Effective January 1, 2007, the Company adopted FSP No. FAS 13-2, Accounting for a Change or Projected Change in the Timing of
Cash Flows Relating to Income Taxes Generated by a Leveraged Lease Transaction (“FSP 13-2”). FSP 13-2 amends SFAS No. 13,
Accounting for Leases, to require that a lessor review the projected timing of income tax cash flows generated by a leveraged lease
annually or more frequently if events or circumstances indicate that a change in timing has occurred or is projected to occur. In addition,
FSP 13-2 requires that the change in the net investment balance resulting from the recalculation be recognized as a gain or loss from
continuing operations in the same line item in which leveraged lease income is recognized in the year in which the assumption is changed.
The adoption of FSP 13-2 did not have a material impact on the Company’s consolidated financial statements.
Effective January 1, 2007, the Company adopted SFAS No. 156, Accounting for Servicing of Financial Assets — an amendment of
FASB Statement No. 140 (“SFAS 156”). Among other requirements, SFAS 156 requires an entity to recognize a servicing asset or servicing
liability each time it undertakes an obligation to service a financial asset by entering into a servicing contract in certain situations. The
adoption of SFAS 156 did not have an impact on the Company’s consolidated financial statements.
F-20 MetLife, Inc.
MetLife, Inc.
Notes to Consolidated Financial Statements — (Continued)
Effective November 15, 2006, the Company adopted SAB No. 108, Considering the Effects of Prior Year Misstatements when
Quantifying Misstatements in Current Year Financial Statements (“SAB 108”). SAB 108 provides guidance on how prior year misstatements
should be considered when quantifying misstatements in current year financial statements for purposes of assessing materiality. SAB 108
requires that registrants quantify errors using both a balance sheet and income statement approach and evaluate whether either approach
results in quantifying a misstatement that, when relevant quantitative and qualitative factors are considered, is material. SAB 108 permits
companies to initially apply its provisions by either restating prior financial statements or recording a cumulative effect adjustment to the
carrying values of assets and liabilities as of January 1, 2006 with an offsetting adjustment to retained earnings for errors that were
previously deemed immaterial but are material under the guidance in SAB 108. The adoption of SAB 108 did not have a material impact on
the Company’s consolidated financial statements.
Effective January 1, 2006, the Company adopted prospectively EITF Issue No. 05-7, Accounting for Modifications to Conversion
Options Embedded in Debt Instruments and Related Issues (“EITF 05-7”). EITF 05-7 provides guidance on whether a modification of
conversion options embedded in debt results in an extinguishment of that debt. In certain situations, companies may change the terms of
an embedded conversion option as part of a debt modification. The EITF concluded that the change in the fair value of an embedded
conversion option upon modification should be included in the analysis of EITF Issue No. 96-19, Debtor’s Accounting for a Modification or
Exchange of Debt Instruments, to determine whether a modification or extinguishment has occurred and that a change in the fair value of a
conversion option should be recognized upon the modification as a discount (or premium) associated with the debt, and an increase (or
decrease) in additional paid-in capital. The adoption of EITF 05-7 did not have a material impact on the Company’s consolidated financial
statements.
Effective January 1, 2006, the Company adopted EITF Issue No. 05-8, Income Tax Consequences of Issuing Convertible Debt with a
Beneficial Conversion Feature (“EITF 05-8”). EITF 05-8 concludes that: (i) the issuance of convertible debt with a beneficial conversion
feature results in a basis difference that should be accounted for as a temporary difference; and (ii) the establishment of the deferred tax
liability for the basis difference should result in an adjustment to additional paid-in capital. EITF 05-8 was applied retrospectively for all
instruments with a beneficial conversion feature accounted for in accordance with EITF Issue No. 98-5, Accounting for Convertible
Securities with Beneficial Conversion Features or Contingently Adjustable Conversion Ratios, and EITF Issue No. 00-27, Application of
Issue No. 98-5 to Certain Convertible Instruments. The adoption of EITF 05-8 did not have a material impact on the Company’s
consolidated financial statements.
Effective January 1, 2006, the Company adopted SFAS No. 154, Accounting Changes and Error Corrections, a replacement of APB
Opinion No. 20 and FASB Statement No. 3 (“SFAS 154”). SFAS 154 requires retrospective application to prior periods’ financial statements
for a voluntary change in accounting principle unless it is deemed impracticable. It also requires that a change in the method of
depreciation, amortization, or depletion for long-lived, non-financial assets be accounted for as a change in accounting estimate rather
than a change in accounting principle. The adoption of SFAS 154 did not have a material impact on the Company’s consolidated financial
statements.
In June 2005, the EITF reached consensus on Issue No. 04-5, Determining Whether a General Partner, or the General Partners as a
Group, Controls a Limited Partnership or Similar Entity When the Limited Partners Have Certain Rights (“EITF 04-5”). EITF 04-5 provides a
framework for determining whether a general partner controls and should consolidate a limited partnership or a similar entity in light of
certain rights held by the limited partners. The consensus also provides additional guidance on substantive rights. EITF 04-5 was effective
after June 29, 2005 for all newly formed partnerships and for any pre-existing limited partnerships that modified their partnership
agreements after that date. For all other limited partnerships, EITF 04-5 required adoption by January 1, 2006 through a cumulative effect
of a change in accounting principle recorded in opening equity or applied retrospectively by adjusting prior period financial statements. The
adoption of the provisions of EITF 04-5 did not have a material impact on the Company’s consolidated financial statements.
Effective November 9, 2005, the Company prospectively adopted the guidance in FSP No. FAS 140-2, Clarification of the Application of
Paragraphs 40(b) and 40(c) of FAS 140 (“FSP 140-2”). FSP 140-2 clarified certain criteria relating to derivatives and beneficial interests
when considering whether an entity qualifies as a QSPE. Under FSP 140-2, the criteria must only be met at the date the QSPE issues
beneficial interests or when a derivative financial instrument needs to be replaced upon the occurrence of a specified event outside the
control of the transferor. The adoption of FSP 140-2 did not have a material impact on the Company’s consolidated financial statements.
Effective July 1, 2005, the Company adopted SFAS No. 153, Exchanges of Nonmonetary Assets, an amendment of APB Opinion No. 29
(“SFAS 153”). SFAS 153 amended prior guidance to eliminate the exception for nonmonetary exchanges of similar productive assets and
replaced it with a general exception for exchanges of nonmonetary assets that do not have commercial substance. A nonmonetary
exchange has commercial substance if the future cash flows of the entity are expected to change significantly as a result of the exchange.
The provisions of SFAS 153 were required to be applied prospectively for fiscal periods beginning after June 15, 2005. The adoption of
SFAS 153 did not have a material impact on the Company’s consolidated financial statements.
Effective July 1, 2005, the Company adopted EITF Issue No. 05-6, Determining the Amortization Period for Leasehold Improvements
(“EITF 05-6”). EITF 05-6 provides guidance on determining the amortization period for leasehold improvements acquired in a business
combination or acquired subsequent to lease inception. As required by EITF 05-6, the Company adopted this guidance on a prospective
basis which had no material impact on the Company’s consolidated financial statements.
In June 2005, the FASB completed its review of EITF Issue No. 03-1, The Meaning of Other-Than-Temporary Impairment and Its
Application to Certain Investments (“EITF 03-1”). EITF 03-1 provides accounting guidance regarding the determination of when an
impairment of debt and marketable equity securities and investments accounted for under the cost method should be considered
other-than-temporary and recognized in income. EITF 03-1 also requires certain quantitative and qualitative disclosures for debt and
marketable equity securities classified as available-for-sale or held-to-maturity under SFAS No. 115, Accounting for Certain Investments in
Debt and Equity Securities, that are impaired at the balance sheet date but for which an other-than-temporary impairment has not been
recognized. The FASB decided not to provide additional guidance on the meaning of other-than-temporary impairment but has issued FSP
F-21MetLife, Inc.
MetLife, Inc.
Notes to Consolidated Financial Statements — (Continued)
Nos. FAS 115-1 and FAS 124-1, The Meaning of Other-Than-Temporary Impairment and its Application to Certain Investments
(“FSP 115-1”), which nullifies the accounting guidance on the determination of whether an investment is other-than-temporarily impaired
as set forth in EITF 03-1. As required by FSP 115-1, the Company adopted this guidance on a prospective basis, which had no material
impact on the Company’s consolidated financial statements, and has provided the required disclosures.
In December 2004, the FASB issued FSP No. FAS 109-2, Accounting and Disclosure Guidance for the Foreign Earnings Repatriation
Provision within the American Jobs Creation Act of 2004 (“FSP 109-2”). The American Jobs Creation Act of 2004 (“AJCA”) introduced a
one-time dividend received deduction on the repatriation of certain earnings to a U.S. taxpayer. FSP 109-2 provides companies additional
time beyond the financial reporting period of enactment to evaluate the effects of the AJCA on their plans to repatriate foreign earnings for
purposes of applying SFAS No. 109, Accounting for Income Taxes. During 2005, the Company recorded a $27 million income tax benefit
related to the repatriation of foreign earnings pursuant to Internal Revenue Code Section 965 for which a U.S. deferred income tax
provision had previously been recorded. As of January 1, 2006, the repatriation provision of the AJCA no longer applies to the Company.
Future Adoption of New Accounting Pronouncements
Fair Value
In September 2006, the FASB issued SFAS No. 157, Fair Value Measurements (“SFAS 157”). SFAS 157 defines fair value, establishes a
framework for measuring fair value and requires enhanced disclosures about fair value measurements. Effective January 1, 2008, the
Company adopted SFAS 157 and applied the provisions of the statement prospectively to assets and liabilities measured and disclosed at
fair value. In addition to new disclosure requirements, the adoption of SFAS 157 changes the valuation of certain freestanding derivatives
by moving from a mid to bid pricing convention as well as changing the valuation of embedded derivatives associated with annuity
contracts. The change in valuation of embedded derivatives associated with annuity contracts results from the incorporation of risk margins
and the Company’s own credit standing in their valuation. While the Company does not expect such changes in valuation to have a material
impact on the Company’s financial statements at January 1, 2008, the addition of risk margins and the Company’s own credit spread in the
valuation of embedded derivatives associated with annuity contracts may result in significant volatility in the Company’s consolidated net
income.
In February 2007, the FASB issued SFAS No. 159, The Fair Value Option for Financial Assets and Financial Liabilities (“SFAS 159”).
SFAS 159 permits entities the option to measure most financial instruments and certain other items at fair value at specified election dates
and to report related unrealized gains and losses in earnings. The fair value option is generally applied on an instrument-by-instrument
basis and is generally an irrevocable election. Effective January 1, 2008, the Company has elected the fair value option on fixed maturity
securities backing certain pension products sold in Brazil. Previously, these fixed maturity securities were accounted for as availa-
ble-for-sale securities in accordance with FAS 115. The Company’s insurance joint venture in Japan also elected the fair value option for its
single premium deferred annuities and supporting assets. These elections are not expected to have a material impact on the Company’s
retained earnings or equity as of January 1, 2008.
In June 2007, the AICPA issued SOP 07-1, Clarification of the Scope of the Audit and Accounting Guide Investment Companies and
Accounting by Parent Companies and Equity Method Investors for Investments in Investment Companies (“SOP 07-1”) . Upon adoption of
SOP 07-1, the Company must also adopt the provisions of FASB Staff Position No. FSP FIN 46(r)-7, Application of FASB Interpretation
No. 46 to Investment Companies (“FSP FIN 46(r)-7”), which permanently exempts investment companies from applying the provisions of
FIN No. 46(r), Consolidation of Variable Interest Entities — An Interpretation of Accounting Research Bulletin No. 51, and its December
2003 revision (“FIN 46(r)”) to investments carried at fair value. SOP 07-1 provides guidance for determining whether an entity falls within the
scope of the AICPA Audit and Accounting Guide Investment Companies and whether investment company accounting should be retained
by a parent company upon consolidation of an investment company subsidiary or by an equity method investor in an investment company.
In certain circumstances, SOP 07-1 precludes retention of specialized accounting for investment companies (i.e., fair value accounting),
when similar direct investments exist in the consolidated group and are measured on a basis inconsistent with that applied to investment
companies. Additionally, SOP 07-1 precludes retention of specialized accounting for investment companies if the reporting entity does not
distinguish through documented policies the nature and type of investments to be held in the investment companies from those made in
the consolidated group where other accounting guidance is being applied. In February 2008, the FASB issued FSP No. SOP 7-1-1,
Effective Date of AICPA Statement of Position 07-1, which delays indefinitely the effective date of SOP 07-1. The Company is closely
monitoring further FASB developments.
In May 2007, the FASB issued FSP No. FIN 39-1, Amendment of FASB Interpretation No. 39 (“FSP 39-1”). FSP 39-1 amends FIN No. 39,
Offsetting of Amounts Related to Certain Contracts (“FIN 39”), to permit a reporting entity to offset fair value amounts recognized for the
right to reclaim cash collateral (a receivable) or the obligation to return cash collateral (a payable) against fair value amounts recognized for
derivative instruments executed with the same counterparty under the same master netting arrangement that have been offset in
accordance with FIN 39. FSP 39-1 also amends FIN 39 for certain terminology modifications. FSP 39-1 applies to fiscal years beginning
after November 15, 2007. FSP 39-1 will be applied retrospectively, unless it is impracticable to do so. Upon adoption of FSP 39-1, the
Company is permitted to change its accounting policy to offset or not offset fair value amounts recognized for derivative instruments under
master netting arrangements. The adoption of FSP 39-1 will not have an impact on the Company’s financial statements.
Business Combinations
In December 2007, the FASB issued SFAS No. 141 (revised 2007), Business Combinations — A Replacement of FASB Statement
No. 141 (“SFAS 141(r)”) and SFAS No. 160, Noncontrolling Interests in Consolidated Financial Statements — An Amendment of ARB
No. 51 (“SFAS 160”) which are effective for fiscal years beginning after December 15, 2008. Under SFAS 141(r) and SFAS 160:
• All business combinations (whether full, partial, or “step” acquisitions) result in all assets and liabilities of an acquired business being
recorded at fair value, with limited exceptions.
F-22 MetLife, Inc.
MetLife, Inc.
Notes to Consolidated Financial Statements — (Continued)
• Acquisition costs are generally expensed as incurred; restructuring costs associated with a business combination are generally
expensed as incurred subsequent to the acquisition date.
• The fair value of the purchase price, including the issuance of equity securities, is determined on the acquisition date.
• Certain acquired contingent liabilities are recorded at fair value at the acquisition date and subsequently measured at either the higher
of such amount or the amount determined under existing guidance for non-acquired contingencies.
• Changes in deferred tax asset valuation allowances and income tax uncertainties after the acquisition date generally affect income
tax expense.
• Noncontrolling interests (formerly known as “minority interests”) are valued at fair value at the acquisition date and are presented as
equity rather than liabilities.
• When control is attained on previously noncontrolling interests, the previously held equity interests are remeasured at fair value and a
gain or loss is recognized.
• Purchases or sales of equity interests that do not result in a change in control are accounted for as equity transactions.
• When control is lost in a partial disposition, realized gains or losses are recorded on equity ownership sold and the remaining
ownership interest is remeasured and holding gains or losses are recognized.
The pronouncements are effective for fiscal years beginning on or after December 15, 2008 and apply prospectively to business
combinations. Presentation and disclosure requirements related to noncontrolling interests must be retrospectively applied. The Company
is currently evaluating the impact of SFAS 141(r) on its accounting for future acquisitions and the impact of SFAS 160 on its consolidated
financial statements.
Other
In February 2008, the FASB issued FSP No. FAS 140-3, Accounting for Transfers of Financial Assets and Repurchase Financing
Transactions (“FSP 140-3”). FSP 140-3 provides guidance for evaluating whether to account for a transfer of a financial asset and
repurchase financing as a single transaction or as two separate transactions. FSP 140-3 is effective prospectively for financial statements
issued for fiscal years beginning after November 15, 2008. The Company is currently evaluating the impact of FSP FAS 140-3 on its
consolidated financial statements.
In January 2008, the FASB cleared SFAS 133 Implementation Issue E23, Clarification of the Application of the Shortcut Method (“Issue
E23”). Issue E23 amends SFAS 133 by permitting interest rate swaps to have a non-zero fair value at inception, as long as the difference
between the transaction price (zero) and the fair value (exit price), as defined by SFAS 157, is solely attributable to a bid-ask spread. In
addition, entities would not be precluded from assuming no ineffectiveness in a hedging relationship of interest rate risk involving an
interest bearing asset or liability in situations where the hedged item is not recognized for accounting purposes until settlement date as long
as the period between trade date and settlement date of the hedged item is consistent with generally established conventions in the
marketplace. Issue E23 is effective for hedging relationships designated on or after January 1, 2008. The Company does not expect the
adoption of Issue E23 to have a material impact on its consolidated financial statements.
In December 2007, the FASB ratified as final the consensus on EITF Issue No. 07-6, Accounting for the Sale of Real Estate When the
Agreement Includes a Buy-Sell Clause (“EITF 07-6”). EITF 07-6 addresses whether the existence of a buy-sell arrangement would preclude
partial sales treatment when real estate is sold to a jointly owned entity. The consensus concludes that the existence of a buy-sell clause
does not necessarily preclude partial sale treatment under current guidance. EITF 07-6 applies prospectively to new arrangements entered
into and assessments on existing transactions performed in fiscal years beginning after December 15, 2008. The Company does not
expect the adoption of EITF 07-6 to have a material impact on its consolidated financial statements.
In November 2007, the SEC issued SAB No. 109, Written Loan Commitments Recorded at Fair Value through Earnings (“SAB 109”),
which amends SAB No. 105, Application of Accounting Principles to Loan Commitments. SAB 109 provides guidance on (i) incorporating
expected net future cash flows when related to the associated servicing of a loan when measuring fair value; and (ii) broadening the SEC
staff’s view that internally-developed intangible assets should not be recorded as part of the fair value of a derivative loan commitment or to
written loan commitments that are accounted for at fair value through earnings. Internally-developed intangible assets are not considered a
component of the related instruments. SAB 109 is effective for derivative loan commitments issued or modified in fiscal quarters beginning
after December 15, 2007. The adoption of SAB 109 will not have an impact on the Company’s consolidated financial statements.
2. Acquisitions and Dispositions
Travelers
On July 1, 2005, the Company completed the acquisition of Travelers for $12.1 billion. The results of Travelers’ operations were
included in the Company’s financial statements beginning July 1, 2005. As a result of the acquisition, management of the Company
increased significantly the size and scale of the Company’s core insurance and annuity products and expanded the Company’s presence in
both the retirement & savings’ domestic and international markets. The distribution agreements executed with Citigroup as part of the
acquisition provide the Company with one of the broadest distribution networks in the industry.
The initial consideration paid in 2005 by the Company for the acquisition consisted of $10.9 billion in cash and 22,436,617 shares of
the Company’s common stock with a market value of $1.0 billion to Citigroup and $100 million in other transaction costs. The Company
revised the purchase price as a result of the finalization by both parties of their review of the June 30, 2005 financial statements and final
resolution as to the interpretation of the provisions of the acquisition agreement which resulted in a payment of additional consideration of
$115 million by the Company to Citigroup in 2006. In addition to cash on-hand, the purchase price was financed through the issuance of
common stock as described previously, debt securities as described in Note 10, common equity units as described in Note 13 and
preferred stock as described in Note 18.
The acquisition was accounted for using the purchase method of accounting, which requires that the assets and liabilities of Travelers
be measured at their fair values. The net fair value of assets acquired and liabilities assumed totaled $7.8 billion, resulting in goodwill of
F-23MetLife, Inc.
MetLife, Inc.
Notes to Consolidated Financial Statements — (Continued)
$4.3 billion, of which $1.6 billion is deductible for income tax purposes. Further information on goodwill is described in Note 6. See Note 5
for the VOBA acquired as part of the acquisition and Note 7 for the value of distribution agreements (“VODA”) and the value of customer
relationships acquired (“VOCRA”).
As part of the integration of Travelers’ operations, management approved and initiated plans to reduce approximately 1,000 domestic
and international Travelers positions, which was completed in December 2006. MetLife initially recorded restructuring costs, including
severance, relocation and outplacement services of Travelers’ employees, as liabilities assumed in the purchase business combination of
$49 million. For the years ended December 31, 2006 and 2005, the liability for restructuring costs was reduced by $4 million and $1 million,
respectively, due to a reduction in the estimate of severance benefits to be paid to Travelers employees. The restructuring costs associated
with the Travelers acquisition were as follows:
2006 2005
Years Ended December 31,
(In millions)
Balance at January 1, . . . . . . . . . . . . . . . . . . . . . . . . . . . . . . . . . . . . . . . . . . . . . . . . . . . $ 28 $ —
Acquisition . . . . . . . . . . . . . . . . . . . . . . . . . . . . . . . . . . . . . . . . . . . . . . . . . . . . . . . . . . — 49
Cash payments . . . . . . . . . . . . . . . . . . . . . . . . . . . . . . . . . . . . . . . . . . . . . . . . . . . . . . . (24) (20)
Other reductions . . . . . . . . . . . . . . . . . . . . . . . . . . . . . . . . . . . . . . . . . . . . . . . . . . . . . . (4) (1)
Balance at December 31, . . . . . . . . . . . . . . . . . . . . . . . . . . . . . . . . . . . . . . . . . . . . . . . . $ — $ 28
Other Acquisitions and Dispositions
On June 28, 2007, the Company acquired the remaining 50% interest in a joint venture in Hong Kong, MetLife Fubon Limited (“MetLife
Fubon”), for $56 million in cash, resulting in MetLife Fubon becoming a consolidated subsidiary of the Company. The transaction was
treated as a step acquisition, and at June 30, 2007, total assets and liabilities of MetLife Fubon of $839 million and $735 million,
respectively, were included in the Company’s consolidated balance sheet. The Company’s investment for the initial 50% interest in MetLife
Fubon was $48 million. The Company used the equity method of accounting for such investment in MetLife Fubon. The Company’s share
of the joint venture’s results for the six months ended June 30, 2007, was a loss of $3 million. The fair value of the assets acquired and the
liabilities assumed in the step acquisition at June 30, 2007, was $427 million and $371 million, respectively. No additional goodwill was
recorded as a part of the step acquisition. As a result of this acquisition, additional VOBA and VODA of $45 million and $5 million,
respectively, were recorded and both have a weighted average amortization period of 16 years. Further information on VOBA and VODA is
described in Note 5 and Note 7, respectively.
On June 1, 2007, the Company completed the sale of its Bermuda insurance subsidiary, MetLife International Insurance, Ltd. (“MLII”), to
a third party for $33 million in cash consideration, resulting in a gain upon disposal of $3 million, net of income tax. The net assets of MLII at
disposal were $27 million. A liability of $1 million was recorded with respect to a guarantee provided in connection with this disposition.
Further information on guarantees is described in Note 16.
On September 1, 2005, the Company completed the acquisition of CitiStreet Associates, a division of CitiStreet LLC, which is primarily
involved in the distribution of annuity products and retirement plans to the education, healthcare, and not-for-profit markets, for $56 million,
of which $2 million was allocated to goodwill and $54 million to other identifiable intangibles, specifically the value of customer relationships
acquired, which have a weighted average amortization period of 16 years. CitiStreet Associates was integrated with MetLife Resources, a
focused distribution channel of MetLife, which is dedicated to provide retirement plans and financial services to the same markets. Further
information on goodwill and VOCRA is described in Note 6 and Note 7, respectively.
See Note 23 for information on the disposition of the annuities and pension businesses of MetLife Insurance Limited (“MetLife
Australia”), P.T. Sejahtera (“MetLife Indonesia”) and SSRM Holdings, Inc. (“SSRM”).
See Note 25 for information on the Company’s acquisitions subsequent to December 31, 2007.
F-24 MetLife, Inc.
MetLife, Inc.
Notes to Consolidated Financial Statements — (Continued)
3. Investments
Fixed Maturity and Equity Securities Available-for-Sale
The following tables present the cost or amortized cost, gross unrealized gain and loss, and estimated fair value of the Company’s fixed
maturity and equity securities, the percentage that each sector represents by the total fixed maturity securities holdings and by the total
equity securities holdings at:
Cost or
Amortized
Cost Gain Loss
Estimated
Fair Value
% of
Total
Gross Unrealized
December 31, 2007
(In millions)
U.S. corporate securities . . . . . . . . . . . . . . . . . . . . . . . . . . . . . . . . $ 77,875 $1,725 $2,174 $ 77,426 32.0%
Residential mortgage-backed securities . . . . . . . . . . . . . . . . . . . . . . 56,267 611 389 56,489 23.3
Foreign corporate securities . . . . . . . . . . . . . . . . . . . . . . . . . . . . . . 37,359 1,740 794 38,305 15.8
U.S.Treasury/agency securities . . . . . . . . . . . . . . . . . . . . . . . . . . . . 19,771 1,487 13 21,245 8.8
Commercial mortgage-backed securities . . . . . . . . . . . . . . . . . . . . . . 17,676 251 199 17,728 7.3
Foreign government securities . . . . . . . . . . . . . . . . . . . . . . . . . . . . 13,535 1,924 188 15,271 6.3
Asset-backed securities . . . . . . . . . . . . . . . . . . . . . . . . . . . . . . . . 11,549 41 549 11,041 4.6
State and political subdivision securities . . . . . . . . . . . . . . . . . . . . . . 4,394 140 115 4,419 1.8
Other fixed maturity securities . . . . . . . . . . . . . . . . . . . . . . . . . . . . . 335 13 30 318 0.1
Total fixed maturity securities . . . . . . . . . . . . . . . . . . . . . . . . . . . . $238,761 $7,932 $4,451 $242,242 100.0%
Common stock . . . . . . . . . . . . . . . . . . . . . . . . . . . . . . . . . . . . . . $ 2,488 $ 568 $ 108 $ 2,948 48.7%
Non-redeemable preferred stock . . . . . . . . . . . . . . . . . . . . . . . . . . . 3,403 61 362 3,102 51.3
Total equity securities . . . . . . . . . . . . . . . . . . . . . . . . . . . . . . . . . $ 5,891 $ 629 $ 470 $ 6,050 100.0%
Cost or
Amortized
Cost Gain Loss
Estimated
Fair Value
% of
Total
Gross Unrealized
December 31, 2006
(In millions)
U.S. corporate securities . . . . . . . . . . . . . . . . . . . . . . . . . . . . . . . . $ 74,010 $2,047 $ 983 $ 75,074 31.0%
Residential mortgage-backed securities . . . . . . . . . . . . . . . . . . . . . . 51,602 385 321 51,666 21.4
Foreign corporate securities . . . . . . . . . . . . . . . . . . . . . . . . . . . . . . 33,029 1,687 378 34,338 14.2
U.S. Treasury/agency securities . . . . . . . . . . . . . . . . . . . . . . . . . . . 29,897 984 248 30,633 12.7
Commercial mortgage-backed securities . . . . . . . . . . . . . . . . . . . . . . 16,467 193 138 16,522 6.8
Foreign government securities . . . . . . . . . . . . . . . . . . . . . . . . . . . . 11,406 1,835 34 13,207 5.4
Asset-backed securities . . . . . . . . . . . . . . . . . . . . . . . . . . . . . . . . 13,851 75 53 13,873 5.7
State and political subdivision securities . . . . . . . . . . . . . . . . . . . . . . 6,121 230 51 6,300 2.6
Other fixed maturity securities . . . . . . . . . . . . . . . . . . . . . . . . . . . . . 385 7 77 315 0.2
Total fixed maturity securities . . . . . . . . . . . . . . . . . . . . . . . . . . . . $236,768 $7,443 $2,283 $241,928 100.0%
Common stock . . . . . . . . . . . . . . . . . . . . . . . . . . . . . . . . . . . . . . $ 1,798 $ 487 $ 16 $ 2,269 44.5%
Non-redeemable preferred stock . . . . . . . . . . . . . . . . . . . . . . . . . . . 2,751 103 29 2,825 55.5
Total equity securities . . . . . . . . . . . . . . . . . . . . . . . . . . . . . . . . . $ 4,549 $ 590 $ 45 $ 5,094 100.0%
The Company held foreign currency derivatives with notional amounts of $9.2 billion and $8.9 billion to hedge the exchange rate risk
associated with foreign denominated fixed maturity securities at December 31, 2007 and 2006, respectively.
The Company is not exposed to any significant concentrations of credit risk in its equity securities portfolio. The Company is exposed to
concentrations of credit risk related to U.S. Treasury securities and obligations of U.S. government corporations and agencies. Addi-
tionally, at December 31, 2007 and 2006, the Company had exposure to fixed maturity securities backed by sub-prime mortgages with
estimated fair values of $2.2 billion and $3.0 billion, respectively, and unrealized losses of $219 million and $5 million, respectively. These
securities are classified within asset-backed securities in the immediately preceding table. At December 31, 2007, 32% have been
guaranteed by financial guarantors, of which 55% was guaranteed by financial guarantors who remain Aaa rated in 2008. Overall, at
December 31, 2007, $6.7 billion of the estimated fair value of the Company’s fixed maturity securities were credit enhanced by financial
guarantors of which $2.5 billion, $2.5 billion and $1.7 billion at December 31, 2007, are included within state and political subdivisions,
corporate securities and asset-backed securities, respectively, and 80% were guaranteed by financial guarantors who remain Aaa rated in
2008.
The Company held fixed maturity securities at estimated fair values that were below investment grade or not rated by an independent
rating agency that totaled $17.7 billion and $17.3 billion at December 31, 2007 and 2006, respectively. These securities had net unrealized
gains (losses) of ($108) million and $627 million at December 31, 2007 and 2006, respectively. Non-income producing fixed maturity
securities were $13 million and $16 million at December 31, 2007 and 2006, respectively. Net unrealized gains associated with non-
income producing fixed maturity securities were $12 million and $4 million at December 31, 2007 and 2006, respectively.
F-25MetLife, Inc.
MetLife, Inc.
Notes to Consolidated Financial Statements — (Continued)
The amortized cost and estimated fair value of fixed maturity securities, by contractual maturity date (excluding scheduled sinking
funds), are as follows:
Amortized
Cost
Estimated
Fair Value
Amortized
Cost
Estimated
Fair Value
2007 2006
December 31,
(In millions)
Due in one year or less. . . . . . . . . . . . . . . . . . . . . . . . . . . . . . . . . . . . $ 4,537 $ 4,628 $ 6,923 $ 7,011
Due after one year through five years . . . . . . . . . . . . . . . . . . . . . . . . . . 42,453 43,167 45,331 45,928
Due after five years through ten years . . . . . . . . . . . . . . . . . . . . . . . . . . 40,783 41,046 39,571 40,200
Due after ten years . . . . . . . . . . . . . . . . . . . . . . . . . . . . . . . . . . . . . . 65,496 68,143 63,023 66,728
Subtotal . . . . . . . . . . . . . . . . . . . . . . . . . . . . . . . . . . . . . . . . . . . . 153,269 156,984 154,848 159,867
Mortgage-backed and asset-backed securities . . . . . . . . . . . . . . . . . . . . 85,492 85,258 81,920 82,061
Total fixed maturity securities . . . . . . . . . . . . . . . . . . . . . . . . . . . . . . $238,761 $242,242 $236,768 $241,928
Fixed maturity securities not due at a single maturity date have been included in the above table in the year of final contractual maturity.
Actual maturities may differ from contractual maturities due to the exercise of prepayment options.
Sales or disposals of fixed maturity and equity securities classified as available-for-sale are as follows:
2007 2006 2005
Years Ended December 31,
(In millions)
Proceeds. . . . . . . . . . . . . . . . . . . . . . . . . . . . . . . . . . . . . . . . . . . . . . . . . . . . . . . $80,685 $89,869 $127,709
Gross investment gains . . . . . . . . . . . . . . . . . . . . . . . . . . . . . . . . . . . . . . . . . . . . . $ 831 $ 580 $ 704
Gross investment losses . . . . . . . . . . . . . . . . . . . . . . . . . . . . . . . . . . . . . . . . . . . . . $ (1,183) $ (1,533) $ (1,391)
Unrealized Loss for Fixed Maturity and Equity Securities Available-for-Sale
The following tables present the estimated fair value and gross unrealized loss of the Company’s fixed maturity (aggregated by sector)
and equity securities in an unrealized loss position, aggregated by length of time that the securities have been in a continuous unrealized
loss position at:
Estimated
Fair
Value
Gross
Unrealized
Loss
Estimated
Fair
Value
Gross
Unrealized
Loss
Estimated
Fair
Value
Gross
Unrealized
Loss
Less than 12 months
Equal to or Greater than
12 months Total
December 31, 2007
(In millions, except number of securities)
U.S. corporate securities . . . . . . . . . . . . . . . . . . . . . . . . . $29,237 $1,431 $12,119 $ 743 $ 41,356 $2,174
Residential mortgage-backed securities . . . . . . . . . . . . . . . . 14,404 279 6,195 110 20,599 389
Foreign corporate securities . . . . . . . . . . . . . . . . . . . . . . . 11,189 484 6,321 310 17,510 794
U.S. Treasury/agency securities . . . . . . . . . . . . . . . . . . . . . 432 3 625 10 1,057 13
Commercial mortgage-backed securities . . . . . . . . . . . . . . . 2,518 102 3,797 97 6,315 199
Foreign government securities . . . . . . . . . . . . . . . . . . . . . . 3,593 161 515 27 4,108 188
Asset-backed securities . . . . . . . . . . . . . . . . . . . . . . . . . . 7,627 442 1,271 107 8,898 549
State and political subdivision securities . . . . . . . . . . . . . . . 1,334 81 476 34 1,810 115
Other fixed maturity securities . . . . . . . . . . . . . . . . . . . . . . 91 30 1 — 92 30
Total fixed maturity securities . . . . . . . . . . . . . . . . . . . . . $70,425 $3,013 $31,320 $1,438 $101,745 $4,451
Equity securities . . . . . . . . . . . . . . . . . . . . . . . . . . . . . . . $ 2,771 $ 398 $ 543 $ 72 $ 3,314 $ 470
Total number of securities in an unrealized loss position . . . . . 8,395 3,063
F-26 MetLife, Inc.
MetLife, Inc.
Notes to Consolidated Financial Statements — (Continued)
Estimated
Fair
Value
Gross
Unrealized
Loss
Estimated
Fair
Value
Gross
Unrealized
Loss
Estimated
Fair
Value
Gross
Unrealized
Loss
Less than 12 months
Equal to or Greater than
12 months Total
December 31, 2006
(In millions, except number of securities)
U.S. corporate securities . . . . . . . . . . . . . . . . . . . . . . . . . $17,537 $285 $16,780 $ 698 $ 34,317 $ 983
Residential mortgage-backed securities . . . . . . . . . . . . . . . . 15,300 78 13,640 243 28,940 321
Foreign corporate securities . . . . . . . . . . . . . . . . . . . . . . . 6,401 102 7,277 276 13,678 378
U.S. Treasury/agency securities . . . . . . . . . . . . . . . . . . . . . 15,006 157 1,560 91 16,566 248
Commercial mortgage-backed securities . . . . . . . . . . . . . . . 4,960 30 4,029 108 8,989 138
Foreign government securities . . . . . . . . . . . . . . . . . . . . . . 1,160 18 507 16 1,667 34
Asset-backed securities . . . . . . . . . . . . . . . . . . . . . . . . . . 4,519 31 1,077 22 5,596 53
State and political subdivision securities . . . . . . . . . . . . . . . 334 12 532 39 866 51
Other fixed maturity securities . . . . . . . . . . . . . . . . . . . . . . 146 77 4 — 150 77
Total fixed maturity securities . . . . . . . . . . . . . . . . . . . . . $65,363 $790 $45,406 $1,493 $110,769 $2,283
Equity securities . . . . . . . . . . . . . . . . . . . . . . . . . . . . . . . $ 832 $ 20 $ 567 $ 25 $ 1,399 $ 45
Total number of securities in an unrealized loss position . . . . . 10,529 4,640
Aging of Gross Unrealized Loss for Fixed Maturity and Equity Securities Available-for-Sale
The following tables present the cost or amortized cost, gross unrealized loss and number of securities for fixed maturity and equity
securities, where the estimated fair value had declined and remained below cost or amortized cost by less than 20%, or 20% or more at:
Less than
20%
20% or
more
Less than
20%
20% or
more
Less than
20%
20% or
more
Cost or Amortized
Cost
Gross Unrealized
Loss
Number of
Securities
December 31, 2007
(In millions, except number of securities)
Less than six months . . . . . . . . . . . . . . . . . . . . . . . . . . . . $ 49,463 $1,943 $1,670 $555 6,339 644
Six months or greater but less than nine months . . . . . . . . . . 17,353 23 844 7 1,461 31
Nine months or greater but less than twelve months . . . . . . . . 9,410 7 568 2 791 1
Twelve months or greater. . . . . . . . . . . . . . . . . . . . . . . . . . 31,731 50 1,262 13 3,192 32
Total . . . . . . . . . . . . . . . . . . . . . . . . . . . . . . . . . . . . . $107,957 $2,023 $4,344 $577
Less than
20%
20% or
more
Less than
20%
20% or
more
Less than
20%
20% or
more
Cost or Amortized
Cost
Gross Unrealized
Loss
Number of
Securities
December 31, 2006
(In millions, except number of securities)
Less than six months . . . . . . . . . . . . . . . . . . . . . . . . . . . . . $ 52,222 $35 $ 547 $12 9,093 81
Six months or greater but less than nine months . . . . . . . . . . . 2,682 3 42 1 415 2
Nine months or greater but less than twelve months . . . . . . . . . 12,049 14 204 4 937 1
Twelve months or greater . . . . . . . . . . . . . . . . . . . . . . . . . . 47,462 29 1,511 7 4,634 6
Total . . . . . . . . . . . . . . . . . . . . . . . . . . . . . . . . . . . . . . $114,415 $81 $2,304 $24
At December 31, 2007 and 2006, $4.3 billion and $2.3 billion, respectively, of unrealized losses related to securities with an unrealized
loss position of less than 20% of cost or amortized cost, which represented 4% and 2%, respectively, of the cost or amortized cost of such
securities.
At December 31, 2007, $577 million of unrealized losses related to securities with an unrealized loss position of 20% or more of cost or
amortized cost, which represented 29% of the cost or amortized cost of such securities. Of such unrealized losses of $577 million,
$555 million related to securities that were in an unrealized loss position for a period of less than six months. At December 31, 2006,
$24 million of unrealized losses related to securities with an unrealized loss position of 20% or more of cost or amortized cost, which
represented 30% of the cost or amortized cost of such securities. Of such unrealized losses of $24 million, $12 million related to securities
that were in an unrealized loss position for a period of less than six months.
The Company held 30 fixed maturity and equity securities, each with a gross unrealized loss at December 31, 2007 of greater than
$10 million. These securities represented 9%, or $459 million in the aggregate, of the gross unrealized loss on fixed maturity and equity
securities. The Company held eight fixed maturity and equity securities, each with a gross unrealized loss at December 31, 2006 of greater
than $10 million. These securities represented 7%, or $169 million in the aggregate, of the gross unrealized loss on fixed maturity and
equity securities.
F-27MetLife, Inc.
MetLife, Inc.
Notes to Consolidated Financial Statements — (Continued)
At December 31, 2007 and 2006, the Company had $4.9 billion and $2.3 billion, respectively, of gross unrealized losses related to its
fixed maturity and equity securities. These securities are concentrated, calculated as a percentage of gross unrealized loss, as follows:
2007 2006
December 31,
Sector:
U.S. corporate securities . . . . . . . . . . . . . . . . . . . . . . . . . . . . . . . . . . . . . . . . . . . . . . . . . . . . . . . . . . 44% 42%
Foreign corporate securities . . . . . . . . . . . . . . . . . . . . . . . . . . . . . . . . . . . . . . . . . . . . . . . . . . . . . . . . 16 16
Asset-backed securities . . . . . . . . . . . . . . . . . . . . . . . . . . . . . . . . . . . . . . . . . . . . . . . . . . . . . . . . . . 11 2
Residential mortgage-backed securities . . . . . . . . . . . . . . . . . . . . . . . . . . . . . . . . . . . . . . . . . . . . . . . . 8 14
Foreign government securities. . . . . . . . . . . . . . . . . . . . . . . . . . . . . . . . . . . . . . . . . . . . . . . . . . . . . . . 4 1
Commercial mortgage-backed securities . . . . . . . . . . . . . . . . . . . . . . . . . . . . . . . . . . . . . . . . . . . . . . . . 4 6
U.S. Treasury/agency securities . . . . . . . . . . . . . . . . . . . . . . . . . . . . . . . . . . . . . . . . . . . . . . . . . . . . . — 11
Other . . . . . . . . . . . . . . . . . . . . . . . . . . . . . . . . . . . . . . . . . . . . . . . . . . . . . . . . . . . . . . . . . . . . . . . 13 8
Total . . . . . . . . . . . . . . . . . . . . . . . . . . . . . . . . . . . . . . . . . . . . . . . . . . . . . . . . . . . . . . . . . . . . . . 100% 100%
Industry:
Finance . . . . . . . . . . . . . . . . . . . . . . . . . . . . . . . . . . . . . . . . . . . . . . . . . . . . . . . . . . . . . . . . . . . . . 34% 10%
Industrial . . . . . . . . . . . . . . . . . . . . . . . . . . . . . . . . . . . . . . . . . . . . . . . . . . . . . . . . . . . . . . . . . . . . 18 23
Mortgage-backed . . . . . . . . . . . . . . . . . . . . . . . . . . . . . . . . . . . . . . . . . . . . . . . . . . . . . . . . . . . . . . . 12 20
Utility . . . . . . . . . . . . . . . . . . . . . . . . . . . . . . . . . . . . . . . . . . . . . . . . . . . . . . . . . . . . . . . . . . . . . . . 8 11
Government . . . . . . . . . . . . . . . . . . . . . . . . . . . . . . . . . . . . . . . . . . . . . . . . . . . . . . . . . . . . . . . . . . 4 12
Other . . . . . . . . . . . . . . . . . . . . . . . . . . . . . . . . . . . . . . . . . . . . . . . . . . . . . . . . . . . . . . . . . . . . . . . 24 24
Total . . . . . . . . . . . . . . . . . . . . . . . . . . . . . . . . . . . . . . . . . . . . . . . . . . . . . . . . . . . . . . . . . . . . . . 100% 100%
As described more fully in Note 1, the Company performs a regular evaluation, on a security-by-security basis, of its investment
holdings in accordance with its impairment policy in order to evaluate whether such securities are other-than-temporarily impaired. One of
the criteria which the Company considers in its other-than-temporary impairment analysis is its intent and ability to hold securities for a
period of time sufficient to allow for the recovery of their value to an amount equal to or greater than cost or amortized cost. The Company’s
intent and ability to hold securities considers broad portfolio management objectives such as asset/liability duration management, issuer
and industry segment exposures, interest rate views and the overall total return focus. In following these portfolio management objectives,
changes in facts and circumstances that were present in past reporting periods may trigger a decision to sell securities that were held in
prior reporting periods. Decisions to sell are based on current conditions or the Company’s need to shift the portfolio to maintain its
portfolio management objectives including liquidity needs or duration targets on asset/liability managed portfolios. The Company attempts
to anticipate these types of changes and if a sale decision has been made on an impaired security and that security is not expected to
recover prior to the expected time of sale, the security will be deemed other-than-temporarily impaired in the period that the sale decision
was made and an other-than-temporary impairment loss will be recognized.
Based upon the Company’s current evaluation of the securities in accordance with its impairment policy, the cause of the decline being
principally attributable to the general rise in interest rates during the holding period, and the Company’s current intent and ability to hold the
fixed maturity and equity securities with unrealized losses for a period of time sufficient for them to recover, the Company has concluded
that the aforementioned securities are not other-than-temporarily impaired.
Securities Lending
The Company participates in a securities lending program whereby blocks of securities, which are included in fixed maturity and equity
securities, are loaned to third parties, primarily major brokerage firms. The Company requires a minimum of 102% of the fair value of the
loaned securities to be separately maintained as collateral for the loans. Securities with a cost or amortized cost of $41.1 billion and
$43.3 billion and an estimated fair value of $42.1 billion and $44.1 billion were on loan under the program at December 31, 2007 and 2006,
respectively. Securities loaned under such transactions may be sold or repledged by the transferee. The Company was liable for cash
collateral under its control of $43.3 billion and $45.4 billion at December 31, 2007 and 2006, respectively. Security collateral of $40 million
and $100 million on deposit from customers in connection with the securities lending transactions at December 31, 2007 and 2006,
respectively, may not be sold or repledged and is not reflected in the consolidated financial statements.
Assets on Deposit and Held in Trust and Assets Pledged as Collateral
The Company had investment assets on deposit with regulatory agencies with a fair market value of $1.8 billion and $1.3 billion at
December 31, 2007 and 2006, respectively, consisting primarily of fixed maturity and equity securities. Company securities held in trust to
satisfy collateral requirements had a cost or amortized cost of $7.1 billion and $3.0 billion at December 31, 2007 and 2006, respectively,
consisting primarily of fixed maturity and equity securities.
Certain of the Company’s fixed maturity securities are pledged as collateral for various derivative transactions as described in Note 4.
Additionally, the Company has pledged certain of its fixed maturity securities in support of its debt and funding agreements as described in
Notes 10 and 7, respectively.
F-28 MetLife, Inc.
MetLife, Inc.
Notes to Consolidated Financial Statements — (Continued)
Mortgage and Consumer Loans
Mortgage and consumer loans are categorized as follows:
Amount Percent Amount Percent
2007 2006
December 31,
(In millions)
Commercial mortgage loans . . . . . . . . . . . . . . . . . . . . . . . . . . . . . . . . . . . . . . $35,669 76% $32,000 75%
Agricultural mortgage loans . . . . . . . . . . . . . . . . . . . . . . . . . . . . . . . . . . . . . . 10,508 22 9,231 22
Consumer loans. . . . . . . . . . . . . . . . . . . . . . . . . . . . . . . . . . . . . . . . . . . . . . 1,051 2 1,190 3
Total . . . . . . . . . . . . . . . . . . . . . . . . . . . . . . . . . . . . . . . . . . . . . . . . . . . . 47,228 100% 42,421 100%
Less: Valuation allowances . . . . . . . . . . . . . . . . . . . . . . . . . . . . . . . . . . . . . . . 198 182
Total mortgage and consumer loans . . . . . . . . . . . . . . . . . . . . . . . . . . . . . . . $47,030 $42,239
Mortgage loans are collateralized by properties primarily located in the United States. At December 31, 2007, 21%, 7% and 7% of the
value of the Company’s mortgage and consumer loans were located in California, Florida and Texas, respectively. Generally, the Company,
as the lender, only loans up to 75% of the purchase price of the underlying real estate.
Certain of the Company’s real estate joint ventures have mortgage loans with the Company. The carrying values of such mortgages
were $373 million and $372 million at December 31, 2007 and 2006, respectively.
Information regarding loan valuation allowances for mortgage and consumer loans is as follows:
2007 2006 2005
Years Ended
December 31,
(In millions)
Balance at January 1, . . . . . . . . . . . . . . . . . . . . . . . . . . . . . . . . . . . . . . . . . . . . . . . . . . . . . . $182 $172 $157
Additions . . . . . . . . . . . . . . . . . . . . . . . . . . . . . . . . . . . . . . . . . . . . . . . . . . . . . . . . . . . . . . 77 36 64
Deductions . . . . . . . . . . . . . . . . . . . . . . . . . . . . . . . . . . . . . . . . . . . . . . . . . . . . . . . . . . . . . (61) (26) (49)
Balance at December 31, . . . . . . . . . . . . . . . . . . . . . . . . . . . . . . . . . . . . . . . . . . . . . . . . . . . $198 $182 $172
A portion of the Company’s mortgage and consumer loans was impaired and consisted of the following:
2007 2006
December 31,
(In millions)
Impaired loans with valuation allowances . . . . . . . . . . . . . . . . . . . . . . . . . . . . . . . . . . . . . . . . . . . . . . . $624 $374
Impaired loans without valuation allowances . . . . . . . . . . . . . . . . . . . . . . . . . . . . . . . . . . . . . . . . . . . . . 44 75
Subtotal . . . . . . . . . . . . . . . . . . . . . . . . . . . . . . . . . . . . . . . . . . . . . . . . . . . . . . . . . . . . . . . . . . . . 668 449
Less: Valuation allowances on impaired loans . . . . . . . . . . . . . . . . . . . . . . . . . . . . . . . . . . . . . . . . . . . . 73 21
Impaired loans . . . . . . . . . . . . . . . . . . . . . . . . . . . . . . . . . . . . . . . . . . . . . . . . . . . . . . . . . . . . . . . . $595 $428
The average investment on impaired loans was $453 million, $202 million and $187 million for the years ended December 31, 2007,
2006 and 2005, respectively. Interest income on impaired loans was $38 million, $2 million and $12 million for the years ended
December 31, 2007, 2006 and 2005, respectively.
The investment in restructured loans was $2 million and $9 million at December 31, 2007 and 2006, respectively. Interest income of
less than $1 million, $1 million and $2 million was recognized on restructured loans for the years ended December 31, 2007, 2006 and
2005, respectively. Gross interest income that would have been recorded in accordance with the original terms of such loans amounted to
less than $1 million, $1 million and $3 million for the years ended December 31, 2007, 2006 and 2005, respectively.
Mortgage and consumer loans with scheduled payments of 90 days or more past due on which interest is still accruing, had an
amortized cost of $4 million and $15 million at December 31, 2007 and 2006, respectively. Mortgage and consumer loans on which
interest is no longer accrued had an amortized cost of $28 million and $36 million at December 31, 2007 and 2006, respectively. Mortgage
and consumer loans in foreclosure had an amortized cost of $12 million and $35 million at December 31, 2007 and 2006, respectively.
F-29MetLife, Inc.
MetLife, Inc.
Notes to Consolidated Financial Statements — (Continued)
Real Estate Holdings
Real estate holdings consisted of the following:
2007 2006
December 31,
(In millions)
Real estate . . . . . . . . . . . . . . . . . . . . . . . . . . . . . . . . . . . . . . . . . . . . . . . . . . . . . . . . . . . . . . . $ 4,914 $ 4,326
Accumulated depreciation . . . . . . . . . . . . . . . . . . . . . . . . . . . . . . . . . . . . . . . . . . . . . . . . . . . . . (1,088) (1,001)
Net real estate. . . . . . . . . . . . . . . . . . . . . . . . . . . . . . . . . . . . . . . . . . . . . . . . . . . . . . . . . . . . . 3,826 3,325
Real estate joint ventures. . . . . . . . . . . . . . . . . . . . . . . . . . . . . . . . . . . . . . . . . . . . . . . . . . . . . . 2,771 1,477
Real estate and real estate joint ventures . . . . . . . . . . . . . . . . . . . . . . . . . . . . . . . . . . . . . . . . . . 6,597 4,802
Real estate held-for-sale . . . . . . . . . . . . . . . . . . . . . . . . . . . . . . . . . . . . . . . . . . . . . . . . . . . . . . 172 184
Total real estate holdings . . . . . . . . . . . . . . . . . . . . . . . . . . . . . . . . . . . . . . . . . . . . . . . . . . . . $ 6,769 $ 4,986
Related depreciation expense on real estate was $130 million, $131 million and $135 million for the years ended December 31, 2007,
2006 and 2005, respectively. These amounts include $13 million, $37 million and $62 million of depreciation expense related to
discontinued operations for the years ended December 31, 2007, 2006 and 2005, respectively.
There were no impairments recognized on real estate held-for-sale for the year ended December 31, 2007. Impairment losses
recognized on real estate held-for-sale were $8 million and $5 million for the years ended December 31, 2006 and 2005, respectively. The
carrying value of non-income producing real estate was $12 million and $8 million at December 31, 2007 and 2006, respectively. The
Company owned real estate acquired in satisfaction of debt of $3 million at both December 31, 2007 and 2006.
Real estate holdings were categorized as follows:
Amount Percent Amount Percent
2007 2006
December 31,
(In millions)
Office . . . . . . . . . . . . . . . . . . . . . . . . . . . . . . . . . . . . . . . . . . . . . . . . . . . . . . $3,126 46% $2,709 55%
Apartments . . . . . . . . . . . . . . . . . . . . . . . . . . . . . . . . . . . . . . . . . . . . . . . . . . 1,264 19 739 15
Development joint ventures . . . . . . . . . . . . . . . . . . . . . . . . . . . . . . . . . . . . . . . . 743 11 169 3
Retail . . . . . . . . . . . . . . . . . . . . . . . . . . . . . . . . . . . . . . . . . . . . . . . . . . . . . . 574 8 513 10
Real estate investment funds . . . . . . . . . . . . . . . . . . . . . . . . . . . . . . . . . . . . . . . 516 8 401 8
Industrial . . . . . . . . . . . . . . . . . . . . . . . . . . . . . . . . . . . . . . . . . . . . . . . . . . . . 283 4 291 6
Land . . . . . . . . . . . . . . . . . . . . . . . . . . . . . . . . . . . . . . . . . . . . . . . . . . . . . . . 174 3 71 1
Agriculture . . . . . . . . . . . . . . . . . . . . . . . . . . . . . . . . . . . . . . . . . . . . . . . . . . . 29 — 32 1
Other . . . . . . . . . . . . . . . . . . . . . . . . . . . . . . . . . . . . . . . . . . . . . . . . . . . . . . 60 1 61 1
Total real estate holdings . . . . . . . . . . . . . . . . . . . . . . . . . . . . . . . . . . . . . . . . $6,769 100% $4,986 100%
The Company’s real estate holdings are primarily located in the United States. At December 31, 2007, 22%, 11%, 10% and 9% of the
Company’s real estate holdings were located in California, New York, Florida and Texas, respectively.
Leveraged Leases
Investment in leveraged leases, included in other invested assets, consisted of the following:
2007 2006
December 31,
(In millions)
Rental receivables, net . . . . . . . . . . . . . . . . . . . . . . . . . . . . . . . . . . . . . . . . . . . . . . . . . . . . . . . . $ 1,491 $1,055
Estimated residual values . . . . . . . . . . . . . . . . . . . . . . . . . . . . . . . . . . . . . . . . . . . . . . . . . . . . . . 1,881 887
Subtotal . . . . . . . . . . . . . . . . . . . . . . . . . . . . . . . . . . . . . . . . . . . . . . . . . . . . . . . . . . . . . . . . 3,372 1,942
Unearned income . . . . . . . . . . . . . . . . . . . . . . . . . . . . . . . . . . . . . . . . . . . . . . . . . . . . . . . . . . . (1,313) (694)
Investment in leveraged leases . . . . . . . . . . . . . . . . . . . . . . . . . . . . . . . . . . . . . . . . . . . . . . . . . $ 2,059 $1,248
The Company’s deferred income tax liability related to leveraged leases was $1.0 billion and $670 million at December 31, 2007 and
2006, respectively. The rental receivables set forth above are generally due in periodic installments. The payment periods range from one
to 15 years, but in certain circumstances are as long as 30 years.
The components of net income from investment in leveraged leases are as follows:
2007 2006 2005
Years Ended
December 31,
(In millions)
Income from investment in leveraged leases (included in net investment income) . . . . . . . . . . . . . . . . . $ 67 $ 51 $ 54
Less: Income tax expense on leveraged leases . . . . . . . . . . . . . . . . . . . . . . . . . . . . . . . . . . . . . . . (24) (18) (19)
Net income from investment in leveraged leases . . . . . . . . . . . . . . . . . . . . . . . . . . . . . . . . . . . . . . $ 43 $ 33 $ 35
F-30 MetLife, Inc.
MetLife, Inc.
Notes to Consolidated Financial Statements — (Continued)
Other Limited Partnership Interests
The carrying value of other limited partnership interests (which primarily represent ownership interests in pooled investment funds that
make private equity investments in companies in the United States and overseas) was $6.2 billion and $4.8 billion at December 31, 2007
and 2006, respectively. Included within other limited partnership interests at December 31, 2007 and 2006 are $1.6 billion and $1.2 billion,
respectively, of hedge funds. For the years ended December 31, 2007, 2006 and 2005, net investment income from other limited
partnership interests included $89 million, $98 million and $24 million respectively, related to hedge funds.
Funds Withheld at Interest
Funds withheld at interest, included in other invested assets, were $4.5 billion and $4.0 billion at December 31, 2007 and 2006,
respectively.
Net Investment Income
The components of net investment income are as follows:
2007 2006 2005
Years Ended December 31,
(In millions)
Fixed maturity securities . . . . . . . . . . . . . . . . . . . . . . . . . . . . . . . . . . . . . . . . . . . . . . $15,150 $14,049 $11,349
Equity securities . . . . . . . . . . . . . . . . . . . . . . . . . . . . . . . . . . . . . . . . . . . . . . . . . . . 279 122 79
Mortgage and consumer loans . . . . . . . . . . . . . . . . . . . . . . . . . . . . . . . . . . . . . . . . . . 2,863 2,534 2,302
Policy loans . . . . . . . . . . . . . . . . . . . . . . . . . . . . . . . . . . . . . . . . . . . . . . . . . . . . . . 637 603 572
Real estate and real estate joint ventures . . . . . . . . . . . . . . . . . . . . . . . . . . . . . . . . . . . 913 746 510
Other limited partnership interests . . . . . . . . . . . . . . . . . . . . . . . . . . . . . . . . . . . . . . . 1,309 945 709
Cash, cash equivalents and short-term investments . . . . . . . . . . . . . . . . . . . . . . . . . . . . 503 519 400
Other . . . . . . . . . . . . . . . . . . . . . . . . . . . . . . . . . . . . . . . . . . . . . . . . . . . . . . . . . . 631 530 472
Total investment income . . . . . . . . . . . . . . . . . . . . . . . . . . . . . . . . . . . . . . . . . . . . 22,285 20,048 16,393
Less: Investment expenses . . . . . . . . . . . . . . . . . . . . . . . . . . . . . . . . . . . . . . . . . . . . 3,279 2,966 1,637
Net investment income . . . . . . . . . . . . . . . . . . . . . . . . . . . . . . . . . . . . . . . . . . . . . $19,006 $17,082 $14,756
Net Investment Gains (Losses)
The components of net investment gains (losses) are as follows:
2007 2006 2005
Years Ended December 31,
(In millions)
Fixed maturity securities . . . . . . . . . . . . . . . . . . . . . . . . . . . . . . . . . . . . . . . . . . . . . . . . . . $(622) $(1,119) $(868)
Equity securities . . . . . . . . . . . . . . . . . . . . . . . . . . . . . . . . . . . . . . . . . . . . . . . . . . . . . . . 164 84 117
Mortgage and consumer loans . . . . . . . . . . . . . . . . . . . . . . . . . . . . . . . . . . . . . . . . . . . . . . 2 (8) 17
Real estate and real estate joint ventures . . . . . . . . . . . . . . . . . . . . . . . . . . . . . . . . . . . . . . . 44 102 14
Other limited partnership interests . . . . . . . . . . . . . . . . . . . . . . . . . . . . . . . . . . . . . . . . . . . 16 1 42
Sales of businesses . . . . . . . . . . . . . . . . . . . . . . . . . . . . . . . . . . . . . . . . . . . . . . . . . . . . — — 8
Derivatives. . . . . . . . . . . . . . . . . . . . . . . . . . . . . . . . . . . . . . . . . . . . . . . . . . . . . . . . . . . (414) (201) 391
Other . . . . . . . . . . . . . . . . . . . . . . . . . . . . . . . . . . . . . . . . . . . . . . . . . . . . . . . . . . . . . . 72 (241) 193
Net investment gains (losses) . . . . . . . . . . . . . . . . . . . . . . . . . . . . . . . . . . . . . . . . . . . . . $(738) $(1,382) $ (86)
The Company periodically disposes of fixed maturity and equity securities at a loss. Generally, such losses are insignificant in amount or
in relation to the cost basis of the investment, are attributable to declines in fair value occurring in the period of the disposition or are as a
result of management’s decision to sell securities based on current conditions or the Company’s need to shift the portfolio to maintain its
portfolio management objectives.
Losses from fixed maturity and equity securities deemed other-than-temporarily impaired, included within net investment gains (losses),
were $106 million, $82 million and $64 million for the years ended December 31, 2007, 2006 and 2005, respectively.
F-31MetLife, Inc.
MetLife, Inc.
Notes to Consolidated Financial Statements — (Continued)
Net Unrealized Investment Gains (Losses)
The components of net unrealized investment gains (losses), included in accumulated other comprehensive income, are as follows:
2007 2006 2005
Years Ended December 31,
(In millions)
Fixed maturity securities . . . . . . . . . . . . . . . . . . . . . . . . . . . . . . . . . . . . . . . . . . . . . . . $ 3,378 $ 5,075 $ 6,132
Equity securities . . . . . . . . . . . . . . . . . . . . . . . . . . . . . . . . . . . . . . . . . . . . . . . . . . . . 157 541 247
Derivatives . . . . . . . . . . . . . . . . . . . . . . . . . . . . . . . . . . . . . . . . . . . . . . . . . . . . . . . . (270) (208) (142)
Minority interest . . . . . . . . . . . . . . . . . . . . . . . . . . . . . . . . . . . . . . . . . . . . . . . . . . . . . (150) (159) (171)
Other . . . . . . . . . . . . . . . . . . . . . . . . . . . . . . . . . . . . . . . . . . . . . . . . . . . . . . . . . . . 3 9 (102)
Subtotal . . . . . . . . . . . . . . . . . . . . . . . . . . . . . . . . . . . . . . . . . . . . . . . . . . . . . . . . 3,118 5,258 5,964
Amounts allocated from:
Insurance liability loss recognition . . . . . . . . . . . . . . . . . . . . . . . . . . . . . . . . . . . . . . . . (608) (1,149) (1,410)
DAC and VOBA . . . . . . . . . . . . . . . . . . . . . . . . . . . . . . . . . . . . . . . . . . . . . . . . . . . (327) (189) (79)
Policyholder dividend obligation . . . . . . . . . . . . . . . . . . . . . . . . . . . . . . . . . . . . . . . . . (789) (1,062) (1,492)
Subtotal . . . . . . . . . . . . . . . . . . . . . . . . . . . . . . . . . . . . . . . . . . . . . . . . . . . . . . . (1,724) (2,400) (2,981)
Deferred income tax . . . . . . . . . . . . . . . . . . . . . . . . . . . . . . . . . . . . . . . . . . . . . . . . . . (423) (994) (1,041)
Subtotal . . . . . . . . . . . . . . . . . . . . . . . . . . . . . . . . . . . . . . . . . . . . . . . . . . . . . . . . (2,147) (3,394) (4,022)
Net unrealized investment gains (losses) . . . . . . . . . . . . . . . . . . . . . . . . . . . . . . . . . . . . . $ 971 $ 1,864 $ 1,942
The changes in net unrealized investment gains (losses) are as follows:
2007 2006 2005
Years Ended December 31,
(In millions)
Balance, January 1, . . . . . . . . . . . . . . . . . . . . . . . . . . . . . . . . . . . . . . . . . . . . . . . . . . $ 1,864 $1,942 $ 2,994
Unrealized investment gains (losses) during the year . . . . . . . . . . . . . . . . . . . . . . . . . . . . . (2,140) (706) (3,372)
Unrealized investment gains of subsidiaries at the date of sale . . . . . . . . . . . . . . . . . . . . . . . — — 15
Unrealized investment gains (losses) relating to:
Insurance liability gain (loss) recognition . . . . . . . . . . . . . . . . . . . . . . . . . . . . . . . . . . . . 541 261 581
DAC and VOBA . . . . . . . . . . . . . . . . . . . . . . . . . . . . . . . . . . . . . . . . . . . . . . . . . . . . (138) (110) 462
Policyholder dividend obligation . . . . . . . . . . . . . . . . . . . . . . . . . . . . . . . . . . . . . . . . . 273 430 627
Deferred income tax . . . . . . . . . . . . . . . . . . . . . . . . . . . . . . . . . . . . . . . . . . . . . . . . . 571 47 635
Balance, December 31, . . . . . . . . . . . . . . . . . . . . . . . . . . . . . . . . . . . . . . . . . . . . . . . . $ 971 $1,864 $ 1,942
Net change in unrealized investment gains (losses) . . . . . . . . . . . . . . . . . . . . . . . . . . . . . . $ (893) $ (78) $(1,052)
Trading Securities
The Company has a trading securities portfolio to support investment strategies that involve the active and frequent purchase and sale
of securities, the execution of short sale agreements and asset and liability matching strategies for certain insurance products. Trading
securities and short sale agreement liabilities are recorded at fair value with subsequent changes in fair value recognized in net investment
income related to fixed maturity securities.
At December 31, 2007 and 2006, trading securities were $779 million and $759 million, respectively, and liabilities associated with the
short sale agreements in the trading securities portfolio, which were included in other liabilities, were $107 million and $387 million,
respectively. The Company had pledged $407 million and $614 million of its assets, primarily consisting of trading securities, as collateral
to secure the liabilities associated with the short sale agreements in the trading securities portfolio at December 31, 2007 and 2006,
respectively.
During the years ended December 31, 2007, 2006 and 2005, interest and dividends earned on trading securities in addition to the net
realized and unrealized gains (losses) recognized on the trading securities and the related short sale agreement liabilities included within
net investment income totaled $50 million, $71 million and $14 million, respectively. Included within unrealized gains (losses) on such
trading securities and short sale agreement liabilities, are changes in fair value of ($4) million, $26 million and less than $1 million for the
years ended December 31, 2007, 2006 and 2005, respectively.
As part of the acquisition of Travelers on July 1, 2005, the Company acquired Travelers’ investment in Tribeca Citigroup Investments
Ltd. (“Tribeca”). Tribeca was a feeder fund investment structure whereby the feeder fund invests substantially all of its assets in the master
fund, Tribeca Global Convertible Instruments Ltd. The primary investment objective of the master fund is to achieve enhanced risk-adjusted
return by investing in domestic and foreign equities and equity-related securities utilizing such strategies as convertible securities arbitrage.
At December 31, 2005, MetLife was the majority owner of the feeder fund and consolidated the fund within its consolidated financial
statements. Net investment income related to the trading activities of Tribeca, which included interest and dividends earned on trading
securities in addition to the net realized and unrealized gains (losses), was $12 million and $6 million for the six months ended June 30,
2006 and the year ended December 31, 2005, respectively.
F-32 MetLife, Inc.
MetLife, Inc.
Notes to Consolidated Financial Statements — (Continued)
During the second quarter of 2006, MetLife’s ownership interests in Tribeca declined to a position whereby Tribeca is no longer
consolidated and, as of June 30, 2006, was accounted for under the equity method of accounting. The equity method investment at
December 31, 2006 of $82 million was included in other limited partnership interests. Net investment income related to the Company’s
equity method investment in Tribeca was $9 million for the six months ended December 31, 2006.
Variable Interest Entities
The following table presents the total assets of and maximum exposure to loss relating to VIEs for which the Company has concluded
that: (i) it is the primary beneficiary and which are consolidated in the Company’s consolidated financial statements at December 31, 2007;
and (ii) it holds significant variable interests but it is not the primary beneficiary and which have not been consolidated:
Total
Assets(1)
Maximum
Exposure to
Loss(2)
Total
Assets(1)
Maximum
Exposure to
Loss(2)
Primary Beneficiary Not Primary Beneficiary
December 31, 2007
(In millions)
Asset-backed securitizations and collateralized debt obligations . . . . . . . . . . $1,167 $1,167 $ 1,591 $ 184
Real estate joint ventures(3) . . . . . . . . . . . . . . . . . . . . . . . . . . . . . . . . . 48 26 276 42
Other limited partnership interests(4) . . . . . . . . . . . . . . . . . . . . . . . . . . . . 2 1 42,141 2,080
Trust preferred securities(5) . . . . . . . . . . . . . . . . . . . . . . . . . . . . . . . . . . 105 105 48,232 3,369
Other investments(6) . . . . . . . . . . . . . . . . . . . . . . . . . . . . . . . . . . . . . . 1,119 1,119 3,258 260
Total . . . . . . . . . . . . . . . . . . . . . . . . . . . . . . . . . . . . . . . . . . . . . . . $2,441 $2,418 $95,498 $5,935
(1) The assets of the asset-backed securitizations and collateralized debt obligations are reflected at fair value. The assets of the real estate
joint ventures, other limited partnership interests, trust preferred securities and other investments are reflected at the carrying amounts at
which such assets would have been reflected on the Company’s consolidated balance sheet had the Company consolidated the VIE from
the date of its initial investment in the entity.
(2) The maximum exposure to loss relating to the asset-backed securitizations and collateralized debt obligations is equal to the carrying
amounts of retained interests. In addition, the Company provides collateral management services for certain of these structures for which
it collects a management fee. The maximum exposure to loss relating to real estate joint ventures, other limited partnership interests, trust
preferred securities and other investments is equal to the carrying amounts plus any unfunded commitments, reduced by amounts
guaranteed by other partners. Such a maximum loss would be expected to occur only upon bankruptcy of the issuer or investee.
(3) Real estate joint ventures include partnerships and other ventures which engage in the acquisition, development, management and
disposal of real estate investments.
(4) Other limited partnership interests include partnerships established for the purpose of investing in public and private debt and equity
securities.
(5) Trust preferred securities are complex, uniquely structured investments which contain features of both equity and debt, may have an
extended or no stated maturity, and may be callable at the issuer’s option after a defined period of time.
(6) Other investments include securities that are not trust preferred securities, asset-backed securitizations or collateralized debt obligations
and the assets supporting the financing arrangement described in Note 11.
4. Derivative Financial Instruments
Types of Derivative Financial Instruments
The following table presents the notional amount and current market or fair value of derivative financial instruments held at:
Notional
Amount Assets Liabilities
Notional
Amount Assets Liabilities
Current Market
or Fair Value
Current Market
or Fair Value
December 31, 2007 December 31, 2006
(In millions)
Interest rate swaps . . . . . . . . . . . . . . . . . . . . . . . . . . $ 62,519 $ 785 $ 768 $ 27,148 $ 639 $ 150
Interest rate floors . . . . . . . . . . . . . . . . . . . . . . . . . . . 48,937 621 — 37,437 279 —
Interest rate caps . . . . . . . . . . . . . . . . . . . . . . . . . . . 45,498 50 — 26,468 125 —
Financial futures . . . . . . . . . . . . . . . . . . . . . . . . . . . . 10,817 89 57 8,432 64 39
Foreign currency swaps . . . . . . . . . . . . . . . . . . . . . . . 21,399 1,480 1,724 19,627 986 1,174
Foreign currency forwards . . . . . . . . . . . . . . . . . . . . . . 4,185 76 16 2,934 31 27
Options . . . . . . . . . . . . . . . . . . . . . . . . . . . . . . . . . . 2,043 713 1 587 306 8
Financial forwards . . . . . . . . . . . . . . . . . . . . . . . . . . . 4,600 122 2 3,800 12 40
Credit default swaps . . . . . . . . . . . . . . . . . . . . . . . . . 6,850 58 35 6,357 5 21
Synthetic GICs . . . . . . . . . . . . . . . . . . . . . . . . . . . . . 3,670 — — 3,739 — —
Other . . . . . . . . . . . . . . . . . . . . . . . . . . . . . . . . . . . 250 43 — 250 56 —
Total . . . . . . . . . . . . . . . . . . . . . . . . . . . . . . . . . . $210,768 $4,037 $2,603 $136,779 $2,503 $1,459
The above table does not include notional amounts for equity futures, equity variance swaps and equity options. At December 31, 2007
and 2006, the Company owned 4,658 and 2,749 equity futures, respectively. Fair values of equity futures are included in financial futures
F-33MetLife, Inc.
MetLife, Inc.
Notes to Consolidated Financial Statements — (Continued)
in the preceding table. At December 31, 2007 and 2006, the Company owned 695,485 and 225,000 equity variance swaps, respectively.
Fair values of equity variance swaps are included in financial forwards in the preceding table. At December 31, 2007 and 2006, the
Company owned 77,374,937 and 74,864,483 equity options, respectively. Fair values of equity options are included in options in the
preceding table.
The following table presents the notional amount of derivative financial instruments by maturity at December 31, 2007:
One Year or
Less
After One Year
Through Five
Years
After Five Years
Through Ten
Years
After Ten
Years Total
Remaining Life
(In millions)
Interest rate swaps . . . . . . . . . . . . . . . . . . . . . . . . . . $14,844 $30,113 $ 9,918 $ 7,644 $ 62,519
Interest rate floors . . . . . . . . . . . . . . . . . . . . . . . . . . — 15,619 33,318 — 48,937
Interest rate caps . . . . . . . . . . . . . . . . . . . . . . . . . . . 29,905 15,593 — — 45,498
Financial futures . . . . . . . . . . . . . . . . . . . . . . . . . . . 10,730 — — 87 10,817
Foreign currency swaps . . . . . . . . . . . . . . . . . . . . . . 1,632 9,068 7,434 3,265 21,399
Foreign currency forwards . . . . . . . . . . . . . . . . . . . . . 4,175 — — 10 4,185
Options . . . . . . . . . . . . . . . . . . . . . . . . . . . . . . . . . — 620 1,250 173 2,043
Financial forwards . . . . . . . . . . . . . . . . . . . . . . . . . . — — — 4,600 4,600
Credit default swaps . . . . . . . . . . . . . . . . . . . . . . . . . 509 4,582 1,510 249 6,850
Synthetic GICs . . . . . . . . . . . . . . . . . . . . . . . . . . . . 3,670 — — — 3,670
Other . . . . . . . . . . . . . . . . . . . . . . . . . . . . . . . . . . . — — — 250 250
Total . . . . . . . . . . . . . . . . . . . . . . . . . . . . . . . . . . $65,465 $75,595 $53,430 $16,278 $210,768
Interest rate swaps are used by the Company primarily to reduce market risks from changes in interest rates and to alter interest rate
exposure arising from mismatches between assets and liabilities (duration mismatches). In an interest rate swap, the Company agrees with
another party to exchange, at specified intervals, the difference between fixed rate and floating rate interest amounts as calculated by
reference to an agreed notional principal amount. These transactions are entered into pursuant to master agreements that provide for a
single net payment to be made by the counterparty at each due date.
The Company also enters into basis swaps to better match the cash flows from assets and related liabilities. In a basis swap, both legs
of the swap are floating with each based on a different index. Generally, no cash is exchanged at the outset of the contract and no principal
payments are made by either party. A single net payment is usually made by one counterparty at each due date. Basis swaps are included
in interest rate swaps in the preceding table.
Interest rate caps and floors are used by the Company primarily to protect its floating rate liabilities against rises in interest rates above a
specified level, and against interest rate exposure arising from mismatches between assets and liabilities (duration mismatches), as well as
to protect its minimum rate guarantee liabilities against declines in interest rates below a specified level, respectively.
In exchange-traded interest rate (Treasury and swap) and equity futures transactions, the Company agrees to purchase or sell a
specified number of contracts, the value of which is determined by the different classes of interest rate and equity securities, and to post
variation margin on a daily basis in an amount equal to the difference in the daily market values of those contracts. The Company enters into
exchange-traded futures with regulated futures commission merchants that are members of the exchange.
Exchange-traded interest rate (Treasury and swap) futures are used primarily to hedge mismatches between the duration of assets in a
portfolio and the duration of liabilities supported by those assets, to hedge against changes in value of securities the Company owns or
anticipates acquiring, and to hedge against changes in interest rates on anticipated liability issuances by replicating Treasury or swap curve
performance. The value of interest rate futures is substantially impacted by changes in interest rates and they can be used to modify or
hedge existing interest rate risk.
Exchange-traded equity futures are used primarily to hedge liabilities embedded in certain variable annuity products offered by the
Company.
Foreign currency derivatives, including foreign currency swaps, foreign currency forwards and currency option contracts, are used by
the Company to reduce the risk from fluctuations in foreign currency exchange rates associated with its assets and liabilities denominated
in foreign currencies. The Company also uses foreign currency forwards and swaps to hedge the foreign currency risk associated with
certain of its net investments in foreign operations.
In a foreign currency swap transaction, the Company agrees with another party to exchange, at specified intervals, the difference
between one currency and another at a forward exchange rate calculated by reference to an agreed upon principal amount. The principal
amount of each currency is exchanged at the inception and termination of the currency swap by each party.
In a foreign currency forward transaction, the Company agrees with another party to deliver a specified amount of an identified currency
at a specified future date. The price is agreed upon at the time of the contract and payment for such a contract is made in a different
currency at the specified future date.
The Company enters into currency option contracts that give it the right, but not the obligation, to sell the foreign currency amount in
exchange for a functional currency amount within a limited time at a contracted price. The contracts may also be net settled in cash, based
on differentials in the foreign exchange rate and the strike price. Currency option contracts are included in options in the preceding table.
Swaptions are used by the Company to hedge interest rate risk associated with the Company’s long-term liabilities, as well as to sell, or
monetize, embedded call options in its fixed rate liabilities. A swaption is an option to enter into a swap with an effective date equal to the
exercise date of the embedded call and a maturity date equal to the maturity date of the underlying liability. The Company receives a
premium for entering into the swaption. Swaptions are included in options in the preceding table.
F-34 MetLife, Inc.
MetLife, Inc.
Notes to Consolidated Financial Statements — (Continued)
Equity index options are used by the Company primarily to hedge minimum guarantees embedded in certain variable annuity products
offered by the Company. To hedge against adverse changes in equity indices, the Company enters into contracts to sell the equity index
within a limited time at a contracted price. The contracts will be net settled in cash based on differentials in the indices at the time of
exercise and the strike price. Equity index options are included in options in the preceding table.
The Company enters into financial forwards to buy and sell securities. The price is agreed upon at the time of the contract and payment
for such a contract is made at a specified future date.
Equity variance swaps are used by the Company primarily to hedge minimum guarantees embedded in certain variable annuity products
offered by the Company. In an equity variance swap, the Company agrees with another party to exchange amounts in the future, based on
changes in equity volatility over a defined period. Equity variance swaps are included in financial forwards in the preceding table.
Swap spread locks are used by the Company to hedge invested assets on an economic basis against the risk of changes in credit
spreads. Swap spread locks are forward starting swaps where the Company agrees to pay a coupon based on a predetermined reference
swap spread in exchange for receiving a coupon based on a floating rate. The Company has the option to cash settle with the counterparty
in lieu of maintaining the swap after the effective date. Swap spread locks are included in financial forwards in the preceding table.
Certain credit default swaps are used by the Company to hedge against credit-related changes in the value of its investments and to
diversify its credit risk exposure in certain portfolios. In a credit default swap transaction, the Company agrees with another party, at
specified intervals, to pay a premium to insure credit risk. If a credit event, as defined by the contract, occurs, generally the contract will
require the swap to be settled gross by the delivery of par quantities of the referenced investment equal to the specified swap notional in
exchange for the payment of cash amounts by the counterparty equal to the par value of the investment surrendered.
Credit default swaps are also used to synthetically create investments that are either more expensive to acquire or otherwise
unavailable in the cash markets. These transactions are a combination of a derivative and a cash instrument such as a U.S. Treasury
or Agency security. The Company also enters into certain credit default swaps held in relation to trading portfolios.
A synthetic guaranteed interest contract (“GIC”) is a contract that simulates the performance of a traditional GIC through the use of
financial instruments. Under a synthetic GIC, the policyholder owns the underlying assets. The Company guarantees a rate return on those
assets for a premium.
Total rate of return swaps (“TRRs”) are swaps whereby the Company agrees with another party to exchange, at specified intervals, the
difference between the economic risk and reward of an asset or a market index and LIBOR, calculated by reference to an agreed notional
principal amount. No cash is exchanged at the outset of the contract. Cash is paid and received over the life of the contract based on the
terms of the swap. These transactions are entered into pursuant to master agreements that provide for a single net payment to be made by
the counterparty at each due date. TRRs can be used as hedges or to synthetically create investments and are included in the other
classification in the preceding table.
Hedging
The following table presents the notional amount and fair value of derivatives by type of hedge designation at:
Notional
Amount Assets Liabilities
Notional
Amount Assets Liabilities
Fair Value Fair Value
December 31, 2007 December 31, 2006
(In millions)
Fair value. . . . . . . . . . . . . . . . . . . . . . . . . . . . . . . . . $ 10,006 $ 650 $ 99 $ 7,978 $ 290 $ 85
Cash flow . . . . . . . . . . . . . . . . . . . . . . . . . . . . . . . . 4,717 161 321 4,366 149 151
Foreign operations. . . . . . . . . . . . . . . . . . . . . . . . . . . 1,872 11 119 1,232 1 50
Non-qualifying . . . . . . . . . . . . . . . . . . . . . . . . . . . . . 194,173 3,215 2,064 123,203 2,063 1,173
Total . . . . . . . . . . . . . . . . . . . . . . . . . . . . . . . . . . $210,768 $4,037 $2,603 $136,779 $2,503 $1,459
The following table presents the settlement payments recorded in income for the:
2007 2006 2005
Years Ended
December 31,
(In millions)
Qualifying hedges:
Net investment income . . . . . . . . . . . . . . . . . . . . . . . . . . . . . . . . . . . . . . . . . . . . . . . . . . . . $ 29 $ 49 $ 42
Interest credited to policyholder account balances . . . . . . . . . . . . . . . . . . . . . . . . . . . . . . . . . . (34) (35) 17
Other expenses . . . . . . . . . . . . . . . . . . . . . . . . . . . . . . . . . . . . . . . . . . . . . . . . . . . . . . . . 1 3 (8)
Non-qualifying hedges:
Net investment income . . . . . . . . . . . . . . . . . . . . . . . . . . . . . . . . . . . . . . . . . . . . . . . . . . . . (5) — —
Net investment gains (losses). . . . . . . . . . . . . . . . . . . . . . . . . . . . . . . . . . . . . . . . . . . . . . . . 279 296 86
Total . . . . . . . . . . . . . . . . . . . . . . . . . . . . . . . . . . . . . . . . . . . . . . . . . . . . . . . . . . . . . . $270 $313 $137
Fair Value Hedges
The Company designates and accounts for the following as fair value hedges when they have met the requirements of SFAS 133:
(i) interest rate swaps to convert fixed rate investments to floating rate investments; and (ii) foreign currency swaps to hedge the foreign
currency fair value exposure of foreign currency denominated investments and liabilities.
F-35MetLife, Inc.
MetLife, Inc.
Notes to Consolidated Financial Statements — (Continued)
The Company recognized net investment gains (losses) representing the ineffective portion of all fair value hedges as follows:
2007 2006 2005
Years Ended December 31,
(In millions)
Changes in the fair value of derivatives . . . . . . . . . . . . . . . . . . . . . . . . . . . . . . . . . . . . . . . . . . $ 334 $ 276 $(118)
Changes in the fair value of the items hedged . . . . . . . . . . . . . . . . . . . . . . . . . . . . . . . . . . . . . (326) (276) 115
Net ineffectiveness of fair value hedging activities . . . . . . . . . . . . . . . . . . . . . . . . . . . . . . . . . . . $ 8 $ — $ (3)
All components of each derivative’s gain or loss were included in the assessment of hedge effectiveness. There were no instances in
which the Company discontinued fair value hedge accounting due to a hedged firm commitment no longer qualifying as a fair value hedge.
Cash Flow Hedges
The Company designates and accounts for the following as cash flow hedges when they have met the requirements of SFAS 133:
(i) interest rate swaps to convert floating rate investments to fixed rate investments; (ii) interest rate swaps to convert floating rate liabilities
to fixed rate liabilities; (iii) foreign currency swaps to hedge the foreign currency cash flow exposure of foreign currency denominated
investments and liabilities; and (iv) financial forwards to buy and sell securities.
For the years ended December 31, 2007 and 2006, the Company did not recognize any net investment gains (losses) which
represented the ineffective portion of all cash flow hedges. For the year ended December 31, 2005, the Company recognized net
investment gains (losses) of ($25) million which represented the ineffective portion of all cash flow hedges. All components of each
derivative’s gain or loss were included in the assessment of hedge effectiveness. In certain instances, the Company discontinued cash
flow hedge accounting because the forecasted transactions did not occur on the anticipated date or in the additional time period permitted
by SFAS 133. The net amounts reclassified into net investment losses for the years ended December 31, 2007, 2006 and 2005 related to
such discontinued cash flow hedges were $3 million, $3 million and $42 million, respectively. There were no hedged forecasted
transactions, other than the receipt or payment of variable interest payments for the years ended December 31, 2007, 2006 and 2005.
The following table presents the components of other comprehensive income (loss), before income tax, related to cash flow hedges:
2007 2006 2005
Years Ended December 31,
(In millions)
Other comprehensive income (loss) balance at January 1, . . . . . . . . . . . . . . . . . . . . . . . . . . . . . $(208) $(142) $(456)
Gains (losses) deferred in other comprehensive income (loss) on the effective portion of cash flow
hedges . . . . . . . . . . . . . . . . . . . . . . . . . . . . . . . . . . . . . . . . . . . . . . . . . . . . . . . . . . . . . (168) 80 127
Amounts reclassified to net investment gains (losses) . . . . . . . . . . . . . . . . . . . . . . . . . . . . . . . . 96 (158) 187
Amounts reclassified to net investment income . . . . . . . . . . . . . . . . . . . . . . . . . . . . . . . . . . . . 13 15 2
Amortization of transition adjustment . . . . . . . . . . . . . . . . . . . . . . . . . . . . . . . . . . . . . . . . . . . (1) (1) (2)
Amounts reclassified to other expenses . . . . . . . . . . . . . . . . . . . . . . . . . . . . . . . . . . . . . . . . . (2) (2) —
Other comprehensive income (loss) balance at December 31, . . . . . . . . . . . . . . . . . . . . . . . . . . . $(270) $(208) $(142)
At December 31, 2007, $23 million of the deferred net loss on derivatives accumulated in other comprehensive income (loss) is
expected to be reclassified to earnings during the year ending December 31, 2008.
Hedges of Net Investments in Foreign Operations
The Company uses forward exchange contracts, foreign currency swaps, options and non-derivative financial instruments to hedge
portions of its net investments in foreign operations against adverse movements in exchange rates. The Company measures ineffec-
tiveness on the forward exchange contracts based upon the change in forward rates. There was no ineffectiveness recorded for the years
ended December 31, 2007, 2006 and 2005.
The Company’s consolidated statements of stockholders’ equity for the years ended December 31, 2007, 2006 and 2005 include gains
(losses) of ($180) million, ($17) million and ($115) million, respectively, related to foreign currency contracts and non-derivative financial
instruments used to hedge its net investments in foreign operations. At December 31, 2007 and 2006, the cumulative foreign currency
translation loss recorded in accumulated other comprehensive income related to these hedges was $369 million and $189 million,
respectively. When net investments in foreign operations are sold or substantially liquidated, the amounts in accumulated other com-
prehensive income are reclassified to the consolidated statements of income, while a pro rata portion will be reclassified upon partial sale
of the net investments in foreign operations.
Non-qualifying Derivatives and Derivatives for Purposes Other Than Hedging
The Company enters into the following derivatives that do not qualify for hedge accounting under SFAS 133 or for purposes other than
hedging: (i) interest rate swaps, purchased caps and floors, and interest rate futures to economically hedge its exposure to interest rate
volatility; (ii) foreign currency forwards, swaps and option contracts to economically hedge its exposure to adverse movements in exchange
rates; (iii) swaptions to sell embedded call options in fixed rate liabilities; (iv) credit default swaps to economically hedge exposure to
adverse movements in credit; (v) equity futures, equity index options, interest rate futures and equity variance swaps to economically
hedge liabilities embedded in certain variable annuity products; (vi) swap spread locks to economically hedge invested assets against the
risk of changes in credit spreads; (vii) financial forwards to buy and sell securities; (viii) synthetic guaranteed interest contracts; (ix) credit
default swaps and TRRs to synthetically create investments; (x) basis swaps to better match the cash flows of assets and related liabilities;
(xi) credit default swaps held in relation to trading portfolios; and (xii) swaptions to hedge interest rate risk.
F-36 MetLife, Inc.
MetLife, Inc.
Notes to Consolidated Financial Statements — (Continued)
The following table presents changes in fair value related to derivatives that do not qualify for hedge accounting:
2007 2006 2005
Years Ended December 31,
(In millions)
Net investment gains (losses), excluding embedded derivatives . . . . . . . . . . . . . . . . . . . . . . . . . . $(232) $(685) $299
Policyholder benefits and claims . . . . . . . . . . . . . . . . . . . . . . . . . . . . . . . . . . . . . . . . . . . . . . $ 7 $ (33) $ 2
Net investment income(1) . . . . . . . . . . . . . . . . . . . . . . . . . . . . . . . . . . . . . . . . . . . . . . . . . . . $ 31 $ (40) $ (38)
(1) Changes in fair value related to economic hedges of equity method investment in joint ventures that do not qualify for hedge accounting
and changes in fair value related to derivatives held in relation to trading portfolios.
Embedded Derivatives
The Company has certain embedded derivatives that are required to be separated from their host contracts and accounted for as
derivatives. These host contracts include guaranteed minimum withdrawal contracts, guaranteed minimum accumulation contracts and
modified coinsurance contracts.
The following table presents the fair value of the Company’s embedded derivatives at:
2007 2006
December 31,
(In millions)
Embedded derivative assets . . . . . . . . . . . . . . . . . . . . . . . . . . . . . . . . . . . . . . . . . . . . . . . . . . . . . . . $ 72 $180
Embedded derivative liabilities . . . . . . . . . . . . . . . . . . . . . . . . . . . . . . . . . . . . . . . . . . . . . . . . . . . . . . $980 $169
The following table presents changes in fair value related to embedded derivatives:
2007 2006 2005
Years Ended December 31,
(In millions)
Net investment gains (losses) . . . . . . . . . . . . . . . . . . . . . . . . . . . . . . . . . . . . . . . . . . . . $(471) $209 $ 69
Interest credited to policyholder account balances . . . . . . . . . . . . . . . . . . . . . . . . . . . . . . $ (66) $ (80) $(45)
Credit Risk
The Company may be exposed to credit-related losses in the event of nonperformance by counterparties to derivative financial
instruments. Generally, the current credit exposure of the Company’s derivative contracts is limited to the fair value at the reporting date.
The credit exposure of the Company’s derivative transactions is represented by the fair value of contracts with a net positive fair value at the
reporting date.
The Company manages its credit risk related to over-the-counter derivatives by entering into transactions with creditworthy counter-
parties, maintaining collateral arrangements and through the use of master agreements that provide for a single net payment to be made by
one counterparty to another at each due date and upon termination. Because exchange traded futures are effected through regulated
exchanges, and positions are marked to market on a daily basis, the Company has minimal exposure to credit-related losses in the event of
nonperformance by counterparties to such derivative instruments.
The Company enters into various collateral arrangements, which require both the pledging and accepting of collateral in connection
with its derivative instruments. As of December 31, 2007 and 2006, the Company was obligated to return cash collateral under its control
of $833 million and $428 million, respectively. This unrestricted cash collateral is included in cash and cash equivalents and the obligation
to return it is included in payables for collateral under securities loaned and other transactions in the consolidated balance sheets. As of
December 31, 2007 and 2006, the Company had also accepted collateral consisting of various securities with a fair market value of
$678 million and $453 million, respectively, which are held in separate custodial accounts. The Company is permitted by contract to sell or
repledge this collateral, but as of December 31, 2007 and 2006, none of the collateral had been sold or repledged.
As of December 31, 2007 and 2006, the Company provided collateral of $162 million and $80 million, respectively, which is included in
fixed maturity securities in the consolidated balance sheets. In addition, the Company has exchange traded futures, which require the
pledging of collateral. As of December 31, 2007 and 2006, the Company pledged collateral of $167 million and $105 million, respectively,
which is included in fixed maturity securities. The counterparties are permitted by contract to sell or repledge this collateral.
F-37MetLife, Inc.
MetLife, Inc.
Notes to Consolidated Financial Statements — (Continued)
5. Deferred Policy Acquisition Costs and Value of Business Acquired
Information regarding DAC and VOBA is as follows:
DAC VOBA Total
(In millions)
Balance at January 1, 2005 . . . . . . . . . . . . . . . . . . . . . . . . . . . . . . . . . . . . . . . . . . . . $12,743 $1,584 $14,327
Capitalizations . . . . . . . . . . . . . . . . . . . . . . . . . . . . . . . . . . . . . . . . . . . . . . . . . . . . 3,604 — 3,604
Acquisitions . . . . . . . . . . . . . . . . . . . . . . . . . . . . . . . . . . . . . . . . . . . . . . . . . . . . . — 3,780 3,780
Subtotal . . . . . . . . . . . . . . . . . . . . . . . . . . . . . . . . . . . . . . . . . . . . . . . . . . . . . 16,347 5,364 21,711
Less: Amortization related to:
Net investment gains (losses) . . . . . . . . . . . . . . . . . . . . . . . . . . . . . . . . . . . . . . . . 12 (25) (13)
Unrealized investment gains (losses) . . . . . . . . . . . . . . . . . . . . . . . . . . . . . . . . . . . . (323) (139) (462)
Other expenses . . . . . . . . . . . . . . . . . . . . . . . . . . . . . . . . . . . . . . . . . . . . . . . . . 2,128 335 2,463
Total amortization . . . . . . . . . . . . . . . . . . . . . . . . . . . . . . . . . . . . . . . . . . . . . . . 1,817 171 1,988
Less: Dispositions and other . . . . . . . . . . . . . . . . . . . . . . . . . . . . . . . . . . . . . . . . . . 106 (12) 94
Balance at December 31, 2005 . . . . . . . . . . . . . . . . . . . . . . . . . . . . . . . . . . . . . . . . . . 14,424 5,205 19,629
Capitalizations . . . . . . . . . . . . . . . . . . . . . . . . . . . . . . . . . . . . . . . . . . . . . . . . . . . . 3,589 — 3,589
Subtotal . . . . . . . . . . . . . . . . . . . . . . . . . . . . . . . . . . . . . . . . . . . . . . . . . . . . . 18,013 5,205 23,218
Less: Amortization related to:
Net investment gains (losses) . . . . . . . . . . . . . . . . . . . . . . . . . . . . . . . . . . . . . . . . (158) (74) (232)
Unrealized investment gains (losses) . . . . . . . . . . . . . . . . . . . . . . . . . . . . . . . . . . . . 79 31 110
Other expenses . . . . . . . . . . . . . . . . . . . . . . . . . . . . . . . . . . . . . . . . . . . . . . . . . 2,247 407 2,654
Total amortization . . . . . . . . . . . . . . . . . . . . . . . . . . . . . . . . . . . . . . . . . . . . . . . 2,168 364 2,532
Less: Dispositions and other . . . . . . . . . . . . . . . . . . . . . . . . . . . . . . . . . . . . . . . . . . (153) 1 (152)
Balance at December 31, 2006 . . . . . . . . . . . . . . . . . . . . . . . . . . . . . . . . . . . . . . . . . . 15,998 4,840 20,838
Effect of SOP 05-1 adoption . . . . . . . . . . . . . . . . . . . . . . . . . . . . . . . . . . . . . . . . . . (205) (248) (453)
Capitalizations . . . . . . . . . . . . . . . . . . . . . . . . . . . . . . . . . . . . . . . . . . . . . . . . . . . . 3,892 — 3,892
Acquisitions . . . . . . . . . . . . . . . . . . . . . . . . . . . . . . . . . . . . . . . . . . . . . . . . . . . . . — 48 48
Subtotal . . . . . . . . . . . . . . . . . . . . . . . . . . . . . . . . . . . . . . . . . . . . . . . . . . . . . 19,685 4,640 24,325
Less: Amortization related to:
Net investment gains (losses) . . . . . . . . . . . . . . . . . . . . . . . . . . . . . . . . . . . . . . . . (225) (11) (236)
Unrealized investment gains (losses) . . . . . . . . . . . . . . . . . . . . . . . . . . . . . . . . . . . . 75 63 138
Other expenses . . . . . . . . . . . . . . . . . . . . . . . . . . . . . . . . . . . . . . . . . . . . . . . . . 2,517 495 3,012
Total amortization . . . . . . . . . . . . . . . . . . . . . . . . . . . . . . . . . . . . . . . . . . . . . . . 2,367 547 2,914
Less: Dispositions and other . . . . . . . . . . . . . . . . . . . . . . . . . . . . . . . . . . . . . . . . . . (106) (4) (110)
Balance at December 31, 2007 . . . . . . . . . . . . . . . . . . . . . . . . . . . . . . . . . . . . . . . . . . $17,424 $4,097 $21,521
The estimated future amortization expense allocated to other expenses for the next five years for VOBA is $477 million in 2008,
$423 million in 2009, $379 million in 2010, $342 million in 2011, and $294 million in 2012.
Amortization of VOBA and DAC is related to (i) investment gains and losses and the impact of such gains and losses on the amount of
the amortization; (ii) unrealized investment gains and losses to provide information regarding the amount that would have been amortized if
such gains and losses had been recognized; and (iii) other expenses to provide amounts related to the gross margins or profits originating
from transactions other than investment gains and losses.
6. Goodwill
Goodwill is the excess of cost over the fair value of net assets acquired. Information regarding goodwill is as follows:
2007 2006 2005
December 31,
(In millions)
Balance at January 1, . . . . . . . . . . . . . . . . . . . . . . . . . . . . . . . . . . . . . . . . . . . . . . . . . . $4,897 $4,797 $ 633
Acquisitions . . . . . . . . . . . . . . . . . . . . . . . . . . . . . . . . . . . . . . . . . . . . . . . . . . . . . . . . 2 93 4,180
Dispositions and other, net . . . . . . . . . . . . . . . . . . . . . . . . . . . . . . . . . . . . . . . . . . . . . . . 11 7 (16)
Balance at December 31, . . . . . . . . . . . . . . . . . . . . . . . . . . . . . . . . . . . . . . . . . . . . . . . $4,910 $4,897 $4,797
See Note 2 for a description of acquisitions and dispositions.
F-38 MetLife, Inc.
MetLife, Inc.
Notes to Consolidated Financial Statements — (Continued)
7. Insurance
Insurance Liabilities
Insurance liabilities are as follows:
2007 2006 2007 2006 2007 2006
Future Policy
Benefits
Policyholder Account
Balances
Other Policyholder
Funds
December 31,
(In millions)
Institutional
Group life . . . . . . . . . . . . . . . . . . . . . . . . . . . . . $ 3,326 $ 3,252 $ 13,997 $ 13,567 $ 2,364 $2,259
Retirement & savings . . . . . . . . . . . . . . . . . . . . . 37,947 37,908 51,585 46,127 213 21
Non-medical health & other . . . . . . . . . . . . . . . . . 10,617 9,540 501 — 597 531
Individual
Traditional life . . . . . . . . . . . . . . . . . . . . . . . . . . 52,493 51,715 1 1 1,479 1,429
Universal variable life . . . . . . . . . . . . . . . . . . . . . 985 894 14,898 14,544 1,572 1,367
Annuities . . . . . . . . . . . . . . . . . . . . . . . . . . . . . 3,063 3,186 37,807 40,251 76 43
Other . . . . . . . . . . . . . . . . . . . . . . . . . . . . . . . — — 2,410 2,412 1 1
Auto & Home . . . . . . . . . . . . . . . . . . . . . . . . . . . . 3,273 3,392 — — 51 61
International . . . . . . . . . . . . . . . . . . . . . . . . . . . . 9,826 8,123 4,961 4,198 1,296 1,223
Reinsurance . . . . . . . . . . . . . . . . . . . . . . . . . . . . 6,159 5,140 6,657 6,212 2,297 1,980
Corporate and Other . . . . . . . . . . . . . . . . . . . . . . . 4,573 4,339 4,532 4,636 230 224
Total . . . . . . . . . . . . . . . . . . . . . . . . . . . . . . . . $132,262 $127,489 $137,349 $131,948 $10,176 $9,139
Value of Distribution Agreements and Customer Relationships Acquired
Information regarding the VODA and VOCRA, which are reported in other assets, is as follows:
2007 2006 2005
Years Ended
December 31,
(In millions)
Balance at January 1, . . . . . . . . . . . . . . . . . . . . . . . . . . . . . . . . . . . . . . . . . . . . . . . . . . . . . . $708 $715 $ —
Acquisitions . . . . . . . . . . . . . . . . . . . . . . . . . . . . . . . . . . . . . . . . . . . . . . . . . . . . . . . . . . . . 11 — 716
Amortization . . . . . . . . . . . . . . . . . . . . . . . . . . . . . . . . . . . . . . . . . . . . . . . . . . . . . . . . . . . . (16) (6) (1)
Other . . . . . . . . . . . . . . . . . . . . . . . . . . . . . . . . . . . . . . . . . . . . . . . . . . . . . . . . . . . . . . . . . 3 (1) —
Balance at December 31, . . . . . . . . . . . . . . . . . . . . . . . . . . . . . . . . . . . . . . . . . . . . . . . . . . . $706 $708 $715
The estimated future amortization expense allocated to other expenses for the next five years for VODA and VOCRA is $23 million in
2008, $28 million in 2009, $34 million in 2010, $37 million in 2011 and $42 million in 2012. See Note 2 for a description of acquisitions and
dispositions.
Sales Inducements
Information regarding deferred sales inducements, which are reported in other assets, is as follows:
2007 2006 2005
Years Ended
December 31,
(In millions)
Balance at January 1, . . . . . . . . . . . . . . . . . . . . . . . . . . . . . . . . . . . . . . . . . . . . . . . . . . . . . . $578 $414 $294
Capitalization . . . . . . . . . . . . . . . . . . . . . . . . . . . . . . . . . . . . . . . . . . . . . . . . . . . . . . . . . . . 181 194 140
Amortization . . . . . . . . . . . . . . . . . . . . . . . . . . . . . . . . . . . . . . . . . . . . . . . . . . . . . . . . . . . . (82) (30) (20)
Balance at December 31, . . . . . . . . . . . . . . . . . . . . . . . . . . . . . . . . . . . . . . . . . . . . . . . . . . . $677 $578 $414
Separate Accounts
Separate account assets and liabilities include two categories of account types: pass-through separate accounts totaling $141.8 billion
and $127.9 billion at December 31, 2007 and 2006, respectively, for which the policyholder assumes all investment risk, and separate
accounts with a minimum return or account value for which the Company contractually guarantees either a minimum return or account
value to the policyholder which totaled $18.4 billion and $16.5 billion at December 31, 2007 and 2006, respectively. The latter category
consisted primarily of Met Managed GICs and participating close-out contracts. The average interest rate credited on these contracts was
4.73% and 4.63% at December 31, 2007 and 2006, respectively.
Fees charged to the separate accounts by the Company (including mortality charges, policy administration fees and surrender charges)
are reflected in the Company’s revenues as universal life and investment-type product policy fees and totaled $2.8 billion, $2.4 billion and
$1.7 billion for the years ended December 31, 2007, 2006 and 2005, respectively.
F-39MetLife, Inc.
MetLife, Inc.
Notes to Consolidated Financial Statements — (Continued)
The Company’s proportional interest in separate accounts is included in the consolidated balance sheets as follows:
2007 2006
December 31,
(In millions)
Fixed maturity securities . . . . . . . . . . . . . . . . . . . . . . . . . . . . . . . . . . . . . . . . . . . . . . . . . . . . . . $35 $30
Equity securities . . . . . . . . . . . . . . . . . . . . . . . . . . . . . . . . . . . . . . . . . . . . . . . . . . . . . . . . . . . $41 $36
Cash and cash equivalents . . . . . . . . . . . . . . . . . . . . . . . . . . . . . . . . . . . . . . . . . . . . . . . . . . . . $ 5 $ 5
For the years ended December 31, 2007, 2006 and 2005, there were no investment gains (losses) on transfers of assets from the
general account to the separate accounts.
Obligations Under Guaranteed Interest Contract Program
The Company issues fixed and floating rate obligations under its GIC program which are denominated in either U.S. dollars or foreign
currencies. During the years ended December 31, 2007, 2006 and 2005, the Company issued $5.2 billion, $5.2 billion and $4.0 billion,
respectively, and repaid $4.3 billion, $2.6 billion and $1.1 billion, respectively, of GICs under this program. At December 31, 2007 and
2006, GICs outstanding, which are included in policyholder account balances, were $24.2 billion and $21.5 billion, respectively. During the
years ended December 31, 2007, 2006 and 2005, interest credited on the contracts, which are included in interest credited to
policyholder account balances, was $1.1 billion, $835 million and $464 million, respectively.
Obligations Under Funding Agreements
MetLife Insurance Company of Connecticut (“MICC”) is a member of the Federal Home Loan Bank of Boston (the “FHLB of Boston”) and
holds $70 million of common stock of the FHLB of Boston at both December 31, 2007 and 2006, which is included in equity securities.
MICC has also entered into funding agreements with the FHLB of Boston whereby MICC has issued such funding agreements in exchange
for cash and for which the FHLB of Boston has been granted a blanket lien on certain MICC assets, including residential mortgage-backed
securities, to collateralize MICC’s obligations under the funding agreements. MICC maintains control over these pledged assets, and may
use, commingle, encumber or dispose of any portion of the collateral as long as there is no event of default and the remaining qualified
collateral is sufficient to satisfy the collateral maintenance level. Upon any event of default by MICC, the FHLB of Boston’s recovery on the
collateral is limited to the amount of MICC’s liability to the FHLB of Boston. The amount of the Company’s liability for funding agreements
with the FHLB of Boston was $726 million and $926 million at December 31, 2007 and 2006, respectively, which is included in policyholder
account balances. The advances on these funding agreements are collateralized by residential mortgage-backed securities with fair values
of $901 million and $1.1 billion at December 31, 2007 and 2006, respectively.
MLIC is a member of the Federal Home Loan Bank of New York (“FHLB of NY”) and holds $339 million and $136 million of common stock
of the FHLB of NY at December 31, 2007 and 2006, respectively, which is included in equity securities. MLIC has also entered into funding
agreements with the FHLB of NY whereby MLIC has issued such funding agreements in exchange for cash and for which the FHLB of NY
has been granted a lien on certain MLIC assets, including residential mortgage-backed securities to collateralize MLIC’s obligations under
the funding agreements. MLIC maintains control over these pledged assets, and may use, commingle, encumber or dispose of any portion
of the collateral as long as there is no event of default and the remaining qualified collateral is sufficient to satisfy the collateral maintenance
level. Upon any event of default by MLIC, the FHLB of NY’s recovery on the collateral is limited to the amount of MLIC’s liability to the FHLB
of NY. The amount of the Company’s liability for funding agreements with the FHLB of NY was $4.6 billion at December 31, 2007, which is
included in policyholder account balances. The advances on these agreements are collateralized by residential mortgage-backed
securities with fair values of $4.8 billion at December 31, 2007. MLIC did not have any funding agreements with the FHLB of NY at
December 31, 2006.
MLIC has issued funding agreements to certain trusts that have issued securities guaranteed as to payment of interest and principal by
the Federal Agricultural Mortgage Corporation, a federally chartered instrumentality of the United States. The obligations under these
funding agreements are secured by a pledge of certain eligible agricultural real estate mortgage loans and may, under certain circum-
stances, be secured by other qualified collateral. The amount of the Company’s liability for funding agreements issued to such trusts was
$2.5 billion and $1.5 billion at December 31, 2007 and 2006, respectively, which is included in policyholder account balances. The
obligations under these funding agreements are collateralized by designated agricultural real estate mortgage loans with fair values of
$2.9 billion and $1.7 billion at December 31, 2007 and 2006, respectively.
F-40 MetLife, Inc.
MetLife, Inc.
Notes to Consolidated Financial Statements — (Continued)
Liabilities for Unpaid Claims and Claim Expenses
Information regarding the liabilities for unpaid claims and claim expenses relating to property and casualty, group accident and non-
medical health policies and contracts, which are reported in future policy benefits and other policyholder funds, is as follows:
2007 2006 2005
Years Ended December 31,
(In millions)
Balance at January 1, . . . . . . . . . . . . . . . . . . . . . . . . . . . . . . . . . . . . . . . . . . . . . . . . . $ 7,244 $ 6,977 $ 5,824
Less: Reinsurance recoverables . . . . . . . . . . . . . . . . . . . . . . . . . . . . . . . . . . . . . . . . . (937) (940) (486)
Net balance at January 1, . . . . . . . . . . . . . . . . . . . . . . . . . . . . . . . . . . . . . . . . . . . . . . 6,307 6,037 5,338
Acquisitions, net . . . . . . . . . . . . . . . . . . . . . . . . . . . . . . . . . . . . . . . . . . . . . . . . . . . . — — 160
Incurred related to:
Current year . . . . . . . . . . . . . . . . . . . . . . . . . . . . . . . . . . . . . . . . . . . . . . . . . . . . . . 5,796 5,064 4,940
Prior years . . . . . . . . . . . . . . . . . . . . . . . . . . . . . . . . . . . . . . . . . . . . . . . . . . . . . . . (325) (329) (180)
5,471 4,735 4,760
Paid related to:
Current year . . . . . . . . . . . . . . . . . . . . . . . . . . . . . . . . . . . . . . . . . . . . . . . . . . . . . . (3,297) (2,975) (2,841)
Prior years . . . . . . . . . . . . . . . . . . . . . . . . . . . . . . . . . . . . . . . . . . . . . . . . . . . . . . . (1,600) (1,490) (1,380)
(4,897) (4,465) (4,221)
Net balance at December 31, . . . . . . . . . . . . . . . . . . . . . . . . . . . . . . . . . . . . . . . . . . . . 6,881 6,307 6,037
Add: Reinsurance recoverables . . . . . . . . . . . . . . . . . . . . . . . . . . . . . . . . . . . . . . . . . 955 937 940
Balance at December 31, . . . . . . . . . . . . . . . . . . . . . . . . . . . . . . . . . . . . . . . . . . . . . . $ 7,836 $ 7,244 $ 6,977
During 2007 and 2006, as a result of changes in estimates of insured events in the respective prior year, claims and claim adjustment
expenses associated with prior years decreased by $325 million and $329 million, respectively, due to a reduction in prior year automobile
bodily injury and homeowners’ severity, reduced loss adjustment expenses, improved loss ratio for non-medical health claim liabilities and
improved claim management.
In 2005, the claims and claim adjustment expenses decreased by $180 million due to a reduction in prior year automobile bodily injury
and homeowners’ severity as well as refinement in the estimation methodology for non-medical health long-term care claim liabilities.
Guarantees
The Company issues annuity contracts which may include contractual guarantees to the contractholder for: (i) return of no less than
total deposits made to the contract less any partial withdrawals (“return of net deposits”); and (ii) the highest contract value on a specified
anniversary date minus any withdrawals following the contract anniversary, or total deposits made to the contract less any partial
withdrawals plus a minimum return (“anniversary contract value” or “minimum return”). The Company also issues annuity contracts that
apply a lower rate of funds deposited if the contractholder elects to surrender the contract for cash and a higher rate if the contractholder
elects to annuitize (“two tier annuities”). These guarantees include benefits that are payable in the event of death or at annuitization.
The Company also issues universal and variable life contracts where the Company contractually guarantees to the contractholder a
secondary guarantee or a guaranteed paid-up benefit.
Information regarding the types of guarantees relating to annuity contracts and universal and variable life contracts is as follows:
In the
Event of Death
At
Annuitization
In the
Event of Death
At
Annuitization
2007 2006
December 31,
(In millions)
Annuity Contracts(1)
Return of Net Deposits
Separate account value . . . . . . . . . . . . . . . . . . . . . . . . . . . . . $ 18,573 N/A $ 13,809 N/A
Net amount at risk(2). . . . . . . . . . . . . . . . . . . . . . . . . . . . . . . $ 52(3) N/A $ 1(3) N/A
Average attained age of contractholders . . . . . . . . . . . . . . . . . . 61 years N/A 61 years N/A
Anniversary Contract Value or Minimum Return
Separate account value . . . . . . . . . . . . . . . . . . . . . . . . . . . . . $ 87,168 $ 29,603 $ 87,351 $ 24,647
Net amount at risk(2). . . . . . . . . . . . . . . . . . . . . . . . . . . . . . . $ 2,331(3) $ 441(4) $ 1,927(3) $ 65(4)
Average attained age of contractholders . . . . . . . . . . . . . . . . . . 58 years 60 years 60 years 60 years
Two Tier Annuities
General account value . . . . . . . . . . . . . . . . . . . . . . . . . . . . . N/A $ 286 N/A $ 296
Net amount at risk(2). . . . . . . . . . . . . . . . . . . . . . . . . . . . . . . N/A $ 51(5) N/A $ 53(5)
Average attained age of contractholders . . . . . . . . . . . . . . . . . . N/A 60 years N/A 58 years
F-41MetLife, Inc.
MetLife, Inc.
Notes to Consolidated Financial Statements — (Continued)
Secondary
Guarantees
Paid-Up
Guarantees
Secondary
Guarantees
Paid-Up
Guarantees
2007 2006
December 31,
(In millions)
Universal and Variable Life Contracts(1)
Account value (general and separate account) . . . . . . . . . . . . . . . . . . . . $ 9,347 $ 4,302 $ 8,357 $ 4,468
Net amount at risk(2) . . . . . . . . . . . . . . . . . . . . . . . . . . . . . . . . . . . . $141,840(3) $ 33,855(3) $131,808(3) $ 36,447(3)
Average attained age of policyholders . . . . . . . . . . . . . . . . . . . . . . . . . 49 years 55 years 49 years 54 years
(1) The Company’s annuity and life contracts with guarantees may offer more than one type of guarantee in each contract. Therefore, the
amounts listed above may not be mutually exclusive.
(2) The net amount at risk is based on the direct amount at risk (excluding reinsurance).
(3) The net amount at risk for guarantees of amounts in the event of death is defined as the current guaranteed minimum death benefit in
excess of the current account balance at the balance sheet date.
(4) The net amount at risk for guarantees of amounts at annuitization is defined as the present value of the minimum guaranteed annuity
payments available to the contractholder determined in accordance with the terms of the contract in excess of the current account
balance.
(5) The net amount at risk for two tier annuities is based on the excess of the upper tier, adjusted for a profit margin, less the lower tier.
Information regarding the liabilities for guarantees (excluding base policy liabilities) relating to annuity and universal and variable life
contracts is as follows:
Guaranteed
Death
Benefits
Guaranteed
Annuitization
Benefits
Secondary
Guarantees
Paid
Up
Guarantees Total
Annuity Contracts
Universal and Variable
Life Contracts
(In millions)
Balance at January 1, 2005 . . . . . . . . . . . . . . . . . . . . . . . . . $24 $19 $ 6 $29 $ 78
Incurred guaranteed benefits. . . . . . . . . . . . . . . . . . . . . . . . . 22 10 10 10 52
Paid guaranteed benefits . . . . . . . . . . . . . . . . . . . . . . . . . . . (5) — (1) — (6)
Balance at December 31, 2005 . . . . . . . . . . . . . . . . . . . . . . . 41 29 15 39 124
Incurred guaranteed benefits. . . . . . . . . . . . . . . . . . . . . . . . . 17 7 29 1 54
Paid guaranteed benefits . . . . . . . . . . . . . . . . . . . . . . . . . . . (6) — — — (6)
Balance at December 31, 2006 . . . . . . . . . . . . . . . . . . . . . . . 52 36 44 40 172
Incurred guaranteed benefits. . . . . . . . . . . . . . . . . . . . . . . . . 28 38 53 6 125
Paid guaranteed benefits . . . . . . . . . . . . . . . . . . . . . . . . . . . (8) — — — (8)
Balance at December 31, 2007 . . . . . . . . . . . . . . . . . . . . . . . $72 $74 $97 $46 $289
Account balances of contracts with insurance guarantees are invested in separate account asset classes as follows:
2007 2006
December 31,
(In millions)
Mutual Fund Groupings
Equity . . . . . . . . . . . . . . . . . . . . . . . . . . . . . . . . . . . . . . . . . . . . . . . . . . . . . . . . . . . . . . . . $69,477 $70,187
Bond . . . . . . . . . . . . . . . . . . . . . . . . . . . . . . . . . . . . . . . . . . . . . . . . . . . . . . . . . . . . . . . . 6,284 6,139
Balanced . . . . . . . . . . . . . . . . . . . . . . . . . . . . . . . . . . . . . . . . . . . . . . . . . . . . . . . . . . . . . . 15,977 4,403
Money Market. . . . . . . . . . . . . . . . . . . . . . . . . . . . . . . . . . . . . . . . . . . . . . . . . . . . . . . . . . . 1,775 1,302
Specialty . . . . . . . . . . . . . . . . . . . . . . . . . . . . . . . . . . . . . . . . . . . . . . . . . . . . . . . . . . . . . . 870 1,088
Total . . . . . . . . . . . . . . . . . . . . . . . . . . . . . . . . . . . . . . . . . . . . . . . . . . . . . . . . . . . . . . . $94,383 $83,119
8. Reinsurance
The Company’s life insurance operations participate in reinsurance activities in order to limit losses, minimize exposure to large risks,
and provide additional capacity for future growth. The Company has historically reinsured the mortality risk on new individual life insurance
policies primarily on an excess of retention basis or a quota share basis. Until 2005, the Company reinsured up to 90% of the mortality risk
for all new individual life insurance policies that it wrote through its various franchises. This practice was initiated by the different franchises
for different products starting at various points in time between 1992 and 2000. During 2005, the Company changed its retention practices
for certain individual life insurance. Amounts reinsured in prior years remain reinsured under the original reinsurance; however, under the
new retention guidelines, the Company reinsures up to 90% of the mortality risk in excess of $1 million for most new individual life insurance
policies that it writes through its various franchises and for certain individual life policies the retention limits remained unchanged. On a
case by case basis, the Company may retain up to $20 million per life and reinsure 100% of amounts in excess of the Company’s retention
limits. The Company evaluates its reinsurance programs routinely and may increase or decrease its retention at any time. In addition, the
Company reinsures a significant portion of the mortality risk on its individual universal life policies issued since 1983. Placement of
reinsurance is done primarily on an automatic basis and also on a facultative basis for risks with specific characteristics.
F-42 MetLife, Inc.
MetLife, Inc.
Notes to Consolidated Financial Statements — (Continued)
In addition to reinsuring mortality risk as described previously, the Company reinsures other risks, as well as specific coverages. The
Company routinely reinsures certain classes of risks in order to limit its exposure to particular travel, avocation and lifestyle hazards. The
Company has exposure to catastrophes, which could contribute to significant fluctuations in the Company’s results of operations. The
Company uses excess of retention and quota share reinsurance arrangements to provide greater diversification of risk and minimize
exposure to larger risks.
The Company had also protected itself through the purchase of combination risk coverage. This reinsurance coverage pooled risks
from several lines of business and included individual and group life claims in excess of $2 million per policy, as well as excess property and
casualty losses, among others. This combination risk coverage was commuted during 2005.
The Company reinsures its business through a diversified group of reinsurers. No single unaffiliated reinsurer has a material obligation to
the Company nor is the Company’s business substantially dependent upon any reinsurance contracts. The Company is contingently liable
with respect to ceded reinsurance should any reinsurer be unable to meet its obligations under these agreements.
In the Reinsurance Segment, Reinsurance Group of America, Incorporated (“RGA”) retains a maximum of $6 million of coverage per
individual life with respect to its assumed reinsurance business.
The amounts in the consolidated statements of income are presented net of reinsurance ceded. Information regarding the effect of
reinsurance is as follows:
2007 2006 2005
Years Ended December 31,
(In millions)
Direct premiums . . . . . . . . . . . . . . . . . . . . . . . . . . . . . . . . . . . . . . . . . . . . . . . . . . . $24,168 $23,324 $22,232
Reinsurance assumed . . . . . . . . . . . . . . . . . . . . . . . . . . . . . . . . . . . . . . . . . . . . . . . 6,181 5,294 4,646
Reinsurance ceded . . . . . . . . . . . . . . . . . . . . . . . . . . . . . . . . . . . . . . . . . . . . . . . . . (2,454) (2,206) (2,018)
Net premiums. . . . . . . . . . . . . . . . . . . . . . . . . . . . . . . . . . . . . . . . . . . . . . . . . . . . . $27,895 $26,412 $24,860
Reinsurance recoverables netted against policyholder benefits and claims . . . . . . . . . . . . . $ 2,622 $ 2,313 $ 2,400
Reinsurance recoverables, included in premiums and other receivables, were $10.4 billion and $10.2 billion at December 31, 2007 and
2006, respectively, including $1.2 billion at both December 31, 2007 and 2006 relating to reinsurance of long-term GICs and structured
settlement lump sum contracts accounted for as a financing transaction; $3.4 billion and $3.0 billion at December 31, 2007 and 2006,
respectively, relating to reinsurance on the run-off of long-term care business written by Travelers; $1.2 billion and $1.3 billion at
December 31, 2007 and 2006, respectively, relating to reinsurance on the run-off of workers compensation business written by Travelers;
and $1.1 billion and $1.4 billion at December 31, 2007 and 2006, respectively, relating to the reinsurance of investment-type contracts
held by small market defined benefit contribution plans. Reinsurance and ceded commissions payables, included in other liabilities, were
$571 million and $275 million at December 31, 2007 and 2006, respectively.
9. Closed Block
On April 7, 2000, (the “Demutualization Date”), MLIC converted from a mutual life insurance company to a stock life insurance company
and became a wholly-owned subsidiary of MetLife, Inc. The conversion was pursuant to an order by the New York Superintendent of
Insurance (the “Superintendent”) approving MLIC’s plan of reorganization, as amended (the “Plan”). On the Demutualization Date, MLIC
established a closed block for the benefit of holders of certain individual life insurance policies of MLIC. Assets have been allocated to the
closed block in an amount that has been determined to produce cash flows which, together with anticipated revenues from the policies
included in the closed block, are reasonably expected to be sufficient to support obligations and liabilities relating to these policies,
including, but not limited to, provisions for the payment of claims and certain expenses and taxes, and to provide for the continuation of
policyholder dividend scales in effect for 1999, if the experience underlying such dividend scales continues, and for appropriate
adjustments in such scales if the experience changes. At least annually, the Company compares actual and projected experience
against the experience assumed in the then-current dividend scales. Dividend scales are adjusted periodically to give effect to changes in
experience.
The closed block assets, the cash flows generated by the closed block assets and the anticipated revenues from the policies in the
closed block will benefit only the holders of the policies in the closed block. To the extent that, over time, cash flows from the assets
allocated to the closed block and claims and other experience related to the closed block are, in the aggregate, more or less favorable than
what was assumed when the closed block was established, total dividends paid to closed block policyholders in the future may be greater
than or less than the total dividends that would have been paid to these policyholders if the policyholder dividend scales in effect for 1999
had been continued. Any cash flows in excess of amounts assumed will be available for distribution over time to closed block policyholders
and will not be available to stockholders. If the closed block has insufficient funds to make guaranteed policy benefit payments, such
payments will be made from assets outside of the closed block. The closed block will continue in effect as long as any policy in the closed
block remains in-force. The expected life of the closed block is over 100 years.
The Company uses the same accounting principles to account for the participating policies included in the closed block as it used prior
to the Demutualization Date. However, the Company establishes a policyholder dividend obligation for earnings that will be paid to
policyholders as additional dividends as described below. The excess of closed block liabilities over closed block assets at the effective
date of the demutualization (adjusted to eliminate the impact of related amounts in accumulated other comprehensive income) represents
the estimated maximum future earnings from the closed block expected to result from operations attributed to the closed block after
income taxes. Earnings of the closed block are recognized in income over the period the policies and contracts in the closed block remain
in-force. Management believes that over time the actual cumulative earnings of the closed block will approximately equal the expected
cumulative earnings due to the effect of dividend changes. If, over the period the closed block remains in existence, the actual cumulative
F-43MetLife, Inc.
MetLife, Inc.
Notes to Consolidated Financial Statements — (Continued)
earnings of the closed block is greater than the expected cumulative earnings of the closed block, the Company will pay the excess of the
actual cumulative earnings of the closed block over the expected cumulative earnings to closed block policyholders as additional
policyholder dividends unless offset by future unfavorable experience of the closed block and, accordingly, will recognize only the
expected cumulative earnings in income with the excess recorded as a policyholder dividend obligation. If over such period, the actual
cumulative earnings of the closed block is less than the expected cumulative earnings of the closed block, the Company will recognize only
the actual earnings in income. However, the Company may change policyholder dividend scales in the future, which would be intended to
increase future actual earnings until the actual cumulative earnings equal the expected cumulative earnings.
Information regarding the closed block liabilities and assets designated to the closed block is as follows:
2007 2006
December 31,
(In millions)
Closed Block Liabilities
Future policy benefits . . . . . . . . . . . . . . . . . . . . . . . . . . . . . . . . . . . . . . . . . . . . . . . . . . . . . . . . . . . . . $43,362 $43,089
Other policyholder funds . . . . . . . . . . . . . . . . . . . . . . . . . . . . . . . . . . . . . . . . . . . . . . . . . . . . . . . . . . . 323 282
Policyholder dividends payable . . . . . . . . . . . . . . . . . . . . . . . . . . . . . . . . . . . . . . . . . . . . . . . . . . . . . . . 709 701
Policyholder dividend obligation . . . . . . . . . . . . . . . . . . . . . . . . . . . . . . . . . . . . . . . . . . . . . . . . . . . . . . 789 1,063
Payables for collateral under securities loaned and other transactions . . . . . . . . . . . . . . . . . . . . . . . . . . . . . . 5,610 6,483
Other liabilities . . . . . . . . . . . . . . . . . . . . . . . . . . . . . . . . . . . . . . . . . . . . . . . . . . . . . . . . . . . . . . . . . 290 192
Total closed block liabilities . . . . . . . . . . . . . . . . . . . . . . . . . . . . . . . . . . . . . . . . . . . . . . . . . . . . . . . . 51,083 51,810
Assets Designated to the Closed Block
Investments:
Fixed maturity securities available-for-sale, at estimated fair value (amortized cost: $29,631 and $30,286,
respectively) . . . . . . . . . . . . . . . . . . . . . . . . . . . . . . . . . . . . . . . . . . . . . . . . . . . . . . . . . . . . . . . . 30,481 31,255
Equity securities available-for-sale, at estimated fair value (cost: $1,555 and $1,184, respectively) . . . . . . . . . 1,875 1,484
Mortgage loans on real estate . . . . . . . . . . . . . . . . . . . . . . . . . . . . . . . . . . . . . . . . . . . . . . . . . . . . . . 7,472 7,848
Policy loans . . . . . . . . . . . . . . . . . . . . . . . . . . . . . . . . . . . . . . . . . . . . . . . . . . . . . . . . . . . . . . . . . . 4,290 4,212
Real estate and real estate joint ventures held-for-investment . . . . . . . . . . . . . . . . . . . . . . . . . . . . . . . . . . 297 242
Short-term investments . . . . . . . . . . . . . . . . . . . . . . . . . . . . . . . . . . . . . . . . . . . . . . . . . . . . . . . . . . 14 62
Other invested assets . . . . . . . . . . . . . . . . . . . . . . . . . . . . . . . . . . . . . . . . . . . . . . . . . . . . . . . . . . . 829 644
Total investments . . . . . . . . . . . . . . . . . . . . . . . . . . . . . . . . . . . . . . . . . . . . . . . . . . . . . . . . . . . . . 45,258 45,747
Cash and cash equivalents . . . . . . . . . . . . . . . . . . . . . . . . . . . . . . . . . . . . . . . . . . . . . . . . . . . . . . . . . 333 255
Accrued investment income . . . . . . . . . . . . . . . . . . . . . . . . . . . . . . . . . . . . . . . . . . . . . . . . . . . . . . . . . 485 517
Deferred income tax assets . . . . . . . . . . . . . . . . . . . . . . . . . . . . . . . . . . . . . . . . . . . . . . . . . . . . . . . . . 640 754
Premiums and other receivables . . . . . . . . . . . . . . . . . . . . . . . . . . . . . . . . . . . . . . . . . . . . . . . . . . . . . . 151 156
Total assets designated to the closed block . . . . . . . . . . . . . . . . . . . . . . . . . . . . . . . . . . . . . . . . . . . . . 46,867 47,429
Excess of closed block liabilities over assets designated to the closed block . . . . . . . . . . . . . . . . . . . . . . . . . 4,216 4,381
Amounts included in accumulated other comprehensive income (loss):
Unrealized investment gains (losses), net of income tax of $424 and $457, respectively . . . . . . . . . . . . . . . . 751 812
Unrealized gains (losses) on derivative instruments, net of income tax of ($19) and ($18), respectively . . . . . . . (33) (32)
Allocated to policyholder dividend obligation, net of income tax of ($284) and ($381), respectively . . . . . . . . . . (505) (681)
Total amounts included in accumulated other comprehensive income (loss). . . . . . . . . . . . . . . . . . . . . . . . . 213 99
Maximum future earnings to be recognized from closed block assets and liabilities . . . . . . . . . . . . . . . . . . . . . $ 4,429 $ 4,480
Information regarding the closed block policyholder dividend obligation is as follows:
2007 2006 2005
Years Ended December 31,
(In millions)
Balance at January 1, . . . . . . . . . . . . . . . . . . . . . . . . . . . . . . . . . . . . . . . . . . . . . . . . . . $1,063 $1,607 $2,243
Impact on revenues, net of expenses and income tax . . . . . . . . . . . . . . . . . . . . . . . . . . . . . — (114) (9)
Change in unrealized investment and derivative gains (losses) . . . . . . . . . . . . . . . . . . . . . . . . (274) (430) (627)
Balance at December 31, . . . . . . . . . . . . . . . . . . . . . . . . . . . . . . . . . . . . . . . . . . . . . . . $ 789 $1,063 $1,607
F-44 MetLife, Inc.
MetLife, Inc.
Notes to Consolidated Financial Statements — (Continued)
Information regarding the closed block revenues and expenses is as follows:
2007 2006 2005
Years Ended December 31,
(In millions)
Revenues
Premiums . . . . . . . . . . . . . . . . . . . . . . . . . . . . . . . . . . . . . . . . . . . . . . . . . . . . . . . . . . $2,870 $2,959 $3,062
Net investment income and other revenues . . . . . . . . . . . . . . . . . . . . . . . . . . . . . . . . . . . . 2,350 2,355 2,382
Net investment gains (losses) . . . . . . . . . . . . . . . . . . . . . . . . . . . . . . . . . . . . . . . . . . . . . 28 (130) 10
Total revenues . . . . . . . . . . . . . . . . . . . . . . . . . . . . . . . . . . . . . . . . . . . . . . . . . . . . . 5,248 5,184 5,454
Expenses
Policyholder benefits and claims . . . . . . . . . . . . . . . . . . . . . . . . . . . . . . . . . . . . . . . . . . . 3,457 3,474 3,478
Policyholder dividends. . . . . . . . . . . . . . . . . . . . . . . . . . . . . . . . . . . . . . . . . . . . . . . . . . 1,492 1,479 1,465
Change in policyholder dividend obligation . . . . . . . . . . . . . . . . . . . . . . . . . . . . . . . . . . . . — (114) (9)
Other expenses . . . . . . . . . . . . . . . . . . . . . . . . . . . . . . . . . . . . . . . . . . . . . . . . . . . . . . 231 247 263
Total expenses . . . . . . . . . . . . . . . . . . . . . . . . . . . . . . . . . . . . . . . . . . . . . . . . . . . . . 5,180 5,086 5,197
Revenues, net of expenses before income tax . . . . . . . . . . . . . . . . . . . . . . . . . . . . . . . . . . 68 98 257
Income tax . . . . . . . . . . . . . . . . . . . . . . . . . . . . . . . . . . . . . . . . . . . . . . . . . . . . . . . . . 21 34 90
Revenues, net of expenses and income tax from continuing operations . . . . . . . . . . . . . . . . . . 47 64 167
Revenues, net of expenses and income tax from discontinued operations . . . . . . . . . . . . . . . . — 1 —
Revenues, net of expenses, income taxes and discontinued operations . . . . . . . . . . . . . . . . . . $ 47 $ 65 $ 167
The change in the maximum future earnings of the closed block is as follows:
2007 2006 2005
Years Ended December 31,
(In millions)
Balance at December 31, . . . . . . . . . . . . . . . . . . . . . . . . . . . . . . . . . . . . . . . . . . . . . . . $4,429 $4,480 $4,545
Less:
Cumulative effect of a change in accounting principle, net of income tax . . . . . . . . . . . . . . . . (4) — —
Balance at January 1, . . . . . . . . . . . . . . . . . . . . . . . . . . . . . . . . . . . . . . . . . . . . . . . . . . 4,480 4,545 4,712
Change during year . . . . . . . . . . . . . . . . . . . . . . . . . . . . . . . . . . . . . . . . . . . . . . . . . . . $ (47) $ (65) $ (167)
MLIC charges the closed block with federal income taxes, state and local premium taxes, and other additive state or local taxes, as well
as investment management expenses relating to the closed block as provided in the Plan. MLIC also charges the closed block for
expenses of maintaining the policies included in the closed block.
10. Long-term and Short-term Debt
Long-term and short-term debt outstanding is as follows:
Range
Weighted
Average Maturity 2007 2006
December 31,
Interest Rates
(In millions)
Senior notes . . . . . . . . . . . . . . . . . . . . . . . . . . . . . . . . . . . . . . . 5.00%-6.75% 5.60% 2011-2035 $ 7,515 $ 7,196
Repurchase agreements . . . . . . . . . . . . . . . . . . . . . . . . . . . . . . . 2.83%-5.65% 4.49% 2008-2013 1,213 998
Surplus notes . . . . . . . . . . . . . . . . . . . . . . . . . . . . . . . . . . . . . . 7.63%-7.88% 7.76% 2015-2025 697 697
Fixed rate notes . . . . . . . . . . . . . . . . . . . . . . . . . . . . . . . . . . . . 5.50%-7.25% 6.68% 2008 73 107
Other notes with varying interest rates . . . . . . . . . . . . . . . . . . . . . . 3.44%-6.10% 4.99% 2009-2012 75 68
Capital lease obligations . . . . . . . . . . . . . . . . . . . . . . . . . . . . . . . 55 63
Total long-term debt . . . . . . . . . . . . . . . . . . . . . . . . . . . . . . . . . . 9,628 9,129
Total short-term debt . . . . . . . . . . . . . . . . . . . . . . . . . . . . . . . . . 667 1,449
Total. . . . . . . . . . . . . . . . . . . . . . . . . . . . . . . . . . . . . . . . . . . $10,295 $10,578
The aggregate maturities of long-term debt as of December 31, 2007 for the next five years are $458 million in 2008, $536 million in
2009, $285 million in 2010, $966 million in 2011, $471 million in 2012 and $6,912 million thereafter.
Repurchase agreements and capital lease obligations are collateralized and rank highest in priority, followed by unsecured senior debt
which consists of senior notes, fixed rate notes and other notes with varying interest rates, followed by subordinated debt which consists
of junior subordinated debentures. Payments of interest and principal on the Company’s surplus notes, which are subordinate to all other
obligations at the operating company level and senior to obligations at the Holding Company, may be made only with the prior approval of
the insurance department of the state of domicile. Collateral financing arrangements are supported by either surplus notes of subsidiaries
or financing arrangements with the Holding Company and accordingly have priority consistent with other such obligations.
F-45MetLife, Inc.
MetLife, Inc.
Notes to Consolidated Financial Statements — (Continued)
Senior Notes
In March 2007, RGA issued $300 million of 10-year senior notes with a fixed rate of 5.625%, payable semiannually. RGA used
$50 million of the net proceeds of the offering to repay existing debt during the year ended December 31, 2007.
The Holding Company repaid a $500 million 5.25% senior note which matured in December 2006 and a $1,006 million 3.911% senior
note which matured in May 2005. RGA repaid a $100 million 7.25% senior note which matured in April 2006.
In connection with financing the acquisition of Travelers on July 1, 2005, which is described in Note 2, the Holding Company issued the
following debt:
In June 2005, the Holding Company issued $1,000 million aggregate principal amount of 5.00% senior notes due June 15, 2015 at a
discount of $2.7 million ($997.3 million) and $1,000 million aggregate principal amount of 5.70% senior notes due June 15, 2035 at a
discount of $2.4 million ($997.6 million). In connection with the offering, the Holding Company incurred $12.4 million of issuance costs
which have been capitalized and included in other assets. These costs are being amortized using the effective interest method over the
respective term of the related senior notes.
In June 2005, the Holding Company issued 400 million pounds sterling ($729.2 million at issuance) aggregate principal amount of
5.25% senior notes due June 29, 2020 at a discount of 4.5 million pounds sterling ($8.1 million at issuance), for aggregate proceeds of
395.5 million pounds sterling ($721.1 million at issuance). The senior notes were initially offered and sold outside the United States in
reliance upon Regulation S under the Securities Act of 1933, as amended (the “Securities Act”). In connection with the offering, the Holding
Company incurred $3.7 million of issuance costs which have been capitalized and included in other assets. These costs are being
amortized using the effective interest method over the term of the related senior notes.
Repurchase Agreements with Federal Home Loan Bank
MetLife Bank, National Association (“MetLife Bank”) is a member of the FHLB of NY and holds $64 million and $54 million of common
stock of the FHLB of NY at December 31, 2007 and 2006, respectively, which is included in equity securities. MetLife Bank has also
entered into repurchase agreements with the FHLB of NY whereby MetLife Bank has issued repurchase agreements in exchange for cash
and for which the FHLB of NY has been granted a blanket lien on MetLife Bank’s residential mortgages and mortgage-backed securities to
collateralize MetLife Bank’s obligations under the repurchase agreements. MetLife Bank maintains control over these pledged assets, and
may use, commingle, encumber or dispose of any portion of the collateral as long as there is no event of default and the remaining qualified
collateral is sufficient to satisfy the collateral maintenance level. The repurchase agreements and the related security agreement
represented by this blanket lien provide that upon any event of default by MetLife Bank, the FHLB of NY’s recovery is limited to the
amount of MetLife Bank’s liability under the outstanding repurchase agreements. During the years ended December 31, 2007, 2006 and
2005, MetLife Bank received advances totaling $390 million, $260 million and $775 million, respectively, from the FHLB of NY. MetLife
Bank also made repayments of $175 million, $117 million and $25 million, respectively, for the years ended December 31, 2007, 2006 and
2005. The amount of the Company’s liability for repurchase agreements with the FHLB of NY was $1.2 billion and $998 million at
December 31, 2007 and 2006, respectively, which is included in long-term debt. The advances on these repurchase agreements are
collateralized by residential mortgage-backed securities and residential mortgage loans with fair values of $1.3 billion at both December 31,
2007 and 2006.
Surplus Notes
MLIC repaid a $250 million 7% surplus note which matured on November 1, 2005.
Short-term Debt
During the years ended December 31, 2007, 2006 and 2005, the Company’s short-term debt consisted of commercial paper with a
weighted average interest rate of 5.0%, 5.2% and 3.4%, respectively. During the years ended December 31, 2007, 2006 and 2005, the
commercial paper’s average daily balance was $1.6 billion, $1.9 billion and $1.0 billion, respectively, and was outstanding for an average
of 30 days, 39 days and 53 days, respectively.
Interest Expense
Interest expense related to the Company’s indebtedness included in other expenses was $633 million, $664 million and $529 million for
the years ended December 31, 2007, 2006 and 2005, respectively, and does not include interest expense on collateral financing
arrangements, junior subordinated debt securities, common equity units or shares subject to mandatory redemption. See Notes 11, 12, 13
and 14.
F-46 MetLife, Inc.
MetLife, Inc.
Notes to Consolidated Financial Statements — (Continued)
Credit and Committed Facilities and Letters of Credit
Credit Facilities. The Company maintains committed and unsecured credit facilities aggregating $4.0 billion as of December 31, 2007.
When drawn upon, these facilities bear interest at varying rates in accordance with the respective agreements. The facilities can be used
for general corporate purposes and at December 31, 2007, $3.0 billion of the facilities also served as back-up lines of credit for the
Company’s commercial paper programs. Information on these credit facilities as of December 31, 2007 is as follows:
Borrower(s) Expiration Capacity
Letter of
Credit
Issuances Drawdowns
Unused
Commitments
(In millions)
MetLife, Inc. and MetLife Funding, Inc. . . . . . . . . . . . . . . . . . . . . . . June 2012 (1) $3,000 $1,532 $— $1,468
MetLife Bank, N.A . . . . . . . . . . . . . . . . . . . . . . . . . . . . . . . . . . . . July 2008 (2) 200 — — 200
Reinsurance Group of America, Incorporated . . . . . . . . . . . . . . . . . . . May 2008 30 — 30 —
Reinsurance Group of America, Incorporated . . . . . . . . . . . . . . . . . . . September 2012(3) 750 406 — 344
Reinsurance Group of America, Incorporated . . . . . . . . . . . . . . . . . . . March 2011 44 — — 44
Total . . . . . . . . . . . . . . . . . . . . . . . . . . . . . . . . . . . . . . . . . . . $4,024 $1,938 $30 $2,056
(1) In June 2007, the Holding Company and MetLife Funding, Inc. entered into a $3.0 billion credit agreement with various financial
institutions, the proceeds of which are available to be used for general corporate purposes, to support their commercial paper programs
and for the issuance of letters of credit. All borrowings under the credit agreement must be repaid by June 2012, except that letters of
credit outstanding upon termination may remain outstanding until June 2013. The borrowers and the lenders under this facility may agree
to extend the term of all or part of the facility to no later than June 2014, except that letters of credit outstanding upon termination may
remain outstanding until June 2015. The $1.5 billion credit agreement, with an April 2009 expiration, and the $1.5 billion credit agreement,
with an April 2010 expiration, were both terminated in June 2007 and replaced by the aforementioned facility.
(2) In July 2007, the facility was extended for one year to July 2008.
(3) In September 2007, RGA and certain of its subsidiaries entered into a credit agreement with various financial institutions. Under the credit
agreement, RGA may borrow and obtain letters of credit for general corporate purposes for its own account or for the account of its
subsidiaries with an overall credit facility amount of up to $750 million. The credit agreement replaced a former credit agreement in the
amount of $600 million which was scheduled to expire on September 29, 2010.
Committed Facilities. Information on committed facilities as of December 31, 2007 is as follows:
Account Party/Borrower(s) Expiration Capacity Drawdowns
Letter of
Credit
Issuances
Unused
Commitments
Maturity
(Years)
(In millions)
Exeter Reassurance Company Ltd., MetLife, Inc., &
Missouri Re . . . . . . . . . . . . . . . . . . . . . . . . . June 2016 (1) $ 500 $ — $ 490 $ 10 8
Exeter Reassurance Company Ltd. . . . . . . . . . . . December 2027 (2) 650 — 410 240 20
Timberlake Financial L.L.C. . . . . . . . . . . . . . . . . June 2036 (3) 1,000 850 — 150 29
MetLife Reinsurance Company of South Carolina &
MetLife, Inc. . . . . . . . . . . . . . . . . . . . . . . . . June 2037 (4) 3,500 2,382 — 1,118 30
MetLife Reinsurance Company of Vermont &
MetLife, Inc. . . . . . . . . . . . . . . . . . . . . . . . . December 2037(2),(5) 2,896 — 1,235 1,661 30
Total . . . . . . . . . . . . . . . . . . . . . . . . . . . . . $8,546 $3,232 $2,135 $3,179
(1) Letters of credit and replacements or renewals thereof issued under this facility of $280 million, $10 million and $200 million are set to
expire no later than December 2015, March 2016 and June 2016, respectively.
(2) The Holding Company is a guarantor under this agreement.
(3) As described in Note 11, RGA may, at its option, offer up to $150 million of additional notes under this facility in the future.
(4) In May 2007, MetLife Reinsurance Company of South Carolina (“MRSC”), a wholly-owned subsidiary of the Company, terminated the
$2.0 billion amended and restated five-year letter of credit and reimbursement agreement entered into among the Holding Company,
MRSC and various financial institutions on April 25, 2005. In its place, the Company entered into a 30-year collateral financing
arrangement as described in Note 11, which may be extended by agreement of the Company and the financial institution on each
anniversary of the closing of the facility for an additional one-year period. As of December 31, 2007, $2.4 billion had been drawn upon
under the collateral financing arrangement.
(5) In December 2007, Exeter Reassurance Company Ltd. (“Exeter”) terminated four letters of credit, with expirations from March 2025
through December 2026, that were issued under a letter of credit facility with an unaffiliated financial institution in an aggregate amount of
$1.7 billion. The letters of credit had served as collateral for Exeter’s obligations under a reinsurance agreement that was recaptured by
MLI-USA in December 2007. MLI-USA immediately thereafter entered into a new reinsurance agreement with MetLife Reinsurance
Company of Vermont (“MRV”). To collateralize its reinsurance obligations, MRV and the Holding Company entered into a 30-year,
$2.9 billion letter of credit facility with an unaffiliated financial institution.
Letters of Credit. At December 31, 2007, the Company had outstanding $4.2 billion in letters of credit, all of which are associated with
the aforementioned credit facilities, from various financial institutions, of which $2.1 billion and $1.9 billion were part of committed and
F-47MetLife, Inc.
MetLife, Inc.
Notes to Consolidated Financial Statements — (Continued)
credit facilities, respectively. As commitments associated with letters of credit and financing arrangements may expire unused, these
amounts do not necessarily reflect the Company’s actual future cash funding requirements.
11. Collateral Financing Arrangements
Associated with the Closed Block
In December 2007, MLIC reinsured a portion of its closed block liabilities to MetLife Reinsurance Company of Charleston (“MRC”), a
wholly-owned subsidiary of the Company. In connection with this transaction, MRC issued, to investors placed by an unaffiliated financial
institution, $2.5 billion of 35-year surplus notes to provide statutory reserve support for the assumed closed block liabilities. Interest on the
surplus notes accrues at an annual rate of 3-month LIBOR plus 55 basis points, payable quarterly. The ability of MRC to make interest and
principal payments on the surplus notes is contingent upon South Carolina regulatory approval.
Simultaneous with issuing the surplus notes, the Holding Company entered into an agreement with the unaffiliated financial institution,
under which the Holding Company is entitled to the interest paid by MRC on the surplus notes of 3-month LIBOR plus 55 basis points in
exchange for the payment of 3-month LIBOR plus 112 basis points, payable quarterly. Under this agreement, the Holding Company may
also be required to make payments to the unaffiliated financial institution related to any decline in the market value of the surplus notes and
in connection with any early termination of this agreement.
A majority of the proceeds from the offering of the surplus notes were placed in trust to support MRC’s statutory obligations associated
with the assumed closed block liabilities. The trust is a VIE which is consolidated by the Company.
At December 31, 2007, the Company held assets in trust of $1.9 billion associated with the transaction. The Company’s consolidated
balance sheet includes these assets as fixed maturity securities. The Company’s consolidated statement of income includes the
investment returns on the assets held as collateral as net investment income and the interest on the collateral financing arrangement
is included as a component of other expenses.
Total interest expense was $5 million for the year ended December 31, 2007.
Associated with Secondary Guarantees
In May 2007, the Holding Company and MRSC entered into a 30-year collateral financing arrangement with an unaffiliated financial
institution that provides up to $3.5 billion of statutory reserve support for MRSC associated with reinsurance obligations under
intercompany reinsurance agreements. Such statutory reserves are associated with universal life secondary guarantees and are required
under U.S. Valuation of Life Policies Model Regulation (commonly referred to as Regulation A-XXX). At December 31, 2007, $2.4 billion had
been drawn upon under the collateral financing arrangement. The collateral financing arrangement may be extended by agreement of the
Holding Company and the unaffiliated financial institution on each anniversary of the closing.
Proceeds from the collateral financing arrangement were placed in trust to support MRSC’s statutory obligations associated with the
reinsurance of secondary guarantees. The trust is a VIE which is consolidated by the Company. The unaffiliated financial institution is
entitled to the return on the investment portfolio held by the trust.
Simultaneous with entering into the collateral financing arrangement, the Holding Company entered into an agreement with the same
unaffiliated financial institution under which the Holding Company is entitled to the return on the investment portfolio held by the trust
established in connection with this collateral financing arrangement in exchange for the payment of a stated rate of return to the unaffiliated
financial institution of 3-month LIBOR plus 70 basis points, payable quarterly. The Holding Company may also be required to make
payments to the unaffiliated financial institution, for deposit into the trust, related to any decline in the market value of the assets held by the
trust, as well as amounts outstanding upon maturity or early termination of the collateral financing arrangement.
At December 31, 2007, the Company held assets in trust of $2.3 billion associated with this transaction. The Company’s consolidated
balance sheet includes these assets as fixed maturity securities. The Company’s consolidated statement of income includes the
investment returns on the assets held as collateral as net investment income and the interest on the collateral financing arrangement
is included as a component of other expenses.
Transaction costs associated with the collateral financing arrangement of $5 million have been capitalized, are included in other assets,
and are amortized using the effective interest method over the period from the issuance of the collateral financing arrangement to its
expiration. Total interest expense was $84 million for the year ended December 31, 2007.
Associated with RGA
In June 2006, Timberlake Financial L.L.C., (“Timberlake Financial”), a subsidiary of RGA, completed an offering of $850 million of
Series A Floating Rate Insured Notes due June 2036 in a private placement. Interest on the notes accrues at an annual rate of 1-month
LIBOR plus 29 basis points payable monthly. The payment of interest and principal on the notes is insured through a financial guaranty
insurance policy with a third party. The notes represent senior, secured indebtedness of Timberlake Financial with no recourse to RGA or its
other subsidiaries. Up to $150 million of additional notes may be offered in the future. In order to make payments of principal and interest on
the notes, Timberlake Financial will rely upon the receipt of interest and principal payments on surplus note and dividend payments from its
wholly-owned subsidiary, Timberlake Reinsurance Company II (“Timberlake Re”), a South Carolina captive insurance company. The ability
of Timberlake Re to make interest and principal payments on the surplus note and dividend payments to Timberlake Financial is contingent
upon South Carolina regulatory approval and the performance of specified term life insurance policies with guaranteed level premiums
retroceded by RGA’s subsidiary, RGA Reinsurance Company (“RGA Reinsurance”), to Timberlake Re.
Proceeds from the offering of the notes, along with a $113 million direct investment by RGA, collateralize the notes and are not available
to satisfy the general obligations of RGA or the Company. Most of these assets were placed in a trust and provide long-term collateral as
support for statutory reserves required by U.S. Valuation of Life Policies Model Regulation (commonly referred to as Regulation XXX) on
term life insurance policies with guaranteed level premium periods reinsured by RGA Reinsurance. The trust is consolidated by Timberlake
Re which in-turn is consolidated by Timberlake Financial. Timberlake Financial is considered to be a VIE and RGA is considered to be the
primary beneficiary. As such, the results of Timberlake Financial have been consolidated by RGA and ultimately by the Company.
F-48 MetLife, Inc.
MetLife, Inc.
Notes to Consolidated Financial Statements — (Continued)
At December 31, 2007, the Company held assets in trust of $899 million associated with the transaction. In addition the Company held
$50 million in custody as of December 31, 2007. The Company’s consolidated balance sheets include the assets of Timberlake Financial
recorded as fixed maturity securities and other invested assets, which consists of the restricted cash and cash equivalents held in custody.
The Company’s consolidated statements of income include the investment returns on the assets held as collateral as investment income
and the interest on the notes is included as a component of other expenses.
Issuance costs associated with the offering of the notes of $13 million have been capitalized, are included in other assets, and are
amortized using the effective interest method over the estimated life of the notes. Total interest expense was $52 million and $26 million for
the years ended December 31, 2007 and 2006, respectively.
12. Junior Subordinated Debentures
Junior Subordinated Debentures Underlying Common Equity Units
In connection with the acquisition of Travelers on July 1, 2005, the Holding Company issued on June 21, 2005 $1,067 million 4.82%
Series A and $1,067 million 4.91% Series B junior subordinated debentures due no later than February 15, 2039 and February 15, 2040,
respectively, for a total of $2,134 million in connection with the common equity units more fully described in Note 13. Interest expense
related to the junior subordinated debentures underlying common equity units was $104 million, $104 million and $55 million for the years
ended December 31, 2007, 2006 and 2005, respectively.
Other Junior Subordinated Debentures Issued by the Holding Company
In December 2006, the Holding Company issued junior subordinated debentures with a face amount of $1.25 billion. The debentures
are scheduled for redemption on December 15, 2036; the final maturity of the debentures is December 15, 2066. The Holding Company
may redeem the debentures (i) in whole or in part, at any time on or after December 15, 2031 at their principal amount plus accrued and
unpaid interest to the date of redemption, or (ii) in certain circumstances, in whole or in part, prior to December 15, 2031 at their principal
amount plus accrued and unpaid interest to the date of redemption or, if greater, a make-whole price. Interest is payable semi-annually at a
fixed rate of 6.40% up to, but not including, December 15, 2036, the scheduled redemption date. In the event the debentures are not
redeemed on or before the scheduled redemption date, interest will accrue at an annual rate of 3-month LIBOR plus a margin equal to
2.205%, payable quarterly in arrears. The Holding Company has the right to, and in certain circumstances the requirement to, defer interest
payments on the debentures for a period up to ten years. Interest compounds during such periods of deferral. If interest is deferred for
more than five consecutive years, the Holding Company may be required to use proceeds from the sale of its common stock or warrants on
common stock to satisfy its obligation. In connection with the issuance of the debentures, the Holding Company entered into a
replacement capital covenant (“RCC”). As part of the RCC, the Holding Company agreed that it will not repay, redeem, or purchase
the debentures on or before December 15, 2056, unless, subject to certain limitations, it has received proceeds from the sale of specified
capital securities. The RCC will terminate upon the occurrence of certain events, including an acceleration of the debentures due to the
occurrence of an event of default. The RCC is not intended for the benefit of holders of the debentures and may not be enforced by them.
The RCC is for the benefit of holders of one or more other designated series of its indebtedness (which will initially be its 5.70% senior
notes due June 15, 2035). The Holding Company also entered into a replacement capital obligation which will commence in 2036 and
under which the Holding Company must use reasonable commercial efforts to raise replacement capital through the issuance of certain
qualifying capital securities. Issuance costs associated with the offering of the debentures of $13 million have been capitalized, are
included in other assets, and are amortized using the effective interest method over the period from the issuance date of the debentures
until their scheduled redemption. Interest expense on the debentures was $80 million and $2 million for the years ended December 31,
2007 and 2006, respectively.
In December 2007, MetLife Capital Trust IV (“Trust IV”), a VIE consolidated by the Company, issued exchangeable surplus trust
securities (the “Trust Securities”) with a face amount of $700 million and a discount of $6 million ($694 million). The Trust Securities will be
exchanged into a like amount of Holding Company junior subordinated debentures on December 15, 2037, the scheduled redemption
date; mandatorily under certain circumstances; and at any time upon the Holding Company exercising its option to redeem the securities.
The Trust Securities will be exchanged for junior subordinated debentures prior to repayment. The final maturity of the debentures is
December 15, 2067. The Holding Company may cause the redemption of the Trust Securities or debentures (i) in whole or in part, at any
time on or after December 15, 2032 at their principal amount plus accrued and unpaid interest to the date of redemption, or (ii) in certain
circumstances, in whole or in part, prior to December 15, 2032 at their principal amount plus accrued and unpaid interest to the date of
redemption or, if greater, a make-whole price. Interest on the Trust Securities or debentures is payable semi-annually at a fixed rate of
7.875% up to, but not including, December 15, 2037, the scheduled redemption date. In the event the Trust Securities or debentures are
not redeemed on or before the scheduled redemption date, interest will accrue at an annual rate of 3-month LIBOR plus a margin equal to
3.96%, payable quarterly in arrears. The Holding Company has the right to, and in certain circumstances the requirement to, defer interest
payments on the Trust Securities or debentures for a period up to ten years. Interest compounds during such periods of deferral. If interest
is deferred for more than five consecutive years, the Holding Company may be required to use proceeds from the sale of its common stock
or warrants on common stock to satisfy its obligation. In connection with the issuance of the Trust Securities, the Holding Company entered
into a RCC. As a part of the RCC, the Holding Company agreed that it will not repay, redeem, or purchase the debentures on or before
December 15, 2057, unless, subject to certain limitations, it has received proceeds from the sale of specified capital securities. The RCC
will terminate upon the occurrence of certain events, including an acceleration of the debentures due to the occurrence of an event of
default. The RCC is not intended for the benefit of holders of the debentures and may not be enforced by them. The RCC is for the benefit
of holders of one or more other designated series of its indebtedness (which will initially be its 5.70% senior notes due June 15, 2035). The
Holding Company also entered into a replacement capital obligation which will commence in 2037 and under which the Holding Company
must use reasonable commercial efforts to raise replacement capital through the issuance of certain qualifying capital securities. Issuance
costs associated with the offering of the Trust Securities of $10 million have been capitalized, are included in other assets, and are
F-49MetLife, Inc.
MetLife, Inc.
Notes to Consolidated Financial Statements — (Continued)
amortized using the effective interest method over the period from the issuance date of the Trust Securities until their scheduled
redemption. Interest expense on the Trust Securities was $3 million for the year ended December 31, 2007.
Junior Subordinated Debentures Issued by RGA
In December 2005, RGA issued junior subordinated debentures with a face amount of $400 million. Interest is payable semi-annually at
a fixed rate of 6.75% up to but not including the scheduled redemption date, December 15, 2015. The debentures may be redeemed (i) in
whole or in part, at any time on or after December 15, 2015 at their principal amount plus accrued and unpaid interest to the date of
redemption, or (ii) in whole or in part, prior to December 15, 2015 at their principal amount plus accrued and unpaid interest to the date of
redemption or, if greater, a make-whole price. In the event the debentures are not redeemed on or before the scheduled redemption date of
December 15, 2015, interest on these debentures will accrue at an annual rate of 3-month LIBOR plus a margin equal to 2.665%, payable
quarterly in arrears. The final maturity of the debentures is December 15, 2065. RGA has the right to, and in certain circumstances the
requirement to, defer interest payments on the debentures for a period up to ten years. Upon an optional or mandatory deferral of interest
payments, RGA is generally not permitted to pay common stock dividends or make payments of interest or principal on securities which
rank equal or junior to the subordinated debentures, until the accrued and unpaid interest on the subordinated debentures is paid. Interest
compounds during periods of deferral. Issuance costs associated with the offering of the debentures of $6 million have been capitalized,
are included in other assets, and are amortized using the effective interest method over the period from the issuance date of the
debentures until their scheduled redemption. Interest expense on the debentures was $27 million, $27 million and $2 million for the years
ended December 31, 2007, 2006 and 2005, respectively.
13. Common Equity Units
In connection with financing the acquisition of Travelers on July 1, 2005, which is described in Note 2, the Holding Company distributed
and sold 82.8 million 6.375% common equity units for $2,070 million in proceeds in a registered public offering on June 21, 2005. As
described below, the common equity units consist of interests in trust preferred securities issued by MetLife Capital Trusts II and III, and
stock purchase contracts issued by the Holding Company. The only assets of MetLife Capital Trusts II and III are junior subordinated
debentures issued by the Holding Company.
Common Equity Units
Each common equity unit has an initial stated amount of $25 per unit and consists of: (i) a 1/80 or 1.25% ($12.50), undivided beneficial
ownership interest in a series A trust preferred security of MetLife Capital Trust II (“Series A Trust”), with an initial liquidation amount of
$1,000; (ii) a 1
⁄80 or 1.25% ($12.50), undivided beneficial ownership interest in a series B trust preferred security of MetLife Capital Trust III
(“Series B Trust” and, together with the Series A Trust, the “Capital Trusts”), with an initial liquidation amount of $1,000; (iii) a stock purchase
contract under which the holder of the common equity unit will purchase and the Holding Company will sell, on each of the initial stock
purchase date and the subsequent stock purchase date, a variable number of shares of the Holding Company’s common stock, par value
$0.01 per share, for a purchase price of $12.50.
Junior Subordinated Debentures Issued to Support Trust Common and Preferred Securities
The Holding Company issued $1,067 million 4.82% Series A and $1,067 million 4.91% Series B junior subordinated debt securities due
no later than February 15, 2039 and February 15, 2040, respectively, for a total of $2,134 million, in exchange for $2,070 million in
aggregate proceeds from the sale of the trust preferred securities by the Capital Trusts and $64 million in trust common securities issued
equally by the Capital Trusts. The common and preferred securities of the Capital Trusts, totaling $2,134 million, represent undivided
beneficial ownership interests in the assets of the Capital Trusts, have no stated maturity and must be redeemed upon maturity of the
corresponding series of junior subordinated debt securities — the sole assets of the respective Capital Trusts. The Series A Trust and
Series B Trust will each make quarterly distributions on the common and preferred securities at an annual rate of 4.82% and 4.91%,
respectively.
The trust common securities, which are held by the Holding Company, represent a 3% interest in the Trusts and are reflected as fixed
maturity securities in the consolidated balance sheet of MetLife, Inc. The Capital Trusts are VIEs in accordance with FIN 46(r), and the
Company does not consolidate its interest in MetLife Capital Trusts II and III as it is not the primary beneficiary of either of the Capital Trusts.
The Holding Company has directly guaranteed the repayment of the trust preferred securities to the holders thereof to the extent that
there are funds available in the Capital Trusts. The guarantee will remain in place until the full redemption of the trust preferred securities.
The trust preferred securities held by the common equity unit holders are pledged to the Holding Company to collateralize the obligation of
the common equity unit holders under the related stock purchase contracts. The common equity unit holder may substitute certain zero
coupon treasury securities in place of the trust preferred securities as collateral under the stock purchase contract.
The trust preferred securities have remarketing dates which correspond with the initial and subsequent stock purchase dates to provide
the holders of the common equity units with the proceeds to exercise the stock purchase contracts. The initial stock purchase date is
expected to be August 15, 2008, but could be deferred for quarterly periods until February 15, 2009, and the subsequent stock purchase
date is expected to be February 15, 2009, but could be deferred for quarterly periods until February 15, 2010. At the remarketing date, the
remarketing agent will have the ability to reset the interest rate on the trust preferred securities to generate sufficient remarketing proceeds
to satisfy the common equity unit holder’s obligation under the stock purchase contract, subject to a reset cap for each of the first two
attempted remarketings of each series. The interest rate on the supporting junior subordinated debt securities issued by the Holding
Company will be reset at a commensurate rate. If the initial remarketing is unsuccessful, the remarketing agent will attempt to remarket the
trust preferred securities, as necessary, in subsequent quarters through February 15, 2009 for the Series A trust preferred securities and
through February 15, 2010 for the Series B trust preferred securities. The final attempt at remarketing will not be subject to the reset cap. If
all remarketing attempts are unsuccessful, the Holding Company has the right, as a secured party, to apply the liquidation amount on the
trust preferred securities to the common equity unit holders obligation under the stock purchase contract and to deliver to the common
F-50 MetLife, Inc.
MetLife, Inc.
Notes to Consolidated Financial Statements — (Continued)
equity unit holder a junior subordinated debt security payable on August 15, 2010 at an annual rate of 4.82% and 4.91% on the Series A
and Series B trust preferred securities, respectively, in payment of any accrued and unpaid distributions.
Stock Purchase Contracts
Each stock purchase contract requires the holder of the common equity unit to purchase, and the Holding Company to sell, for $12.50,
on each of the initial stock purchase date and the subsequent stock purchase date, a number of newly issued or treasury shares of the
Holding Company’s common stock, par value $0.01 per share, equal to the applicable settlement rate. The settlement rate at the
respective stock purchase date will be calculated based on the closing price of the common stock during a specified 20-day period
immediately preceding the applicable stock purchase date. If the market value of the Holding Company’s common stock is less than the
threshold appreciation price of $53.10 but greater than $43.35, the reference price, the settlement rate will be a number of the Holding
Company’s common stock equal to the stated amount of $12.50 divided by the market value. If the market value is less than or equal to the
reference price, the settlement rate will be 0.28835 shares of the Holding Company’s common stock. If the market value is greater than or
equal to the threshold appreciation price, the settlement rate will be 0.23540 shares of the Holding Company’s common stock as adjusted
in accordance with the terms of the stock purchase contracts. Accordingly, upon settlement in the aggregate, the Holding Company will
receive proceeds of $2,070 million and issue between 39.0 million and 47.8 million shares of its common stock. The stock purchase
contract may be exercised at the option of the holder at any time prior to the settlement date. However, upon early settlement, the holder
will receive the minimum settlement rate.
The stock purchase contracts further require the Holding Company to pay the holder of the common equity unit quarterly contract
payments on the stock purchase contracts at the annual rate of 1.510% on the stated amount of $25 per stock purchase contract until the
initial stock purchase date and at the annual rate of 1.465% on the remaining stated amount of $12.50 per stock purchase contract
thereafter.
The quarterly distributions on the Series A and Series B trust preferred securities of 4.82% and 4.91%, respectively, combined with the
contract payments on the stock purchase contract of 1.510%, (1.465% after the initial stock purchase date) result in the 6.375% yield on
the common equity units.
If the Holding Company defers any of the contract payments on the stock purchase contract, then it will accrue additional amounts on
the deferred amounts at the annual rate of 6.375% until paid, to the extent permitted by law.
The value of the stock purchase contracts at issuance, $96.6 million, were calculated as the present value of the future contract
payments due under the stock purchase contract of 1.510% through the initial stock purchase date, and 1.465% up to the subsequent
stock purchase date, discounted at the interest rate on the supporting junior subordinated debt securities issued by the Holding Company,
4.82% or 4.91% on the Series A and Series B trust preferred securities, respectively. The value of the stock purchase contracts was
recorded in other liabilities with an offsetting decrease in additional paid-in capital. The other liability balance related to the stock purchase
contracts will accrue interest at the discount rate of 4.82% or 4.91%, as applicable, with an offsetting increase to interest expense. When
the contract payments are made under the stock purchase contracts they will reduce the other liability balance. During the years ended
December 31, 2007, 2006 and 2005, the Holding Company increased the other liability balance for the accretion of the discount on the
contract payment of $2 million, $3 million and $2 million and made contract payments of $31 million, $31 million and $13 million,
respectively.
Issuance Costs
In connection with the offering of common equity units, the Holding Company incurred $55.3 million of issuance costs of which
$5.8 million relate to the issuance of the junior subordinated debt securities underlying common equity units which fund the Series A and
Series B trust preferred securities and $49.5 million relate to the expected issuance of the common stock under the stock purchase
contracts. The $5.8 million in debt issuance costs have been capitalized, are included in other assets, and are being amortized using the
effective interest method over the period from issuance date of the common equity units to the initial and subsequent stock purchase date.
The remaining $49.5 million of costs relate to the common stock issuance under the stock purchase contracts and have been recorded as
a reduction of additional paid-in capital.
Earnings Per Common Share
The stock purchase contracts are reflected in diluted earnings per common share using the treasury stock method, and are dilutive
when the average closing price of the Company’s common stock for each of the 20 trading days before the close of the accounting period
is greater than or equal to the threshold appreciation price of $53.10. During the years ended December 31, 2007 and 2006, the average
closing price for each of the 20 trading days before December 31 was greater than the threshold appreciation price. Accordingly, the stock
purchase contracts were included in diluted earnings per common share for the years ended December 31, 2007 and 2006. During the
period from the date of issuance through December 31, 2005, the average closing price for each of the 20 trading days before December
31 was less than the threshold appreciate price. Accordingly, the stock purchase contracts were excluded in diluted earnings per common
share for the year ended December 31, 2005. See Note 20.
14. Shares Subject to Mandatory Redemption and Company-Obligated Mandatorily Redeemable Securities of
Subsidiary Trusts
GenAmerica Capital I. In June 1997, GenAmerica Corporation (“GenAmerica”) issued $125 million of 8.525% capital securities
through a wholly-owned subsidiary trust, GenAmerica Capital I. In October 2007, GenAmerica redeemed these securities which were due
to mature on June 30, 2027. As a result of this redemption, the Company recognized additional interest expense of $10 million. Capital
securities outstanding were $119 million, net of unamortized discounts of $6 million at December 31, 2006. Interest expense on these
instruments is included in other expenses and was $20 million, $11 million and $11 million for the years ended December 31, 2007, 2006
and 2005, respectively.
F-51MetLife, Inc.
MetLife, Inc.
Notes to Consolidated Financial Statements — (Continued)
RGA Capital Trust I. In December 2001, RGA, through its wholly-owned trust, RGA Capital Trust I (the “RGA Trust”), issued 4,500,000
Preferred Income Equity Redeemable Securities (“PIERS”) Units. Each PIERS unit consists of: (i) a preferred security issued by the RGA
Trust, having a stated liquidation amount of $50 per unit, representing an undivided beneficial ownership interest in the assets of the RGA
Trust, which consist solely of junior subordinated debentures issued by RGA which have a principal amount at maturity of $50 and a stated
maturity of March 18, 2051; and (ii) a warrant to purchase, at any time prior to December 15, 2050, 1.2508 shares of RGA stock at an
exercise price of $50.
The fair market value of the warrant on the issuance date was $14.87 and is detachable from the preferred security. RGA fully and
unconditionally guarantees, on a subordinated basis, the obligations of the Trust under the preferred securities. The preferred securities
and subordinated debentures were issued at a discount (original issue discount) to the face or liquidation value of $14.87 per security. The
securities will accrete to their $50 face/liquidation value over the life of the security on a level yield basis. The weighted average effective
interest rate on the preferred securities and the subordinated debentures is 8.25% per annum. Capital securities outstanding were
$159 million, net of unamortized discounts of $66 million at both December 31, 2007 and 2006. Interest expense on these instruments is
included in other expenses and was $13 million for each of the years ended December 31, 2007, 2006 and 2005.
15. Income Taxes
The provision for income tax from continuing operations is as follows:
2007 2006 2005
Years Ended December 31,
(In millions)
Current:
Federal . . . . . . . . . . . . . . . . . . . . . . . . . . . . . . . . . . . . . . . . . . . . . . . . . . . . . . . . . . $ 435 $ 618 $ 553
State and local . . . . . . . . . . . . . . . . . . . . . . . . . . . . . . . . . . . . . . . . . . . . . . . . . . . . . 15 39 63
Foreign . . . . . . . . . . . . . . . . . . . . . . . . . . . . . . . . . . . . . . . . . . . . . . . . . . . . . . . . . . 210 156 111
Subtotal . . . . . . . . . . . . . . . . . . . . . . . . . . . . . . . . . . . . . . . . . . . . . . . . . . . . . . . . . 660 813 727
Deferred:
Federal . . . . . . . . . . . . . . . . . . . . . . . . . . . . . . . . . . . . . . . . . . . . . . . . . . . . . . . . . . $1,082 $ 220 $ 470
State and local . . . . . . . . . . . . . . . . . . . . . . . . . . . . . . . . . . . . . . . . . . . . . . . . . . . . . 31 2 14
Foreign . . . . . . . . . . . . . . . . . . . . . . . . . . . . . . . . . . . . . . . . . . . . . . . . . . . . . . . . . . (14) 62 11
Subtotal . . . . . . . . . . . . . . . . . . . . . . . . . . . . . . . . . . . . . . . . . . . . . . . . . . . . . . . . . 1,099 284 495
Provision for income tax . . . . . . . . . . . . . . . . . . . . . . . . . . . . . . . . . . . . . . . . . . . . . . . . $1,759 $1,097 $1,222
The reconciliation of the income tax provision at the U.S. statutory rate to the provision for income tax as reported for continuing
operations is as follows:
2007 2006 2005
Years Ended December 31,
(In millions)
Tax provision at U.S. statutory rate . . . . . . . . . . . . . . . . . . . . . . . . . . . . . . . . . . . . . . . . . $2,114 $1,459 $1,503
Tax effect of:
Tax-exempt investment income . . . . . . . . . . . . . . . . . . . . . . . . . . . . . . . . . . . . . . . . . . (295) (296) (169)
State and local income tax . . . . . . . . . . . . . . . . . . . . . . . . . . . . . . . . . . . . . . . . . . . . . 39 23 35
Prior year tax . . . . . . . . . . . . . . . . . . . . . . . . . . . . . . . . . . . . . . . . . . . . . . . . . . . . . 70 (10) (31)
Foreign tax rate differential and change in valuation allowance . . . . . . . . . . . . . . . . . . . . . . (116) (57) (44)
Foreign operations repatriation . . . . . . . . . . . . . . . . . . . . . . . . . . . . . . . . . . . . . . . . . . — — (27)
Other, net. . . . . . . . . . . . . . . . . . . . . . . . . . . . . . . . . . . . . . . . . . . . . . . . . . . . . . . . (53) (22) (45)
Provision for income tax . . . . . . . . . . . . . . . . . . . . . . . . . . . . . . . . . . . . . . . . . . . . . . . . $1,759 $1,097 $1,222
Included in the 2005 total tax provision was a $27 million tax benefit related to the repatriation of foreign earnings pursuant to Internal
Revenue Code Section 965 for which a U.S. deferred tax position had previously been recorded.
F-52 MetLife, Inc.
MetLife, Inc.
Notes to Consolidated Financial Statements — (Continued)
Deferred income tax represents the tax effect of the differences between the book and tax basis of assets and liabilities. Net deferred
income tax assets and liabilities consisted of the following:
2007 2006
December 31,
(In millions)
Deferred income tax assets:
Policyholder liabilities and receivables . . . . . . . . . . . . . . . . . . . . . . . . . . . . . . . . . . . . . . . . . . . . $ 4,026 $ 4,078
Net operating loss carryforwards . . . . . . . . . . . . . . . . . . . . . . . . . . . . . . . . . . . . . . . . . . . . . . . 920 1,368
Employee benefits . . . . . . . . . . . . . . . . . . . . . . . . . . . . . . . . . . . . . . . . . . . . . . . . . . . . . . . . . 176 472
Capital loss carryforwards . . . . . . . . . . . . . . . . . . . . . . . . . . . . . . . . . . . . . . . . . . . . . . . . . . . . 162 156
Tax credit carryforwards . . . . . . . . . . . . . . . . . . . . . . . . . . . . . . . . . . . . . . . . . . . . . . . . . . . . . 24 —
Intangibles . . . . . . . . . . . . . . . . . . . . . . . . . . . . . . . . . . . . . . . . . . . . . . . . . . . . . . . . . . . . . . — 22
Litigation-related and government mandated . . . . . . . . . . . . . . . . . . . . . . . . . . . . . . . . . . . . . . . . 113 65
Other . . . . . . . . . . . . . . . . . . . . . . . . . . . . . . . . . . . . . . . . . . . . . . . . . . . . . . . . . . . . . . . . . 247 198
5,668 6,359
Less: Valuation allowance . . . . . . . . . . . . . . . . . . . . . . . . . . . . . . . . . . . . . . . . . . . . . . . . . . . . 135 239
5,533 6,120
Deferred income tax liabilities:
Investments . . . . . . . . . . . . . . . . . . . . . . . . . . . . . . . . . . . . . . . . . . . . . . . . . . . . . . . . . . . . . 2,266 1,839
Intangibles . . . . . . . . . . . . . . . . . . . . . . . . . . . . . . . . . . . . . . . . . . . . . . . . . . . . . . . . . . . . . . 32 —
DAC . . . . . . . . . . . . . . . . . . . . . . . . . . . . . . . . . . . . . . . . . . . . . . . . . . . . . . . . . . . . . . . . . . 5,153 5,433
Net unrealized investment gains . . . . . . . . . . . . . . . . . . . . . . . . . . . . . . . . . . . . . . . . . . . . . . . . 423 994
Other . . . . . . . . . . . . . . . . . . . . . . . . . . . . . . . . . . . . . . . . . . . . . . . . . . . . . . . . . . . . . . . . . 116 132
7,990 8,398
Net deferred income tax liability . . . . . . . . . . . . . . . . . . . . . . . . . . . . . . . . . . . . . . . . . . . . . . . . . . $(2,457) $(2,278)
Domestic net operating loss carryforwards amount to $2,057 million at December 31, 2007 and will expire beginning in 2019. Foreign
net operating loss carryforwards amount to $725 million at December 31, 2007 and were generated in various foreign countries with
expiration periods of five years to indefinite expiration. Capital loss carryforwards amount to $463 million at December 31, 2007 and will
expire beginning in 2010. Tax credit carryforwards amount to $24 million at December 31, 2007.
The Company has recorded a valuation allowance related to tax benefits of certain foreign net operating loss carryforwards. The
valuation allowance reflects management’s assessment, based on available information, that it is more likely than not that the deferred
income tax asset for certain foreign net operating loss carryforwards will not be realized. The tax benefit will be recognized when
management believes that it is more likely than not that these deferred income tax assets are realizable. In 2007, the Company recorded a
reduction of $104 million to the deferred income tax valuation allowance related to certain foreign net operating loss carryforwards and
other deferred tax assets.
The Company files income tax returns with the U.S. federal government and various state and local jurisdictions, as well as foreign
jurisdictions. The Company is under continuous examination by the Internal Revenue Service (“IRS”) and other tax authorities in jurisdictions
in which the Company has significant business operations. The income tax years under examination vary by jurisdiction. With a few
exceptions, the Company is no longer subject to U.S. federal, state and local, or foreign income tax examinations by tax authorities for
years prior to 2000. In the first quarter of 2005, the IRS commenced an examination of the Company’s U.S. income tax returns for 2000
through 2002 that is anticipated to be completed in 2008.
As a result of the implementation of FIN 48 on January 1, 2007, the Company recognized a $52 million increase in the liability for
unrecognized tax benefits, a $4 million decrease in the interest liability for unrecognized tax benefits, and a corresponding reduction to the
January 1, 2007 balance of retained earnings of $37 million, net of $11 million of minority interest. The Company’s total amount of
unrecognized tax benefits upon adoption of FIN 48 was $1,128 million. The Company reclassified, at adoption, $611 million of current
income tax payables to the liability for unrecognized tax benefits included within other liabilities. The Company also reclassified, at
adoption, $465 million of deferred income tax liabilities, for which the ultimate deductibility is highly certain but for which there is uncertainty
about the timing of such deductibility, to the liability for unrecognized tax benefits. Because of the impact of deferred tax accounting, other
than interest and penalties, the disallowance of the shorter deductibility period would not affect the annual effective tax rate but would
accelerate the payment of cash to the taxing authority to an earlier period. The total amount of unrecognized tax benefits as of January 1,
2007 that would affect the effective tax rate, if recognized, was $680 million. The Company also had $240 million of accrued interest,
included within other liabilities, as of January 1, 2007. The Company classifies interest accrued related to unrecognized tax benefits in
interest expense, while penalties are included within income tax expense.
As of December 31, 2007, the Company’s total amount of unrecognized tax benefits is $1,038 million and the total amount of
unrecognized tax benefits that would affect the effective tax rate, if recognized, is $593 million. The total amount of unrecognized tax
benefits decreased by $90 million from the date of adoption primarily due to settlements reached with the IRS with respect to certain
significant issues involving demutualization, post-sale purchase price adjustments, and reinsurance offset by additions for tax positions of
the current year. As a result of the settlements, items within the liability for unrecognized tax benefits, in the amount of $177 million, were
reclassified to current and deferred income taxes, as applicable, and a payment of $156 million was made in December of 2007 with the
remaining $21 million to be paid in future years. In addition, the Company’s liability for unrecognized tax benefits may change significantly in
F-53MetLife, Inc.
MetLife, Inc.
Notes to Consolidated Financial Statements — (Continued)
the next 12 months pending the outcome of remaining issues associated with the current IRS audit including demutualization, leasing, tax-
exempt income, transfer pricing and tax credits. Management is working to resolve the remaining audit items directly with IRS auditors as
well as through available accelerated IRS resolution programs and may protest any unresolved issues through the IRS appeals process
and, possibly, litigation, the timing and extent of which is uncertain. Therefore, a reasonable estimate of the range of a payment or change
in the liability cannot be made at this time; however, the Company continues to believe that the ultimate resolution of the issues will not
result in a material effect on its consolidated financial statements, although the resolution of income tax matters could impact the
Company’s effective tax rate for a particular future period.
A reconciliation of the beginning and ending amount of unrecognized tax benefits for the year ended December 31, 2007, is as follows:
Total Unrecognized
Tax Benefits
(In millions)
Balance at January 1, 2007 (date of adoption) . . . . . . . . . . . . . . . . . . . . . . . . . . . . . . . . . . . . . . . . . $1,128
Additions for tax positions of prior years . . . . . . . . . . . . . . . . . . . . . . . . . . . . . . . . . . . . . . . . . . . . . 73
Reductions for tax positions of prior years . . . . . . . . . . . . . . . . . . . . . . . . . . . . . . . . . . . . . . . . . . . . (59)
Additions for tax positions of current year . . . . . . . . . . . . . . . . . . . . . . . . . . . . . . . . . . . . . . . . . . . . 85
Reductions for tax positions of current year . . . . . . . . . . . . . . . . . . . . . . . . . . . . . . . . . . . . . . . . . . . (8)
Settlements with tax authorities . . . . . . . . . . . . . . . . . . . . . . . . . . . . . . . . . . . . . . . . . . . . . . . . . . . (177)
Lapses of statutes of limitations. . . . . . . . . . . . . . . . . . . . . . . . . . . . . . . . . . . . . . . . . . . . . . . . . . . (4)
Balance at December 31, 2007 . . . . . . . . . . . . . . . . . . . . . . . . . . . . . . . . . . . . . . . . . . . . . . . . . . . $1,038
During the year ended December 31, 2007, the Company recognized $98 million in interest expense associated with the liability for
unrecognized tax benefits. As of December 31, 2007, the Company had $252 million of accrued interest associated with the liability for
unrecognized tax benefits. The $12 million increase, from the date of adoption, in accrued interest associated with the liability for
unrecognized tax benefits resulted from an increase of $98 million of interest expense and an $86 million decrease primarily resulting from
the aforementioned IRS settlements. During 2007, $73 million of the $86 million, resulting from IRS settlements, has been reclassified to
current income tax payable and the remaining $13 million reduced interest expense.
On September 25, 2007, the IRS issued Revenue Ruling 2007-61, which announced its intention to issue regulations with respect to
certain computational aspects of the Dividends Received Deduction (“DRD”) on separate account assets held in connection with variable
annuity contracts. Revenue Ruling 2007-61 suspended a revenue ruling issued in August 2007 that would have changed accepted
industry and IRS interpretations of the statutes governing these computational questions. Any regulations that the IRS ultimately proposes
for issuance in this area will be subject to public notice and comment, at which time insurance companies and other interested parties will
have the opportunity to raise legal and practical questions about the content, scope and application of such regulations. As a result, the
ultimate timing and substance of any such regulations are unknown at this time. For the year ended December 31, 2007, the Company
recognized an income tax benefit of $188 million related to the separate account DRD.
16. Contingencies, Commitments and Guarantees
Contingencies
Litigation
The Company is a defendant in a large number of litigation matters. In some of the matters, very large and/or indeterminate amounts,
including punitive and treble damages, are sought. Modern pleading practice in the United States permits considerable variation in the
assertion of monetary damages or other relief. Jurisdictions may permit claimants not to specify the monetary damages sought or may
permit claimants to state only that the amount sought is sufficient to invoke the jurisdiction of the trial court. In addition, jurisdictions may
permit plaintiffs to allege monetary damages in amounts well exceeding reasonably possible verdicts in the jurisdiction for similar matters.
This variability in pleadings, together with the actual experience of the Company in litigating or resolving through settlement numerous
claims over an extended period of time, demonstrate to management that the monetary relief which may be specified in a lawsuit or claim
bears little relevance to its merits or disposition value. Thus, unless stated below, the specific monetary relief sought is not noted.
Due to the vagaries of litigation, the outcome of a litigation matter and the amount or range of potential loss at particular points in time
may normally be inherently impossible to ascertain with any degree of certainty. Inherent uncertainties can include how fact finders will view
individually and in their totality documentary evidence, the credibility and effectiveness of witnesses’ testimony, and how trial and appellate
courts will apply the law in the context of the pleadings or evidence presented, whether by motion practice, or at trial or on appeal.
Disposition valuations are also subject to the uncertainty of how opposing parties and their counsel will themselves view the relevant
evidence and applicable law.
On a quarterly and annual basis, the Company reviews relevant information with respect to litigation and contingencies to be reflected in
the Company’s consolidated financial statements. The review includes senior legal and financial personnel. In 2007, the Company received
$39 million upon the resolution of an indemnification claim associated with the 2000 acquisition of General American Life Insurance
Company (“GALIC”), and the Company reduced legal liabilities by $38 million after the settlement of certain cases. Unless stated below,
estimates of possible losses or ranges of loss for particular matters cannot in the ordinary course be made with a reasonable degree of
certainty. Liabilities are established when it is probable that a loss has been incurred and the amount of the loss can be reasonably
estimated. Liabilities have been established for a number of the matters noted below; in 2007 the Company increased legal liabilities for
pending sales practices, employment, property and casualty and intellectual property litigation matters against the Company. It is possible
that some of the matters could require the Company to pay damages or make other expenditures or establish accruals in amounts that
could not be estimated as of December 31, 2007.
F-54 MetLife, Inc.
MetLife, Inc.
Notes to Consolidated Financial Statements — (Continued)
Demutualization Actions
Several lawsuits were brought in 2000 challenging the fairness of the Plan and the adequacy and accuracy of MLIC’s disclosure to
policyholders regarding the Plan. The actions discussed below name as defendants some or all of MLIC, the Holding Company, and
individual directors. MLIC, the Holding Company, and the individual directors believe they have meritorious defenses to the plaintiffs’ claims
and are contesting vigorously all of the plaintiffs’ claims in these actions.
Fiala, et al. v. Metropolitan Life Ins. Co., et al. (Sup. Ct., N.Y. County, filed March 17, 2000). The plaintiffs in the consolidated state
court class actions seek compensatory relief and punitive damages against MLIC, the Holding Company, and individual directors. On
January 30, 2007, the trial court signed an order certifying a litigation class of present and former policyholders on plaintiffs’ claim that
defendants violated section 7312 of the New York Insurance Law, but denying plaintiffs’ motion to certify a litigation class with respect to a
common law fraud claim. Plaintiffs and defendants have filed notices of appeal from this order. The court has directed various forms of
class notice.
In re MetLife Demutualization Litig. (E.D.N.Y., filed April 18, 2000). In this class action against MLIC and the Holding Company,
plaintiffs served a second consolidated amended complaint in 2004. Plaintiffs assert violations of the Securities Act and the Securities
Exchange Act of 1934, as amended (the “Exchange Act”), in connection with the Plan, claiming that the Policyholder Information Booklets
failed to disclose certain material facts and contained certain material misstatements. They seek rescission and compensatory damages.
By orders dated July 19, 2005 and August 29, 2006, the federal trial court certified a litigation class of present and former policyholders.
The court has not yet directed the manner and form of class notice.
Asbestos-Related Claims
MLIC is and has been a defendant in a large number of asbestos-related suits filed primarily in state courts. These suits principally allege
that the plaintiff or plaintiffs suffered personal injury resulting from exposure to asbestos and seek both actual and punitive damages. MLIC
has never engaged in the business of manufacturing, producing, distributing or selling asbestos or asbestos-containing products nor has
MLIC issued liability or workers’ compensation insurance to companies in the business of manufacturing, producing, distributing or selling
asbestos or asbestos-containing products. The lawsuits principally have focused on allegations with respect to certain research,
publication and other activities of one or more of MLIC’s employees during the period from the 1920’s through approximately the
1950’s and allege that MLIC learned or should have learned of certain health risks posed by asbestos and, among other things, improperly
publicized or failed to disclose those health risks. MLIC believes that it should not have legal liability in these cases. The outcome of most
asbestos litigation matters, however, is uncertain and can be impacted by numerous variables, including differences in legal rulings in
various jurisdictions, the nature of the alleged injury, and factors unrelated to the ultimate legal merit of the claims asserted against MLIC.
MLIC employs a number of resolution strategies to manage its asbestos loss exposure, including seeking resolution of pending litigation by
judicial rulings and settling litigation under appropriate circumstances.
Claims asserted against MLIC have included negligence, intentional tort and conspiracy concerning the health risks associated with
asbestos. MLIC’s defenses (beyond denial of certain factual allegations) include that: (i) MLIC owed no duty to the plaintiffs — it had no
special relationship with the plaintiffs and did not manufacture, produce, distribute or sell the asbestos products that allegedly injured
plaintiffs; (ii) plaintiffs did not rely on any actions of MLIC; (iii) MLIC’s conduct was not the cause of the plaintiffs’ injuries; (iv) plaintiffs’
exposure occurred after the dangers of asbestos were known; and (v) the applicable time with respect to filing suit has expired. During the
course of the litigation, certain trial courts have granted motions dismissing claims against MLIC, while other trial courts have denied MLIC’s
motions to dismiss. There can be no assurance that MLIC will receive favorable decisions on motions in the future. While most cases
brought to date have settled, MLIC intends to continue to defend aggressively against claims based on asbestos exposure, including
defending claims at trials.
The approximate total number of asbestos personal injury claims pending against MLIC as of the dates indicated, the approximate
number of new claims during the years ended on those dates and the approximate total settlement payments made to resolve asbestos
personal injury claims at or during those years are set forth in the following table:
2007 2006 2005
December 31,
(In millions, except number of claims)
Asbestos personal injury claims at year end . . . . . . . . . . . . . . . . . . . . . . . . . . . . 79,717 87,070 100,250
Number of new claims during the year . . . . . . . . . . . . . . . . . . . . . . . . . . . . . . . 7,161 7,870 18,500
Settlement payments during the year (1) . . . . . . . . . . . . . . . . . . . . . . . . . . . . . . $ 28.2 $ 35.5 $ 74.3
(1) Settlement payments represent payments made by MLIC during the year in connection with settlements made in that year and in prior
years. Amounts do not include MLIC’s attorneys’ fees and expenses and do not reflect amounts received from insurance carriers.
In 2004, MLIC received approximately 23,900 new claims, ending the year with a total of approximately 108,000 claims, and paid
approximately $85.5 million for settlements reached in 2004 and prior years. In 2003, MLIC received approximately 58,750 new claims,
ending the year with a total of approximately 111,700 claims, and paid approximately $84.2 million for settlements reached in 2003 and
prior years. The number of asbestos cases that may be brought or the aggregate amount of any liability that MLIC may ultimately incur is
uncertain.
The Company believes adequate provision has been made in its consolidated financial statements for all probable and reasonably
estimable losses for asbestos-related claims. MLIC’s recorded asbestos liability is based on its estimation of the following elements, as
informed by the facts presently known to it, its understanding of current law, and its past experiences: (i) the reasonably probable and
estimable liability for asbestos claims already asserted against MLIC, including claims settled but not yet paid; (ii) the reasonably probable
and estimable liability for asbestos claims not yet asserted against MLIC, but which MLIC believes are reasonably probable of assertion;
F-55MetLife, Inc.
MetLife, Inc.
Notes to Consolidated Financial Statements — (Continued)
and (iii) the legal defense costs associated with the foregoing claims. Significant assumptions underlying MLIC’s analysis of the adequacy
of its recorded liability with respect to asbestos litigation include: (i) the number of future claims; (ii) the cost to resolve claims; and (iii) the
cost to defend claims.
MLIC reevaluates on a quarterly and annual basis its exposure from asbestos litigation, including studying its claims experience,
reviewing external literature regarding asbestos claims experience in the United States, assessing relevant trends impacting asbestos
liability and considering numerous variables that can affect its asbestos liability exposure on an overall or per claim basis. These variables
include bankruptcies of other companies involved in asbestos litigation, legislative and judicial developments, the number of pending
claims involving serious disease, the number of new claims filed against it and other defendants, and the jurisdictions in which claims are
pending. As previously disclosed, in 2002 MLIC increased its recorded liability for asbestos-related claims by $402 million from
approximately $820 million to $1,225 million. MLIC regularly reevaluates its exposure from asbestos litigation and has updated its liability
analysis for asbestos-related claims through December 31, 2007.
The ability of MLIC to estimate its ultimate asbestos exposure is subject to considerable uncertainty, and the conditions impacting its
liability can be dynamic and subject to change. The availability of reliable data is limited and it is difficult to predict with any certainty the
numerous variables that can affect liability estimates, including the number of future claims, the cost to resolve claims, the disease mix and
severity of disease in pending and future claims, the impact of the number of new claims filed in a particular jurisdiction and variations in the
law in the jurisdictions in which claims are filed, the possible impact of tort reform efforts, the willingness of courts to allow plaintiffs to
pursue claims against MLIC when exposure to asbestos took place after the dangers of asbestos exposure were well known, and the
impact of any possible future adverse verdicts and their amounts.
The ability to make estimates regarding ultimate asbestos exposure declines significantly as the estimates relate to years further in the
future. In the Company’s judgment, there is a future point after which losses cease to be probable and reasonably estimable. It is
reasonably possible that the Company’s total exposure to asbestos claims may be materially greater than the asbestos liability currently
accrued and that future charges to income may be necessary. While the potential future charges could be material in the particular
quarterly or annual periods in which they are recorded, based on information currently known by management, management does not
believe any such charges are likely to have a material adverse effect on the Company’s financial position.
During 1998, MLIC paid $878 million in premiums for excess insurance policies for asbestos-related claims. The excess insurance
policies for asbestos-related claims provide for recovery of losses up to $1.5 billion, which is in excess of a $400 million self-insured
retention. The Company’s initial option to commute the excess insurance policies for asbestos-related claims arises at the end of 2008.
Thereafter, the Company will have a commutation right every five years. The excess insurance policies for asbestos-related claims are also
subject to annual and per claim sublimits. Amounts exceeding the sublimits during 2007, 2006 and 2005 were approximately $16 million,
$8 million and $0, respectively. The Company continues to study per claim averages, and there can be no assurance as to the number and
cost of claims resolved in the future, including related defense costs, and the applicability of the sublimits to these costs. Amounts are
recoverable under the policies annually with respect to claims paid during the prior calendar year. Although amounts paid by MLIC in any
given year that may be recoverable in the next calendar year under the policies will be reflected as a reduction in the Company’s operating
cash flows for the year in which they are paid, management believes that the payments will not have a material adverse effect on the
Company’s liquidity.
Each asbestos-related policy contains an experience fund and a reference fund that provide for payments to MLIC at the commutation
date if the reference fund is greater than zero at commutation or pro rata reductions from time to time in the loss reimbursements to MLIC if
the cumulative return on the reference fund is less than the return specified in the experience fund. The return in the reference fund is tied
to performance of the Standard & Poor’s (“S&P”) 500 Index and the Lehman Brothers Aggregate Bond Index. A claim with respect to the
prior year was made under the excess insurance policies in each year from 2003 through 2007 for the amounts paid with respect to
asbestos litigation in excess of the retention. As the performance of the indices impacts the return in the reference fund, it is possible that
loss reimbursements to the Company and the recoverable amount with respect to later periods may be less than the amount of the
recorded losses. Foregone loss reimbursements may be recovered upon commutation depending upon future performance of the
reference fund. If at some point in the future, the Company believes the liability for probable and reasonably estimable losses for asbestos-
related claims should be increased, an expense would be recorded and the insurance recoverable would be adjusted subject to the terms,
conditions and limits of the excess insurance policies. Portions of the change in the insurance recoverable would be recorded as a
deferred gain and amortized into income over the estimated remaining settlement period of the insurance policies. The foregone loss
reimbursements were approximately $56.1 million with respect to claims for the period of 2002 through 2006 and are estimated, as of
December 31, 2007, to be approximately $69.1 million in the aggregate, including future years.
Sales Practices Claims
Over the past several years, MLIC; New England Mutual Life Insurance Company, New England Life Insurance Company and New
England Securities Corporation (collectively “New England”); GALIC; Walnut Street Securities, Inc. (“Walnut Street Securities”) and MetLife
Securities, Inc. (“MSI”) have faced numerous claims, including class action lawsuits, alleging improper marketing or sales of individual life
insurance policies, annuities, mutual funds or other products.
As of December 31, 2007, there were approximately 130 sales practices litigation matters pending against the Company. The Company
continues to vigorously defend against the claims in these matters. Some sales practices claims have been resolved through settlement.
Other sales practices claims have been won by dispositive motions or have gone to trial. Most of the current cases seek substantial
damages, including in some cases punitive and treble damages and attorneys’ fees. Additional litigation relating to the Company’s
marketing and sales of individual life insurance, mutual funds or other products may be commenced in the future.
Two putative class action lawsuits involving sales practices claims are pending against MLIC in Canada. In Jacynthe Evoy-Larouche v.
Metropolitan Life Ins. Co. (Que. Super. Ct., filed March 1998), plaintiff alleges misrepresentations regarding dividends and future payments
for life insurance policies and seeks unspecified damages. In Ace Quan v. Metropolitan Life Ins. Co. (Ont. Gen. Div., filed April 1997),
F-56 MetLife, Inc.
MetLife, Inc.
Notes to Consolidated Financial Statements — (Continued)
plaintiff alleges breach of contract and negligent misrepresentations relating to, among other things, life insurance premium payments and
seeks damages, including punitive damages.
Regulatory authorities in a small number of states have had investigations or inquiries relating to MLIC’s, New England’s, GALIC’s, MSI’s
or Walnut Street Securities’ sales of individual life insurance policies or annuities or other products. Over the past several years, these and
a number of investigations by other regulatory authorities were resolved for monetary payments and certain other relief. The Company may
continue to resolve investigations in a similar manner. The Company believes adequate provision has been made in its consolidated
financial statements for all probable and reasonably estimable losses for sales practices claims against MLIC, New England, GALIC, MSI
and Walnut Street Securities.
Property and Casualty Actions
Katrina-Related Litigation. There are a number of lawsuits, including a few putative class actions and “mass” actions, pending in
Louisiana and Mississippi against Metropolitan Property and Casualty Insurance Company relating to Hurricane Katrina. The lawsuits
include claims by policyholders for coverage for damages stemming from Hurricane Katrina, including for damages resulting from flooding
or storm surge. The deadline for filing actions in Louisiana has expired. It is reasonably possible that additional actions will be filed in other
states. The Company intends to continue to defend vigorously against these matters, although appropriate matters may be resolved as part
of the ordinary claims adjustment process.
Shipley v. St. Paul Fire and Marine Ins. Co. and Metropolitan Property and Casualty Ins. Co. (Ill. Cir. Ct., Madison County, filed February
26 and July 2, 2003). Two putative nationwide class actions have been filed against Metropolitan Property and Casualty Insurance
Company in Illinois. One suit claims breach of contract and fraud due to the alleged underpayment of medical claims arising from the use of
a purportedly biased provider fee pricing system. A motion for class certification has been filed and briefed. The second suit currently
alleges breach of contract arising from the alleged use of preferred provider organizations to reduce medical provider fees covered by the
medical claims portion of the insurance policy. A motion for class certification has been filed and briefed. A third putative nationwide class
action relating to the payment of medical providers, Innovative Physical Therapy, Inc. v. MetLife Auto & Home, et ano (D. N.J., filed
November 12, 2007) has been filed against Metropolitan Property and Casualty Insurance Company in federal court in New Jersey. The
Company is vigorously defending against the claims in these matters.
Regulatory Matters
The Company receives and responds to subpoenas or other inquiries from state regulators, including state insurance commissioners;
state attorneys general or other state governmental authorities; federal regulators, including the SEC; federal governmental authorities,
including congressional committees; and the Financial Industry Regulatory Authority seeking a broad range of information. The issues
involved in information requests and regulatory matters vary widely. Certain regulators have requested information and documents
regarding contingent commission payments to brokers, the Company’s awareness of any “sham” bids for business, bids and quotes that
the Company submitted to potential customers, incentive agreements entered into with brokers, or compensation paid to intermediaries.
Regulators also have requested information relating to market timing and late trading of mutual funds and variable insurance products and,
generally, the marketing of products. The Company has received a subpoena from the Office of the U.S. Attorney for the Southern District
of California asking for documents regarding the insurance broker Universal Life Resources. The Company has been cooperating fully with
these inquiries.
In 2005, MSI received a notice from the Illinois Department of Securities asserting possible violations of the Illinois Securities Act in
connection with sales of a former affiliate’s mutual funds. A response has been submitted and in January 2008, MSI received notice of the
commencement of an administrative action by the Illinois Department of Securities. MSI intends to vigorously defend against the claims in
this matter.
Other Litigation
In Re Ins. Brokerage Antitrust Litig. (D. N.J., filed February 24, 2005). In this multi-district proceeding, plaintiffs filed a class action
complaint consolidating claims from several separate actions that had been filed in or transferred to the District of New Jersey in 2004 and
2005. The consolidated complaint alleged that the Holding Company, MLIC, several non-affiliated insurance companies and several
insurance brokers violated the Racketeer Influenced and Corrupt Organizations Act (“RICO”), the Employee Retirement Income Security Act
of 1974 (“ERISA”), and antitrust laws and committed other misconduct in the context of providing insurance to employee benefit plans and
to persons who participate in such employee benefit plans. In August and September 2007, the court issued orders granting defendants’
motions to dismiss with prejudice the federal antitrust and the RICO claims. In January 2008, the court issued an order granting
defendants’ summary judgment motion on the ERISA claims, and in February 2008, the court dismissed the remaining state law claims on
jurisdictional grounds. Plaintiffs have filed a notice of appeal of the court’s decisions. A putative class action alleging that the Holding
Company and other non-affiliated defendants violated state laws was transferred to the District of New Jersey but was not consolidated
with other related actions. Plaintiffs’ motion to remand this action to state court in Florida is pending.
The American Dental Association, et al. v. MetLife Inc., et al. (S.D. Fla., filed May 19, 2003). The American Dental Association and
three individual providers have sued the Holding Company, MLIC and other non-affiliated insurance companies in a putative class action
lawsuit. The plaintiffs purport to represent a nationwide class of in-network providers who allege that their claims are being wrongfully
reduced by downcoding, bundling, and the improper use and programming of software. The complaint alleges federal racketeering and
various state law theories of liability. The district court has granted in part and denied in part the Company’s motion to dismiss. The plaintiffs
filed an amended complaint, and the Company filed another motion to dismiss. The court has issued a tag-along order, related to a medical
managed care trial, which has stayed the lawsuit.
F-57MetLife, Inc.
MetLife, Inc.
Notes to Consolidated Financial Statements — (Continued)
Thomas, et al. v. Metropolitan Life Ins. Co., et al. (W.D. Okla., filed January 31, 2007). A putative class action complaint was filed
against MLIC and MSI. Plaintiffs assert legal theories of violations of the federal securities laws and violations of state laws with respect to
the sale of certain proprietary products by the Company’s agency distribution group. Plaintiffs seek rescission, compensatory damages,
interest, punitive damages and attorneys’ fees and expenses. The Company is vigorously defending against the claims in this matter.
MLIC also has been named as a defendant in a number of welding and mixed dust lawsuits filed in various state and federal courts. The
Company is continuing to vigorously defend against these claims.
Summary
Putative or certified class action litigation and other litigation and claims and assessments against the Company, in addition to those
discussed previously and those otherwise provided for in the Company’s consolidated financial statements, have arisen in the course of
the Company’s business, including, but not limited to, in connection with its activities as an insurer, employer, investor, investment advisor
and taxpayer. Further, state insurance regulatory authorities and other federal and state authorities regularly make inquiries and conduct
investigations concerning the Company’s compliance with applicable insurance and other laws and regulations.
It is not possible to predict the ultimate outcome of all pending investigations and legal proceedings or provide reasonable ranges of
potential losses, except as noted previously in connection with specific matters. In some of the matters referred to previously, very large
and/or indeterminate amounts, including punitive and treble damages, are sought. Although in light of these considerations it is possible
that an adverse outcome in certain cases could have a material adverse effect upon the Company’s financial position, based on information
currently known by the Company’s management, in its opinion, the outcomes of such pending investigations and legal proceedings are not
likely to have such an effect. However, given the large and/or indeterminate amounts sought in certain of these matters and the inherent
unpredictability of litigation, it is possible that an adverse outcome in certain matters could, from time to time, have a material adverse effect
on the Company’s consolidated net income or cash flows in particular quarterly or annual periods.
Insolvency Assessments
Most of the jurisdictions in which the Company is admitted to transact business require insurers doing business within the jurisdiction to
participate in guaranty associations, which are organized to pay contractual benefits owed pursuant to insurance policies issued by
impaired, insolvent or failed insurers. These associations levy assessments, up to prescribed limits, on all member insurers in a particular
state on the basis of the proportionate share of the premiums written by member insurers in the lines of business in which the impaired,
insolvent or failed insurer engaged. Some states permit member insurers to recover assessments paid through full or partial premium tax
offsets. Assets and liabilities held for insolvency assessments are as follows:
2007 2006
December 31,
(In millions)
Other Assets:
Premium tax offset for future undiscounted assessments . . . . . . . . . . . . . . . . . . . . . . . . . . . . . . . . . . . . $40 $45
Premium tax offsets currently available for paid assessments . . . . . . . . . . . . . . . . . . . . . . . . . . . . . . . . . 6 7
Receivable for reimbursement of paid assessments (1) . . . . . . . . . . . . . . . . . . . . . . . . . . . . . . . . . . . . . 7 10
$53 $62
Liability:
Insolvency assessments . . . . . . . . . . . . . . . . . . . . . . . . . . . . . . . . . . . . . . . . . . . . . . . . . . . . . . . . . $74 $90
(1) The Company holds a receivable from the seller of a prior acquisition in accordance with the purchase agreement.
Assessments levied against the Company were ($1) million, $2 million and $4 million for the years ended December 31, 2007, 2006 and
2005, respectively.
Impact of Hurricanes
On August 29, 2005, Hurricane Katrina made landfall in the states of Louisiana, Mississippi and Alabama, causing catastrophic damage
to these coastal regions. MetLife’s cumulative gross losses from Hurricane Katrina were $314 million, $333 million and $335 million at
December 31, 2007, 2006 and 2005, respectively, primarily arising from the Company’s homeowners business. During the years ended
December 31, 2007, 2006 and 2005, the Company recognized net losses, net of income tax and reinsurance recoverables and including
reinstatement premiums and other reinsurance-related premium adjustments related to the catastrophe, of ($13) million, ($2) million and
$134 million, respectively.
On October 24, 2005, Hurricane Wilma made landfall across the state of Florida. MetLife’s cumulative gross losses from Hurricane
Wilma were $66 million, $64 million and $57 million at December 31, 2007, 2006 and 2005, respectively, primarily arising from the
Company’s homeowners and automobile businesses. During the years ended December 31, 2006 and 2005, the Company’s Auto & Home
segment recognized net losses, net of income tax and reinsurance recoverables, of ($3) million and $32 million, respectively, related to
Hurricane Wilma. The Company did not recognize any loss during the year ended December 31, 2007, related to Hurricane Wilma.
Additional hurricane-related losses may be recorded in future periods as claims are received from insureds and claims to reinsurers are
processed. Reinsurance recoveries are dependent upon the continued creditworthiness of the reinsurers, which may be affected by their
other reinsured losses in connection with Hurricanes Katrina and Wilma and otherwise. In addition, lawsuits, including purported class
actions, have been filed in Louisiana and Mississippi challenging denial of claims for damages caused to property during Hurricane Katrina.
Metropolitan Property and Casualty Insurance Company is a named party in some of these lawsuits. In addition, rulings in cases in which
Metropolitan Property and Casualty Insurance Company is not a party may affect interpretation of its policies. Metropolitan Property and
F-58 MetLife, Inc.
MetLife, Inc.
Notes to Consolidated Financial Statements — (Continued)
Casualty Insurance Company intends to vigorously defend these matters. However, any adverse rulings could result in an increase in the
Company’s hurricane-related claim exposure and losses. Based on information known by management, it does not believe that additional
claim losses resulting from Hurricane Katrina will have a material adverse impact on the Company’s consolidated financial statements.
Argentina
The Argentinean economic, regulatory and legal environment, including interpretations of laws and regulations by regulators and courts,
is uncertain. Potential legal or governmental actions related to pension reform, fiduciary responsibilities, performance guarantees and tax
rulings could adversely affect the results of the Company. Upon acquisition of Citigroup’s insurance operations in Argentina, the Company
established insurance liabilities, most significantly death and disability policy liabilities, based upon its interpretation of Argentinean law at
the time and the Company’s best estimate of its obligations under such law. In 2006, a decree was issued by the Argentine Government
regarding the taxability of pesification-related gains resulting in the reduction of certain tax liabilities. In 2007, pension reform legislation in
Argentina was enacted which changed the Company’s obligations and resulted in the elimination of the death and disability liabilities and
the establishment of a liability for servicing obligations.
Commitments
Leases
In accordance with industry practice, certain of the Company’s income from lease agreements with retail tenants are contingent upon
the level of the tenants’ sales revenues. Additionally, the Company, as lessee, has entered into various lease and sublease agreements for
office space, data processing and other equipment. Future minimum rental and sublease income, and minimum gross rental payments
relating to these lease agreements are as follows:
Rental
Income
Sublease
Income
Gross
Rental
Payments
(In millions)
2008 . . . . . . . . . . . . . . . . . . . . . . . . . . . . . . . . . . . . . . . . . . . . . . . . . . . . . . . . . . $455 $21 $ 254
2009 . . . . . . . . . . . . . . . . . . . . . . . . . . . . . . . . . . . . . . . . . . . . . . . . . . . . . . . . . . $421 $13 $ 234
2010 . . . . . . . . . . . . . . . . . . . . . . . . . . . . . . . . . . . . . . . . . . . . . . . . . . . . . . . . . . $368 $ 8 $ 208
2011 . . . . . . . . . . . . . . . . . . . . . . . . . . . . . . . . . . . . . . . . . . . . . . . . . . . . . . . . . . $292 $ 8 $ 177
2012 . . . . . . . . . . . . . . . . . . . . . . . . . . . . . . . . . . . . . . . . . . . . . . . . . . . . . . . . . . $217 $ 7 $ 139
Thereafter . . . . . . . . . . . . . . . . . . . . . . . . . . . . . . . . . . . . . . . . . . . . . . . . . . . . . . . $766 $ 7 $1,155
Commitments to Fund Partnership Investments
The Company makes commitments to fund partnership investments in the normal course of business. The amounts of these unfunded
commitments were $5.3 billion and $3.0 billion at December 31, 2007 and 2006, respectively. The Company anticipates that these
amounts will be invested in partnerships over the next five years.
Mortgage Loan Commitments
The Company commits to lend funds under mortgage loan commitments. The amounts of these mortgage loan commitments were
$4.0 billion at both December 31, 2007 and 2006.
Commitments to Fund Bank Credit Facilities, Bridge Loans and Private Corporate Bond Investments
The Company commits to lend funds under bank credit facilities, bridge loans and private corporate bond investments. The amounts of
these unfunded commitments were $1.2 billion and $1.9 billion at December 31, 2007 and 2006, respectively.
Other Commitments
In December 2005, RGA repurchased 1.6 million shares of its outstanding common stock at an aggregate price of $76 million under an
accelerated share repurchase agreement with a major bank. The bank borrowed the stock sold to RGA from third parties and purchased
the shares in the open market over the subsequent few months to return to the lenders. RGA would either pay or receive an amount based
on the actual amount paid by the bank to purchase the shares. These repurchases resulted in an increase in the Company’s ownership
percentage of RGA to approximately 53% at December 31, 2005 from approximately 52% at December 31, 2004. In February 2006, the
final purchase price was determined, resulting in a cash settlement substantially equal to the aggregate cost. RGA recorded the initial
repurchase of shares as treasury stock and recorded the amount received as an adjustment to the cost of the treasury stock. At
December 31, 2007, the Company’s ownership was approximately 52% of RGA.
Guarantees
In the normal course of its business, the Company has provided certain indemnities, guarantees and commitments to third parties
pursuant to which it may be required to make payments now or in the future. In the context of acquisition, disposition, investment and other
transactions, the Company has provided indemnities and guarantees, including those related to tax, environmental and other specific
liabilities, and other indemnities and guarantees that are triggered by, among other things, breaches of representations, warranties or
covenants provided by the Company. In addition, in the normal course of business, the Company provides indemnifications to counter-
parties in contracts with triggers similar to the foregoing, as well as for certain other liabilities, such as third party lawsuits. These
obligations are often subject to time limitations that vary in duration, including contractual limitations and those that arise by operation of
law, such as applicable statutes of limitation. In some cases, the maximum potential obligation under the indemnities and guarantees is
subject to a contractual limitation ranging from less than $1 million to $800 million, with a cumulative maximum of $2.3 billion, while in other
cases such limitations are not specified or applicable. Since certain of these obligations are not subject to limitations, the Company does
not believe that it is possible to determine the maximum potential amount that could become due under these guarantees in the future.
F-59MetLife, Inc.
MetLife, Inc.
Notes to Consolidated Financial Statements — (Continued)
In addition, the Company indemnifies its directors and officers as provided in its charters and by-laws. Also, the Company indemnifies
its agents for liabilities incurred as a result of their representation of the Company’s interests. Since these indemnities are generally not
subject to limitation with respect to duration or amount, the Company does not believe that it is possible to determine the maximum
potential amount that could become due under these indemnities in the future.
The Company has also guaranteed minimum investment returns on certain international retirement funds in accordance with local laws.
Since these guarantees are not subject to limitation with respect to duration or amount, the Company does not believe that it is possible to
determine the maximum potential amount that could become due under these guarantees in the future.
During the year ended December 31, 2007, the Company recorded a $1 million liability with respect to a guarantee previously provided
to MLII, a former subsidiary. The Company’s recorded liabilities at December 31, 2007 and 2006 for indemnities, guarantees and
commitments were $6 million and $5 million, respectively.
In connection with synthetically created investment transactions, the Company writes credit default swap obligations that generally
require payment of principal outstanding due in exchange for the referenced credit obligation. If a credit event, as defined by the contract,
occurs the Company’s maximum amount at risk, assuming the value of the referenced credits becomes worthless, was $1.7 billion at
December 31, 2007. The credit default swaps expire at various times during the next ten years.
17. Employee Benefit Plans
Pension and Other Postretirement Benefit Plans
The Subsidiaries sponsor and/or administer various qualified and non-qualified defined benefit pension plans and other postretirement
employee benefit plans covering employees and sales representatives who meet specified eligibility requirements. Pension benefits are
provided utilizing either a traditional formula or cash balance formula. The traditional formula provides benefits based upon years of credited
service and either final average or career average earnings. The cash balance formula utilizes hypothetical or notional accounts which
credit participants with benefits equal to a percentage of eligible pay as well as earnings credits, determined annually based upon the
average annual rate of interest on 30-year U.S. Treasury securities, for each account balance. As of December 31, 2007, virtually all of the
Subsidiaries’ obligations have been calculated using the traditional formula. The non-qualified pension plans provide supplemental
benefits, in excess of amounts permitted by governmental agencies, to certain executive level employees.
The Subsidiaries also provide certain postemployment benefits and certain postretirement medical and life insurance benefits for retired
employees. Employees of the Subsidiaries who were hired prior to 2003 (or, in certain cases, rehired during or after 2003) and meet age
and service criteria while working for one of the Subsidiaries, may become eligible for these other postretirement benefits, at various levels,
in accordance with the applicable plans. Virtually all retirees, or their beneficiaries, contribute a portion of the total cost of postretirement
medical benefits. Employees hired after 2003 are not eligible for any employer subsidy for postretirement medical benefits.
In connection with the acquisition of Travelers, the employees of Travelers and any other Citigroup affiliate in the United States who
became employees of certain Subsidiaries in connection with that acquisition (including those who remained employees of companies
acquired in that acquisition) will be credited with service recognized by Citigroup for purposes of determining eligibility and vesting under
the Plan with respect to benefits earned under the Plan subsequent to the closing date of the acquisition. Neither the Holding Company nor
its subsidiaries assumed an obligation for benefits earned under defined benefit plans of Citigroup or Travelers prior to the acquisition.
As described more fully in Note 1, effective December 31, 2006, the Company adopted SFAS 158. The adoption of SFAS 158 required
the recognition of the funded status of defined benefit pension and other postretirement plans and eliminated the additional minimum
pension liability provision of SFAS 87. The Company’s additional minimum pension liability was $78 million, and the intangible asset was
$12 million, at December 31, 2005. The excess of the additional minimum pension liability over the intangible asset of $66 million,
$41 million net of income tax, was recorded as a reduction of accumulated other comprehensive income. At December 31, 2006,
immediately prior to adopting SFAS 158, the Company’s additional minimum pension liability was $92 million. The additional minimum
pension liability of $59 million, net of income tax of $33 million, was recorded as a reduction of accumulated other comprehensive income.
The change in the additional minimum pension liability of $18 million, net of income tax, was reflected as a component of comprehensive
income for the year ended December 31, 2006. Upon adoption of SFAS 158, the Company eliminated the additional minimum pension
liability and recognized as an adjustment to accumulated other comprehensive income, net of income tax, those amounts of actuarial gains
and losses, prior service costs and credits, and the remaining net transition asset or obligation that had not yet been included in net
periodic benefit cost at the date of adoption.
F-60 MetLife, Inc.
MetLife, Inc.
Notes to Consolidated Financial Statements — (Continued)
The following table summarizes the adjustments to the December 31, 2006 consolidated balance sheet as a result of recognizing the
funded status of the defined benefit plans:
Balance Sheet Caption
Pre
SFAS 158
Adjustments
Additional
Minimum
Pension
Liability
Adjustment
Adoption of
SFAS 158
Adjustment
Post
SFAS 158
Adjustments
December 31, 2006
(In millions)
Other assets: Prepaid pension benefit cost . . . . . . . . . . . . . . . . . . . . . . . $1,937 $ — $ (993) $ 944
Other assets: Intangible asset . . . . . . . . . . . . . . . . . . . . . . . . . . . . . . . $ 12 $(12) $ — $ —
Other liabilities: Accrued pension benefit cost . . . . . . . . . . . . . . . . . . . . . $ (505) $(14) $ (79) $ (598)
Other liabilities: Accrued other postretirement benefit cost . . . . . . . . . . . . . $ (802) $ — $ (99) $ (901)
Accumulated other comprehensive income, before income tax:
Defined benefit plans . . . . . . . . . . . . . . . . . . . . . . . . . . . . . . . . . . . . $ (66) $(26) $(1,171) $(1,263)
Minority interest . . . . . . . . . . . . . . . . . . . . . . . . . . . . . . . . . . . . . . . . . $ — $ 8
Deferred income tax . . . . . . . . . . . . . . . . . . . . . . . . . . . . . . . . . . . . . . $ 8 $ 419
Accumulated other comprehensive income, net of income tax:
Defined benefit plans . . . . . . . . . . . . . . . . . . . . . . . . . . . . . . . . . . . . $ (41) $(18) $ (744) $ (803)
A December 31 measurement date is used for all of the Subsidiaries’ defined benefit pension and other postretirement benefit plans.
Obligations, Funded Status and Net Periodic Benefit Costs
2007 2006 2007 2006
Pension
Benefits
Other
Postretirement
Benefits
December 31,
(In millions)
Change in benefit obligation:
Benefit obligation at beginning of year . . . . . . . . . . . . . . . . . . . . . . . . . . . . . . . . . $5,959 $5,766 $2,073 $2,176
Service cost . . . . . . . . . . . . . . . . . . . . . . . . . . . . . . . . . . . . . . . . . . . . . . . . 166 163 27 35
Interest cost . . . . . . . . . . . . . . . . . . . . . . . . . . . . . . . . . . . . . . . . . . . . . . . . 354 335 104 117
Plan participants’ contributions . . . . . . . . . . . . . . . . . . . . . . . . . . . . . . . . . . . . — — 31 29
Divestitures . . . . . . . . . . . . . . . . . . . . . . . . . . . . . . . . . . . . . . . . . . . . . . . . — (4) — —
Net actuarial (gains) losses . . . . . . . . . . . . . . . . . . . . . . . . . . . . . . . . . . . . . . (390) 27 (464) 1
Change in benefits . . . . . . . . . . . . . . . . . . . . . . . . . . . . . . . . . . . . . . . . . . . . 39 (6) — (143)
Prescription drug subsidy . . . . . . . . . . . . . . . . . . . . . . . . . . . . . . . . . . . . . . . — — 13 10
Benefits paid. . . . . . . . . . . . . . . . . . . . . . . . . . . . . . . . . . . . . . . . . . . . . . . . (353) (322) (174) (152)
Benefit obligation at end of year . . . . . . . . . . . . . . . . . . . . . . . . . . . . . . . . . . . . . 5,775 5,959 1,610 2,073
Change in plan assets:
Fair value of plan assets at beginning of year . . . . . . . . . . . . . . . . . . . . . . . . . . . . 6,305 5,518 1,172 1,093
Actual return on plan assets . . . . . . . . . . . . . . . . . . . . . . . . . . . . . . . . . . . . . . 548 725 58 104
Divestitures . . . . . . . . . . . . . . . . . . . . . . . . . . . . . . . . . . . . . . . . . . . . . . . . — (4) — —
Employer contribution . . . . . . . . . . . . . . . . . . . . . . . . . . . . . . . . . . . . . . . . . . 50 388 1 2
Benefits paid. . . . . . . . . . . . . . . . . . . . . . . . . . . . . . . . . . . . . . . . . . . . . . . . (353) (322) (48) (27)
Fair value of plan assets at end of year . . . . . . . . . . . . . . . . . . . . . . . . . . . . . . . 6,550 6,305 1,183 1,172
Funded status at end of year . . . . . . . . . . . . . . . . . . . . . . . . . . . . . . . . . . . . . $ 775 $ 346 $ (427) $ (901)
Amounts recognized in the consolidated balance sheet consist of:
Other assets . . . . . . . . . . . . . . . . . . . . . . . . . . . . . . . . . . . . . . . . . . . . . . . . $1,393 $ 944 $ — $ —
Other liabilities . . . . . . . . . . . . . . . . . . . . . . . . . . . . . . . . . . . . . . . . . . . . . . (618) (598) (427) (901)
Net amount recognized . . . . . . . . . . . . . . . . . . . . . . . . . . . . . . . . . . . . . . . . . $ 775 $ 346 $ (427) $ (901)
Accumulated other comprehensive (income) loss:
Net actuarial (gains) losses . . . . . . . . . . . . . . . . . . . . . . . . . . . . . . . . . . . . . . $ 623 $1,123 $ (112) $ 328
Prior service cost (credit) . . . . . . . . . . . . . . . . . . . . . . . . . . . . . . . . . . . . . . . . 64 41 (193) (230)
Net asset at transition . . . . . . . . . . . . . . . . . . . . . . . . . . . . . . . . . . . . . . . . . . — — — 1
687 1,164 (305) 99
Deferred income tax and minority interest . . . . . . . . . . . . . . . . . . . . . . . . . . . . . (251) (423) 109 (37)
$ 436 $ 741 $ (196) $ 62
F-61MetLife, Inc.
MetLife, Inc.
Notes to Consolidated Financial Statements — (Continued)
The aggregate projected benefit obligation and aggregate fair value of plan assets for the pension plans were as follows:
2007 2006 2007 2006 2007 2006
Qualified Plans
Non-Qualified
Plans Total
December 31,
(In millions)
Aggregate fair value of plan assets (principally Company contracts) . . $6,550 $6,305 $ — $ — $6,550 $6,305
Aggregate projected benefit obligation . . . . . . . . . . . . . . . . . . . . . 5,174 5,381 601 578 5,775 5,959
Over (under) funded . . . . . . . . . . . . . . . . . . . . . . . . . . . . . . . . . $1,376 $ 924 $(601) $(578) $ 775 $ 346
The accumulated benefit obligation for all defined benefit pension plans was $5,348 million and $5,505 million at December 31, 2007
and 2006, respectively.
Information for pension plans with an accumulated benefit obligation in excess of plan assets is as follows:
2007 2006
December 31,
(In millions)
Projected benefit obligation . . . . . . . . . . . . . . . . . . . . . . . . . . . . . . . . . . . . . . . . . . . . . . . . . . . . . . . . $616 $594
Accumulated benefit obligation . . . . . . . . . . . . . . . . . . . . . . . . . . . . . . . . . . . . . . . . . . . . . . . . . . . . . $533 $501
Fair value of plan assets . . . . . . . . . . . . . . . . . . . . . . . . . . . . . . . . . . . . . . . . . . . . . . . . . . . . . . . . . . $ — $ —
Information for pension and other postretirement plans with a projected benefit obligation in excess of plan assets is as follows:
2007 2006 2007 2006
Pension
Benefits
Other
Postretirement
Benefits
December 31,
(In millions)
Projected benefit obligation . . . . . . . . . . . . . . . . . . . . . . . . . . . . . . . . . . . . . . . . . . $646 $623 $1,610 $2,073
Fair value of plan assets . . . . . . . . . . . . . . . . . . . . . . . . . . . . . . . . . . . . . . . . . . . . $ 28 $ 25 $1,183 $1,172
The components of net periodic benefit cost and other changes in plan assets and benefit obligations recognized in other compre-
hensive income were as follows:
2007 2006 2005 2007 2006 2005
Pension
Benefits
Other
Postretirement
Benefits
Years Ended December 31,
(In millions)
Net Periodic Benefit Cost
Service cost . . . . . . . . . . . . . . . . . . . . . . . . . . . . . . . . . . . . . . . . . $ 166 $ 163 $ 142 $ 27 $ 35 $ 37
Interest cost . . . . . . . . . . . . . . . . . . . . . . . . . . . . . . . . . . . . . . . . . 354 335 318 104 117 121
Expected return on plan assets . . . . . . . . . . . . . . . . . . . . . . . . . . . . (507) (454) (446) (86) (79) (79)
Amortization of net actuarial (gains) losses . . . . . . . . . . . . . . . . . . . . . 68 125 116 — 23 15
Amortization of prior service cost (credit) . . . . . . . . . . . . . . . . . . . . . . 17 11 16 (36) (36) (17)
Net periodic benefit cost . . . . . . . . . . . . . . . . . . . . . . . . . . . . . . . 98 $ 180 $ 146 9 $ 60 $ 77
Other Changes in Plan Assets and Benefit Obligations Recognized
in Other Comprehensive Income
Net actuarial (gains) losses . . . . . . . . . . . . . . . . . . . . . . . . . . . . . . . (432) (440)
Prior service cost (credit). . . . . . . . . . . . . . . . . . . . . . . . . . . . . . . . . 40 —
Amortization of net actuarial (gains) losses . . . . . . . . . . . . . . . . . . . . . (68) —
Amortization of prior service cost (credit) . . . . . . . . . . . . . . . . . . . . . . (17) 36
Total recognized in other comprehensive income . . . . . . . . . . . . . . . . (477) (404)
Total recognized in net periodic benefit cost and other comprehensive
income . . . . . . . . . . . . . . . . . . . . . . . . . . . . . . . . . . . . . . . . . $(379) $(395)
Included within other comprehensive income are other changes in plan assets and benefit obligations associated with pension benefits
of ($477) million and other postretirement benefits of ($404) million for an aggregate reduction in other comprehensive income of
($881) million before income tax and $563 million, net of income tax and minority interest.
The estimated net actuarial losses and prior service cost for the pension plans that will be amortized from accumulated other
comprehensive income into net periodic benefit cost over the next year are both $14 million.
The estimated net actuarial gains and prior service credit for the defined benefit other postretirement plans that will be amortized from
accumulated other comprehensive income into net periodic benefit cost over the next year are less than $1 million and $37 million,
respectively.
F-62 MetLife, Inc.
MetLife, Inc.
Notes to Consolidated Financial Statements — (Continued)
In 2004, the Company adopted the guidance in FSP 106-2, Accounting and Disclosure Requirements Related to the Medicare
Prescription Drug, Improvement and Modernization Act of 2003 (“FSP 106-2”), to account for future subsidies to be received under the
Prescription Drug Act. The Company began receiving these subsidies during 2006. A summary of the reduction to the APBO and related
reduction to the components of net periodic other postretirement benefit cost is as follows:
2007 2006 2005
December 31,
(In millions)
Cumulative reduction in benefit obligation:
Beginning of year . . . . . . . . . . . . . . . . . . . . . . . . . . . . . . . . . . . . . . . . . . . . . . . . . . . . . . . $328 $298 $230
Service cost . . . . . . . . . . . . . . . . . . . . . . . . . . . . . . . . . . . . . . . . . . . . . . . . . . . . . . . . . . . 7 6 6
Interest cost . . . . . . . . . . . . . . . . . . . . . . . . . . . . . . . . . . . . . . . . . . . . . . . . . . . . . . . . . . . 19 19 16
Net actuarial gains (losses) . . . . . . . . . . . . . . . . . . . . . . . . . . . . . . . . . . . . . . . . . . . . . . . . . (42) 15 46
Prescription drug subsidy . . . . . . . . . . . . . . . . . . . . . . . . . . . . . . . . . . . . . . . . . . . . . . . . . . (13) (10) —
End of year . . . . . . . . . . . . . . . . . . . . . . . . . . . . . . . . . . . . . . . . . . . . . . . . . . . . . . . . . . $299 $328 $298
2007 2006 2005
Years Ended
December 31,
(In millions)
Reduction in net periodic benefit cost:
Service cost . . . . . . . . . . . . . . . . . . . . . . . . . . . . . . . . . . . . . . . . . . . . . . . . . . . . . . . . . . . . . $ 7 $ 6 $ 6
Interest cost . . . . . . . . . . . . . . . . . . . . . . . . . . . . . . . . . . . . . . . . . . . . . . . . . . . . . . . . . . . . . 19 19 16
Amortization of net actuarial gains (losses) . . . . . . . . . . . . . . . . . . . . . . . . . . . . . . . . . . . . . . . . . 5 30 23
Total reduction in net periodic benefit cost . . . . . . . . . . . . . . . . . . . . . . . . . . . . . . . . . . . . . . . . $31 $55 $45
The Company received subsidies of $10 million and $8 million for the years ended December 31, 2007 and 2006, respectively.
Assumptions
Assumptions used in determining benefit obligations were as follows:
2007 2006 2007 2006
Pension
Benefits
Other
Postretirement
Benefits
December 31,
Weighted average discount rate . . . . . . . . . . . . . . . . . . . . . . . . . . . . . . . . . . . . 6.65% 6.00% 6.65% 6.00%
Rate of compensation increase . . . . . . . . . . . . . . . . . . . . . . . . . . . . . . . . . . . . . 3.5%-8% 3%-8% N/A N/A
Assumptions used in determining net periodic benefit cost were as follows:
2007 2006 2005 2007 2006 2005
Pension Benefits
Other
Postretirement Benefits
December 31,
Weighted average discount rate . . . . . . . . . . . . . . . . . . . . . . . 6.00% 5.82% 5.83% 6.00% 5.82% 5.98%
Weighted average expected rate of return on plan assets . . . . . . . 8.25% 8.25% 8.50% 7.47% 7.42% 7.51%
Rate of compensation increase . . . . . . . . . . . . . . . . . . . . . . . . 3.5%-8% 3%-8% 3%-8% N/A N/A N/A
The discount rate is determined annually based on the yield, measured on a yield to worst basis, of a hypothetical portfolio constructed
of high quality debt instruments available on the valuation date, which would provide the necessary future cash flows to pay the aggregate
projected benefit obligation when due.
The expected rate of return on plan assets is based on anticipated performance of the various asset sectors in which the plan invests,
weighted by target allocation percentages. Anticipated future performance is based on long-term historical returns of the plan assets by
sector, adjusted for the Subsidiaries’ long-term expectations on the performance of the markets. While the precise expected return derived
using this approach will fluctuate from year to year, the Subsidiaries’ policy is to hold this long-term assumption constant as long as it
remains within reasonable tolerance from the derived rate.
The weighted average expected return on plan assets for use in that plan’s valuation in 2008 is currently anticipated to be 8.25% for
pension benefits and postretirement medical benefits and 6.25% for postretirement life benefits.
The assumed healthcare cost trend rates used in measuring the APBO and net periodic benefit cost were as follows:
2007 2006
December 31,
Pre-Medicare eligible claims . . . . . . . . . . . . . . . . . . . . . . . . . . 8.5% down to 5% in 2014 9.0% down to 5% in 2014
Medicare eligible claims . . . . . . . . . . . . . . . . . . . . . . . . . . . . . 10.5% down to 5% in 2018 11.0% down to 5% in 2018
F-63MetLife, Inc.
MetLife, Inc.
Notes to Consolidated Financial Statements — (Continued)
Assumed healthcare cost trend rates may have a significant effect on the amounts reported for healthcare plans. A one-percentage
point change in assumed healthcare cost trend rates would have the following effects:
One Percent
Increase
One Percent
Decrease
(In millions)
Effect on total of service and interest cost components . . . . . . . . . . . . . . . . . . . . . . . . . . . . . . $ 7 $ (6)
Effect of accumulated postretirement benefit obligation . . . . . . . . . . . . . . . . . . . . . . . . . . . . . . $63 $(62)
Plan Assets
The Subsidiaries have issued group annuity and life insurance contracts supporting approximately 98% of all pension and other
postretirement benefit plans assets.
The account values of the group annuity and life insurance contracts issued by the Subsidiaries and held as assets of the pension and
other postretirement benefit plans were $7,565 million and $7,321 million as of December 31, 2007 and 2006, respectively. The majority of
such account values are held in separate accounts established by the Subsidiaries. Total revenue from these contracts recognized in the
consolidated statements of income was $28 million, $29 million and $28 million for the years ended December 31, 2007, 2006 and 2005,
respectively, and includes policy charges, net investment income from investments backing the contracts and administrative fees. Total
investment income, including realized and unrealized gains and losses, credited to the account balances were $603 million, $818 million
and $460 million for the years ended December 31, 2007, 2006 and 2005, respectively. The terms of these contracts are consistent in all
material respects with those the Subsidiaries offer to unaffiliated parties that are similarly situated.
The weighted-average allocations of pension plan and other postretirement benefit plan assets were as follows:
2007 2006 2007 2006
Pension
Benefits
Other
Postretirement
Benefits
December 31,
Asset Category
Equity securities . . . . . . . . . . . . . . . . . . . . . . . . . . . . . . . . . . . . . . . . . . . . . . . . . . . 38% 42% 37% 37%
Fixed maturity securities . . . . . . . . . . . . . . . . . . . . . . . . . . . . . . . . . . . . . . . . . . . . . . 44% 42% 58% 57%
Other (Real Estate and Alternative Investments) . . . . . . . . . . . . . . . . . . . . . . . . . . . . . . . 18% 16% 5% 6%
Total . . . . . . . . . . . . . . . . . . . . . . . . . . . . . . . . . . . . . . . . . . . . . . . . . . . . . . . 100% 100% 100% 100%
The weighted-average target allocations of pension plan and other postretirement benefit plan assets for 2008 are as follows:
Pension Other
Asset Category
Equity securities . . . . . . . . . . . . . . . . . . . . . . . . . . . . . . . . . . . . . . . . . . . . . . . . . . . . . . . . . 30%-55% 30%-45%
Fixed maturity securities . . . . . . . . . . . . . . . . . . . . . . . . . . . . . . . . . . . . . . . . . . . . . . . . . . . . 30%-65% 45%-70%
Other (Real Estate and Alternative Investments) . . . . . . . . . . . . . . . . . . . . . . . . . . . . . . . . . . . . . 10%-25% 0%-10%
Target allocations of assets are determined with the objective of maximizing returns and minimizing volatility of net assets through
adequate asset diversification. Adjustments are made to target allocations based on an assessment of the impact of economic factors and
market conditions.
Cash Flows
It is the Subsidiaries’ practice to make contributions to the qualified pension plans to comply with minimum funding requirements of the
Employee Retirement Income Security Act of 1974, as amended. In accordance with such practice, no contributions were required for the
years ended December 31, 2007 or 2006. No contributions will be required for 2008. The Subsidiaries did not make discretionary
contributions to the qualified pension plans during the year ended December 31, 2007 and made contributions of $350 million during the
year ended December 31, 2006. The Subsidiaries expect to make additional discretionary contributions of $150 million in 2008.
Benefit payments due under the non-qualified pension plans are funded from the Subsidiaries’ general assets as they become due
under the provision of the plans. These payments totaled $50 million and $38 million for the years ended December 31, 2007 and 2006,
respectively. These payments are expected to be at approximately the same level in 2008.
Other postretirement benefits represent a non-vested, non-guaranteed obligation of the Subsidiaries and current regulations do not
require specific funding levels for these benefits. While the Subsidiaries have partially funded such plans in advance, it has been the
Subsidiaries’ practice to primarily use their general assets, net of participant’s contributions, to pay postretirement medical claims as they
come due in lieu of utilizing plan assets. Total payments equaled $174 million and $152 million for the years ended December 31, 2007 and
2006, respectively.
The Subsidiaries’ expect to make contributions of $116 million, net of participant’s contributions, towards the other postretirement plan
obligations in 2008. As noted previously, the Subsidiaries expect to receive subsidies under the Prescription Drug Act to partially offset
such payments.
F-64 MetLife, Inc.
MetLife, Inc.
Notes to Consolidated Financial Statements — (Continued)
Gross benefit payments for the next ten years, which reflect expected future service where appropriate, and gross subsidies to be
received under the Prescription Drug Act are expected to be as follows:
Pension
Benefits Gross
Prescription
Drug Subsidies Net
Other Postretirement Benefits
(In millions)
2008 . . . . . . . . . . . . . . . . . . . . . . . . . . . . . . . . . . . . . . . . . . . . . . . . . . . . . $ 360 $116 $ (14) $102
2009 . . . . . . . . . . . . . . . . . . . . . . . . . . . . . . . . . . . . . . . . . . . . . . . . . . . . . $ 373 $120 $ (15) $105
2010 . . . . . . . . . . . . . . . . . . . . . . . . . . . . . . . . . . . . . . . . . . . . . . . . . . . . . $ 383 $124 $ (16) $109
2011 . . . . . . . . . . . . . . . . . . . . . . . . . . . . . . . . . . . . . . . . . . . . . . . . . . . . . $ 397 $129 $ (16) $113
2012 . . . . . . . . . . . . . . . . . . . . . . . . . . . . . . . . . . . . . . . . . . . . . . . . . . . . . $ 413 $132 $ (17) $115
2013-2017 . . . . . . . . . . . . . . . . . . . . . . . . . . . . . . . . . . . . . . . . . . . . . . . . . $2,288 $713 $(100) $613
Savings and Investment Plans
The Subsidiaries sponsor savings and investment plans for substantially all employees under which a portion of employee contributions
are matched. The Subsidiaries contributed $79 million, $82 million and $78 million for the years ended December 31, 2007, 2006 and
2005, respectively.
18. Equity
Preferred Stock
Issuances
In September 1999, the Holding Company adopted a stockholder rights plan (the “rights plan”) under which each outstanding share of
common stock issued between April 4, 2000 and the distribution date (as defined in the rights plan) will be coupled with a stockholder right.
Each right will entitle the holder to purchase one one-hundredth of a share of Series A Junior Participating Preferred Stock. Each one one-
hundredth of a share of Series A Junior Participating Preferred Stock will have economic and voting terms equivalent to one share of
common stock. Until it is exercised, the right itself will not entitle the holder thereof to any rights as a stockholder, including the right to
receive dividends or to vote at stockholder meetings.
Stockholder rights are not exercisable until the distribution date, and will expire at the close of business on April 4, 2010, unless earlier
redeemed or exchanged by the Holding Company. The rights plan is designed to protect stockholders in the event of unsolicited offers to
acquire the Holding Company and other coercive takeover tactics.
In connection with financing the acquisition of Travelers on July 1, 2005, which is described in Note 2, the Holding Company issued
preferred shares as follows:
In June 2005, the Holding Company issued 24 million shares of Floating Rate Non-Cumulative Preferred Stock, Series A (the
“Series A preferred shares”) with a $0.01 par value per share, and a liquidation preference of $25 per share, for aggregate proceeds of
$600 million.
In June 2005, the Holding Company issued 60 million shares of 6.50% Non-Cumulative Preferred Stock, Series B (the “Series B
preferred shares”), with a $0.01 par value per share, and a liquidation preference of $25 per share, for aggregate proceeds of
$1.5 billion.
The Series A and Series B preferred shares (the “Preferred Shares”) rank senior to the common stock with respect to dividends and
liquidation rights. Dividends on the Preferred Shares are not cumulative. Holders of the Preferred Shares will be entitled to receive dividend
payments only when, as and if declared by the Holding Company’s Board of Directors or a duly authorized committee of the board. If
dividends are declared on the Series A preferred shares, they will be payable quarterly, in arrears, at an annual rate of the greater of:
(i) 1.00% above 3-month LIBOR on the related LIBOR determination date; or (ii) 4.00%. Any dividends declared on the Series B preferred
shares will be payable quarterly, in arrears, at an annual fixed rate of 6.50%. Accordingly, in the event that dividends are not declared on the
Preferred Shares for payment on any dividend payment date, then those dividends will cease to accrue and be payable. If a dividend is not
declared before the dividend payment date, the Holding Company has no obligation to pay dividends accrued for that dividend period
whether or not dividends are declared and paid in future periods. No dividends may, however, be paid or declared on the Holding
Company’s common stock — or any other securities ranking junior to the Preferred Shares — unless the full dividends for the latest
completed dividend period on all Preferred Shares, and any parity stock, have been declared and paid or provided for.
The Holding Company is prohibited from declaring dividends on the Preferred Shares if it fails to meet specified capital adequacy, net
income and shareholders’ equity levels. In addition, under Federal Reserve Board policy, the Holding Company may not be able to pay
dividends if it does not earn sufficient operating income.
The Preferred Shares do not have voting rights except in certain circumstances where the dividends have not been paid for an
equivalent of six or more dividend payment periods whether or not those periods are consecutive. Under such circumstances, the holders
of the Preferred Shares have certain voting rights with respect to members of the Board of Directors of the Holding Company.
The Preferred Shares are not subject to any mandatory redemption, sinking fund, retirement fund, purchase fund or similar provisions.
The Preferred Shares are redeemable, but not prior to September 15, 2010. On and after that date, subject to regulatory approval, the
Preferred Shares will be redeemable at the Holding Company’s option in whole or in part, at a redemption price of $25 per Preferred Share,
plus declared and unpaid dividends.
In connection with the offering of the Preferred Shares, the Holding Company incurred $56.8 million of issuance costs which have been
recorded as a reduction of additional paid-in capital.
F-65MetLife, Inc.
MetLife, Inc.
Notes to Consolidated Financial Statements — (Continued)
Dividends
Information on the declaration, record and payment dates, as well as per share and aggregate dividend amounts, for the Preferred
Shares is as follows:
Declaration Date Record Date Payment Date
Series A
Per Share
Series A
Aggregate
Series B
Per Share
Series B
Aggregate
Dividend
(In millions, except per share data)
November 15, 2007 . . . . . . . . . . November 30, 2007 December 17, 2007 $0.4230476 $11 $0.4062500 $24
August 15, 2007 . . . . . . . . . . . . August 31, 2007 September 17, 2007 $0.4063333 $10 $0.4062500 $24
May 15, 2007 . . . . . . . . . . . . . . May 31, 2007 June 15, 2007 $0.4060062 $10 $0.4062500 $24
March 5, 2007 . . . . . . . . . . . . . February 28, 2007 March 15, 2007 $0.3975000 $10 $0.4062500 $24
$41 $96
November 15, 2006 . . . . . . . . . . November 30, 2006 December 15, 2006 $0.4038125 $10 $0.4062500 $24
August 15, 2006 . . . . . . . . . . . . August 31, 2006 September 15, 2006 $0.4043771 $10 $0.4062500 $24
May 16, 2006 . . . . . . . . . . . . . . May 31, 2006 June 15, 2006 $0.3775833 $ 9 $0.4062500 $24
March 6, 2006 . . . . . . . . . . . . . February 28, 2006 March 15, 2006 $0.3432031 $ 9 $0.4062500 $24
$38 $96
November 15, 2005 . . . . . . . . . . November 30, 2005 December 15, 2005 $0.3077569 $ 8 $0.4062500 $24
August 22, 2005 . . . . . . . . . . . . August 31, 2005 September 15, 2005 $0.2865690 $ 7 $0.4017361 $24
$15 $48
See Note 25 for further information.
Common Stock
Repurchases
In October 2004, the Company’s Board of Directors authorized a $1 billion common stock repurchase program. In February 2007, the
Company’s Board of Directors authorized an additional $1 billion common stock repurchase program. In September 2007, the Company’s
Board of Directors authorized an additional $1 billion common stock repurchase program which began after the completion of the $1 billion
common stock repurchase program authorized in February 2007. In January 2008, the Company’s Board of Directors authorized an
additional $1 billion common stock repurchase program, which began after the completion of the September 2007 program. (See Note 25).
Under these authorizations, the Company may purchase its common stock from the MetLife Policyholder Trust, in the open market
(including pursuant to the terms of a pre-set trading plan meeting the requirements of Rule 10b5-1 under the Exchange Act) and in privately
negotiated transactions.
The Company has entered into the following accelerated common stock repurchase agreements:
• In December 2004, the Company repurchased 7.3 million shares of its outstanding common stock at an aggregate cost of
$300 million under an accelerated common stock repurchase agreement with a major bank. The bank borrowed the stock sold to the
Company from third parties and purchased the common stock in the open market to return to such third parties. In April 2005, the
Company received a cash adjustment of $7 million based on the actual amount paid by the bank to purchase the common stock, for a
final purchase price of $293 million. The Company recorded the shares initially repurchased as treasury stock and recorded the
amount received as an adjustment to the cost of the treasury stock.
• In December 2006, the Company repurchased 4.0 million shares of its outstanding common stock at an aggregate cost of
$232 million under an accelerated common stock repurchase agreement with a major bank. The bank borrowed the common stock
sold to the Company from third parties and purchased the common stock in the open market to return to such third parties. In
February 2007, the Company paid a cash adjustment of $8 million for a final purchase price of $240 million. The Company recorded
the shares initially repurchased as treasury stock and recorded the amount paid as an adjustment to the cost of the treasury stock.
• In March 2007, the Company repurchased 11.9 million shares of its outstanding common stock at an aggregate cost of $750 million
under an accelerated common stock repurchase agreement with a major bank. The bank borrowed the common stock sold to the
Company from third parties and purchased common stock in the open market to return to such third parties. In June 2007, the
Company paid a cash adjustment of $17 million for a final purchase price of $767 million. The Company recorded the shares initially
repurchased as treasury stock and recorded the amount paid as an adjustment to the cost of the treasury stock.
• In November 2007, the Company repurchased 11.6 million shares of its outstanding common stock at an initial cost of $750 million
under an accelerated common stock repurchase agreement with a major bank. The bank borrowed the stock sold to the Company
from third parties and purchased the common stock in the open market to return to such third parties. Also, in November 2007, the
Company received a cash adjustment of $19 million based on the trading price of the common stock during the repurchase period,
for a final purchase price of $731 million. The Company recorded the shares initially repurchased as treasury stock and recorded the
amount received as an adjustment to the cost of the treasury stock.
• In December 2007, the Company entered into an accelerated common stock repurchase agreement with a major bank. Under the
terms of the agreement, the Company paid the bank $450 million in cash in January 2008 in exchange for 6.6 million shares of the
Company’s outstanding common stock that the bank borrowed from third parties. Also, in January 2008, the bank delivered
1.1 million additional shares of the Company’s common stock to the Company resulting in a total of 7.7 million shares being
repurchased under the agreement. At December 31, 2007, the Company recorded the obligation to pay $450 million to the bank as a
F-66 MetLife, Inc.
MetLife, Inc.
Notes to Consolidated Financial Statements — (Continued)
reduction of additional paid-in capital. Upon settlement with the bank, the Company increased additional paid-in capital and reduced
treasury stock.
• See Note 25 for further information with respect to an accelerated common stock repurchase agreement executed subsequent to
December 31, 2007.
The Company also repurchased 3.1 million and 4.6 million shares through open market purchases for $200 million and $268 million,
respectively, during the years ended December 31, 2007 and 2006, respectively.
Cumulatively, the Company repurchased 26.6 million and 8.6 million shares of its common stock for $1.7 billion and $500 million during
the years ended December 31, 2007 and 2006, respectively. The Company did not repurchase any shares of its common stock during the
year ended December 31, 2005. During the years ended December 31, 2007, 2006 and 2005, 3.9 million, 3.1 million and 25.0 million
shares of common stock were issued from treasury stock for $172 million, $102 million and $819 million, respectively, of which 22.4 million
shares with a market value of $1 billion were issued in connection with the acquisition of Travelers on July 1, 2005. See Note 2.
At December 31, 2006 the Company had $216 million remaining on the October 2004 common stock repurchase program which was
subsequently reduced by $8 million to $208 million after the February 2007 cash adjustment to the December 2006 accelerated common
stock repurchase agreement. The February 2007 stock repurchase program authorization was fully utilized during 2007. At December 31,
2007, $511 million remained on the Company’s September 2007 common stock repurchase program. The $511 million remaining on the
September 2007 common stock repurchase program was reduced by $450 million to $61 million upon settlement of the accelerated stock
repurchase agreement executed during December 2007 but for which no settlement occurred until January 2008. Subsequent to the
January 2008 authorization, the amount remaining under these repurchase programs was $1,061 million. After execution of the
accelerated stock repurchase agreement in February 2008 and certain open market purchases as more fully described in Note 25,
the Company’s remaining authorization is $261 million.
Future common stock repurchases will be dependent upon several factors, including the Company’s capital position, its financial
strength and credit ratings, general market conditions and the price of the Company’s common stock.
Stock Purchase Contracts
See Note 13 regarding stock purchase contracts issued by the Company on June 21, 2005 in connection with the issuance of the
common equity units.
Dividends
The table below presents declaration, record and payment dates, as well as per share and aggregate dividend amounts, for the
common stock:
Declaration Date Record Date Payment Date Per Share Aggregate
Dividend
(In millions,
except per share data)
October 23, 2007 . . . . . . . . . . November 6, 2007 December 14, 2007 $0.74 $541
October 24, 2006 . . . . . . . . . . November 6, 2006 December 15, 2006 $0.59 $450
October 25, 2005 . . . . . . . . . . November 7, 2005 December 15, 2005 $0.52 $394
Stock-Based Compensation Plans
Overview
As described more fully in Note 1, effective January 1, 2006, the Company adopted SFAS 123(r), using the modified prospective
transition method. The adoption of SFAS 123(r) did not have a significant impact on the Company’s financial position or results of
operations.
Description of Plans
The MetLife, Inc. 2000 Stock Incentive Plan, as amended (the “Stock Incentive Plan”), authorized the granting of awards in the form of
options to buy shares of the Company’s common stock (“Stock Options”) that either qualify as incentive Stock Options under Section 422A
of the Internal Revenue Code or are non-qualified. The MetLife, Inc. 2000 Directors Stock Plan, as amended (the “Directors Stock Plan”),
authorized the granting of awards in the form of the Company’s common stock, non-qualified Stock Options, or a combination of the
foregoing to outside Directors of the Company. Under the MetLife, Inc. 2005 Stock and Incentive Compensation Plan, as amended (the
“2005 Stock Plan”), awards granted may be in the form of Stock Options, Stock Appreciation Rights, Restricted Stock or Restricted Stock
Units, Performance Shares or Performance Share Units, Cash-Based Awards, and Stock-Based Awards (each as defined in the 2005
Stock Plan). Under the MetLife, Inc. 2005 Non-Management Director Stock Compensation Plan (the “2005 Directors Stock Plan”), awards
granted may be in the form of non-qualified Stock Options, Stock Appreciation Rights, Restricted Stock or Restricted Stock Units, or
Stock-Based Awards (each as defined in the 2005 Directors Stock Plan). The Stock Incentive Plan, Directors Stock Plan, 2005 Stock Plan,
the 2005 Directors Stock Plan and the LTPCP, as described below, are hereinafter collectively referred to as the “Incentive Plans.”
The aggregate number of shares reserved for issuance under the 2005 Stock Plan and the LTPCP is 68,000,000, plus those shares
available but not utilized under the Stock Incentive Plan and those shares utilized under the Stock Incentive Plan that are recovered due to
forfeiture of Stock Options. Additional shares carried forward from the Stock Incentive Plan and available for issuance under the 2005
Stock Plan were 12,506,003 as of December 31, 2007. There were no shares carried forward from the Directors Stock Plan. Each share
issued under the 2005 Stock Plan in connection with a Stock Option or Stock Appreciation Right reduces the number of shares remaining
for issuance under that plan by one, and each share issued under the 2005 Stock Plan in connection with awards other than Stock Options
or Stock Appreciation Rights reduces the number of shares remaining for issuance under that plan by 1.179 shares. The number of shares
F-67MetLife, Inc.
MetLife, Inc.
Notes to Consolidated Financial Statements — (Continued)
reserved for issuance under the 2005 Directors Stock Plan are 2,000,000. As of December 31, 2007, the aggregate number of shares
remaining available for issuance pursuant to the 2005 Stock Plan and the 2005 Directors Stock Plan were 60,862,366 and 1,918,170,
respectively.
Stock Option exercises and other stock-based awards to employees settled in shares are satisfied through the issuance of shares held
in treasury by the Company. Under the current authorized share repurchase program, as described previously, sufficient treasury shares
exist to satisfy foreseeable obligations under the Incentive Plans.
Compensation expense related to awards under the Incentive Plans is recognized based on the number of awards expected to vest,
which represents the awards granted less expected forfeitures over the life of the award, as estimated at the date of grant. Unless a
material deviation from the assumed rate is observed during the term in which the awards are expensed, any adjustment necessary to
reflect differences in actual experience is recognized in the period the award becomes payable or exercisable. Compensation expense of
$145 million, $144 million and $120 million, and income tax benefits of $51 million, $50 million and $42 million, related to the Incentive
Plans was recognized for the years ended December 31, 2007, 2006 and 2005, respectively. Compensation expense is principally related
to the issuance of Stock Options, Performance Shares and LTPCP arrangements.
As described in Note 1, the Company changed its policy prospectively for recognizing expense for stock-based awards to retirement
eligible employees. Had the Company continued to recognize expense over the stated requisite service period, compensation expense
related to the Incentive Plans would have been $118 million, $116 million and $120 million, rather than $145 million, $144 million and
$120 million, for the years ended December 31, 2007, 2006 and 2005, respectively. Had the Company applied the policy of recognizing
expense related to stock-based compensation over the shorter of the requisite service period or the period to attainment of retirement
eligibility for awards granted prior to January 1, 2006, pro forma compensation expense would have been $118 million, $120 million and
$122 million for the years ended December 31, 2007, 2006 and 2005, respectively.
Stock Options
All Stock Options granted had an exercise price equal to the closing price of the Company’s common stock as reported on the New York
Stock Exchange on the date of grant, and have a maximum term of ten years. Certain Stock Options granted under the Stock Incentive Plan
and the 2005 Stock Plan have or will become exercisable over a three year period commencing with the date of grant, while other Stock
Options have or will become exercisable three years after the date of grant. Stock Options issued under the Directors Stock Plan were
exercisable immediately. The date at which any Stock Option issued under the 2005 Directors Stock Plan becomes exercisable would be
determined at the time such Stock Option is granted.
A summary of the activity related to Stock Options for the year ended December 31, 2007 is presented below. The aggregate intrinsic
value was computed using the closing share price on December 31, 2007 of $61.62 and December 29, 2006 of $59.01, as applicable.
Shares Under
Option
Weighted
Average
Exercise Price
Weighted
Average
Remaining
Contractual
Term
Aggregate
Intrinsic Value
(Years) (In millions)
Outstanding at January 1, 2007 . . . . . . . . . . . . . . . . . . . . . . . . 24,891,651 $34.68 6.58 $606
Granted . . . . . . . . . . . . . . . . . . . . . . . . . . . . . . . . . . . . . . . . 3,297,875 $62.86
Exercised . . . . . . . . . . . . . . . . . . . . . . . . . . . . . . . . . . . . . . . (3,518,083) $31.33
Cancelled/Expired . . . . . . . . . . . . . . . . . . . . . . . . . . . . . . . . . (68,314) $30.57
Forfeited. . . . . . . . . . . . . . . . . . . . . . . . . . . . . . . . . . . . . . . . (172,582) $55.13
Outstanding at December 31, 2007 . . . . . . . . . . . . . . . . . . . . . . 24,430,547 $38.83 6.17 $557
Aggregate number of stock options expected to vest at
December 31, 2007 . . . . . . . . . . . . . . . . . . . . . . . . . . . . . . . 23,845,241 $38.49 6.12 $551
Exercisable at December 31, 2007 . . . . . . . . . . . . . . . . . . . . . . 17,460,955 $32.83 5.28 $503
Prior to January 1, 2005, the Black-Scholes model was used to determine the fair value of Stock Options granted and recognized in the
financial statements or as reported in the pro forma disclosure which follows. The fair value of Stock Options issued on or after January 1,
2005 was estimated on the date of grant using a binomial lattice model. The Company made this change because lattice models produce
more accurate option values due to the ability to incorporate assumptions about grantee exercise behavior resulting from changes in the
price of the underlying shares. In addition, lattice models allow for changes in critical assumptions over the life of the option in comparison
to closed-form models like Black-Scholes, which require single-value assumptions at the time of grant.
The Company used daily historical volatility since the inception of trading when calculating Stock Option values using the Black-Scholes
model. In conjunction with the change to the binomial lattice model, the Company began estimating expected future volatility based upon
an analysis of historical prices of the Holding Company’s common stock and call options on that common stock traded on the open market.
The Company uses a weighted-average of the implied volatility for publicly traded call options with the longest remaining maturity nearest to
the money as of each valuation date and the historical volatility, calculated using monthly closing prices of the Holding Company’s common
stock. The Company chose a monthly measurement interval for historical volatility as it believes this better depicts the nature of employee
option exercise decisions being based on longer-term trends in the price of the underlying shares rather than on daily price movements.
The risk-free rate is based on observed interest rates for instruments with maturities similar to the expected term of the Stock Options.
Whereas the Black-Scholes model requires a single spot rate for instruments with a term matching the expected life of the option at the
valuation date, the binomial lattice model allows for the use of different rates for each year over the contractual term of the option. The table
F-68 MetLife, Inc.
MetLife, Inc.
Notes to Consolidated Financial Statements — (Continued)
below presents the full range of imputed forward rates for U.S. Treasury Strips that was used in the binomial lattice model over the
contractual term of all Stock Options granted in the period.
Dividend yield is determined based on historical dividend distributions compared to the price of the underlying common stock as of the
valuation date and held constant over the life of the Stock Option.
Use of the Black-Scholes model requires an input of the expected life of the Stock Options, or the average number of years before
Stock Options will be exercised or expired. The Company estimated expected life using the historical average years to exercise or
cancellation and average remaining years outstanding for vested Stock Options. Alternatively, the binomial model used by the Company
incorporates the contractual term of the Stock Options and then considers expected exercise behavior and a post-vesting termination rate,
or the rate at which vested options are exercised or expire prematurely due to termination of employment, to derive an expected life. The
post-vesting termination rate is determined from actual historical exercise and expiration activity under the Incentive Plans. Exercise
behavior in the binomial lattice model used by the Company is expressed using an exercise multiple, which reflects the ratio of exercise
price to the strike price of Stock Options granted at which holders of the Stock Options are expected to exercise. The exercise multiple is
derived from actual historical exercise activity.
The following weighted average assumptions, with the exception of risk-free rate, which is expressed as a range, were used to
determine the fair value of Stock Options issued during the:
2007 2006 2005
Years Ended December 31,
Dividend yield . . . . . . . . . . . . . . . . . . . . . . . . . . . . . . . . . . . . . . . 0.94% 1.04% 1.19%
Risk-free rate of return . . . . . . . . . . . . . . . . . . . . . . . . . . . . . . . . . . 4.30%-5.32% 4.17%-4.96% 3.34%-5.41%
Expected volatility . . . . . . . . . . . . . . . . . . . . . . . . . . . . . . . . . . . . . 19.54% 22.00% 23.24%
Exercise multiple . . . . . . . . . . . . . . . . . . . . . . . . . . . . . . . . . . . . . 1.66 1.52 1.48
Post-vesting termination rate . . . . . . . . . . . . . . . . . . . . . . . . . . . . . . 3.66% 4.09% 5.19%
Contractual term (years) . . . . . . . . . . . . . . . . . . . . . . . . . . . . . . . . . 10 10 10
Expected life (years) . . . . . . . . . . . . . . . . . . . . . . . . . . . . . . . . . . . 6 6 6
Weighted average exercise price of stock options granted. . . . . . . . . . . $62.86 $50.21 $38.70
Weighted average fair value of stock options granted . . . . . . . . . . . . . . $17.76 $13.84 $10.09
Compensation expense related to Stock Option awards expected to vest and granted prior to January 1, 2006 is recognized ratably
over the requisite service period, which equals the vesting term. Compensation expense related to Stock Option awards expected to vest
and granted on or after January 1, 2006 is recognized ratably over the requisite service period or the period to retirement eligibility, if
shorter. Compensation expense of $55 million, $56 million and $50 million related to Stock Options was recognized for the years ended
December 31, 2007, 2006 and 2005, respectively.
Had compensation expense for grants awarded prior to January 1, 2003 been determined based on the fair value at the date of grant
rather than the intrinsic value method, the Company’s earnings and earnings per common share amounts would have been reduced to the
following pro forma amounts for the following:
Year Ended
December 31,
2005
(In millions,
except
per share
data)
Net income available to common shareholders . . . . . . . . . . . . . . . . . . . . . . . . . . . . . . . . . . . . . . . . . . . . $4,651
Add: Stock option-based employee compensation expense included in reported net income, net of income tax . . $ 33
Deduct: Total stock option-based employee compensation determined under fair value based method for all
awards, net of income tax . . . . . . . . . . . . . . . . . . . . . . . . . . . . . . . . . . . . . . . . . . . . . . . . . . . . . . . . $ (35)
Pro forma net income available to common shareholders. . . . . . . . . . . . . . . . . . . . . . . . . . . . . . . . . . . . . . $4,649
Basic earnings per common share
As reported . . . . . . . . . . . . . . . . . . . . . . . . . . . . . . . . . . . . . . . . . . . . . . . . . . . . . . . . . . . . . . . . . . . $ 6.21
Pro forma . . . . . . . . . . . . . . . . . . . . . . . . . . . . . . . . . . . . . . . . . . . . . . . . . . . . . . . . . . . . . . . . . . . . $ 6.21
Diluted earnings per common share
As reported . . . . . . . . . . . . . . . . . . . . . . . . . . . . . . . . . . . . . . . . . . . . . . . . . . . . . . . . . . . . . . . . . . . $ 6.16
Pro forma . . . . . . . . . . . . . . . . . . . . . . . . . . . . . . . . . . . . . . . . . . . . . . . . . . . . . . . . . . . . . . . . . . . . $ 6.15
As of December 31, 2007, there were $41 million of total unrecognized compensation costs related to Stock Options. It is expected
that these costs will be recognized over a weighted average period of 1.70 years.
F-69MetLife, Inc.
MetLife, Inc.
Notes to Consolidated Financial Statements — (Continued)
The following is a summary of Stock Option exercise activity for the:
2007 2006 2005
Years Ended
December 31,
(In millions)
Total intrinsic value of stock options exercised . . . . . . . . . . . . . . . . . . . . . . . . . . . . . . . . . . . . . . . $122 $65 $39
Cash received from exercise of stock options . . . . . . . . . . . . . . . . . . . . . . . . . . . . . . . . . . . . . . . . $110 $83 $72
Tax benefit realized from stock options exercised . . . . . . . . . . . . . . . . . . . . . . . . . . . . . . . . . . . . . . $ 43 $23 $13
Performance Shares
Beginning in 2005, certain members of management were awarded Performance Shares under (and as defined in) the 2005 Stock Plan.
Participants are awarded an initial target number of Performance Shares with the final number of Performance Shares payable being
determined by the product of the initial target multiplied by a factor of 0.0 to 2.0. The factor applied is based on measurements of the
Company’s performance with respect to: (i) the change in annual net operating earnings per share, as defined; and (ii) the proportionate
total shareholder return, as defined, with reference to the three-year performance period relative to other companies in the S&P Insurance
Index with reference to the same three-year period. Performance Share awards will normally vest in their entirety at the end of the three-
year performance period (subject to certain contingencies) and will be payable entirely in shares of the Company’s common stock.
The following is a summary of Performance Share activity for the year ended December 31, 2007:
Performance
Shares
Weighted Average
Grant Date
Fair Value
Outstanding at January 1, 2007 . . . . . . . . . . . . . . . . . . . . . . . . . . . . . . . . . . . . . . . . . . 1,849,575 $42.24
Granted . . . . . . . . . . . . . . . . . . . . . . . . . . . . . . . . . . . . . . . . . . . . . . . . . . . . . . . . 916,075 $60.86
Forfeited . . . . . . . . . . . . . . . . . . . . . . . . . . . . . . . . . . . . . . . . . . . . . . . . . . . . . . . (75,525) $49.20
Outstanding at December 31, 2007 . . . . . . . . . . . . . . . . . . . . . . . . . . . . . . . . . . . . . . . 2,690,125 $48.39
Performance Shares expected to vest at December 31, 2007 . . . . . . . . . . . . . . . . . . . . . . 2,641,669 $48.20
Performance Share amounts above represent aggregate initial target awards and do not reflect potential increases or decreases
resulting from the final performance factor to be determined at the end of the respective performance period. As of December 31, 2007,
the three year performance period for the 2005 Performance Share grants was completed. Included in the immediately preceding table are
965,525 outstanding Performance Shares to which the final performance factor will be applied. The calculation of the performance factor is
expected to be finalized during the second quarter of 2008 after all data necessary to perform the calculation is publicly available.
Performance Share awards are accounted for as equity awards but are not credited with dividend-equivalents for actual dividends paid
on the Holding Company’s common stock during the performance period. Accordingly, the fair value of Performance Shares is based upon
the closing price of the Holding Company’s common stock on the date of grant, reduced by the present value of estimated dividends to be
paid on that stock during the performance period.
Compensation expense related to initial Performance Shares granted prior to January 1, 2006 and expected to vest is recognized
ratably during the performance period. Compensation expense related to initial Performance Shares granted on or after January 1, 2006
and expected to vest is recognized ratably over the performance period or the period to retirement eligibility, if shorter. Performance Shares
expected to vest and the related compensation expenses may be further adjusted by the performance factor most likely to be achieved, as
estimated by management, at the end of the performance period. Compensation expense of $90 million, $74 million and $24 million,
related to Performance Shares was recognized for the years ended December 31, 2007, 2006 and 2005, respectively.
As of December 31, 2007, there were $57 million of total unrecognized compensation costs related to Performance Share awards. It is
expected that these costs will be recognized over a weighted average period of 1.72 years.
Long-Term Performance Compensation Plan
Prior to January 1, 2005, the Company granted stock-based compensation to certain members of management under the LTPCP. Each
participant was assigned a target compensation amount (an “Opportunity Award”) at the inception of the performance period with the final
compensation amount determined based on the total shareholder return on the Company’s common stock over the three-year perfor-
mance period, subject to limited further adjustment approved by the Company’s Board of Directors. Payments on the Opportunity Awards
were normally payable in their entirety (subject to certain contingencies) at the end of the three-year performance period, and were paid in
whole or in part with shares of the Company’s common stock, as approved by the Company’s Board of Directors. There were no new
grants under the LTPCP during the years ended December 31, 2007, 2006 and 2005.
A portion of each Opportunity Award under the LTPCP was settled in shares of the Holding Company’s common stock while the
remainder was settled in cash. The portion of the Opportunity Award settled in shares of the Holding Company’s common stock was
accounted for as an equity award with the fair value of the award determined based upon the closing price of the Holding Company’s
common stock on the date of grant. The compensation expense associated with the equity award, based upon the grant date fair value,
was recognized into expense ratably over the respective three-year performance period. The portion of the Opportunity Award settled in
cash was accounted for as a liability and was remeasured using the closing price of the Holding Company’s common stock on the final day
of each subsequent reporting period during the three-year performance period.
The final LTPCP performance period concluded during the six months ended June 30, 2007. Final Opportunity Awards in the amount of
618,375 shares of the Company’s common stock and $16 million in cash were paid on April 18, 2007. No significant compensation
F-70 MetLife, Inc.
MetLife, Inc.
Notes to Consolidated Financial Statements — (Continued)
expense related to LTPCP was recognized during the year ended December 31, 2007. Compensation expense of $14 million and
$46 million, related to LTPCP Opportunity Awards was recognized for the years ended December 31, 2006 and 2005, respectively.
Statutory Equity and Income
Each insurance company’s state of domicile imposes minimum risk-based capital (“RBC”) requirements that were developed by the
National Association of Insurance Commissioners (“NAIC”). The formulas for determining the amount of RBC specify various weighting
factors that are applied to financial balances or various levels of activity based on the perceived degree of risk. Regulatory compliance is
determined by a ratio of total adjusted capital, as defined by the NAIC, to authorized control level RBC, as defined by the NAIC. Companies
below specific trigger points or ratios are classified within certain levels, each of which requires specified corrective action. Each of the
Holding Company’s U.S. insurance subsidiaries exceeded the minimum RBC requirements for all periods presented herein.
The NAIC adopted the Codification of Statutory Accounting Principles (“Codification”) in 2001. Codification was intended to standardize
regulatory accounting and reporting to state insurance departments. However, statutory accounting principles continue to be established
by individual state laws and permitted practices. Modifications by the various state insurance departments may impact the effect of
Codification on the statutory capital and surplus of MLIC and the Holding Company’s other insurance subsidiaries.
Statutory accounting principles differ from GAAP primarily by charging policy acquisition costs to expense as incurred, establishing
future policy benefit liabilities using different actuarial assumptions, reporting surplus notes as surplus instead of debt and valuing
securities on a different basis.
In addition, certain assets are not admitted under statutory accounting principles and are charged directly to surplus. The most
significant assets not admitted by the Company are net deferred income tax assets resulting from temporary differences between statutory
accounting principles basis and tax basis not expected to reverse and become recoverable within a year. Further, statutory accounting
principles do not give recognition to purchase accounting adjustments.
Statutory net income of MLIC, a New York domiciled insurer, was $2.1 billion, $1.0 billion and $2.2 billion for the years ended
December 31, 2007, 2006 and 2005, respectively. Statutory capital and surplus, as filed with the Department, was $13.0 billion and
$9.2 billion at December 31, 2007 and 2006, respectively.
Statutory net income of MICC, a Connecticut domiciled insurer, was $1.1 billion and $856 million for the years ended December 31,
2007 and 2006, respectively, and $470 million from the date of purchase, for the six month period ended December 31, 2005. Statutory
capital and surplus, as filed with the Connecticut Insurance Department, was $4.2 billion and $4.1 billion at December 31, 2007 and 2006,
respectively. Due to the merger of MetLife Life and Annuity Company of Connecticut with MICC, the 2006 statutory net income balance
was adjusted.
Statutory net income of MPC, a Rhode Island domiciled insurer, was $400 million, $385 million and $289 million for the years ended
December 31, 2007, 2006 and 2005, respectively. Statutory capital and surplus, as filed with the Insurance Department of Rhode Island,
was $1.8 billion and $1.9 billion at December 31, 2007 and 2006, respectively.
Statutory net income of MTL, a Delaware domiciled insurer, was $103 million, $2.8 billion and $353 million for the years ended
December 31, 2007, 2006 and 2005, respectively. Statutory capital and surplus, as filed with the Delaware Insurance Department was
$1.1 billion and $1.0 billion as of December 31, 2007 and 2006, respectively.
Dividend Restrictions
The table below sets forth the dividends permitted to be paid by the respective insurance subsidiary without insurance regulatory
approval and the respective dividends paid:
Company
Permitted
w/o
Approval(1) Paid(2)
Permitted
w/o
Approval(3) Paid(2)
Permitted
w/o
Approval(3)
2008 2007 2006
(In millions)
Metropolitan Life Insurance Company . . . . . . . . . . . . . . . . . . . . . . $1,299 $500 $919 $ 863 $863
MetLife Insurance Company of Connecticut . . . . . . . . . . . . . . . . . . $1,026 $690(5) $690 $ 917(4) $ —
Metropolitan Tower Life Insurance Company . . . . . . . . . . . . . . . . . $ 113 $ — $104 $2,300 $ 85
Metropolitan Property and Casualty Insurance Company . . . . . . . . . . . . . . . $ — $400 $ 16 $ 300 $178
(1) Reflects dividend amounts that may be paid during 2008 without prior regulatory approval. However, if paid before a specified date during
2008, some or all of such dividends may require regulatory approval.
(2) Includes amounts paid including those requiring regulatory approval.
(3) Reflects dividend amounts that could have been paid during the relevant year without prior regulatory approval.
(4) Includes a return of capital of $259 million.
(5) Includes a return of capital of $404 million as approved by the applicable insurance department, of which $350 million was paid to the
Holding Company.
Under New York State Insurance Law, MLIC is permitted, without prior insurance regulatory clearance, to pay stockholder dividends to
the Holding Company as long as the aggregate amount of all such dividends in any calendar year does not exceed the lesser of: (i) 10% of
its surplus to policyholders as of the end of the immediately preceding calendar year; or (ii) its statutory net gain from operations for the
immediately preceding calendar year (excluding realized capital gains). MLIC will be permitted to pay a cash dividend to the Holding
Company in excess of the lesser of such two amounts only if it files notice of its intention to declare such a dividend and the amount thereof
with the Superintendent and the Superintendent does not disapprove the distribution within 30 days of its filing. Under New York State
Insurance Law, the Superintendent has broad discretion in determining whether the financial condition of a stock life insurance company
would support the payment of such dividends to its shareholders. The New York State Department of Insurance (the “Department”) has
F-71MetLife, Inc.
MetLife, Inc.
Notes to Consolidated Financial Statements — (Continued)
established informal guidelines for such determinations. The guidelines, among other things, focus on the insurer’s overall financial
condition and profitability under statutory accounting practices.
Under Connecticut State Insurance Law, MICC is permitted, without prior insurance regulatory clearance, to pay shareholder dividends
to its parent as long as the amount of such dividends, when aggregated with all other dividends in the preceding 12 months, does not
exceed the greater of: (i) 10% of its surplus to policyholders as of the end of the immediately preceding calendar year; or (ii) its statutory net
gain from operations for the immediately preceding calendar year. MICC will be permitted to pay a cash dividend in excess of the greater of
such two amounts only if it files notice of its declaration of such a dividend and the amount thereof with the Connecticut Commissioner of
Insurance (“Commissioner”) and the Commissioner does not disapprove the payment within 30 days after notice. In addition, any dividend
that exceeds earned surplus (unassigned funds, reduced by 25% of unrealized appreciation in value or revaluation of assets or unrealized
profits on investments) as of the last filed annual statutory statement requires insurance regulatory approval. Under Connecticut State
Insurance Law, the Commissioner has broad discretion in determining whether the financial condition of a stock life insurance company
would support the payment of such dividends to its shareholders. The Connecticut State Insurance Law requires prior approval for any
dividends for a period of two years following a change in control. As a result of the acquisition of MICC by the Holding Company on July 1,
2005, under Connecticut State Insurance Law, all dividend payments by MICC through June 30, 2007 required prior approval of the
Commissioner.
Under Delaware State Insurance Law, Metropolitan Tower Life Insurance Company (“MTL”) is permitted, without prior insurance
regulatory clearance, to pay a stockholder dividend to the Holding Company as long as the amount of the dividend when aggregated with
all other dividends in the preceding 12 months does not exceed the greater of: (i) 10% of its surplus to policyholders as of the end of the
immediately preceding calendar year; or (ii) its statutory net gain from operations for the immediately preceding calendar year (excluding
realized capital gains). MTL will be permitted to pay a cash dividend to the Holding Company in excess of the greater of such two amounts
only if it files notice of the declaration of such a dividend and the amount thereof with the Delaware Commissioner of Insurance (the
“Delaware Commissioner”) and the Delaware Commissioner does not disapprove the distribution within 30 days of its filing. In addition, any
dividend that exceeds earned surplus (defined as unassigned funds) as of the last filed annual statutory statement requires insurance
regulatory approval. Under Delaware State Insurance Law, the Delaware Commissioner has broad discretion in determining whether the
financial condition of a stock life insurance company would support the payment of such dividends to its shareholders.
Under Rhode Island State Insurance Law, MPC is permitted, without prior insurance regulatory clearance, to pay a stockholder dividend
to the Holding Company as long as the aggregate amount of all such dividends in any twelve-month period does not exceed the lesser of:
(i) 10% of its surplus to policyholders as of the end of the immediately preceding calendar year; or (ii) net income, not including realized
capital gains, for the immediately preceding calendar year. MPC will be permitted to pay a cash dividend to the Holding Company in excess
of the lesser of such two amounts only if it files notice of its intention to declare such a dividend and the amount thereof with the Rhode
Island Commissioner of Insurance (the “Rhode Island Commissioner”) and the Rhode Island Commissioner does not disapprove the
distribution within 30 days of its filing. Under Rhode Island State Insurance Code, the Rhode Island Commissioner has broad discretion in
determining whether the financial condition of a stock property and casualty insurance company would support the payment of such
dividends to its shareholders. Because MPC’s net income for the year ended December 31, 2007 excluding net realized capital gains and
dividends paid, was negative, MPC cannot pay any dividends in 2008 without regulatory approval.
Other Comprehensive Income (Loss)
The following table sets forth the reclassification adjustments required for the years ended December 31, 2007, 2006 and 2005 in other
comprehensive income (loss) that are included as part of net income for the current year that have been reported as a part of other
comprehensive income (loss) in the current or prior year:
2007 2006 2005
Years Ended December 31,
(In millions)
Holding gains (losses) on investments arising during the year . . . . . . . . . . . . . . . . . . . . . . . $(1,485) $(1,022) $(3,697)
Income tax effect of holding gains (losses) . . . . . . . . . . . . . . . . . . . . . . . . . . . . . . . . . . . 581 379 1,391
Reclassification adjustments:
Recognized holding (gains) losses included in current year income . . . . . . . . . . . . . . . . . . 176 916 524
Amortization of premiums and accretion of discounts associated with investments . . . . . . . . (831) (600) (199)
Income tax effect . . . . . . . . . . . . . . . . . . . . . . . . . . . . . . . . . . . . . . . . . . . . . . . . . . . . 254 (117) (122)
Allocation of holding losses on investments relating to other policyholder amounts. . . . . . . . . . 676 581 1,670
Income tax effect of allocation of holding losses to other policyholder amounts . . . . . . . . . . . . (264) (215) (629)
Unrealized investment gains of subsidiary at date of sale . . . . . . . . . . . . . . . . . . . . . . . . . . — — 15
Deferred income tax on unrealized investment gains of subsidiary at date of sale. . . . . . . . . . . — — (5)
Net unrealized investment gains (losses) . . . . . . . . . . . . . . . . . . . . . . . . . . . . . . . . . . . . . (893) (78) (1,052)
Foreign currency translation adjustments . . . . . . . . . . . . . . . . . . . . . . . . . . . . . . . . . . . . 290 46 (86)
Foreign currency translation adjustments of subsidiary at date of sale . . . . . . . . . . . . . . . . . . — — 5
Foreign currency translation adjustment . . . . . . . . . . . . . . . . . . . . . . . . . . . . . . . . . . . . . 290 46 (81)
Minimum pension liability adjustment . . . . . . . . . . . . . . . . . . . . . . . . . . . . . . . . . . . . . . . — (18) 89
Deferred benefit plan adjustment . . . . . . . . . . . . . . . . . . . . . . . . . . . . . . . . . . . . . . . . . . 563 — —
Other comprehensive income (loss) . . . . . . . . . . . . . . . . . . . . . . . . . . . . . . . . . . . . . . . . $ (40) $ (50) $(1,044)
F-72 MetLife, Inc.
MetLife, Inc.
Notes to Consolidated Financial Statements — (Continued)
19. Other Expenses
Information on other expenses is as follows:
2007 2006 2005
Years Ended December 31,
(In millions)
Compensation . . . . . . . . . . . . . . . . . . . . . . . . . . . . . . . . . . . . . . . . . . . . . . . . . . . . . $ 3,556 $ 3,426 $ 3,217
Commissions . . . . . . . . . . . . . . . . . . . . . . . . . . . . . . . . . . . . . . . . . . . . . . . . . . . . . 4,114 3,801 3,510
Interest and debt issue costs . . . . . . . . . . . . . . . . . . . . . . . . . . . . . . . . . . . . . . . . . . . 1,116 900 659
Amortization of DAC and VOBA . . . . . . . . . . . . . . . . . . . . . . . . . . . . . . . . . . . . . . . . . . 2,776 2,422 2,450
Capitalization of DAC . . . . . . . . . . . . . . . . . . . . . . . . . . . . . . . . . . . . . . . . . . . . . . . . (3,892) (3,589) (3,604)
Rent, net of sublease income . . . . . . . . . . . . . . . . . . . . . . . . . . . . . . . . . . . . . . . . . . . 309 287 296
Minority interest . . . . . . . . . . . . . . . . . . . . . . . . . . . . . . . . . . . . . . . . . . . . . . . . . . . . 240 234 154
Insurance tax . . . . . . . . . . . . . . . . . . . . . . . . . . . . . . . . . . . . . . . . . . . . . . . . . . . . . 760 712 530
Other. . . . . . . . . . . . . . . . . . . . . . . . . . . . . . . . . . . . . . . . . . . . . . . . . . . . . . . . . . . 2,694 2,590 2,052
Total other expenses . . . . . . . . . . . . . . . . . . . . . . . . . . . . . . . . . . . . . . . . . . . . . . . $11,673 $10,783 $ 9,264
20. Earnings Per Common Share
The following table presents the weighted average shares used in calculating basic earnings per common share and those used in
calculating diluted earnings per common share for each income category presented below:
2007 2006 2005
Years Ended December 31,
(In millions, except share and per share data)
Weighted average common stock outstanding for basic earnings per
common share . . . . . . . . . . . . . . . . . . . . . . . . . . . . . . . . . . . . . . . 744,153,514 761,105,024 749,022,816
Incremental common shares from assumed:
Stock purchase contracts underlying common equity units(1) . . . . . . . . . 7,138,900 1,416,134 —
Exercise or issuance of stock-based awards. . . . . . . . . . . . . . . . . . . . 10,971,585 8,182,938 6,313,540
Weighted average common stock outstanding for diluted earnings per
common share . . . . . . . . . . . . . . . . . . . . . . . . . . . . . . . . . . . . . . . 762,263,999 770,704,096 755,336,356
Earnings per common share before preferred stock dividends:
Income from continuing operations . . . . . . . . . . . . . . . . . . . . . . $ 4,280 $ 3,071 $ 3,071
Basic . . . . . . . . . . . . . . . . . . . . . . . . . . . . . . . . . . . . . . . . . . . . $ 5.75 $ 4.03 $ 4.10
Diluted . . . . . . . . . . . . . . . . . . . . . . . . . . . . . . . . . . . . . . . . . . . $ 5.62 $ 3.99 $ 4.06
Income from discontinued operations, net of income tax . . . . . . . $ 37 $ 3,222 $ 1,643
Basic . . . . . . . . . . . . . . . . . . . . . . . . . . . . . . . . . . . . . . . . . . . . $ 0.05 $ 4.24 $ 2.19
Diluted . . . . . . . . . . . . . . . . . . . . . . . . . . . . . . . . . . . . . . . . . . . $ 0.04 $ 4.18 $ 2.18
Net income . . . . . . . . . . . . . . . . . . . . . . . . . . . . . . . . . . . . . . . . $ 4,317 $ 6,293 $ 4,714
Basic . . . . . . . . . . . . . . . . . . . . . . . . . . . . . . . . . . . . . . . . . . . . $ 5.80 $ 8.27 $ 6.29
Diluted . . . . . . . . . . . . . . . . . . . . . . . . . . . . . . . . . . . . . . . . . . . $ 5.66 $ 8.17 $ 6.24
Earnings per common share after preferred stock dividends:
Income from continuing operations . . . . . . . . . . . . . . . . . . . . . . $ 4,280 $ 3,071 $ 3,071
Preferred stock dividends . . . . . . . . . . . . . . . . . . . . . . . . . . . . . . . . 137 134 63
Income from continuing operations available to common
shareholders . . . . . . . . . . . . . . . . . . . . . . . . . . . . . . . . . . . . . $ 4,143 $ 2,937 $ 3,008
Basic . . . . . . . . . . . . . . . . . . . . . . . . . . . . . . . . . . . . . . . . . . . . $ 5.57 $ 3.85 $ 4.02
Diluted . . . . . . . . . . . . . . . . . . . . . . . . . . . . . . . . . . . . . . . . . . . $ 5.44 $ 3.81 $ 3.98
Net income . . . . . . . . . . . . . . . . . . . . . . . . . . . . . . . . . . . . . . . . $ 4,317 $ 6,293 $ 4,714
Preferred stock dividends . . . . . . . . . . . . . . . . . . . . . . . . . . . . . . . . 137 134 63
Net income available to common shareholders . . . . . . . . . . . . . . . . . . $ 4,180 $ 6,159 $ 4,651
Basic . . . . . . . . . . . . . . . . . . . . . . . . . . . . . . . . . . . . . . . . . . . . $ 5.62 $ 8.09 $ 6.21
Diluted . . . . . . . . . . . . . . . . . . . . . . . . . . . . . . . . . . . . . . . . . . . $ 5.48 $ 7.99 $ 6.16
(1) See Note 13 for a description of the Company’s common equity units.
F-73MetLife, Inc.
MetLife, Inc.
Notes to Consolidated Financial Statements — (Continued)
21. Quarterly Results of Operations (Unaudited)
The unaudited quarterly results of operations for 2007 and 2006 are summarized in the table below:
March 31, June 30, September 30, December 31,
Three Months Ended
(In millions, except per share data)
2007
Total revenues . . . . . . . . . . . . . . . . . . . . . . . . . . . . . . . . . . . . . . . . . . . . . $12,908 $13,216 $13,053 $13,830
Total expenses . . . . . . . . . . . . . . . . . . . . . . . . . . . . . . . . . . . . . . . . . . . . . $11,469 $11,586 $11,668 $12,245
Income from continuing operations . . . . . . . . . . . . . . . . . . . . . . . . . . . . . . . . $ 1,024 $ 1,154 $ 984 $ 1,118
Income (loss) from discontinued operations, net of income tax . . . . . . . . . . . . . . $ (7) $ 9 $ 35 $ —
Net income . . . . . . . . . . . . . . . . . . . . . . . . . . . . . . . . . . . . . . . . . . . . . . . $ 1,017 $ 1,163 $ 1,019 $ 1,118
Net income available to common shareholders . . . . . . . . . . . . . . . . . . . . . . . . $ 983 $ 1,129 $ 985 $ 1,083
Basic earnings per share:
Income from continuing operations available to common shareholders . . . . . . . . $ 1.32 $ 1.50 $ 1.28 $ 1.47
Income from discontinued operations, net of income tax, per common share . . . $ (0.01) $ 0.01 $ 0.05 $ —
Net income . . . . . . . . . . . . . . . . . . . . . . . . . . . . . . . . . . . . . . . . . . . . . . $ 1.35 $ 1.56 $ 1.37 $ 1.52
Net income available to common shareholders, per common share . . . . . . . . . . $ 1.31 $ 1.52 $ 1.32 $ 1.47
Diluted earnings per share:
Income from continuing operations available to common shareholders . . . . . . . . $ 1.29 $ 1.47 $ 1.25 $ 1.44
Income from discontinued operations, net of income tax, per common share . . . $ (0.01) $ 0.01 $ 0.05 $ —
Net income . . . . . . . . . . . . . . . . . . . . . . . . . . . . . . . . . . . . . . . . . . . . . . $ 1.32 $ 1.52 $ 1.34 $ 1.48
Net income available to common shareholders, per common share . . . . . . . . . . $ 1.28 $ 1.48 $ 1.29 $ 1.44
2006
Total revenues . . . . . . . . . . . . . . . . . . . . . . . . . . . . . . . . . . . . . . . . . . . . . $11,528 $11,350 $12,525 $12,851
Total expenses . . . . . . . . . . . . . . . . . . . . . . . . . . . . . . . . . . . . . . . . . . . . . $10,518 $10,553 $11,212 $11,803
Income from continuing operations . . . . . . . . . . . . . . . . . . . . . . . . . . . . . . . . $ 727 $ 592 $ 958 $ 794
Income from discontinued operations, net of income tax . . . . . . . . . . . . . . . . . . $ 20 $ 58 $ 75 $ 3,069
Net income . . . . . . . . . . . . . . . . . . . . . . . . . . . . . . . . . . . . . . . . . . . . . . . $ 747 $ 650 $ 1,033 $ 3,863
Net income available to common shareholders . . . . . . . . . . . . . . . . . . . . . . . . $ 714 $ 617 $ 999 $ 3,829
Basic earnings per share:
Income from continuing operations available to common shareholders . . . . . . . . $ 0.91 $ 0.73 $ 1.21 $ 1.00
Income from discontinued operations, net of income tax, per common share . . . $ 0.03 $ 0.08 $ 0.10 $ 4.03
Net income . . . . . . . . . . . . . . . . . . . . . . . . . . . . . . . . . . . . . . . . . . . . . . $ 0.98 $ 0.85 $ 1.35 $ 5.09
Net income available to common shareholders, per common share . . . . . . . . . . $ 0.94 $ 0.81 $ 1.31 $ 5.04
Diluted earnings per share:
Income from continuing operations available to common shareholders . . . . . . . . $ 0.90 $ 0.73 $ 1.19 $ 0.99
Income from discontinued operations, net of income tax, per common share . . . $ 0.03 $ 0.08 $ 0.10 $ 3.98
Net income . . . . . . . . . . . . . . . . . . . . . . . . . . . . . . . . . . . . . . . . . . . . . . $ 0.97 $ 0.84 $ 1.34 $ 5.00
Net income available to common shareholders, per common share . . . . . . . . . . $ 0.93 $ 0.80 $ 1.29 $ 4.95
22. Business Segment Information
The Company is a leading provider of insurance and other financial services with operations throughout the United States and the
regions of Latin America, Europe, and Asia Pacific. The Company’s business is divided into five operating segments: Institutional,
Individual, Auto & Home, International and Reinsurance, as well as Corporate & Other. These segments are managed separately because
they either provide different products and services, require different strategies or have different technology requirements.
Institutional offers a broad range of group insurance and retirement & savings products and services, including group life insurance,
non-medical health insurance, such as short and long-term disability, long-term care, and dental insurance, and other insurance products
and services. Individual offers a wide variety of protection and asset accumulation products, including life insurance, annuities and mutual
funds. Auto & Home provides personal lines property and casualty insurance, including private passenger automobile, homeowners and
personal excess liability insurance. International provides life insurance, accident and health insurance, annuities and retirement & savings
products to both individuals and groups. Through the Company’s majority-owned subsidiary, RGA, the Reinsurance segment provides
reinsurance of life and annuity policies in North America and various international markets. Additionally, reinsurance of critical illness
policies is provided in select international markets.
F-74 MetLife, Inc.
MetLife, Inc.
Notes to Consolidated Financial Statements — (Continued)
Corporate & Other contains the excess capital not allocated to the business segments, various start-up entities, MetLife Bank and run-
off entities, as well as interest expense related to the majority of the Company’s outstanding debt and expenses associated with certain
legal proceedings and income tax audit issues. Corporate & Other also includes the elimination of all intersegment amounts, which
generally relate to intersegment loans, which bear interest rates commensurate with related borrowings, as well as intersegment
transactions. Additionally, the Company’s asset management business, including amounts reported as discontinued operations, is
included in the results of operations for Corporate & Other. See Note 23 for disclosures regarding discontinued operations, including
real estate.
Economic capital is an internally developed risk capital model, the purpose of which is to measure the risk in the business and to provide
a basis upon which capital is deployed. The economic capital model accounts for the unique and specific nature of the risks inherent in
MetLife’s businesses. As a part of the economic capital process, a portion of net investment income is credited to the segments based on
the level of allocated equity.
Set forth in the tables below is certain financial information with respect to the Company’s segments, as well as Corporate & Other, for
the years ended December 31, 2007, 2006 and 2005. The accounting policies of the segments are the same as those of the Company,
except for the method of capital allocation and the accounting for gains (losses) from intercompany sales, which are eliminated in
consolidation. The Company allocates equity to each segment based upon the economic capital model that allows the Company to
effectively manage its capital. The Company evaluates the performance of each segment based upon net income excluding net investment
gains (losses), net of income tax, adjustments related to net investment gains (losses), net of income tax, the impact from the cumulative
effect of changes in accounting, net of income tax and discontinued operations, other than discontinued real estate, net of income tax,
less preferred stock dividends. The Company allocates certain non-recurring items, such as expenses associated with certain legal
proceedings, to Corporate & Other.
For the Year Ended
December 31, 2007 Institutional Individual
Auto &
Home International Reinsurance
Corporate &
Other Total
(In millions)
Statement of Income:
Premiums . . . . . . . . . . . . . . . . . . . . . . . $ 12,392 $ 4,496 $2,966 $ 3,096 $ 4,910 $ 35 $ 27,895
Universal life and investment- type product
policy fees . . . . . . . . . . . . . . . . . . . . . 803 3,513 — 995 — — 5,311
Net investment income . . . . . . . . . . . . . . . 8,179 7,052 196 1,248 871 1,460 19,006
Other revenues . . . . . . . . . . . . . . . . . . . . 726 599 45 23 77 63 1,533
Net investment gains (losses) . . . . . . . . . . . (580) (99) 16 55 (177) 47 (738)
Policyholder benefits and claims . . . . . . . . . 13,806 5,721 1,807 2,458 3,989 47 27,828
Interest credited to policyholder
account balances . . . . . . . . . . . . . . . . . 3,094 2,030 — 355 262 — 5,741
Policyholder dividends . . . . . . . . . . . . . . . — 1,718 4 4 — — 1,726
Other expenses. . . . . . . . . . . . . . . . . . . . 2,438 4,031 830 1,748 1,226 1,400 11,673
Income from continuing operations before provision
(benefit) for income tax . . . . . . . . . . . . . . . . 2,182 2,061 582 852 204 158 6,039
Provision (benefit) for income tax. . . . . . . . . 743 705 146 208 71 (114) 1,759
Income from continuing operations . . . . . . . 1,439 1,356 436 644 133 272 4,280
Income (loss) from discontinued operations,
net of income tax . . . . . . . . . . . . . . . . . 10 1 — (9) — 35 37
Net income . . . . . . . . . . . . . . . . . . . . . . $ 1,449 $ 1,357 $ 436 $ 635 $ 133 $ 307 $ 4,317
Balance Sheet:
Total assets . . . . . . . . . . . . . . . . . . . . . . $204,005 $250,691 $5,672 $26,357 $21,331 $50,506 $558,562
DAC and VOBA . . . . . . . . . . . . . . . . . . . . $ 923 $ 14,236 $ 193 $ 2,648 $ 3,513 $ 8 $ 21,521
Goodwill . . . . . . . . . . . . . . . . . . . . . . . . $ 978 $ 2,957 $ 157 $ 313 $ 96 $ 409 $ 4,910
Separate account assets . . . . . . . . . . . . . . $ 52,046 $102,918 $ — $ 5,195 $ 17 $ (17) $160,159
Policyholder liabilities . . . . . . . . . . . . . . . . $121,147 $116,568 $3,324 $16,083 $15,113 $ 9,335 $281,570
Separate account liabilities . . . . . . . . . . . . $ 52,046 $102,918 $ — $ 5,195 $ 17 $ (17) $160,159
F-75MetLife, Inc.
MetLife, Inc.
Notes to Consolidated Financial Statements — (Continued)
For the Year Ended
December 31, 2006 Institutional Individual
Auto &
Home International Reinsurance
Corporate &
Other Total
(In millions)
Statement of Income:
Premiums . . . . . . . . . . . . . . . . . . . . . . . $ 11,867 $ 4,516 $2,924 $ 2,722 $ 4,348 $ 35 $ 26,412
Universal life and investment- type product
policy fees . . . . . . . . . . . . . . . . . . . . . 775 3,201 — 804 — — 4,780
Net investment income . . . . . . . . . . . . . . . 7,265 6,912 177 950 732 1,046 17,082
Other revenues . . . . . . . . . . . . . . . . . . . . 685 527 22 28 66 34 1,362
Net investment gains (losses) . . . . . . . . . . . (631) (598) 4 (10) 7 (154) (1,382)
Policyholder benefits and claims . . . . . . . . . 13,367 5,409 1,717 2,411 3,490 37 26,431
Interest credited to policyholder
account balances . . . . . . . . . . . . . . . . . 2,593 2,035 — 289 254 — 5,171
Policyholder dividends . . . . . . . . . . . . . . . — 1,697 6 (2) — — 1,701
Other expenses. . . . . . . . . . . . . . . . . . . . 2,314 3,519 845 1,529 1,227 1,349 10,783
Income (loss) from continuing operations before
provision (benefit) for income tax . . . . . . . . . . 1,687 1,898 559 267 182 (425) 4,168
Provision (benefit) for income tax. . . . . . . . . 562 652 143 95 64 (419) 1,097
Income (loss) from continuing operations . . . 1,125 1,246 416 172 118 (6) 3,071
Income from discontinued operations, net of
income tax . . . . . . . . . . . . . . . . . . . . . 42 18 — 28 — 3,134 3,222
Net income . . . . . . . . . . . . . . . . . . . . . . $ 1,167 $ 1,264 $ 416 $ 200 $ 118 $ 3,128 $ 6,293
Balance Sheet:
Total assets . . . . . . . . . . . . . . . . . . . . . . $190,963 $243,604 $5,467 $22,724 $18,818 $46,139 $527,715
DAC and VOBA . . . . . . . . . . . . . . . . . . . . $ 1,370 $ 13,996 $ 190 $ 2,117 $ 3,152 $ 13 $ 20,838
Goodwill . . . . . . . . . . . . . . . . . . . . . . . . $ 977 $ 2,957 $ 157 $ 301 $ 96 $ 409 $ 4,897
Separate account assets . . . . . . . . . . . . . . $ 47,047 $ 94,124 $ — $ 3,178 $ 16 $ — $144,365
Policyholder liabilities . . . . . . . . . . . . . . . . $113,205 $117,866 $3,453 $13,544 $13,332 $ 9,199 $270,599
Separate account liabilities . . . . . . . . . . . . $ 47,047 $ 94,124 $ — $ 3,178 $ 16 $ — $144,365
For the Year Ended
December 31, 2005 Institutional Individual
Auto &
Home International Reinsurance
Corporate &
Other Total
(In millions)
Statement of Income:
Premiums . . . . . . . . . . . . . . . . . . . . . . . . . $11,387 $4,485 $2,911 $2,186 $3,869 $ 22 $24,860
Universal life and investment- type product
policy fees . . . . . . . . . . . . . . . . . . . . . . . 772 2,476 — 579 — 1 3,828
Net investment income . . . . . . . . . . . . . . . . . 5,942 6,534 181 794 606 699 14,756
Other revenues. . . . . . . . . . . . . . . . . . . . . . 653 477 33 20 58 30 1,271
Net investment gains (losses) . . . . . . . . . . . . (10) (50) (12) 12 22 (48) (86)
Policyholder benefits and claims . . . . . . . . . . 12,776 5,417 1,994 2,128 3,206 (15) 25,506
Interest credited to policyholder
account balances. . . . . . . . . . . . . . . . . . . 1,652 1,775 — 240 220 — 3,887
Policyholder dividends . . . . . . . . . . . . . . . . . 1 1,670 3 5 — — 1,679
Other expenses . . . . . . . . . . . . . . . . . . . . . 2,229 3,264 828 997 991 955 9,264
Income (loss) from continuing operations before
provision (benefit) for income tax . . . . . . . . . . . . 2,086 1,796 288 221 138 (236) 4,293
Provision (benefit) for income tax . . . . . . . . . . 698 594 64 35 46 (215) 1,222
Income (loss) from continuing operations . . . . . 1,388 1,202 224 186 92 (21) 3,071
Income from discontinued operations, net of
income tax . . . . . . . . . . . . . . . . . . . . . . . 174 296 — 6 — 1,167 1,643
Net income . . . . . . . . . . . . . . . . . . . . . . . . $ 1,562 $1,498 $ 224 $ 192 $ 92 $1,146 $ 4,714
Net investment income and net investment gains (losses) are based upon the actual results of each segment’s specifically identifiable
asset portfolio adjusted for allocated equity. Other costs are allocated to each of the segments based upon: (i) a review of the nature of
such costs; (ii) time studies analyzing the amount of employee compensation costs incurred by each segment; and (iii) cost estimates
included in the Company’s product pricing.
Revenues derived from any customer did not exceed 10% of consolidated revenues for the years ended December 31, 2007, 2006 and
2005. Revenues from U.S. operations were $45.4 billion, $41.9 billion and $39.5 billion for the years ended December 31, 2007, 2006 and
2005, respectively, which represented 86%, 87% and 89%, respectively, of consolidated revenues.
F-76 MetLife, Inc.
MetLife, Inc.
Notes to Consolidated Financial Statements — (Continued)
23. Discontinued Operations
Real Estate
The Company actively manages its real estate portfolio with the objective of maximizing earnings through selective acquisitions and
dispositions. Income related to real estate classified as held-for-sale or sold is presented in discontinued operations. These assets are
carried at the lower of depreciated cost or fair value less expected disposition costs.
The following information presents the components of income from discontinued real estate operations:
2007 2006 2005
Years Ended December 31,
(In millions)
Investment income . . . . . . . . . . . . . . . . . . . . . . . . . . . . . . . . . . . . . . . . . . . . . . . . . . . . . . $ 59 $ 276 $ 435
Investment expense . . . . . . . . . . . . . . . . . . . . . . . . . . . . . . . . . . . . . . . . . . . . . . . . . . . . . (43) (182) (273)
Net investment gains . . . . . . . . . . . . . . . . . . . . . . . . . . . . . . . . . . . . . . . . . . . . . . . . . . . . 13 4,795 2,125
Total revenues . . . . . . . . . . . . . . . . . . . . . . . . . . . . . . . . . . . . . . . . . . . . . . . . . . . . . . . 29 4,889 2,287
Provision for income tax . . . . . . . . . . . . . . . . . . . . . . . . . . . . . . . . . . . . . . . . . . . . . . . . . . 11 1,727 813
Income from discontinued operations, net of income tax . . . . . . . . . . . . . . . . . . . . . . . . . . . . . $ 18 $3,162 $1,474
The carrying value of real estate related to discontinued operations was $172 million and $184 million at December 31, 2007 and 2006,
respectively.
The following table presents the discontinued real estate operations by segment:
2007 2006 2005
Years Ended December 31,
(In millions)
Net investment income
Institutional . . . . . . . . . . . . . . . . . . . . . . . . . . . . . . . . . . . . . . . . . . . . . . . . . . . . . . . . . $ 4 $ 8 $ 29
Individual . . . . . . . . . . . . . . . . . . . . . . . . . . . . . . . . . . . . . . . . . . . . . . . . . . . . . . . . . . . 1 4 20
Corporate & Other . . . . . . . . . . . . . . . . . . . . . . . . . . . . . . . . . . . . . . . . . . . . . . . . . . . . . 11 82 113
Total net investment income . . . . . . . . . . . . . . . . . . . . . . . . . . . . . . . . . . . . . . . . . . . . . $16 $ 94 $ 162
Net investment gains (losses)
Institutional . . . . . . . . . . . . . . . . . . . . . . . . . . . . . . . . . . . . . . . . . . . . . . . . . . . . . . . . . $12 $ 58 $ 242
Individual . . . . . . . . . . . . . . . . . . . . . . . . . . . . . . . . . . . . . . . . . . . . . . . . . . . . . . . . . . . — 23 443
Corporate & Other . . . . . . . . . . . . . . . . . . . . . . . . . . . . . . . . . . . . . . . . . . . . . . . . . . . . . 1 4,714 1,440
Total net investment gains (losses) . . . . . . . . . . . . . . . . . . . . . . . . . . . . . . . . . . . . . . . . . $13 $4,795 $2,125
In the fourth quarter of 2006, the Company sold its Peter Cooper Village and Stuyvesant Town properties located in Manhattan, New
York for $5.4 billion. The Peter Cooper Village and Stuyvesant Town properties together make up the largest apartment complex in
Manhattan, New York totaling over 11,000 units, spread over 80 contiguous acres. The properties were owned by the Company’s
subsidiary, MTL. Net investment income on these properties was $73 million and $72 million for the years ended December 31, 2006 and
2005, respectively. The sale resulted in a gain of $3 billion, net of income tax.
In the second quarter of 2005, the Company sold its One Madison Avenue and 200 Park Avenue properties in Manhattan, New York for
$918 million and $1.72 billion, respectively, resulting in gains, net of income tax, of $431 million and $762 million, respectively. Net
investment income on One Madison Avenue and 200 Park Avenue was $13 million and $44 million, for the year ended December 31, 2005,
respectively. In connection with the sale of the 200 Park Avenue property, the Company has retained rights to existing signage and is
leasing space for associates in the property for 20 years with optional renewal periods through 2205.
Operations
On August 31, 2007, MetLife Australia completed the sale of its annuities and pension businesses to a third party for $25 million in cash
consideration resulting in a gain upon disposal of $41 million, net of income tax, which was adjusted in the fourth quarter of 2007 for
additional transaction costs. The Company reclassified the assets and liabilities of the annuities and pension businesses within MetLife
Australia, which is reported in the International segment, to assets and liabilities of subsidiaries held-for-sale and the operations of the
business to discontinued operations for all periods presented. Included within the assets to be sold were certain fixed maturity securities in
a loss position for which the Company recognized a net investment loss on a consolidated basis of $59 million, net of income tax, for the
year ended December 31, 2007, because the Company no longer had the intent to hold such securities.
F-77MetLife, Inc.
MetLife, Inc.
Notes to Consolidated Financial Statements — (Continued)
The following tables present the amounts related to the operations and financial position of MetLife Australia’s annuities and pension
businesses:
2007 2006 2005
Years Ended
December 31,
(In millions)
Revenues . . . . . . . . . . . . . . . . . . . . . . . . . . . . . . . . . . . . . . . . . . . . . . . . . . . . . . . . . . . . . . . $71 $100 $50
Expenses . . . . . . . . . . . . . . . . . . . . . . . . . . . . . . . . . . . . . . . . . . . . . . . . . . . . . . . . . . . . . . . 58 89 41
Income before provision for income tax . . . . . . . . . . . . . . . . . . . . . . . . . . . . . . . . . . . . . . . . . . . . 13 11 9
Provision for income tax . . . . . . . . . . . . . . . . . . . . . . . . . . . . . . . . . . . . . . . . . . . . . . . . . . . . . . 4 3 3
Net investment gain (loss), net of income tax . . . . . . . . . . . . . . . . . . . . . . . . . . . . . . . . . . . . . . . . (4) 20 (5)
Income from discontinued operations, net of income tax . . . . . . . . . . . . . . . . . . . . . . . . . . . . . . . . $ 5 $ 28 $ 1
December 31, 2006
(In millions)
Fixed maturity securities . . . . . . . . . . . . . . . . . . . . . . . . . . . . . . . . . . . . . . . . . . . . . . . . . . . . . . . . $1,500
Equity securities . . . . . . . . . . . . . . . . . . . . . . . . . . . . . . . . . . . . . . . . . . . . . . . . . . . . . . . . . . . . . 37
Deferred policy acquisition costs . . . . . . . . . . . . . . . . . . . . . . . . . . . . . . . . . . . . . . . . . . . . . . . . . . 13
Other assets . . . . . . . . . . . . . . . . . . . . . . . . . . . . . . . . . . . . . . . . . . . . . . . . . . . . . . . . . . . . . . . 13
Total assets held-for-sale . . . . . . . . . . . . . . . . . . . . . . . . . . . . . . . . . . . . . . . . . . . . . . . . . . . . . . $1,563
Policyholder account balances . . . . . . . . . . . . . . . . . . . . . . . . . . . . . . . . . . . . . . . . . . . . . . . . . . . $1,595
Total liabilities held-for-sale . . . . . . . . . . . . . . . . . . . . . . . . . . . . . . . . . . . . . . . . . . . . . . . . . . . . $1,595
On September 29, 2005, the Company completed the sale of MetLife Indonesia to a third party, resulting in a gain upon disposal of
$10 million, net of income tax. As a result of this sale, the Company recognized income from discontinued operations of $5 million, net of
income tax, for the year ended December 31, 2005. The Company reclassified the operations of MetLife Indonesia into discontinued
operations for all years presented.
The following table presents the amounts related to the operations of MetLife Indonesia that have been combined with the discontinued
real estate operations in the consolidated statements of income:
Year Ended
December 31,
2005
(In millions)
Revenues . . . . . . . . . . . . . . . . . . . . . . . . . . . . . . . . . . . . . . . . . . . . . . . . . . . . . . . . . . . . . . . . . . . . $ 5
Expenses . . . . . . . . . . . . . . . . . . . . . . . . . . . . . . . . . . . . . . . . . . . . . . . . . . . . . . . . . . . . . . . . . . . . 10
Income from discontinued operations before provision for income tax . . . . . . . . . . . . . . . . . . . . . . . . . . . . . (5)
Provision for income tax . . . . . . . . . . . . . . . . . . . . . . . . . . . . . . . . . . . . . . . . . . . . . . . . . . . . . . . . . . . —
Net investment gain, net of income tax . . . . . . . . . . . . . . . . . . . . . . . . . . . . . . . . . . . . . . . . . . . . . . . . . 10
Income from discontinued operations, net of income tax . . . . . . . . . . . . . . . . . . . . . . . . . . . . . . . . . . . . $ 5
On January 31, 2005, the Company completed the sale of SSRM to a third party for $328 million in cash and stock. The Company
reported the operations of SSRM in discontinued operations. As a result of the sale of SSRM, the Company recognized income from
discontinued operations of $157 million, net of income tax, comprised of a realized gain of $165 million, net of income tax, and an
operating expense related to a lease abandonment of $8 million, net of income tax. The Company’s discontinued operations for the year
ended December 31, 2005 included expenses of $6 million, net of income tax, related to the sale of SSRM. Under the terms of the sale
agreement, MetLife will have an opportunity to receive additional payments based on, among other things, certain revenue retention and
growth measures. The purchase price is also subject to reduction over five years, depending on retention of certain MetLife-related
business. In the fourth quarter of 2007, the Company accrued a liability for $2 million, net of income tax, related to the termination of certain
MetLife-related business. Also under the terms of such agreement, MetLife had the opportunity to receive additional consideration for the
retention of certain customers for a specific period in 2005. Upon finalization of the computation, the Company received payments of
$30 million, net of income tax, in the second quarter of 2006 and $12 million, net of income tax, in the fourth quarter of 2005 due to the
retention of these specific customer accounts. In the first quarter of 2007, the Company received a payment of $16 million, net of income
tax, as a result of the revenue retention and growth measure provision in the sales agreement. In the fourth quarter of 2006, the Company
eliminated $4 million of a liability that was previously recorded with respect to the indemnities provided in connection with the sale of
SSRM, resulting in a benefit to the Company of $2 million, net of income tax. The Company believes that future payments relating to these
indemnities are not probable.
The operations of SSRM include affiliated revenues of $5 million for the year ended December 31, 2005, related to asset management
services provided by SSRM to the Company that have not been eliminated from discontinued operations as these transactions continued
F-78 MetLife, Inc.
MetLife, Inc.
Notes to Consolidated Financial Statements — (Continued)
after the sale of SSRM. The following table presents the amounts related to operations of SSRM that have been combined with the
discontinued real estate operations in the consolidated statements of income:
2007 2006 2005
Years Ended
December 31,
(In millions)
Revenues . . . . . . . . . . . . . . . . . . . . . . . . . . . . . . . . . . . . . . . . . . . . . . . . . . . . . . . . . . . . . . . $— $— $ 19
Expenses . . . . . . . . . . . . . . . . . . . . . . . . . . . . . . . . . . . . . . . . . . . . . . . . . . . . . . . . . . . . . . . — — 38
Income from discontinued operations before provision for income tax. . . . . . . . . . . . . . . . . . . . . . . . . — — (19)
Provision for income tax . . . . . . . . . . . . . . . . . . . . . . . . . . . . . . . . . . . . . . . . . . . . . . . . . . . . . . — — (5)
Net investment gain, net of income tax . . . . . . . . . . . . . . . . . . . . . . . . . . . . . . . . . . . . . . . . . . . . 14 32 177
Income from discontinued operations, net of income tax . . . . . . . . . . . . . . . . . . . . . . . . . . . . . . . . $14 $32 $163
24. Fair Value Information
The estimated fair value of financial instruments have been determined by using available market information and the valuation
methodologies described below. Considerable judgment is often required in interpreting market data to develop estimates of fair value.
Accordingly, the estimates presented herein may not necessarily be indicative of amounts that could be realized in a current market
exchange. The use of different assumptions or valuation methodologies may have a material effect on the estimated fair value amounts.
The implementation of SFAS 157 may impact the fair value assumptions and methodologies associated with the valuation of assets and
liabilities. See also Note 1 regarding the adoption of SFAS 157.
Amounts related to the Company’s financial instruments are as follows:
December 31, 2007
Notional
Amount
Carrying
Value
Estimated
Fair Value
(In millions)
Assets:
Fixed maturity securities . . . . . . . . . . . . . . . . . . . . . . . . . . . . . . . . . . . . . . . . . . . $242,242 $242,242
Trading securities . . . . . . . . . . . . . . . . . . . . . . . . . . . . . . . . . . . . . . . . . . . . . . . . $ 779 $ 779
Equity securities. . . . . . . . . . . . . . . . . . . . . . . . . . . . . . . . . . . . . . . . . . . . . . . . . $ 6,050 $ 6,050
Mortgage and consumer loans . . . . . . . . . . . . . . . . . . . . . . . . . . . . . . . . . . . . . . . $ 47,030 $ 47,599
Policy loans . . . . . . . . . . . . . . . . . . . . . . . . . . . . . . . . . . . . . . . . . . . . . . . . . . . $ 10,419 $ 10,419
Short-term investments . . . . . . . . . . . . . . . . . . . . . . . . . . . . . . . . . . . . . . . . . . . . $ 2,648 $ 2,648
Cash and cash equivalents . . . . . . . . . . . . . . . . . . . . . . . . . . . . . . . . . . . . . . . . . $ 10,368 $ 10,368
Accrued investment income . . . . . . . . . . . . . . . . . . . . . . . . . . . . . . . . . . . . . . . . . $ 3,630 $ 3,630
Mortgage loan commitments. . . . . . . . . . . . . . . . . . . . . . . . . . . . . . . . . . . . . . . . . $4,035 $ — $ (43)
Commitments to fund bank credit facilities, bridge loans and private corporate bond
investments . . . . . . . . . . . . . . . . . . . . . . . . . . . . . . . . . . . . . . . . . . . . . . . . . . $1,196 $ — $ (59)
Liabilities:
Policyholder account balances . . . . . . . . . . . . . . . . . . . . . . . . . . . . . . . . . . . . . . . $115,385 $114,466
Short-term debt . . . . . . . . . . . . . . . . . . . . . . . . . . . . . . . . . . . . . . . . . . . . . . . . . $ 667 $ 667
Long-term debt . . . . . . . . . . . . . . . . . . . . . . . . . . . . . . . . . . . . . . . . . . . . . . . . . $ 9,628 $ 9,532
Collateral financing arrangements . . . . . . . . . . . . . . . . . . . . . . . . . . . . . . . . . . . . . $ 5,732 $ 5,365
Junior subordinated debt securities . . . . . . . . . . . . . . . . . . . . . . . . . . . . . . . . . . . . $ 4,474 $ 4,338
Shares subject to mandatory redemption. . . . . . . . . . . . . . . . . . . . . . . . . . . . . . . . . $ 159 $ 178
Payables for collateral under securities loaned and other transactions . . . . . . . . . . . . . . . . . . . $ 44,136 $ 44,136
F-79MetLife, Inc.
MetLife, Inc.
Notes to Consolidated Financial Statements — (Continued)
December 31, 2006
Notional
Amount
Carrying
Value
Estimated
Fair Value
(In millions)
Assets:
Fixed maturity securities . . . . . . . . . . . . . . . . . . . . . . . . . . . . . . . . . . . . . . . . . . . $241,928 $241,928
Trading securities . . . . . . . . . . . . . . . . . . . . . . . . . . . . . . . . . . . . . . . . . . . . . . . . $ 759 $ 759
Equity securities. . . . . . . . . . . . . . . . . . . . . . . . . . . . . . . . . . . . . . . . . . . . . . . . . $ 5,094 $ 5,094
Mortgage and consumer loans . . . . . . . . . . . . . . . . . . . . . . . . . . . . . . . . . . . . . . . $ 42,239 $ 42,451
Policy loans . . . . . . . . . . . . . . . . . . . . . . . . . . . . . . . . . . . . . . . . . . . . . . . . . . . $ 10,228 $ 10,228
Short-term investments . . . . . . . . . . . . . . . . . . . . . . . . . . . . . . . . . . . . . . . . . . . . $ 2,709 $ 2,709
Cash and cash equivalents . . . . . . . . . . . . . . . . . . . . . . . . . . . . . . . . . . . . . . . . . $ 7,107 $ 7,107
Accrued investment income . . . . . . . . . . . . . . . . . . . . . . . . . . . . . . . . . . . . . . . . . $ 3,347 $ 3,347
Mortgage loan commitments. . . . . . . . . . . . . . . . . . . . . . . . . . . . . . . . . . . . . . . . . $4,022 $ — $ 4
Commitments to fund bank credit facilities, bridge loans and private corporate bond
investments . . . . . . . . . . . . . . . . . . . . . . . . . . . . . . . . . . . . . . . . . . . . . . . . . . $1,908 $ — $ —
Liabilities:
Policyholder account balances . . . . . . . . . . . . . . . . . . . . . . . . . . . . . . . . . . . . . . . $112,438 $108,318
Short-term debt . . . . . . . . . . . . . . . . . . . . . . . . . . . . . . . . . . . . . . . . . . . . . . . . . $ 1,449 $ 1,449
Long-term debt . . . . . . . . . . . . . . . . . . . . . . . . . . . . . . . . . . . . . . . . . . . . . . . . . $ 9,129 $ 9,299
Collateral financing arrangements . . . . . . . . . . . . . . . . . . . . . . . . . . . . . . . . . . . . . $ 850 $ 850
Junior subordinated debt securities . . . . . . . . . . . . . . . .
metlife 2007 Annual Report

metlife 2007 Annual Report

  • 1.
  • 3.
    Chairman’s Letter To MyFellow Shareholders: This year, MetLife will commemorate its 140th anniversary. This is an impressive milestone that we are proud to celebrate, because it serves as a testament to our strength, commitment, and long-term perspective. For 140 years, MetLife has helped individuals and institutions build and protect their most valuable assets. We offer our customers innovative financial solutions through a broad array of products — life insurance, dental insurance, auto and home protection, annuities, and retirement and savings solutions. More importantly, we promise to stand behind the guarantees in these products with the full financial strength of MetLife. To keep the promises we make, we manage our company with discipline and plan for the long-term. This long-term approach has been incredibly successful for MetLife. We have grown to become the largest life insurer in the U.S., a leading provider of employee benefits, and an expert in retirement and savings. Our understanding of customer needs and our ability to execute on our growth plans have driven strong financial results. This was especially true in 2007. Driving Growth By many counts, MetLife had an outstanding year: premiums, fees and other revenues reached a record $34.8 billion; total assets grew to $558.6 billion; and net income was strong at $4.3 billion. Across the board, all of our businesses continued to perform extremely well and helped to make 2007 one of our best years ever. Institutional Business achieved a record year in 2007 with nearly $14 billion in premiums, fees and other revenues. We retained our customers through strong service, grew our existing relationships, and introduced new customers to MetLife. Today, we stand alone in the marketplace with more than 90 of the top 100 FORTUNE 500» companies turning to MetLife for employee benefits. We have supplemented our organic growth with acquisitions. For example, in early 2008, we completed the acquisition of SafeGuard Health Enterprises, Inc., to augment our already strong dental offering in the key, growing markets of California, Florida, Texas, and Nevada. We continue to see a tremendous need for solutions for individuals who are retired or approaching retirement. Our individual variable annuity business in the U.S. had a very strong year in 2007 with a record $16.5 billion in individual annuity premiums and deposits. We have increased our market position in this business from 11th in 2000 to 2nd at the end of 2007. Our expanding distribution reach over the past several years, as well as the introduction of new and innovative variable annuity offerings, has enabled us to achieve this significant growth. Our focus on innovative products is also evident in our Auto & Home business. In 2007, we increased sales of our GrandProtect product offering, which offers our customers complete personal insurance protection in one package. This growth in GrandProtect sales is even more noteworthy when you consider the very competitive nature of the auto and home insurance market. I am very pleased with the performance of our International business. This segment experienced a 16% growth in top line results, and represents approximately 15% of our 2007 net income. International has become — and will continue to be — an important, growing contributor to MetLife’s bottom line. We are successfully exporting our expertise outside of the U.S., and today we hold leading market positions in several countries — including Mexico, South Korea, Chile and through our joint venture in Japan. Our efforts to expand continue as we plant seeds for growth in a number of other countries, including China and India. In addition to positioning MetLife’s businesses for further success, we are committed to leveraging our time-tested strengths in asset/ liability management. In a rapidly changing investment environment like the one experienced in 2007, our focus on identifying trends, actively managing our portfolio, and consistently managing risk has been crucial. Our performance has been excellent, as evidenced by the $19 billion in net investment income we generated during the year. The effective management of our $345 billion portfolio has enabled us to keep the promises we make to our customers and meet the expectations you have as our shareholders. At the same time, we continue to focus on the best ways to leverage our strong capital position at MetLife. In 2007, we repurchased more than $1.7 billion of our common stock, announced a 25% increase in our annual common stock dividend, and grew book value to $43.47 per share. Collectively, these actions and results demonstrate our commitment to providing value and a strong return to shareholders. Strong Leadership MetLife was recently recognized by Forbes magazine as the “Best Managed Insurance Company” for 2008. I have always been proud of our management team and the outstanding talent of our organization. Key to our success has been the MetLife Board of Directors. At this year’s annual shareholders meeting, three members of our Board will retire. Charlie Leighton, Helene Kaplan, and Jamie Houghton have provided many years of service and made numerous contributions to the company. I am extremely grateful for their service and wish them
  • 4.
    well. At thesame time, I am very pleased to welcome our two newest Board members — Eduardo Castro-Wright and Lulu Wang. Eduardo has held a number of key leadership roles at several well known companies in the U.S. and in the Latin America and Asia Pacific regions. Similarly, Lulu has had a distinguished and successful career in professional money management, including the management of assets for pensions, endowments and mutual funds. Both Eduardo and Lulu are great additions to the MetLife Board. As a shareholder, you should feel excited by what MetLife has accomplished and confident about our prospects. Even more important, you should know that you have ownership in a company that continues to have a significant, positive impact on the lives of millions of individuals around the world. We are committed to leveraging our 140 years of experience to generate further growth and managing MetLife for the long-term. Thank you for your continued support. Sincerely, C. Robert Henrikson Chairman of the Board, President and Chief Executive Officer MetLife, Inc. February 28, 2008
  • 5.
    TABLE OF CONTENTS Page Number NoteRegarding Forward-Looking Statements . . . . . . . . . . . . . . . . . . . . . . . . . . . . . . . . . . . . . . . . . . . . . . . . . . . . . 2 Selected Financial Data . . . . . . . . . . . . . . . . . . . . . . . . . . . . . . . . . . . . . . . . . . . . . . . . . . . . . . . . . . . . . . . . . . . 2 Management’s Discussion and Analysis of Financial Condition and Results of Operations . . . . . . . . . . . . . . . . . . . . . . . . 5 Quantitative and Qualitative Disclosures About Market Risk . . . . . . . . . . . . . . . . . . . . . . . . . . . . . . . . . . . . . . . . . . . . 85 Changes in and Disagreements With Accountants on Accounting and Financial Disclosure . . . . . . . . . . . . . . . . . . . . . . . 89 Management’s Annual Report on Internal Control Over Financial Reporting . . . . . . . . . . . . . . . . . . . . . . . . . . . . . . . . . . 89 Attestation Report of the Company’s Registered Public Accounting Firm . . . . . . . . . . . . . . . . . . . . . . . . . . . . . . . . . . . 89 Financial Statements. . . . . . . . . . . . . . . . . . . . . . . . . . . . . . . . . . . . . . . . . . . . . . . . . . . . . . . . . . . . . . . . . . . . . 91 Board of Directors . . . . . . . . . . . . . . . . . . . . . . . . . . . . . . . . . . . . . . . . . . . . . . . . . . . . . . . . . . . . . . . . . . . . . . 92 Executive Officers . . . . . . . . . . . . . . . . . . . . . . . . . . . . . . . . . . . . . . . . . . . . . . . . . . . . . . . . . . . . . . . . . . . . . . 92 Contact Information . . . . . . . . . . . . . . . . . . . . . . . . . . . . . . . . . . . . . . . . . . . . . . . . . . . . . . . . . . . . . . . . . . . . . 93 Corporate Information . . . . . . . . . . . . . . . . . . . . . . . . . . . . . . . . . . . . . . . . . . . . . . . . . . . . . . . . . . . . . . . . . . . . 93 1MetLife, Inc.
  • 6.
    Note Regarding Forward-LookingStatements This Annual Report, including the Management’s Discussion and Analysis of Financial Condition and Results of Operations, contains statements which constitute forward-looking statements within the meaning of the Private Securities Litigation Reform Act of 1995, including statements relating to trends in the operations and financial results and the business and the products of MetLife, Inc. (the “Holding Company”) and its subsidiaries (collectively, “MetLife” or the “Company”), as well as other statements including words such as “anticipate,” “believe,” “plan,” “estimate,” “expect,” “intend” and other similar expressions. Forward-looking statements are made based upon management’s current expectations and beliefs concerning future developments and their potential effects on MetLife, Inc. and its subsidiaries. Such forward-looking statements are not guarantees of future performance. See “Management’s Discussion and Analysis of Financial Condition and Results of Operations.” Selected Financial Data The following selected financial data has been derived from the Company’s audited consolidated financial statements. The statement of income data for the years ended December 31, 2007, 2006 and 2005 and the balance sheet data as of December 31, 2007 and 2006 have been derived from the Company’s audited financial statements included elsewhere herein. The statement of income data for the years ended December 31, 2004 and 2003 and the balance sheet data as of December 31, 2005, 2004 and 2003 have been derived from the Company’s audited financial statements not included herein. The selected financial data set forth below should be read in conjunction with “Management’s Discussion and Analysis of Financial Condition and Results of Operations” and the consolidated financial statements and related notes included elsewhere herein. Some previously reported amounts have been reclassified to conform with the presentation at and for the year ended December 31, 2007. 2007 2006 2005 2004 2003 Years Ended December 31, (In millions) Statement of Income Data(1) Revenues(2)(3): Premiums . . . . . . . . . . . . . . . . . . . . . . . . . . . . . . . . . . . . . . . . . . . . . . $27,895 $26,412 $24,860 $22,200 $20,575 Universal life and investment-type product policy fees . . . . . . . . . . . . . . . . . 5,311 4,780 3,828 2,867 2,495 Net investment income . . . . . . . . . . . . . . . . . . . . . . . . . . . . . . . . . . . . . 19,006 17,082 14,756 12,261 11,373 Other revenues . . . . . . . . . . . . . . . . . . . . . . . . . . . . . . . . . . . . . . . . . . 1,533 1,362 1,271 1,198 1,199 Net investment gains (losses) . . . . . . . . . . . . . . . . . . . . . . . . . . . . . . . . . (738) (1,382) (86) 175 (551) Total revenues . . . . . . . . . . . . . . . . . . . . . . . . . . . . . . . . . . . . . . 53,007 48,254 44,629 38,701 35,091 Expenses(2)(3): Policyholder benefits and claims . . . . . . . . . . . . . . . . . . . . . . . . . . . . . . . 27,828 26,431 25,506 22,662 20,811 Interest credited to policyholder account balances . . . . . . . . . . . . . . . . . . . 5,741 5,171 3,887 2,997 3,035 Policyholder dividends. . . . . . . . . . . . . . . . . . . . . . . . . . . . . . . . . . . . . . 1,726 1,701 1,679 1,666 1,731 Other expenses . . . . . . . . . . . . . . . . . . . . . . . . . . . . . . . . . . . . . . . . . . 11,673 10,783 9,264 7,813 7,168 Total expenses . . . . . . . . . . . . . . . . . . . . . . . . . . . . . . . . . . . . . . 46,968 44,086 40,336 35,138 32,745 Income from continuing operations before provision for income tax . . . . . . . . . 6,039 4,168 4,293 3,563 2,346 Provision for income tax(2) . . . . . . . . . . . . . . . . . . . . . . . . . . . . . . . . . . . 1,759 1,097 1,222 991 580 Income from continuing operations . . . . . . . . . . . . . . . . . . . . . . . . . . . . . 4,280 3,071 3,071 2,572 1,766 Income from discontinued operations, net of income tax(2) . . . . . . . . . . . . . . 37 3,222 1,643 272 477 Income before cumulative effect of a change in accounting, net of income tax. . 4,317 6,293 4,714 2,844 2,243 Cumulative effect of a change in accounting, net of income tax(3) . . . . . . . . . . . . . . . . . . . . . . . . . . . . . . . . . . . . . . . . . . — — — (86) (26) Net income . . . . . . . . . . . . . . . . . . . . . . . . . . . . . . . . . . . . . . . . . . . . . 4,317 6,293 4,714 2,758 2,217 Preferred stock dividends . . . . . . . . . . . . . . . . . . . . . . . . . . . . . . . . . . . 137 134 63 — — Charge for conversion of company-obligated mandatorily redeemable securities of a subsidiary trust . . . . . . . . . . . . . . . . . . . . . . . . . . . . . . . . . . . . . . — — — — 21 Net income available to common shareholders . . . . . . . . . . . . . . . . . . . . . . $ 4,180 $ 6,159 $ 4,651 $ 2,758 $ 2,196 2 MetLife, Inc.
  • 7.
    2007 2006 20052004 2003 December 31, (In millions) Balance Sheet Data(1) Assets: General account assets . . . . . . . . . . . . . . . . . . . . . . . . . . . . . . . $398,403 $383,350 $353,776 $270,039 $251,085 Separate account assets . . . . . . . . . . . . . . . . . . . . . . . . . . . . . . 160,159 144,365 127,869 86,769 75,756 Total assets(2) . . . . . . . . . . . . . . . . . . . . . . . . . . . . . . . . . . . . $558,562 $527,715 $481,645 $356,808 $326,841 Liabilities: Life and health policyholder liabilities(4) . . . . . . . . . . . . . . . . . . . . . $278,246 $267,146 $257,258 $193,612 $177,947 Property and casualty policyholder liabilities(4) . . . . . . . . . . . . . . . . . . . . . . . . . . . . . . . . . . . . . . 3,324 3,453 3,490 3,180 2,943 Short-term debt . . . . . . . . . . . . . . . . . . . . . . . . . . . . . . . . . . . . 667 1,449 1,414 1,445 3,642 Long-term debt . . . . . . . . . . . . . . . . . . . . . . . . . . . . . . . . . . . . 9,628 9,129 9,489 7,412 5,703 Collateral financing arrangements . . . . . . . . . . . . . . . . . . . . . . . . . 5,732 850 — — — Junior subordinated debt securities . . . . . . . . . . . . . . . . . . . . . . . 4,474 3,780 2,533 — — Payables for collateral under securities loaned and other transactions . . . . . . . . . . . . . . . . . . . . . . . . . . . . . . . . . . . . . 44,136 45,846 34,515 28,678 27,083 Other . . . . . . . . . . . . . . . . . . . . . . . . . . . . . . . . . . . . . . . . . . . 17,017 17,899 15,976 12,888 12,618 Separate account liabilities . . . . . . . . . . . . . . . . . . . . . . . . . . . . . 160,159 144,365 127,869 86,769 75,756 Total liabilities(2) . . . . . . . . . . . . . . . . . . . . . . . . . . . . . . . . . . 523,383 493,917 452,544 333,984 305,692 Stockholders’ Equity Preferred stock, at par value . . . . . . . . . . . . . . . . . . . . . . . . . . . . 1 1 1 — — Common stock, at par value . . . . . . . . . . . . . . . . . . . . . . . . . . . . 8 8 8 8 8 Additional paid-in capital . . . . . . . . . . . . . . . . . . . . . . . . . . . . . . 17,098 17,454 17,274 15,037 14,991 Retained earnings(5) . . . . . . . . . . . . . . . . . . . . . . . . . . . . . . . . . 19,884 16,574 10,865 6,608 4,193 Treasury stock, at cost . . . . . . . . . . . . . . . . . . . . . . . . . . . . . . . . (2,890) (1,357) (959) (1,785) (835) Accumulated other comprehensive income(6) . . . . . . . . . . . . . . . . . 1,078 1,118 1,912 2,956 2,792 Total stockholders’ equity. . . . . . . . . . . . . . . . . . . . . . . . . . . . . 35,179 33,798 29,101 22,824 21,149 Total liabilities and stockholders’ equity . . . . . . . . . . . . . . . . . . . . $558,562 $527,715 $481,645 $356,808 $326,841 2007 2006 2005 2004 2003 Years Ended December 31, Other Data(1) Net income available to common shareholders . . . . . . . . . . . . . . . . . . . . . . . . . $4,180 $6,159 $4,651 $2,758 $2,196 Return on common equity(7) . . . . . . . . . . . . . . . . . . . . . . . . . . . . . . . . . . . . 13.0% 21.9% 18.5% 12.5% 11.4% Return on common equity, excluding accumulated other comprehensive income . . . 13.2% 22.6% 20.4% 14.4% 13.0% EPS Data(1) Income from Continuing Operations Available to Common Shareholders Per Common Share Basic . . . . . . . . . . . . . . . . . . . . . . . . . . . . . . . . . . . . . . . . . . . . . . . . . . . $ 5.57 $ 3.85 $ 4.02 $ 3.43 $ 2.36 Diluted . . . . . . . . . . . . . . . . . . . . . . . . . . . . . . . . . . . . . . . . . . . . . . . . . . $ 5.44 $ 3.81 $ 3.98 $ 3.41 $ 2.34 Income (loss) from Discontinued Operations Per Common Share Basic . . . . . . . . . . . . . . . . . . . . . . . . . . . . . . . . . . . . . . . . . . . . . . . . . . . $ 0.05 $ 4.24 $ 2.19 $ 0.35 $ 0.65 Diluted . . . . . . . . . . . . . . . . . . . . . . . . . . . . . . . . . . . . . . . . . . . . . . . . . . $ 0.04 $ 4.18 $ 2.18 $ 0.35 $ 0.64 Cumulative Effect of a Change in Accounting Per Common Share(3) Basic . . . . . . . . . . . . . . . . . . . . . . . . . . . . . . . . . . . . . . . . . . . . . . . . . . . $ — $ — $ — $ (0.11) $ (0.04) Diluted . . . . . . . . . . . . . . . . . . . . . . . . . . . . . . . . . . . . . . . . . . . . . . . . . . $ — $ — $ — $ (0.11) $ (0.04) Net Income Available to Common Shareholders Per Common Share Basic . . . . . . . . . . . . . . . . . . . . . . . . . . . . . . . . . . . . . . . . . . . . . . . . . . . $ 5.62 $ 8.09 $ 6.21 $ 3.67 $ 2.97 Diluted . . . . . . . . . . . . . . . . . . . . . . . . . . . . . . . . . . . . . . . . . . . . . . . . . . $ 5.48 $ 7.99 $ 6.16 $ 3.65 $ 2.94 Dividends Declared Per Common Share . . . . . . . . . . . . . . . . . . . . . . . . . . . $ 0.74 $ 0.59 $ 0.52 $ 0.46 $ 0.23 (1) On July 1, 2005, the Company acquired Travelers. The 2005 selected financial data includes total revenues and total expenses of $966 million and $577 million, respectively, from the date of the acquisition. See “Management’s Discussion and Analysis of Financial Condition and Results of Operations — Acquisitions and Dispositions.” (2) Discontinued Operations: 3MetLife, Inc.
  • 8.
    Real Estate In accordancewith Statement of Financial Accounting Standards (“SFAS”) No. 144, Accounting for the Impairment or Disposal of Long-Lived Assets (“SFAS 144”), income related to real estate sold or classified as held-for-sale for transactions initiated on or after January 1, 2002 is presented as discontinued operations. The following information presents the components of income from discontinued real estate operations: 2007 2006 2005 2004 2003 Years Ended December 31, (In millions) Investment income . . . . . . . . . . . . . . . . . . . . . . . . . . . . . . . . . . $ 59 $ 276 $ 435 $ 690 $ 763 Investment expense . . . . . . . . . . . . . . . . . . . . . . . . . . . . . . . . . (43) (182) (273) (418) (452) Net investment gains (losses) . . . . . . . . . . . . . . . . . . . . . . . . . . . 13 4,795 2,125 146 420 Total revenues . . . . . . . . . . . . . . . . . . . . . . . . . . . . . . . . . . . 29 4,889 2,287 418 731 Interest expense . . . . . . . . . . . . . . . . . . . . . . . . . . . . . . . . . . . — — — 13 4 Provision for income tax . . . . . . . . . . . . . . . . . . . . . . . . . . . . . . 11 1,727 813 143 266 Income from discontinued operations, net of income tax . . . . . . . . $ 18 $3,162 $1,474 $ 262 $ 461 Operations In September 2007, September 2005 and January 2005, the Company sold its MetLife Insurance Limited (“MetLife Australia”) annuities and pension businesses, P.T. Sejahtera (“MetLife Indonesia”) and SSRM Holdings, Inc. (“SSRM”), respectively. In accordance with SFAS 144, the assets, liabilities and operations of MetLife Indonesia, SSRM and MetLife Australia have been reclassified into discontinued operations for all years presented. The following tables present these discontinued operations: 2007 2006 2005 2004 2003 Years Ended December 31, (In millions) Revenues . . . . . . . . . . . . . . . . . . . . . . . . . . . . . . . . . . . . . . . . $71 $ 100 $ 74 $333 $235 Expenses . . . . . . . . . . . . . . . . . . . . . . . . . . . . . . . . . . . . . . . . . 58 89 89 310 206 Income before provision for income tax . . . . . . . . . . . . . . . . . . . . . 13 11 (15) 23 29 Provision for income tax . . . . . . . . . . . . . . . . . . . . . . . . . . . . . . . 4 3 (2) 13 13 Income (loss) from discontinued operations, net of income tax . . . . . 9 8 (13) 10 16 Net investment gains, net of income tax . . . . . . . . . . . . . . . . . . . . . 10 52 182 — — Income from discontinued operations, net of income tax . . . . . . . . . $19 $ 60 $ 169 $ 10 $ 16 2006 2005 2004 2003 December 31, (In millions) General account assets . . . . . . . . . . . . . . . . . . . . . . . . . . . . . . . $1,563 $1,621 $410 $210 Total assets . . . . . . . . . . . . . . . . . . . . . . . . . . . . . . . . . . . . . . $1,563 $1,621 $410 $210 Life and health policyholder liabilities(4) . . . . . . . . . . . . . . . . . . . . . $1,595 $1,622 $ 24 $ 17 Short-term debt. . . . . . . . . . . . . . . . . . . . . . . . . . . . . . . . . . . . . — — 19 — Other . . . . . . . . . . . . . . . . . . . . . . . . . . . . . . . . . . . . . . . . . . . — — 225 73 Total liabilites . . . . . . . . . . . . . . . . . . . . . . . . . . . . . . . . . . . . . $1,595 $1,622 $268 $ 90 (3) The cumulative effect of a change in accounting, net of income tax, of $86 million for the year ended December 31, 2004, resulted from the adoption of SOP 03-1, Accounting and Reporting by Insurance Enterprises for Certain Nontraditional Long-Duration Contracts and for Separate Accounts. The cumulative effect of a change in accounting, net of income tax, of $26 million for the year ended December 31, 2003, resulted from the adoption of SFAS No. 133 Implementation Issue No. B36, Embedded Derivatives: Modified Coinsurance Arrangements and Debt Instruments That Incorporate Credit Risk Exposures That Are Unrelated or Only Partially Related to the Creditworthiness of the Obligor under Those Instruments. (4) Policyholder liabilities include future policy benefits, other policyholder funds and bank deposits. The life and health policyholder liabilities also include policyholder account balances, policyholder dividends payable and the policyholder dividend obligation. (5) The cumulative effect of changes in accounting, net of income tax, of $329 million, which decreased retained earnings at January 1, 2007, resulted from $292 million related to the adoption of SOP 05-1, Accounting by Insurance Enterprises for Deferred Acquisition Costs in Connection with Modifications or Exchanges of Insurance Contracts, and $37 million related to the adoption of Financial Accounting Standards Board Interpretation No. 48, Accounting for Uncertainty in Income Taxes — An Interpretation of FASB Statement No. 109. (6) The cumulative effect of a change in accounting, net of income tax, of $744 million resulted from the adoption of SFAS No. 158, Employers’ Accounting for Defined Benefit Pension and Other Postretirement Plans, and decreased accumulated other comprehensive income at December 31, 2006. (7) Return on common equity is defined as net income available to common shareholders divided by average common stockholders’ equity. 4 MetLife, Inc.
  • 9.
    Management’s Discussion andAnalysis of Financial Condition and Results of Operations For purposes of this discussion, “MetLife” or the “Company” refers to MetLife, Inc., a Delaware corporation incorporated in 1999 (the “Holding Company”), and its subsidiaries, including Metropolitan Life Insurance Company (“MLIC”). Following this summary is a discussion addressing the consolidated results of operations and financial condition of the Company for the periods indicated. This discussion should be read in conjunction with the forward-looking statement information included below, “Risk Factors” contained in MetLife Inc.’s Annual Report on Form 10-K for the year ended December 31, 2007, “Selected Financial Data” and the Company’s consolidated financial statements included elsewhere herein. This Management’s Discussion and Analysis of Financial Condition and Results of Operations contains statements which constitute forward-looking statements within the meaning of the Private Securities Litigation Reform Act of 1995, including statements relating to trends in the operations and financial results and the business and the products of MetLife, Inc. and its subsidiaries, as well as other statements including words such as “anticipate,” “believe,” “plan,” “estimate,” “expect,” “intend” and other similar expressions. Forward- looking statements are made based upon management’s current expectations and beliefs concerning future developments and their potential effects on the Company. Such forward-looking statements are not guarantees of future performance. Actual results may differ materially from those included in the forward-looking statements as a result of risks and uncertainties including, but not limited to, the following: (i) changes in general economic conditions, including the performance of financial markets and interest rates, which may affect the Company’s ability to raise capital; (ii) heightened competition, including with respect to pricing, entry of new competitors, the development of new products by new and existing competitors and for personnel; (iii) investment losses and defaults, and changes to investment valuations; (iv) unanticipated changes in industry trends; (v) catastrophe losses; (vi) ineffectiveness of risk management policies and procedures; (vii) changes in accounting standards, practices and/or policies; (viii) changes in assumptions related to deferred policy acquisition costs (“DAC”), value of business acquired (“VOBA”) or goodwill; (ix) discrepancies between actual claims experience and assumptions used in setting prices for the Company’s products and establishing the liabilities for the Company’s obligations for future policy benefits and claims; (x) discrepancies between actual experience and assumptions used in establishing liabilities related to other contingencies or obligations; (xi) adverse results or other consequences from litigation, arbitration or regulatory investigations; (xii) downgrades in the Company’s and its affiliates’ claims paying ability, financial strength or credit ratings; (xiii) regulatory, legislative or tax changes that may affect the cost of, or demand for, the Company’s products or services; (xiv) MetLife, Inc.’s primary reliance, as a holding company, on dividends from its subsidiaries to meet debt payment obligations and the applicable regulatory restrictions on the ability of the subsidiaries to pay such dividends; (xv) deterioration in the experience of the “closed block” established in connection with the reorganization of MLIC; (xvi) economic, political, currency and other risks relating to the Company’s international operations; (xvii) the effects of business disruption or economic contraction due to terrorism or other hostilities; (xviii) the Company’s ability to identify and consummate on successful terms any future acquisitions, and to successfully integrate acquired businesses with minimal disruption; and (xix) other risks and uncertainties described from time to time in MetLife’s filings with the U.S. Securities and Exchange Commission (“SEC”). The Company specifically disclaims any obligation to update or revise any forward-looking statement, whether as a result of new information, future developments or otherwise. Executive Summary MetLife is a leading provider of insurance and other financial services with operations throughout the United States and the regions of Latin America, Europe, and Asia Pacific. Through its domestic and international subsidiaries and affiliates, MetLife offers life insurance, annuities, automobile and homeowners insurance, retail banking and other financial services to individuals, as well as group insurance, reinsurance and retirement & savings products and services to corporations and other institutions. MetLife is organized into five operating segments: Institutional, Individual, Auto & Home, International and Reinsurance, as well as Corporate & Other. The management’s discussion and analysis which follows isolates, in order to be meaningful, the results of the acquisition of The Travelers Insurance Company, excluding certain assets, most significantly, Primerica, from Citigroup Inc. (“Citigroup”), and substantially all of Citigroup’s international insurance businesses (collectively, “Travelers”) in the period over period comparison as the Travelers acquisition was not included in the results of the Company until July 1, 2005. The Travelers’ amounts which have been isolated represent the results of the Travelers legal entities which have been acquired. These amounts represent the impact of the Travelers acquisition; however, as business currently transacted through the acquired Travelers legal entities is transitioned to legal entities already owned by the Company, some of which has already occurred, the identification of the Travelers legal entity business will not necessarily be indicative of the impact of the Travelers acquisition on the results of the Company. As a part of the Travelers acquisition, management realigned certain products and services within several of the Company’s segments to better conform to the way it manages and assesses its business. Accordingly, all prior period segment results have been adjusted to reflect such product reclassifications. Also in connection with the Travelers acquisition, management has utilized its economic capital model to evaluate the deployment of capital based upon the unique and specific nature of the risks inherent in the Company’s existing and newly acquired businesses and has adjusted such allocations based upon this model. Year ended December 31, 2007 compared with the year ended December 31, 2006 The Company reported $4,180 million in net income available to common shareholders and earnings per diluted common share of $5.48 for the year ended December 31, 2007 compared to $6,159 million in net income available to common shareholders and earnings per diluted common share of $7.99 for the year ended December 31, 2006. Net income available to common shareholders decreased by $1,979 million, or 32%, for the year ended December 31, 2007 compared to the 2006 period. The decrease in net income available to common shareholders was primarily due to a decrease in income from discontinued operations of $3,185 million, net of income tax. This decrease in income from discontinued operations was principally driven by a gain of $3 billion, net of income tax, on the sale of the Peter Cooper Village and Stuyvesant Town properties in Manhattan, New York, that was recognized during the year ended December 31, 2006. Also contributing to the decrease was lower net investment income and net investment gains (losses) from discontinued operations related to real estate properties sold or held-for-sale during the year ended December 31, 2007 as compared to the year ended December 31, 2006. In addition, there was lower income from discontinued operations related to the sale of MetLife Insurance Limited (“MetLife Australia”) annuities and pension businesses to a third party in the third quarter of 2007 and lower income from 5MetLife, Inc.
  • 10.
    discontinued operations relatedto the sale of SSRM Holdings, Inc. (“SSRM”) resulting from a reduction in additional proceeds from the sale received during the year ended December 31, 2007 as compared to the year December 31, 2006. An increase in other expenses of $579 million, net of income tax, decreased net income available to common shareholders. The increase in other expenses was primarily due to higher DAC amortization resulting from business growth, lower net investment losses in the current year and the net impact of revisions to management’s assumption used to determine estimated gross profits and margins in both years. In addition, other expenses increased due to higher compensation, higher interest expense on debt and interest on tax contin- gencies, higher minority interest expense, the net impact of revisions to certain liabilities in both periods, asset write-offs, higher general spending and expenses related to growth initiatives, partially offset by lower legal costs and integration costs incurred in the prior year. An increase in interest credited to policyholder account balances associated with an increase in the average policyholder account balance decreased net income available to common shareholders by $371 million, net of income tax. Partially offsetting the decrease in net income available to common shareholders was an increase in net investment income of $1,251 million, net of income tax, primarily due to an increase in the average asset base and an increase in yields. Growth in the average asset base was primarily within fixed maturity securities, mortgage loans, real estate joint ventures, and other limited partnership interests. Higher yields was primarily due to higher returns on fixed maturity securities, other limited partnership interests excluding hedge funds, equity securities and improved securities lending results, partially offset by lower returns on real estate joint ventures, cash, cash equivalents and short-term investments, hedge funds and mortgage loans. Management anticipates that investment income and the related yields on other limited partnership interests may decline during 2008 due to increased volatility in the equity and credit markets during 2007. Additionally, there was a decrease in net investment losses of $419 million, net of income tax, primarily due to a reduction of losses on fixed maturity securities resulting principally from the 2006 portfolio repositioning in a rising interest rate environment, increased gains from asset-based foreign currency transactions due to a decline in the U.S. dollar year over year against several major currencies and increased gains on equity securities, partially offset by increased losses from the mark-to-market on derivatives and reduced gains on real estate and real estate joint ventures. The net effect of increases in premiums, fees and other revenues of $1,420 million, net of income tax, across all of the Company’s operating segments and increases in policyholder benefit and claims and policyholder dividends of $924 million, net of income tax, was attributable to overall business growth and increased net income available to common shareholders. The remainder of the variance is due to the change in effective tax rates between periods. Year ended December 31, 2006 compared with the year ended December 31, 2005 The Company reported $6,159 million in net income available to common shareholders and diluted earnings per common share of $7.99 for the year ended December 31, 2006 compared to $4,651 million in net income available to common shareholders and diluted earnings per common share of $6.16 for the year ended December 31, 2005. Excluding the acquisition of Travelers, which contributed $317 million during the first six months of 2006 to the year over year increase, net income available to common shareholders increased by $1,191 million for the year ended December 31, 2006 compared to the 2005 period. Income from discontinued operations consisted of net investment income and net investment gains related to real estate properties that the Company had classified as available-for-sale or had sold and, for the years ended December 31, 2006 and 2005, the operations and gain upon disposal from the sale of SSRM on January 31, 2005 and for the year ended December 31, 2005, the operations of P.T. Sejahtera (“MetLife Indonesia”) which was sold on September 29, 2005. Income from discontinued operations, net of income tax, increased by $1,579 million, or 96%, to $3,222 million for the year ended December 31, 2006 from $1,643 million for the comparable 2005 period. This increase was primarily due to a gain of $3 billion, net of income tax, on the sale of the Peter Cooper Village and Stuyvesant Town properties in Manhattan, New York, as well as a gain of $32 million, net of income tax, related to the sale of SSRM during the year ended December 31, 2006. This increase was partially offset by gains during the year ended December 31, 2005 including $1,193 million, net of income tax, on the sales of the One Madison Avenue and 200 Park Avenue properties in Manhattan, New York, as well as gains on the sales of SSRM and MetLife Indonesia of $177 million and $10 million, respectively, both net of income tax. In addition, there was lower net investment income and net investment gains from discontinued operations related to other real estate properties sold or held-for-sale during the year ended December 31, 2006 compared to the year ended December 31, 2005. Net investment losses increased by $842 million, net of income tax, to a loss of $898 million, net of income tax, for the year ended December 31, 2006 from a loss of $56 million, net of income tax, for the comparable 2005 period. Excluding the impact of the acquisition of Travelers, which contributed a loss of $191 million, net of income tax, during the first six months of 2006 to the year over year increase, net investment losses increased by $651 million. The increase in net investment losses was due to a combination of losses from the mark- to-market on derivatives and foreign currency transaction losses during 2006, largely driven by increases in U.S. interest rates and the weakening of the dollar against the major currencies the Company hedges, notably the euro and pound sterling. Dividends on the Holding Company’s Series A preferred shares and Series B preferred shares (“Preferred Shares”) issued in connection with financing the acquisition of Travelers increased by $71 million, to $134 million for the year ended December 31, 2006, from $63 million for the comparable 2005 period, as the preferred stock was issued in June 2005. The remainder of the increase of $334 million in net income available to common shareholders for the year ended December 31, 2006 compared to the 2005 period was primarily due to an increase in premiums, fees and other revenues attributable to continued business growth across all of the Company’s operating segments. Also contributing to the increase was higher net investment income primarily due to an overall increase in the asset base, an increase in fixed maturity security yields, improved results on real estate and real estate joint ventures, mortgage loans, and other limited partnership interests, as well as higher short-term interest rates on cash equivalents and short- term investments. These increases were partially offset by a decline in net investment income from securities lending results, and bond and commercial mortgage prepayment fees. Favorable underwriting results for the year ended December 31, 2006 were partially offset by a decrease in net interest margins. These increases were partially offset by an increase in expenses primarily due to higher interest expense on debt, increased general spending, higher compensation and commission costs and higher expenses related to growth initiatives and information technology projects, partially offset by a reduction in Travelers’ integration expenses, principally corporate incentives. 6 MetLife, Inc.
  • 11.
    Acquisitions and Dispositions OnAugust 31, 2007, MetLife Australia completed the sale of its annuities and pension businesses to a third party for $25 million in cash consideration, resulting in a gain upon disposal of $41 million, net of income tax, which was adjusted in the fourth quarter of 2007 for additional transaction costs. The Company reclassified the assets and liabilities of the annuities and pension businesses within MetLife Australia, which is reported in the International segment, to assets and liabilities of subsidiaries held-for-sale and the operations of the business to discontinued operations for all periods presented. Included within the assets to be sold were certain fixed maturity securities in a loss position for which the Company recognized a net investment loss on a consolidated basis of $59 million, net of income tax, for the year ended December 31, 2007, because the Company no longer had the intent to hold such securities. On June 28, 2007, the Company acquired the remaining 50% interest in a joint venture in Hong Kong, MetLife Fubon Limited (“MetLife Fubon”), for $56 million in cash, resulting in MetLife Fubon becoming a consolidated subsidiary of the Company. The transaction was treated as a step acquisition, and at June 30, 2007, total assets and liabilities of MetLife Fubon of $839 million and $735 million, respectively, were included in the Company’s consolidated balance sheet. The Company’s investment for the initial 50% interest in MetLife Fubon was $48 million. The Company used the equity method of accounting for such investment in MetLife Fubon. The Company’s share of the joint venture’s results for the six months ended June 30, 2007, was a loss of $3 million. The fair value of the assets acquired and the liabilities assumed in the step acquisition at June 30, 2007, was $427 million and $371 million, respectively. No additional goodwill was recorded as a part of the step acquisition. As a result of this acquisition, additional VOBA and value of distribution agreements of $45 million and $5 million, respectively, were recorded and both have a weighted average amortization period of 16 years. On June 1, 2007, the Company completed the sale of its Bermuda insurance subsidiary, MetLife International Insurance, Ltd. (“MLII”), to a third party for $33 million in cash consideration, resulting in a gain upon disposal of $3 million, net of income tax. The net assets of MLII at disposal were $27 million. A liability of $1 million was recorded with respect to a guarantee provided in connection with this disposition. On September 29, 2005, the Company completed the sale of MetLife Indonesia to a third party, resulting in a gain upon disposal of $10 million, net of income tax. As a result of this sale, the Company recognized income (loss) from discontinued operations of $5 million, net of income tax, for the year ended December 31, 2005. The Company reclassified the operations of MetLife Indonesia into discontinued operations for all years presented. On September 1, 2005, the Company completed the acquisition of CitiStreet Associates, a division of CitiStreet LLC, which is primarily involved in the distribution of annuity products and retirement plans to the education, healthcare, and not-for-profit markets, for $56 million, of which $2 million was allocated to goodwill and $54 million to other identifiable intangibles, specifically the value of customer relationships acquired, which have a weighted average amortization period of 16 years. CitiStreet Associates was integrated with MetLife Resources, a focused distribution channel of MetLife, which is dedicated to provide retirement plans and financial services to the same markets. On July 1, 2005, the Company completed the acquisition of Travelers for $12.1 billion. The results of Travelers’ operations were included in the Company’s financial statements beginning July 1, 2005. As a result of the acquisition, management of the Company increased significantly the size and scale of the Company’s core insurance and annuity products and expanded the Company’s presence in both the retirement & savings’ domestic and international markets. The distribution agreements executed with Citigroup as part of the acquisition provide the Company with one of the broadest distribution networks in the industry. The initial consideration paid in 2005 by the Company for the acquisition consisted of $10.9 billion in cash and 22,436,617 shares of the Holding Company’s common stock with a market value of $1.0 billion to Citigroup and $100 million in other transaction costs. Additional consideration of $115 million was paid by the Holding Company to Citigroup in 2006 as a result of the finalization by both parties of their review of the June 30, 2005 financial statements and final resolution as to the interpretation of the provisions of the acquisition agreement. In addition to cash on-hand, the purchase price was financed through the issuance of common stock, debt securities, common equity units and preferred stock. See “— Liquidity and Capital Resources — The Holding Company — Liquidity Sources.” On January 31, 2005, the Company completed the sale of SSRM to a third party for $328 million in cash and stock. The Company reported the operations of SSRM in discontinued operations. Under the terms of the sale agreement, MetLife will have an opportunity to receive additional payments based on, among other things, certain revenue retention and growth measures. The purchase price is also subject to reduction over five years, depending on retention of certain MetLife-related business. Also under the terms of such agreement, MetLife had the opportunity to receive additional consideration for the retention of certain customers for a specific period in 2005. Upon finalization of the computation, the Company received payments of $30 million, net of income tax, in the second quarter of 2006 and $12 million, net of income tax, in the fourth quarter of 2005 due to the retention of these specific customer accounts. In the first quarter of 2007, the Company received a payment of $16 million, net of income tax, as a result of the revenue retention and growth measure provision in the sales agreement. In the fourth quarter of 2007, the Company accrued a liability for $2 million, net of income tax, related to the termination of certain MetLife-related business. In the fourth quarter of 2006, the Company eliminated $4 million of a liability that was previously recorded with respect to the indemnities provided in connection with the sale of SSRM, resulting in a benefit to the Company of $2 million, net of income tax. The Company believes that future payments relating to these indemnities are not probable. See “— Subsequent Events” for information on the Company’s acquisitions subsequent to December 31, 2007. Industry Trends The Company’s segments continue to be influenced by a variety of trends that affect the industry. Financial and Economic Environment. During 2007, the global capital markets reassessed the credit risk inherent in sub-prime mortgages. This reassessment led to a fairly broad repricing of all credit risk assets and strained market liquidity. Global central banks intervened to stabilize market conditions and protect against downside risks to economic growth. Still, market and economic conditions continued to deteriorate. The economic community’s consensus outlook of global economic growth is lower for calendar year 2008, with a sizable minority of economists forecasting a recessionary environment. The global capital markets have adjusted towards this consensus outlook, with interest rates and equity prices falling and risk spreads widening. Slow growth and recessionary periods are often associated with declining asset prices, lower interest rates, credit rating agency downgrades and increasing default losses. The global capital markets are also less liquid now than in more normal environments. Liquidity conditions impact the cost of purchasing and selling assets and, at times, the ability to purchase or sell assets. These adjustments in the global capital markets have also resulted in higher realized and expected volatility. 7MetLife, Inc.
  • 12.
    As expectations forglobal economic growth are lowered, factors such as consumer spending, business investment, government spending, the volatility and strength of the capital markets, and inflation all affect the business and economic environment and, ultimately, the amount and profitability of the business we conduct. In an economic downturn characterized by higher unemployment, lower family income, lower corporate earnings, lower business investment and lower consumer spending, the demand for financial and insurance products could be adversely affected. Adverse changes in the economy could affect earnings negatively and have a material adverse effect on our business, results of operations and financial condition. Demographics. In the coming decade, a key driver shaping the actions of the life insurance industry will be the rising income protection, wealth accumulation and needs of the retiring Baby Boomers. As a result of increasing longevity, retirees will need to accumulate sufficient savings to finance retirements that may span 30 or more years. Helping the Baby Boomers to accumulate assets for retirement and subsequently to convert these assets into retirement income represents an opportunity for the life insurance industry. Life insurers are well positioned to address the Baby Boomers’ rapidly increasing need for savings tools and for income protection. The Company believes that, among life insurers, those with strong brands, high financial strength ratings and broad distribution, are best positioned to capitalize on the opportunity to offer income protection products to Baby Boomers. Moreover, the life insurance industry’s products and the needs they are designed to address are complex. The Company believes that individuals approaching retirement age will need to seek information to plan for and manage their retirements and that, in the workplace, as employees take greater responsibility for their benefit options and retirement planning, they will need information about their possible individual needs. One of the challenges for the life insurance industry will be the delivery of this information in a cost effective manner. Competitive Pressures. The life insurance industry remains highly competitive. The product development and product life-cycles have shortened in many product segments, leading to more intense competition with respect to product features. Larger companies have the ability to invest in brand equity, product development, technology and risk management, which are among the fundamentals for sustained profitable growth in the life insurance industry. In addition, several of the industry’s products can be quite homogeneous and subject to intense price competition. Sufficient scale, financial strength and financial flexibility are becoming prerequisites for sustainable growth in the life insurance industry. Larger market participants tend to have the capacity to invest in additional distribution capability and the information technology needed to offer the superior customer service demanded by an increasingly sophisticated industry client base. Regulatory Changes. The life insurance industry is regulated at the state level, with some products and services also subject to federal regulation. As life insurers introduce new and often more complex products, regulators refine capital requirements and introduce new reserving standards for the life insurance industry. Regulations recently adopted or currently under review can potentially impact the reserve and capital requirements of the industry. In addition, regulators have undertaken market and sales practices reviews of several markets or products, including equity-indexed annuities, variable annuities and group products. Pension Plans. On August 17, 2006, President Bush signed the Pension Protection Act of 2006 (“PPA”) into law. The PPA is considered to be the most sweeping pension legislation since the adoption of the Employee Retirement Income Security Act of 1974 (“ERISA”) on September 2, 1974. The provisions of the PPA may, over time, have a significant impact on demand for pension, retirement savings, and lifestyle protection products in both the institutional and retail markets. The impact of the legislation may have a positive effect on the life insurance and financial services industries in the future. Impact of Hurricanes On August 29, 2005, Hurricane Katrina made landfall in the states of Louisiana, Mississippi and Alabama, causing catastrophic damage to these coastal regions. MetLife’s cumulative gross losses from Hurricane Katrina were $314 million, $333 million and $335 million at December 31, 2007, 2006 and 2005, respectively, primarily arising from the Company’s homeowners business. During the years ended December 31, 2007, 2006 and 2005, the Company recognized net losses, net of income tax and reinsurance recoverables and including reinstatement premiums and other reinsurance-related premium adjustments related to the catastrophe, of ($13) million, ($2) million and $134 million, respectively. On October 24, 2005, Hurricane Wilma made landfall across the state of Florida. MetLife’s cumulative gross losses from Hurricane Wilma were $66 million, $64 million and $57 million at December 31, 2007, 2006 and 2005, respectively, primarily arising from the Company’s homeowners and automobile businesses. During the years ended December 31, 2006 and 2005, the Company’s Auto & Home segment recognized net losses, net of income tax and reinsurance recoverables, of ($3) million and $32 million, respectively, related to Hurricane Wilma. The Company did not recognize any loss during the year ended December 31, 2007, related to Hurricane Wilma. Additional hurricane-related losses may be recorded in future periods as claims are received from insureds and claims to reinsurers are processed. Reinsurance recoveries are dependent upon the continued creditworthiness of the reinsurers, which may be affected by their other reinsured losses in connection with Hurricanes Katrina and Wilma and otherwise. In addition, lawsuits, including purported class actions, have been filed in Louisiana and Mississippi challenging denial of claims for damages caused to property during Hurricane Katrina. Metropolitan Property and Casualty Insurance Company is a named party in some of these lawsuits. In addition, rulings in cases in which Metropolitan Property and Casualty Insurance Company is not a party may affect interpretation of its policies. Metropolitan Property and Casualty Insurance Company intends to vigorously defend these matters. However, any adverse rulings could result in an increase in the Company’s hurricane-related claim exposure and losses. Based on information known by management, it does not believe that additional claim losses resulting from Hurricane Katrina will have a material adverse impact on the Company’s consolidated financial statements. Summary of Critical Accounting Estimates The preparation of financial statements in conformity with accounting principles generally accepted in the United States of America (“GAAP”) requires management to adopt accounting policies and make estimates and assumptions that affect amounts reported in the consolidated financial statements. The most critical estimates include those used in determining: i) the fair value of investments in the absence of quoted market values; ii) investment impairments; iii) the recognition of income on certain investments; 8 MetLife, Inc.
  • 13.
    iv) the applicationof the consolidation rules to certain investments; v) the fair value of and accounting for derivatives; vi) the capitalization and amortization of DAC and the establishment and amortization of VOBA; vii) the measurement of goodwill and related impairment, if any; viii) the liability for future policyholder benefits; ix) accounting for income taxes and the valuation of deferred tax assets; x) accounting for reinsurance transactions; xi) accounting for employee benefit plans; and xii) the liability for litigation and regulatory matters. The application of purchase accounting requires the use of estimation techniques in determining the fair values of assets acquired and liabilities assumed — the most significant of which relate to the aforementioned critical estimates. In applying these policies, management makes subjective and complex judgments that frequently require estimates about matters that are inherently uncertain. Many of these policies, estimates and related judgments are common in the insurance and financial services industries; others are specific to the Company’s businesses and operations. Actual results could differ from these estimates. Investments The Company’s principal investments are in fixed maturity and equity securities, mortgage and consumer loans, policy loans, real estate, real estate joint ventures and other limited partnerships, short-term investments, and other invested assets. The Company’s investments are exposed to three primary sources of risk: credit, interest rate and market valuation. The financial statement risks, stemming from such investment risks, are those associated with the determination of fair values, the recognition of impairments, the recognition of income on certain investments, and the potential consolidation of previously unconsolidated subsidiaries. The Company’s investments in fixed maturity and equity securities are classified as available-for-sale, except for trading securities, and are reported at their estimated fair value. The fair values for public fixed maturity securities and public equity securities are based on quoted market prices or estimates from independent pricing services. However, in cases where quoted market prices are not available, such as for private fixed maturities, fair values are estimated using present value or valuation techniques. The determination of fair values in the absence of quoted market prices is based on: (i) valuation methodologies; (ii) securities the Company deems to be comparable; and (iii) assumptions deemed appropriate given the circumstances. The fair value estimates are made at a specific point in time, based on available market information and judgments about financial instruments, including estimates of the timing and amounts of expected future cash flows and the credit standing of the issuer or counterparty. Factors considered in estimating fair value include: coupon rate, maturity, estimated duration, call provisions, sinking fund requirements, credit rating, industry sector of the issuer, and quoted market prices of comparable securities. The use of different methodologies and assumptions may have a material effect on the estimated fair value amounts. One of the significant estimates related to available-for-sale securities is the evaluation of investments for other-than-temporary impairments. The assessment of whether impairments have occurred is based on management’s case-by-case evaluation of the underlying reasons for the decline in fair value. The Company’s review of its fixed maturity and equity securities for impairments includes an analysis of the total gross unrealized losses by three categories of securities: (i) securities where the estimated fair value had declined and remained below cost or amortized cost by less than 20%; (ii) securities where the estimated fair value had declined and remained below cost or amortized cost by 20% or more for less than six months; and (iii) securities where the estimated fair value had declined and remained below cost or amortized cost by 20% or more for six months or greater. Additionally, management considers a wide range of factors about the security issuer and uses its best judgment in evaluating the cause of the decline in the estimated fair value of the security and in assessing the prospects for near-term recovery. Inherent in management’s evaluation of the security are assumptions and estimates about the operations of the issuer and its future earnings potential. Considerations used by the Company in the impairment evaluation process include, but are not limited to: i) the length of time and the extent to which the market value has been below cost or amortized cost; ii) the potential for impairments of securities when the issuer is experiencing significant financial difficulties; iii) the potential for impairments in an entire industry sector or sub-sector; iv) the potential for impairments in certain economically depressed geographic locations; v) the potential for impairments of securities where the issuer, series of issuers or industry has suffered a catastrophic type of loss or has exhausted natural resources; vi) the Company’s ability and intent to hold the security for a period of time sufficient to allow for the recovery of its value to an amount equal to or greater than cost or amortized cost; vii) unfavorable changes in forecasted cash flows on mortgage-backed and asset-backed securities; and viii) other subjective factors, including concentrations and information obtained from regulators and rating agencies. The cost of fixed maturity and equity securities is adjusted for impairments in value deemed to be other-than-temporary in the period in which the determination is made. These impairments are included within net investment gains (losses) and the cost basis of the fixed maturity and equity securities is reduced accordingly. The Company does not change the revised cost basis for subsequent recoveries in value. The determination of the amount of allowances and impairments on other invested asset classes is highly subjective and is based upon the Company’s periodic evaluation and assessment of known and inherent risks associated with the respective asset class. Such evaluations and assessments are revised as conditions change and new information becomes available. Management updates its evaluations regularly and reflects changes in allowances and impairments in operations as such evaluations are revised. The recognition of income on certain investments (e.g. loan-backed securities, including mortgage-backed and asset-backed securities, certain investment transactions, trading securities, etc.) is dependent upon market conditions, which could result in prepay- ments and changes in amounts to be earned. Additionally, when the Company enters into certain structured investment transactions, real estate joint ventures and other limited partnerships for which the Company may be deemed to be the primary beneficiary under Financial Accounting Standards Board (“FASB”) Interpretation (“FIN”) No. 46(r), Consolidation of Variable Interest Entities — An Interpretation of ARB No. 51, it may be required to 9MetLife, Inc.
  • 14.
    consolidate such investments.The accounting rules for the determination of the primary beneficiary are complex and require evaluation of the contractual rights and obligations associated with each party involved in the entity, an estimate of the entity’s expected losses and expected residual returns and the allocation of such estimates to each party. The use of different methodologies and assumptions as to the determination of the fair value of investments, the timing and amount of impairments, the recognition of income, or consolidation of investments may have a material effect on the amounts presented within the consolidated financial statements. Derivative Financial Instruments The Company enters into freestanding derivative transactions including swaps, forwards, futures and option contracts. The Company uses derivatives primarily to manage various risks. The risks being managed are variability in cash flows or changes in fair values related to financial instruments and currency exposure associated with net investments in certain foreign operations. To a lesser extent, the Company uses credit derivatives, such as credit default swaps, to synthetically replicate investment risks and returns which are not readily available in the cash market. The Company also purchases certain securities, issues certain insurance policies and engages in certain reinsurance contracts that have embedded derivatives. Fair value of derivatives is determined by quoted market prices or through the use of pricing models. The determination of fair value, when quoted market values are not available, is based on valuation methodologies and assumptions deemed appropriate under the circumstances. Derivative valuations can be affected by changes in interest rates, foreign currency exchange rates, financial indices, credit spreads, market volatility, and liquidity. Values can also be affected by changes in estimates and assumptions used in pricing models. Such assumptions include estimates of volatility, interest rates, foreign currency exchange rates, other financial indices and credit ratings. Essential to the analysis of the fair value is risk of counterparty default. The use of different assumptions may have a material effect on the estimated derivative fair value amounts, as well as the amount of reported net income. Also, fluctuations in the fair value of derivatives which have not been designated for hedge accounting may result in significant volatility in net income. The accounting for derivatives is complex and interpretations of the primary accounting standards continue to evolve in practice. Judgment is applied in determining the availability and application of hedge accounting designations and the appropriate accounting treatment under these accounting standards. If it was determined that hedge accounting designations were not appropriately applied, reported net income could be materially affected. Differences in judgment as to the availability and application of hedge accounting designations and the appropriate accounting treatment may result in a differing impact on the consolidated financial statements of the Company from that previously reported. Measurements of ineffectiveness of hedging relationships are also subject to interpretations and estimations and different interpretations or estimates may have a material effect on the amount reported in net income. Additionally, there is a risk that embedded derivatives requiring bifurcation may not be identified and reported at fair value in the consolidated financial statements and that their related changes in fair value could materially affect reported net income. Deferred Policy Acquisition Costs and Value of Business Acquired The Company incurs significant costs in connection with acquiring new and renewal insurance business. Costs that vary with and relate to the production of new business are deferred as DAC. Such costs consist principally of commissions and agency and policy issue expenses. VOBA is an intangible asset that reflects the estimated fair value of in-force contracts in a life insurance company acquisition and represents the portion of the purchase price that is allocated to the value of the right to receive future cash flows from the business in-force at the acquisition date. VOBA is based on actuarially determined projections, by each block of business, of future policy and contract charges, premiums, mortality and morbidity, separate account performance, surrenders, operating expenses, investment returns and other factors. Actual experience on the purchased business may vary from these projections. The recovery of DAC and VOBA is dependent upon the future profitability of the related business. DAC and VOBA are aggregated in the financial statements for reporting purposes. DAC for property and casualty insurance contracts, which is primarily composed of commissions and certain underwriting expenses, is amortized on a pro rata basis over the applicable contract term or reinsurance treaty. DAC and VOBA on life insurance or investment-type contracts are amortized in proportion to gross premiums, gross margins or gross profits, depending on the type of contract as described below. The Company amortizes DAC and VOBA related to non-participating and non-dividend-paying traditional contracts (term insurance, non-participating whole life insurance, non-medical health insurance, and traditional group life insurance) over the entire premium paying period in proportion to the present value of actual historic and expected future gross premiums. The present value of expected premiums is based upon the premium requirement of each policy and assumptions for mortality, morbidity, persistency, and investment returns at policy issuance, or policy acquisition, as it relates to VOBA, that include provisions for adverse deviation and are consistent with the assumptions used to calculate future policyholder benefit liabilities. These assumptions are not revised after policy issuance or acquisition unless the DAC or VOBA balance is deemed to be unrecoverable from future expected profits. Absent a premium deficiency, variability in amortization after policy issuance or acquisition is caused only by variability in premium volumes. The Company amortizes DAC and VOBA related to participating, dividend-paying traditional contracts over the estimated lives of the contracts in proportion to actual and expected future gross margins. The amortization includes interest based on rates in effect at inception or acquisition of the contracts. The future gross margins are dependent principally on investment returns, policyholder dividend scales, mortality, persistency, expenses to administer the business, creditworthiness of reinsurance counterparties, and certain economic variables, such as inflation. For participating contracts (dividend paying traditional contracts within the closed block) future gross margins are also dependent upon changes in the policyholder dividend obligation. Of these factors, the Company anticipates that investment returns, expenses, persistency, and other factor changes and policyholder dividend scales are reasonably likely to impact significantly the rate of DAC and VOBA amortization. Each reporting period, the Company updates the estimated gross margins with the actual gross margins for that period. When the actual gross margins change from previously estimated gross margins, the cumulative DAC and VOBA amortization is re-estimated and adjusted by a cumulative charge or credit to current operations. When actual gross margins exceed those previously estimated, the DAC and VOBA amortization will increase, resulting in a current period charge to earnings. The opposite result occurs when the actual gross margins are below the previously estimated gross margins. Each reporting period, the Company also updates the actual amount of business in-force, which impacts expected future gross margins. The Company amortizes DAC and VOBA related to fixed and variable universal life contracts and fixed and variable deferred annuity contracts over the estimated lives of the contracts in proportion to actual and expected future gross profits. The amortization includes 10 MetLife, Inc.
  • 15.
    interest based onrates in effect at inception or acquisition of the contracts. The amount of future gross profits is dependent principally upon returns in excess of the amounts credited to policyholders, mortality, persistency, interest crediting rates, expenses to administer the business, creditworthiness of reinsurance counterparties, the effect of any hedges used, and certain economic variables, such as inflation. Of these factors, the Company anticipates that investment returns, expenses, and persistency are reasonably likely to impact significantly the rate of DAC and VOBA amortization. Each reporting period, the Company updates the estimated gross profits with the actual gross profits for that period. When the actual gross profits change from previously estimated gross profits, the cumulative DAC and VOBA amortization is re-estimated and adjusted by a cumulative charge or credit to current operations. When actual gross profits exceed those previously estimated, the DAC and VOBA amortization will increase, resulting in a current period charge to earnings. The opposite result occurs when the actual gross profits are below the previously estimated gross profits. Each reporting period, the Company also updates the actual amount of business remaining in-force, which impacts expected future gross profits. Separate account rates of return on variable universal life contracts and variable deferred annuity contracts affect in-force account balances on such contracts each reporting period. Returns that are higher than the Company’s long-term expectation produce higher account balances, which increases the Company’s future fee expectations and decreases future benefit payment expectations on minimum death benefit guarantees, resulting in higher expected future gross profits. The opposite result occurs when returns are lower than the Company’s long-term expectation. The Company’s practice to determine the impact of gross profits resulting from returns on separate accounts assumes that long-term appreciation in equity markets is not changed by short-term market fluctuations, but is only changed when sustained interim deviations are expected. The Company monitors these changes and only changes the assumption when its long-term expectation changes. The effect of an increase/(decrease) by 100 basis points in the assumed future rate of return is reasonably likely to result in a decrease/(increase) in the DAC and VOBA balances of approximately $95 million with an offset to the Company’s unearned revenue liability of approximately $20 million for this factor. The Company also reviews periodically other long-term assumptions underlying the projections of estimated gross margins and profits. These include investment returns, policyholder dividend scales, interest crediting rates, mortality, persistency, and expenses to administer business. Management annually updates assumptions used in the calculation of estimated gross margins and profits which may have significantly changed. If the update of assumptions causes expected future gross margins and profits to increase, DAC and VOBA amortization will decrease, resulting in a current period increase to earnings. The opposite result occurs when the assumption update causes expected future gross margins and profits to decrease. Over the past two years, the Company’s most significant assumption updates resulting in a change to expected future gross margins and profits and the amortization of DAC and VOBA have been updated due to revisions to expected future investment returns, expenses, in-force or persistency assumptions and policyholder dividends on contracts included within the Individual segment. The Company expects these assumptions to be the ones most reasonably likely to cause significant changes in the future. Changes in these assumptions can be offsetting and the Company is unable to predict their movement or offsetting impact over time. The following chart illustrates the effect on DAC and VOBA within the Company’s Individual segment of changing each of the respective assumptions during the years ended December 31, 2007 and 2006: 2007 2006 Years Ended December 31, (In millions) Investment return . . . . . . . . . . . . . . . . . . . . . . . . . . . . . . . . . . . . . . . . . . . . . . . . . . . . . . . $100 $192 Expense . . . . . . . . . . . . . . . . . . . . . . . . . . . . . . . . . . . . . . . . . . . . . . . . . . . . . . . . . . . . . (53) 45 In-force/Persistency . . . . . . . . . . . . . . . . . . . . . . . . . . . . . . . . . . . . . . . . . . . . . . . . . . . . . . 17 (7) Policyholder dividends and other . . . . . . . . . . . . . . . . . . . . . . . . . . . . . . . . . . . . . . . . . . . . . . (55) (39) Total . . . . . . . . . . . . . . . . . . . . . . . . . . . . . . . . . . . . . . . . . . . . . . . . . . . . . . . . . . . . . . . . $ 9 $191 As of December 31, 2007 and 2006, DAC and VOBA for the Individual segment were $14.2 billion and $14.0 billion, respectively, and for the total Company were $21.5 billion and $20.8 billion, respectively. Goodwill Goodwill is the excess of cost over the fair value of net assets acquired. Goodwill is not amortized but is tested for impairment at least annually or more frequently if events or circumstances, such as adverse changes in the business climate, indicate that there may be justification for conducting an interim test. Impairment testing is performed using the fair value approach, which requires the use of estimates and judgment, at the “reporting unit” level. A reporting unit is the operating segment or a business one level below the operating segment, if discrete financial information is prepared and regularly reviewed by management at that level. For purposes of goodwill impairment testing, goodwill within Corporate & Other is allocated to reporting units within the Company’s business segments. If the carrying value of a reporting unit’s goodwill exceeds its fair value, the excess is recognized as an impairment and recorded as a charge against net income. The fair values of the reporting units are determined using a market multiple, a discounted cash flow model, or a cost approach. The critical estimates necessary in determining fair value are projected earnings, comparative market multiples and the discount rate. Liability for Future Policy Benefits The Company establishes liabilities for amounts payable under insurance policies, including traditional life insurance, traditional annuities and non-medical health insurance. Generally, amounts are payable over an extended period of time and related liabilities are calculated as the present value of expected future benefits to be paid, reduced by the present value of expected future premiums. Such liabilities are established based on methods and underlying assumptions in accordance with GAAP and applicable actuarial standards. Principal assumptions used in the establishment of liabilities for future policy benefits are mortality, morbidity, policy lapse, renewal, retirement, investment returns, inflation, expenses and other contingent events as appropriate to the respective product type. These assumptions are established at the time the policy is issued and are intended to estimate the experience for the period the policy benefits 11MetLife, Inc.
  • 16.
    are payable. Utilizingthese assumptions, liabilities are established on a block of business basis. If experience is less favorable than assumptions, additional liabilities may be required, resulting in a charge to policyholder benefits and claims. Liabilities for future policy benefits for disabled lives are estimated using the present value of benefits method and experience assumptions as to claim terminations, expenses and interest. Liabilities for unpaid claims and claim expenses for property and casualty insurance are included in future policyholder benefits and represent the amount estimated for claims that have been reported but not settled and claims incurred but not reported. Other policyholder funds include claims that have been reported but not settled and claims incurred but not reported on life and non-medical health insurance. Liabilities for unpaid claims are estimated based upon the Company’s historical experience and other actuarial assumptions that consider the effects of current developments, anticipated trends and risk management programs, reduced for anticipated salvage and subrogation. The effects of changes in such estimated liabilities are included in the results of operations in the period in which the changes occur. Future policy benefit liabilities for minimum death and income benefit guarantees relating to certain annuity contracts and secondary and paid up guarantees relating to certain life policies are based on estimates of the expected value of benefits in excess of the projected account balance and recognizing the excess ratably over the accumulation period based on total expected assessments. Liabilities for universal and variable life secondary guarantees and paid-up guarantees are determined by estimating the expected value of death benefits payable when the account balance is projected to be zero and recognizing those benefits ratably over the accumulation period based on total expected assessments. The assumptions used in estimating these liabilities are consistent with those used for amortizing DAC, and are thus subject to the same variability and risk. The Company offers certain variable annuity products with guaranteed minimum benefit riders. These include guaranteed minimum withdrawal benefit (“GMWB”) riders and guaranteed minimum accumulation benefit (“GMAB”) riders. GMWB and GMAB riders are embedded derivatives, which are measured at fair value separately from the host variable annuity contract, with changes in fair value reported in net investment gains (losses). The fair values of GMWB and GMAB riders are calculated based on actuarial and capital market assumptions related to the projected cash flows, including benefits and related contract charges, over the lives of the contracts, incorporating expectations concerning policyholder behavior. These riders may be more costly than expected in volatile or declining markets, causing an increase in liabilities for future policy benefits, negatively affecting net income. The Company periodically reviews its estimates of actuarial liabilities for future policy benefits and compares them with its actual experience. Differences between actual experience and the assumptions used in pricing these policies, guarantees and riders and in the establishment of the related liabilities result in variances in profit and could result in losses. The effects of changes in such estimated liabilities are included in the results of operations in the period in which the changes occur. Income Taxes Income taxes represent the net amount of income taxes that the Company expects to pay to or receive from various taxing jurisdictions in connection with its operations. The Company provides for federal, state and foreign income taxes currently payable, as well as those deferred due to temporary differences between the financial reporting and tax bases of assets and liabilities. The Company’s accounting for income taxes represents management’s best estimate of various events and transactions. Deferred tax assets and liabilities resulting from temporary differences between the financial reporting and tax bases of assets and liabilities are measured at the balance sheet date using enacted tax rates expected to apply to taxable income in the years the temporary differences are expected to reverse. The realization of deferred tax assets depends upon the existence of sufficient taxable income within the carryback or carryforward periods under the tax law in the applicable tax jurisdiction. Valuation allowances are established when management determines, based on available information, that it is more likely than not that deferred income tax assets will not be realized. Significant judgment is required in determining whether valuation allowances should be established, as well as the amount of such allowances. When making such determination, consideration is given to, among other things, the following: i) future taxable income exclusive of reversing temporary differences and carryforwards; ii) future reversals of existing taxable temporary differences; iii) taxable income in prior carryback years; and iv) tax planning strategies. The Company may be required to change its provision for income taxes in certain circumstances. Examples of such circumstances include when the ultimate deductibility of certain items is challenged by taxing authorities or when estimates used in determining valuation allowances on deferred tax assets significantly change or when receipt of new information indicates the need for adjustment in valuation allowances. Additionally, future events, such as changes in tax laws, tax regulations, or interpretations of such laws or regulations, could have an impact on the provision for income tax and the effective tax rate. Any such changes could significantly affect the amounts reported in the consolidated financial statements in the year these changes occur. As described more fully in “— Adoption of New Accounting Pronouncements”, the Company adopted FIN No. 48, Accounting for Uncertainty in Income Taxes — An Interpretation of FASB Statement No. 109 (“FIN 48”) effective January 1, 2007. Under FIN 48, the Company determines whether it is more-likely-than-not that a tax position will be sustained upon examination by the appropriate taxing authorities before any part of the benefit can be recorded in the financial statements. A tax position is measured at the largest amount of benefit that is greater than 50 percent likely of being realized upon settlement. Reinsurance The Company enters into reinsurance transactions as both a provider and a purchaser of reinsurance for its life and property and casualty insurance products. Accounting for reinsurance requires extensive use of assumptions and estimates, particularly related to the future performance of the underlying business and the potential impact of counterparty credit risks. The Company periodically reviews actual and anticipated experience compared to the aforementioned assumptions used to establish assets and liabilities relating to ceded and assumed reinsurance and evaluates the financial strength of counterparties to its reinsurance agreements using criteria similar to that evaluated in the security impairment process discussed previously. Additionally, for each of its reinsurance contracts, the Company determines if the contract provides indemnification against loss or liability relating to insurance risk, in accordance with applicable accounting standards. The Company reviews all contractual features, particularly those that may limit the amount of insurance risk to which the reinsurer is subject or features that delay the timely reimbursement of claims. If the Company determines that a reinsurance contract 12 MetLife, Inc.
  • 17.
    does not exposethe reinsurer to a reasonable possibility of a significant loss from insurance risk, the Company records the contract using the deposit method of accounting. Employee Benefit Plans Certain subsidiaries of the Holding Company (the “Subsidiaries”) sponsor and/or administer pension and other postretirement plans covering employees who meet specified eligibility requirements. The obligations and expenses associated with these plans require an extensive use of assumptions such as the discount rate, expected rate of return on plan assets, rate of future compensation increases, healthcare cost trend rates, as well as assumptions regarding participant demographics such as rate and age of retirements, withdrawal rates and mortality. Management, in consultation with its external consulting actuarial firm, determines these assumptions based upon a variety of factors such as historical performance of the plan and its assets, currently available market and industry data, and expected benefit payout streams. The assumptions used may differ materially from actual results due to, among other factors, changing market and economic conditions and changes in participant demographics. These differences may have a significant effect on the Company’s consolidated financial statements and liquidity. Litigation Contingencies The Company is a party to a number of legal actions and is involved in a number of regulatory investigations. Given the inherent unpredictability of these matters, it is difficult to estimate the impact on the Company’s financial position. Liabilities are established when it is probable that a loss has been incurred and the amount of the loss can be reasonably estimated. Liabilities related to certain lawsuits, including the Company’s asbestos-related liability, are especially difficult to estimate due to the limitation of available data and uncertainty regarding numerous variables that can affect liability estimates. The data and variables that impact the assumptions used to estimate the Company’s asbestos-related liability include the number of future claims, the cost to resolve claims, the disease mix and severity of disease in pending and future claims, the impact of the number of new claims filed in a particular jurisdiction and variations in the law in the jurisdictions in which claims are filed, the possible impact of tort reform efforts, the willingness of courts to allow plaintiffs to pursue claims against the Company when exposure to asbestos took place after the dangers of asbestos exposure were well known, and the impact of any possible future adverse verdicts and their amounts. On a quarterly and annual basis, the Company reviews relevant information with respect to liabilities for litigation, regulatory investigations and litigation-related contingencies to be reflected in the Company’s consol- idated financial statements. It is possible that an adverse outcome in certain of the Company’s litigation and regulatory investigations, including asbestos-related cases, or the use of different assumptions in the determination of amounts recorded could have a material effect upon the Company’s consolidated net income or cash flows in particular quarterly or annual periods. Economic Capital Economic capital is an internally developed risk capital model, the purpose of which is to measure the risk in the business and to provide a basis upon which capital is deployed. The economic capital model accounts for the unique and specific nature of the risks inherent in MetLife’s businesses. As a part of the economic capital process, a portion of net investment income is credited to the segments based on the level of allocated equity. This is in contrast to the standardized regulatory risk-based capital (“RBC”) formula, which is not as refined in its risk calculations with respect to the nuances of the Company’s businesses. 13MetLife, Inc.
  • 18.
    Results of Operations Discussionof Results The following table presents consolidated financial information for the Company for the years indicated: 2007 2006 2005 Years Ended December 31, (In millions) Revenues Premiums . . . . . . . . . . . . . . . . . . . . . . . . . . . . . . . . . . . . . . . . . . . . . . . . . . . $27,895 $26,412 $24,860 Universal life and investment-type product policy fees . . . . . . . . . . . . . . . . . . . . . . 5,311 4,780 3,828 Net investment income . . . . . . . . . . . . . . . . . . . . . . . . . . . . . . . . . . . . . . . . . . 19,006 17,082 14,756 Other revenues . . . . . . . . . . . . . . . . . . . . . . . . . . . . . . . . . . . . . . . . . . . . . . . 1,533 1,362 1,271 Net investment gains (losses) . . . . . . . . . . . . . . . . . . . . . . . . . . . . . . . . . . . . . . (738) (1,382) (86) Total revenues . . . . . . . . . . . . . . . . . . . . . . . . . . . . . . . . . . . . . . . . . . . 53,007 48,254 44,629 Expenses Policyholder benefits and claims . . . . . . . . . . . . . . . . . . . . . . . . . . . . . . . . . . . . 27,828 26,431 25,506 Interest credited to policyholder account balances . . . . . . . . . . . . . . . . . . . . . . . . 5,741 5,171 3,887 Policyholder dividends . . . . . . . . . . . . . . . . . . . . . . . . . . . . . . . . . . . . . . . . . . 1,726 1,701 1,679 Other expenses . . . . . . . . . . . . . . . . . . . . . . . . . . . . . . . . . . . . . . . . . . . . . . . 11,673 10,783 9,264 Total expenses . . . . . . . . . . . . . . . . . . . . . . . . . . . . . . . . . . . . . . . . . . . 46,968 44,086 40,336 Income from continuing operations before provision for income tax . . . . . . . . . . . . . . 6,039 4,168 4,293 Provision for income tax . . . . . . . . . . . . . . . . . . . . . . . . . . . . . . . . . . . . . . . . . 1,759 1,097 1,222 Income from continuing operations . . . . . . . . . . . . . . . . . . . . . . . . . . . . . . . . . . 4,280 3,071 3,071 Income from discontinued operations, net of income tax . . . . . . . . . . . . . . . . . . . . 37 3,222 1,643 Net income. . . . . . . . . . . . . . . . . . . . . . . . . . . . . . . . . . . . . . . . . . . . . . . . . . 4,317 6,293 4,714 Preferred stock dividends . . . . . . . . . . . . . . . . . . . . . . . . . . . . . . . . . . . . . . . . 137 134 63 Net income available to common shareholders . . . . . . . . . . . . . . . . . . . . . . . . . . . $ 4,180 $ 6,159 $ 4,651 Year ended December 31, 2007 compared with the year ended December 31, 2006 — The Company Income from Continuing Operations Income from continuing operations increased by $1,209 million, or 39%, to $4,280 million for the year ended December 31, 2007 from $3,071 million for the comparable 2006 period. The following table provides the change from the prior year in income from continuing operations by segment: $ Change % of Total $ Change (In millions) International . . . . . . . . . . . . . . . . . . . . . . . . . . . . . . . . . . . . . . . . . . . . . . . . . . . . . . . $ 472 39% Institutional . . . . . . . . . . . . . . . . . . . . . . . . . . . . . . . . . . . . . . . . . . . . . . . . . . . . . . . . 314 26 Corporate & Other . . . . . . . . . . . . . . . . . . . . . . . . . . . . . . . . . . . . . . . . . . . . . . . . . . . 278 23 Individual . . . . . . . . . . . . . . . . . . . . . . . . . . . . . . . . . . . . . . . . . . . . . . . . . . . . . . . . . 110 9 Auto & Home. . . . . . . . . . . . . . . . . . . . . . . . . . . . . . . . . . . . . . . . . . . . . . . . . . . . . . . 20 2 Reinsurance . . . . . . . . . . . . . . . . . . . . . . . . . . . . . . . . . . . . . . . . . . . . . . . . . . . . . . . 15 1 Total change, net of income tax . . . . . . . . . . . . . . . . . . . . . . . . . . . . . . . . . . . . . . $1,209 100% The increase in the International segment’s income from continuing operations was primarily attributable to the following factors: • An increase in Argentina’s income from continuing operations primarily due to a net reduction of liabilities resulting from pension reform, a reduction in claim liabilities resulting from experience reviews in both the current and prior years, higher premiums resulting from higher pension contributions attributable to higher participant salaries, higher net investment income resulting from capital contributions in the prior year, and a smaller increase in market indexed policyholder liabilities without a corresponding decrease in net investment income, partially offset by the reduction of cost of insurance fees as a result of the new pension system reform regulation, an increase in retention incentives related to pension reform, as well as lower trading portfolio income. Argentina also benefited, in both the current and prior years, from the utilization of tax loss carryforwards against which valuation allowances had been previously established. • Mexico’s income from continuing operations increased primarily due to a decrease in certain policyholder liabilities caused by a decrease in the unrealized investment results on invested assets supporting those liabilities relative to the prior year, the favorable impact of experience refunds during the first quarter of 2007, a reduction in claim liabilities resulting from an experience review and the unfavorable impact in the prior year resulting from an adjustment to experience refunds in its institutional business, a year over 14 MetLife, Inc.
  • 19.
    year decrease inDAC amortization resulting from management’s update of assumptions used to determine estimated gross profits in both the current and prior years, a decrease in liabilities based on a review of outstanding remittances, and growth in its institutional and universal life businesses. These increases in Mexico’s income from continuing operations were partially offset by lower fees resulting from management’s update of assumptions used to determine estimated gross profits, the favorable impact in the prior year associated with a large group policy that was not renewed, a decrease in various one-time revenue items, lower investment yields, the favorable impact in the prior year of liabilities related to employment matters that were reduced, and the benefit in the prior year from the elimination of liabilities for pending claims determined to be invalid. • Taiwan’s income from continuing operations increased primarily driven by an increase due to higher DAC amortization in the prior year resulting from a loss recognition adjustment and restructuring costs, partially offset by the favorable impact of liability refinements in the prior year, as well as higher policyholder liabilities related to loss recognition in the fourth quarter of 2006. • Brazil’s income from continuing operations increased due to the unfavorable impact of increases in policyholder liabilities due to higher than expected mortality on specific blocks of business and an increase in litigation liabilities in the prior year, the unfavorable impact of the reversal of a tax credit in the prior year, as well as growth of the in-force business. • Ireland’s income from continuing operations increased primarily due to the utilization of net operating losses for which a valuation allowance had been previously established, higher investment income, partially offset by higher start-up expenses and currency transaction losses. • Japan’s income from continuing operations increased due to improved hedge results and business growth, partially offset by the impact of foreign currency transaction losses. • Hong Kong’s income from continuing operations increased due to the acquisition of the remaining 50% interest in MetLife Fubon and the resulting consolidation of the operation, as well as business growth. • Chile’s income from continuing operations increased primarily due to growth of the in-force business, higher joint venture income and higher returns on inflation indexed securities, partially offset by higher compensation, infrastructure and marketing expenses. • Income from continuing operations increased in the United Kingdom due to a reduction of claim liabilities resulting from an experience review, offset by an unearned premium calculation refinement. • Australia’s income from continuing operations increased due to growth of the in-force business and changes in foreign currency exchange rates. • These increases in income from continuing operations were partially offset by a decrease in the home office due to higher economic capital charges and investment expenses, an increase in contingent tax expenses in the current year, as well as higher spending due to growth and initiatives, partially offset by the elimination of certain intercompany expenses previously charged to the International segment, and a tax benefit associated with a prior year income tax expense related to a revision of an estimate. • India’s income from continuing operations decreased primarily due to headcount increases and growth initiatives, as well as the impact of valuation allowances established against losses in both years. • South Korea’s income from continuing operations decreased due to a favorable impact in the prior year associated with the implementation of a more refined reserve valuation system, as well as additional expenses in the current year associated with growth and infrastructure initiatives, partially offset by continued growth and lower DAC amortization, both in the variable universal life business. The Institutional segment’s income from continuing operations increased primarily due to lower net investment losses, an increase in interest margins, an increase in underwriting results, the impact of revisions to certain expenses in both periods, partially offset by higher expenses due to an increase in non-deferrable volume-related and corporate support expenses and an increase in DAC amortization resulting from the ongoing implementation of Statement of Position (“SOP”) 05-1, Accounting by Insurance Enterprises for Deferred Acquisition Costs in Connection with Modifications or Exchanges of Insurance Contracts (“SOP 05-1”) in the current year. Corporate & Other’s income from continuing operations increased primarily due to higher net investment income, lower net investment losses, lower corporate expenses, higher other revenues, integration costs incurred in the prior year, and lower legal costs, partially offset by a decrease in tax benefits, higher interest expense on debt, higher interest on tax contingencies, and higher interest credited to bankholder deposits. The Individual segment’s income from continuing operations increased primarily due to a decrease in net investment losses, higher fee income from separate account products, higher net investment income on blocks of business not driven by interest margins and an increase in interest margins, partially offset by higher DAC amortization, unfavorable underwriting results in life products, higher general expenses, the impact of revisions to certain liabilities in both years, the write-off of a receivable in the current year, an increase in the closed block-related policyholder dividend obligation, higher annuity benefits, an increase in policyholder dividends and an increase in interest credited to policyholder account balances. The Auto & Home segment’s income from continuing operations increased primarily due to an increase in premiums and other revenues, an increase in net investment income, an increase in net investment gains and a decrease in other expenses. These were partially offset by losses related to higher claim frequencies, higher earned exposures, higher losses due to severity, an increase in unallocated claims adjusting expenses and an increase from a reduction in favorable development of prior year losses, partially offset by a decrease in catastrophe losses, which included favorable development of prior year catastrophe reserves, all of which are related to policyholder benefits and claims. Also offsetting the increase in income from continuing operations was a decrease in average earned premium per policy and an increase in catastrophe reinsurance costs. The Reinsurance segment’s income from continuing operations increased primarily due to an increase in premiums due to additional business in-force from facultative and automatic treaties and renewal premiums on existing blocks of business, an increase in net investment income due to growth in the asset base, an increase in other revenues and a decrease in other expenses, partially offset by an increase in net investment losses which was primarily due to a decrease in the fair value of embedded derivatives associated with the reinsurance of annuity products on a funds withheld basis. 15MetLife, Inc.
  • 20.
    Revenues and Expenses Premiums,Fees and Other Revenues Premiums, fees and other revenues increased by $2,185 million, or 7%, to $34,739 million for the year ended December 31, 2007 from $32,554 million for the comparable 2006 period. The following table provides the change from the prior year in premiums, fees and other revenues by segment: $ Change % of Total $ Change (In millions) Institutional . . . . . . . . . . . . . . . . . . . . . . . . . . . . . . . . . . . . . . . . . . . . . . . . . . . . . . . $ 594 27% Reinsurance . . . . . . . . . . . . . . . . . . . . . . . . . . . . . . . . . . . . . . . . . . . . . . . . . . . . . . 573 26 International . . . . . . . . . . . . . . . . . . . . . . . . . . . . . . . . . . . . . . . . . . . . . . . . . . . . . . 560 26 Individual . . . . . . . . . . . . . . . . . . . . . . . . . . . . . . . . . . . . . . . . . . . . . . . . . . . . . . . . 364 17 Auto & Home . . . . . . . . . . . . . . . . . . . . . . . . . . . . . . . . . . . . . . . . . . . . . . . . . . . . . 65 3 Corporate & Other . . . . . . . . . . . . . . . . . . . . . . . . . . . . . . . . . . . . . . . . . . . . . . . . . . 29 1 Total change. . . . . . . . . . . . . . . . . . . . . . . . . . . . . . . . . . . . . . . . . . . . . . . . . . $2,185 100% The growth in the Institutional segment was primarily due to increases in the non-medical health & other and group life businesses. The non-medical health & other business increased primarily due to growth in the dental, disability, accidental death & dismemberment (“AD&D”) and individual disability insurance (“IDI”) businesses. Partially offsetting these increases is a decrease in the long-term care (“LTC”) business, net of a decrease resulting from a shift to deposit liability-type contracts in the current year, partially offset by growth in the business. The group life business increased primarily due to business growth in term life and increases in corporate-owned life insurance and life insurance sold to postretirement benefit plans. These increases in the non-medical health & other and group life businesses were partially offset by a decrease in the retirement & savings business. The decrease in retirement & savings was primarily due to a decrease in structured settlement and pension closeout premiums, partially offset by an increase in other products. The growth in the Reinsurance segment was primarily attributable to premiums from new facultative and automatic treaties and renewal premiums on existing blocks of business in all RGA’s operating segments. In addition, other revenues increased due to an increase in surrender charges on asset-intensive business reinsured and an increase in fees associated with financial reinsurance. The growth in the International segment was primarily due to the following factors: • An increase in Mexico’s premiums, fees and other revenues due to higher fees and growth in its institutional and universal life businesses, a decrease in experience refunds during the first quarter of 2007 on Mexico’s institutional business, as well as the adverse impact in the prior year of an adjustment for experience refunds on Mexico’s institutional business, offset by lower fees resulting from management’s update of assumptions used to determine estimated gross profits and various one-time revenue items which benefited both the current and prior years. • Premiums, fees and other revenues increased in Hong Kong primarily due to the acquisition of the remaining 50% interest in MetLife Fubon and the resulting consolidation of the operation as well as business growth. • Chile’s premiums, fees and other revenues increased primarily due to higher annuity sales, higher institutional premiums from its traditional and bank distribution channels, and the decrease in the prior year resulting from management’s decision not to match aggressive pricing in the marketplace. • South Korea’s premiums, fees and other revenues increased primarily due to higher fees from growth in its guaranteed annuity and variable universal life businesses. • Brazil’s premiums, fees and other revenues increased due to changes in foreign currency exchange rates and business growth. • Premiums, fees and other revenues increased in Japan due to an increase in reinsurance assumed. • Australia’s premiums, fees and other revenues increased primarily due to growth in the institutional and reinsurance business in- force, an increase in retention levels and changes in foreign currency exchange rates. • Argentina’s premiums, fees and other revenues increased due to higher pension contributions resulting from higher participant salaries and a higher salary threshold subject to fees and growth in bancassurance, offset by the reduction of cost of insurance fees as a result of the new pension system reform regulation. • Taiwan’s and India’s premiums, fees and other revenues increased primarily due to business growth. These increases in premiums, fees and other revenues were partially offset by a decrease in the United Kingdom due to an unearned premium calculation refinement, partially offset by changes in foreign currency exchange rates. The growth in the Individual segment was primarily due to higher fee income from variable life and annuity and investment-type products and growth in premiums from other life products, partially offset by a decrease in immediate annuity premiums and a decline in premiums associated with the Company’s closed block business, in line with expectations. The growth in the Auto & Home segment was primarily due to an increase in premiums related to increased exposures, an increase in various voluntary and involuntary programs, and a change in estimate on auto rate refunds due to a regulatory examination, as well as an increase in other revenues primarily due to slower than anticipated claim payments in 2006. These increases were partially offset by a reduction in average earned premium per policy, and an increase in catastrophe reinsurance costs. The increase in Corporate & Other was primarily related to the resolution of an indemnification claim associated with the 2000 acquisition of General American Life Insurance Company (“GALIC”), partially offset by an adjustment of surrender values on corporate- owned life insurance policies. Net Investment Income Net investment income increased by $1,924 million, or 11%, to $19,006 million for the year ended December 31, 2007 from $17,082 million for the comparable 2006 period. Management attributes $1,336 million of this increase to growth in the average asset base and $588 million to an increase in yields. The increase in net investment income from growth in the average asset base was primarily within fixed maturity securities, mortgage loans, real estate joint ventures and other limited partnership interests. The increase in net 16 MetLife, Inc.
  • 21.
    investment income attributableto higher yields was primarily due to higher returns on fixed maturity securities, other limited partnership interests excluding hedge funds, equity securities and improved securities lending results, partially offset by lower returns on real estate joint ventures, cash, cash equivalents and short-term investments, hedge funds and mortgage loans. Management anticipates that investment income and the related yields on other limited partnership interests may decline during 2008 due to increased volatility in the equity and credit markets during 2007. Interest Margin Interest margin, which represents the difference between interest earned and interest credited to policyholder account balances increased in the Institutional and Individual segments for the year ended December 31, 2007 as compared to the prior year. Interest earned approximates net investment income on investable assets attributed to the segment with minor adjustments related to the consolidation of certain separate accounts and other minor non-policyholder elements. Interest credited is the amount attributed to insurance products, recorded in policyholder benefits and claims, and the amount credited to policyholder account balances for investment-type products, recorded in interest credited to policyholder account balances. Interest credited on insurance products reflects the current year impact of the interest rate assumptions established at issuance or acquisition. Interest credited to policyholder account balances is subject to contractual terms, including some minimum guarantees. This tends to move gradually over time to reflect market interest rate movements and may reflect actions by management to respond to competitive pressures and, therefore, generally does not introduce volatility in expense. Net Investment Gains (Losses) Net investment losses decreased by $644 million to a loss of $738 million for the year ended December 31, 2007 from a loss of $1,382 million for the comparable 2006 period. The decrease in net investment losses was primarily due to a reduction of losses on fixed maturity securities resulting principally from the 2006 portfolio repositioning in a rising interest rate environment, increased gains from asset-based foreign currency transactions due to a decline in the U.S. dollar year over year against several major currencies and increased gains on equity securities, partially offset by increased losses from the mark-to-market on derivatives and reduced gains on real estate and real estate joint ventures. Underwriting Underwriting results are generally the difference between the portion of premium and fee income intended to cover mortality, morbidity or other insurance costs, less claims incurred, and the change in insurance-related liabilities. Underwriting results are significantly influenced by mortality, morbidity or other insurance-related experience trends, as well as the reinsurance activity related to certain blocks of business. Consequently, results can fluctuate from period to period. Underwriting results, excluding catastrophes, in the Auto & Home segment were less favorable for the year ended December 31, 2007, as the combined ratio, excluding catastrophes, increased to 86.3% from 82.8% for the year ended December 31, 2006. Underwriting results were favorable in the non-medical health & other, group life and retirement & savings businesses in the Institutional segment. Underwriting results were unfavorable in the life products in the Individual segment. Other Expenses Other expenses increased by $890 million, or 8%, to $11,673 million for the year ended December 31, 2007 from $10,783 million for the comparable 2006 period. The following table provides the change from the prior year in other expenses by segment: $ Change % of Total $ Change (In millions) Individual . . . . . . . . . . . . . . . . . . . . . . . . . . . . . . . . . . . . . . . . . . . . . . . . . . . . . . . . $512 57% International . . . . . . . . . . . . . . . . . . . . . . . . . . . . . . . . . . . . . . . . . . . . . . . . . . . . . . 219 25 Institutional . . . . . . . . . . . . . . . . . . . . . . . . . . . . . . . . . . . . . . . . . . . . . . . . . . . . . . . 124 14 Corporate & Other . . . . . . . . . . . . . . . . . . . . . . . . . . . . . . . . . . . . . . . . . . . . . . . . . . 51 6 Auto & Home . . . . . . . . . . . . . . . . . . . . . . . . . . . . . . . . . . . . . . . . . . . . . . . . . . . . . (15) (2) Reinsurance . . . . . . . . . . . . . . . . . . . . . . . . . . . . . . . . . . . . . . . . . . . . . . . . . . . . . . (1) — Total change. . . . . . . . . . . . . . . . . . . . . . . . . . . . . . . . . . . . . . . . . . . . . . . . . . $890 100% The Individual segment contributed to the year over year increase in other expenses primarily due to higher DAC amortization, higher expenses associated with business growth, information technology and other general expenses, the impact of revisions to certain liabilities, including pension and postretirement liabilities and policyholder liabilities in the prior year, and a write-off of a receivable in the current year. The International segment contributed to the year over year increase in other expenses primarily due to the business growth commensurate with the increase in revenues discussed above. It was driven by the following factors: • Argentina’s other expenses increased primarily due to a liability for servicing obligations that was established as a result of pension reform, an increase in commissions on bancassurance business, an increase in retention incentives related to pension reform, and the impact of management’s update of DAC assumptions as a result of pension reform and growth, partially offset by a lower increase in liabilities due to inflation and exchange rate indexing. • South Korea’s other expenses increased primarily due to the favorable impact in DAC amortization associated with the implemen- tation of a more refined reserve valuation system in the prior year, additional expenses associated with growth and infrastructure initiatives, as well as business growth and higher bank insurance fees, partially offset by a decrease in DAC amortization. • Mexico’s other expenses increased due to higher expenses related to business growth and the favorable impact in the prior year of liabilities that were reduced, offset by a decrease in DAC amortization resulting from management’s update of assumptions used to determine estimated gross profits in both the current and prior years and a decrease in liabilities based on a review of outstanding remittances. 17MetLife, Inc.
  • 22.
    • Other expensesincreased in India primarily due to headcount increases and growth initiatives, partially offset by the impact of management’s update of assumptions used to determine estimated gross profits. • Other expenses increased in Australia primarily due to business growth and changes in foreign currency exchange rates. • Other expenses increased in Chile primarily due to compensation costs, infrastructure and marketing programs, and growth partially offset by a decrease in DAC amortization related to inflation indexing. • Other expenses increased in Hong Kong due to the acquisition of the remaining 50% interest in MetLife Fubon and the resulting consolidation of the operation. • Ireland’s other expenses increased due to higher start-up costs, as well as foreign currency transaction losses. • Brazil’s other expenses increased due to changes in foreign currency exchange rates partially offset by an increase in litigation liabilities in the prior year. • The United Kingdom’s other expenses increased due to changes in foreign currency exchange rates and higher spending on business initiatives partially offset by lower DAC amortization resulting from calculation refinements. • These increases in other expenses were partially offset by a decrease in Taiwan’s other expenses primarily due to a one-time increase in DAC amortization in the prior year due to a loss recognition adjustment resulting from low interest rates related to product guarantees coupled with high persistency rates on certain blocks of business, an increase in DAC amortization in the prior year associated with the implementation of a new valuation system, as well as one-time expenses in the prior year related to the termination of the agency force, and expense reductions recognized in the current year due to the elimination of the agency force. Other expenses decreased in the home office primarily due to the elimination of certain intercompany expenses previously charged to the International segment, offset by higher spending on growth and infrastructure initiatives. The Institutional segment contributed to the year over year increase primarily due to an increase in non-deferrable volume-related and corporate support expenses, higher DAC amortization associated with the ongoing implementation of SOP 05-1 in the current year, a charge related to the reimbursement of dental claims in the current year, the establishment of a contingent legal liability in the current year and the impact of certain revisions in both years. These increases were partially offset by a benefit related to a reduction of an allowance for doubtful accounts in the current year, the impact of a charge of non-deferrable LTC commissions expense, a charge associated with costs related to the sale of certain small market record keeping businesses and a regulatory settlement, all in the prior year. Corporate & Other contributed to the year over year increase in other expenses primarily due to higher interest expense, higher interest on tax contingences and an increase in interest credited to bankholder deposits at MetLife Bank, National Association, a national bank (“MetLife Bank” or “MetLife Bank, N.A.”), partially offset by lower corporate support expenses, lower costs from reductions of MetLife Foundation contributions, integration costs incurred in the prior year and lower legal costs. These increases in other expenses were partially offset by a decrease in the Auto & Home segment primarily related to lower information technology and advertising costs, partially offset by minor changes in a variety of expense categories. These increases in other expenses were partially offset by a decrease in the Reinsurance segment primarily due to a decrease in expenses associated with DAC, partially offset by an increase in interest expense associated with note offerings in both years, an increase in minority interest expense, as well as an increase in compensation and overhead-related expenses associated with RGA’s international expansion and general growth in the operations. Net Income Income tax expense for the year ended December 31, 2007 was $1,759 million, or 29% of income from continuing operations before provision for income tax, compared with $1,097 million, or 26% of such income, for the comparable 2006 period. The 2007 and 2006 effective tax rates differ from the corporate tax rate of 35% primarily due to the impact of non-taxable investment income and tax credits for investments in low income housing. In addition, the increase in the effective rate for FIN 48 liability additions is entirely offset by an increase in non-taxable investment income. The 2007 period includes a benefit for decrease in international deferred tax valuation allowances and the 2006 period included a prior year benefit for international taxes. Lastly, the 2006 period included benefit for a “provision-to-filed return” adjustment regarding non-taxable investment income. Income from discontinued operations, net of income tax, decreased by $3,185 million, or 99%, to $37 million for the year ended December 31, 2007 from $3,222 million for the comparable 2006 period. The decrease in income from discontinued operations was primarily due a gain of $3 billion, net of income tax, on the sale of the Peter Cooper Village and Stuyvesant Town properties in Manhattan, New York, that was recognized during the year ended December 31, 2006. In addition, there was lower net investment income and net investment gains (losses) of $144 million, net of income tax, from discontinued operations related to real estate properties sold or held-for- sale during the year ended December 31, 2007 as compared to the year ended December 31, 2006. Also contributing to the decrease was lower income from discontinued operations of $23 million, net of income tax, related to the sale of MetLife Australia’s annuities and pension businesses to a third party in the third quarter of 2007 and lower income from discontinued operations of $18 million, net of income tax, related to the sale of SSRM resulting from a reduction in additional proceeds from the sale received during the year ended December 31, 2007 as compared to the year December 31, 2006. Year ended December 31, 2006 compared with the year ended December 31, 2005 — The Company Income from Continuing Operations Income from continuing operations was $3,071 million for the years ended December 31, 2006 and December 31, 2005. Excluding the acquisition of Travelers, which contributed $298 million during the first six months of 2006 to the year over year increase, income from continuing operations decreased by $298 million. Income from continuing operations for the years ended December 31, 2006 and 2005 included the impact of certain transactions or events, the timing, nature and amount of which are generally unpredictable. These transactions are described in each applicable segment’s discussion. These items contributed a charge of $23 million, net of income tax, to the year ended December 31, 2006. These items contributed a benefit of $48 million, net of income tax, to the year ended December 31, 2005. Excluding the impact of these items and the acquisition of Travelers, income from continuing operations decreased by $227 million for the year ended December 31, 2006 compared to the prior 2005 period. 18 MetLife, Inc.
  • 23.
    The following tableprovides the change in income from continuing operations by segment, excluding Travelers, and certain transactions as mentioned above: $ Change % of Total $ Change (In millions) Institutional . . . . . . . . . . . . . . . . . . . . . . . . . . . . . . . . . . . . . . . . . . . . . . . . . . . . . . . . $(319) (140)% Individual . . . . . . . . . . . . . . . . . . . . . . . . . . . . . . . . . . . . . . . . . . . . . . . . . . . . . . . . . (68) (30) International . . . . . . . . . . . . . . . . . . . . . . . . . . . . . . . . . . . . . . . . . . . . . . . . . . . . . . . (33) (15) Corporate & Other . . . . . . . . . . . . . . . . . . . . . . . . . . . . . . . . . . . . . . . . . . . . . . . . . . . (25) (11) Auto & Home. . . . . . . . . . . . . . . . . . . . . . . . . . . . . . . . . . . . . . . . . . . . . . . . . . . . . . . 192 85 Reinsurance . . . . . . . . . . . . . . . . . . . . . . . . . . . . . . . . . . . . . . . . . . . . . . . . . . . . . . . 26 11 Total change, net of income tax . . . . . . . . . . . . . . . . . . . . . . . . . . . . . . . . . . . . . . $(227) (100)% The Institutional segment’s income from continuing operations decreased primarily due to an increase in net investment losses, a decline in interest margins, an increase in operating expenses, which included a charge associated with costs related to the sale of certain small market recordkeeping businesses, a charge associated with non-deferrable LTC commissions expense and a charge associated with costs related to a previously announced regulatory settlement, partially offset by the impact of integration costs in the prior year and favorable underwriting results. The Individual segment’s income from continuing operations decreased as a result of an increase in net investment losses, a decline in interest margins, higher expenses and annuity benefits, as well as increases in interest credited to policyholder account balances and policyholder dividends. These decreases were partially offset by increased fee income related to the growth in separate account products, favorable underwriting results in life products, lower DAC amortization and a decrease in the closed block-related policyholder dividend obligation. Income from continuing operations in Corporate & Other decreased primarily due to higher investment losses, higher interest expense on debt, corporate support expenses, interest credited to bankholder deposits and legal-related costs, partially offset by an increase in tax benefits, an increase in net investment income, lower integration costs and an increase in other revenues. The decrease in income from continuing operations in the International segment was primarily attributable to the following factors: • Taiwan had a decrease due to a loss recognition adjustment and a restructuring charge, partially offset by reserve refinements associated with the implementation of a new valuation system. • Income from continuing operations decreased in Canada primarily due to the realignment of economic capital in the prior year. • Income from continuing operations in Mexico decreased primarily due to an increase in amortization of DAC, higher operating expenses, the net impact of an adjustment to the liability for experience refunds on a block of business, a decrease in various one- time other revenue items in both periods, as well as an increase in income tax expense due to a tax benefit realized in the prior year. These decreases in Mexico were partially offset by a decrease in certain policyholder liabilities caused by a decrease in unrealized investment gains on invested assets supporting those liabilities relative to the prior year, a decrease in policyholder benefits associated with a large group policy that was not renewed by the policyholder, a benefit in the current year from the release of liabilities for pending claims that were determined to be invalid following a review, and the unfavorable impact in the prior year of contingent liabilities. • In addition, a decrease in Brazil was primarily due to an increase in policyholder benefits and claims related to an increase in future policyholder benefit liabilities on specific blocks of business and an increase in litigation liabilities, as well as adverse claim experience in the current year. • The home office recorded higher infrastructure expenditures in support of segment growth, as well as a contingent tax liability. This was offset by a reduction in the amount charged for economic capital. • Results of the Company’s investment in Japan decreased primarily due to variability in the hedging program. • In addition, expenses related to the Company’s start-up operations in Ireland reduced income from continuing operations. A valuation allowance was established against the deferred tax benefit resulting from the Ireland losses. • Partially offsetting these decreases in income from continuing operations were increases in Chile and the United Kingdom due to continued growth of the in-force business. • In addition, an increase occurred in Australia due to reserve strengthening on a block of business in the prior year. • South Korea’s income from continuing operations increased due to growth in the in-force business and the implementation of a more refined reserve valuation system. • Argentina’s income from continuing operations increased due to higher net investment income resulting from capital contributions, the release of liabilities for pending claims that were determined to be invalid following a review, the favorable impact of foreign currency exchange rates and inflation rates on certain contingent liabilities, the utilization of net operating losses for which a valuation allowance had been previously established, and an increase in the prior year period of a deferred income tax valuation allowance, as well as business growth. Changes in foreign currency exchange rates also contributed to the increase. Partially offsetting the decreases in income from continuing operations was an increase in the Auto & Home segment primarily due to a loss in the third quarter of 2005 related to Hurricane Katrina, favorable development of prior year loss reserves, improvement in non- catastrophe loss experience and a reduction in loss adjustment expenses. These increases were partially offset by higher catastrophe losses, excluding Hurricanes Katrina and Wilma, in the current year period, and decreases in net earned premiums, other revenues, and net investment income, as well as an increase in other expenses. Income from continuing operations in the Reinsurance segment increased primarily due to added business in-force from facultative and automatic treaties and renewal premiums on existing blocks of business in the U.S. and international operations, an increase in net investment income due to growth in the invested asset base and an increase in other revenues. These items were partially offset by unfavorable mortality experience, an increase in liabilities associated with Reinsurance Group of America, Incorporated’s (“RGA”) Argentine 19MetLife, Inc.
  • 24.
    pension business inthe prior period and an increase in other expenses, primarily related to expenses associated with DAC, interest expense, minority interest expense and equity compensation costs. Revenues and Expenses Premiums, Fees and Other Revenues Premiums, fees and other revenues increased by $2,595 million, or 9%, to $32,554 million for the year ended December 31, 2006 from $29,959 million for the comparable 2005 period. Excluding the impact of the acquisition of Travelers, which contributed $945 million during the first six months of 2006 to the year over year increase, premiums, fees and other revenues increased by $1,650 million. The following table provides the change in premiums, fees and other revenues by segment, excluding Travelers: $ Change % of Total $ Change (In millions) Reinsurance . . . . . . . . . . . . . . . . . . . . . . . . . . . . . . . . . . . . . . . . . . . . . . . . . . . . . . . $ 487 30% International . . . . . . . . . . . . . . . . . . . . . . . . . . . . . . . . . . . . . . . . . . . . . . . . . . . . . . . 470 28 Institutional . . . . . . . . . . . . . . . . . . . . . . . . . . . . . . . . . . . . . . . . . . . . . . . . . . . . . . . . 458 28 Individual . . . . . . . . . . . . . . . . . . . . . . . . . . . . . . . . . . . . . . . . . . . . . . . . . . . . . . . . . 229 14 Corporate & Other . . . . . . . . . . . . . . . . . . . . . . . . . . . . . . . . . . . . . . . . . . . . . . . . . . . 4 — Auto & Home. . . . . . . . . . . . . . . . . . . . . . . . . . . . . . . . . . . . . . . . . . . . . . . . . . . . . . . 2 — Total change . . . . . . . . . . . . . . . . . . . . . . . . . . . . . . . . . . . . . . . . . . . . . . . . . . . $1,650 100% The growth in the Reinsurance segment was primarily attributable to premiums from new facultative and automatic treaties and renewal premiums on existing blocks of business in the U.S. and international operations. The growth in the International segment was primarily due to the following factors: • An increase in Mexico’s premiums, fees and other revenues due to growth in the business and higher fees, partially offset by an adjustment for experience refunds on a block of business and various one- time other revenue items in both years. • South Korea’s premiums, fees and other revenues increased due to business growth, as well as the favorable impact of foreign currency exchange rates. • Brazil’s premiums, fees and other revenues increased due to business growth and higher bancassurance business, as well as an increase in amounts retained under reinsurance arrangements. • Chile’s premiums, fees and other revenues increased primarily due to higher institutional premiums through its bank distribution channel, partially offset by lower annuity sales. • Business growth in the United Kingdom, Argentina, Australia and Taiwan, as well as the favorable impact of changes in foreign currency exchange rates, also contributed to the increase in the International segment. The growth in the Institutional segment was primarily due to growth in the dental, disability, AD&D products, as well as growth in the LTC and IDI businesses, all within the non-medical health & other business. Additionally, growth in the group life business was attributable to the impact of sales and favorable persistency largely in the term life business. These increases in the non-medical health & other and group life businesses were partially offset by a decrease in the retirement & savings business. The decline in retirement & savings was primarily due to a decline in premiums from structured settlements predominantly due to lower sales, partially offset by an increase in master terminal funding premiums (“MTF”). The growth in the Individual segment was primarily due to higher fee income from universal life and investment-type products and an increase in premiums from other life products, partially offset by a decrease in immediate annuity premiums and a decline in premiums associated with the Company’s closed block business as this business continues to run-off. Net Investment Income Net investment income increased by $2,326 million, or 16%, to $17,082 million for the year ended December 31, 2006 from $14,756 million for the comparable 2005 period. Excluding the impact of the acquisition of Travelers, which contributed $1,425 million during the first six months of 2006 to the year over year increase, net investment income increased by $901 million of which management attributes $648 million to growth in the average asset base and $253 million to an increase in yields. This increase was primarily due to an overall increase in the asset base, an increase in fixed maturity security yields, improved results on real estate and real estate joint ventures, mortgage loans, and other limited partnership interests, as well as higher short-term interest rates on cash equivalents and short- term investments. These increases were partially offset by a decline in investment income from securities lending results, and bond and commercial mortgage prepayment fees. Interest Margin Interest margin, which represents the difference between interest earned and interest credited to policyholder account balances, decreased in the Institutional and Individual segments for the year ended December 31, 2006 as compared to the prior year. Interest earned approximates net investment income on investable assets attributed to the segment with minor adjustments related to the consolidation of certain separate accounts and other minor non-policyholder elements. Interest credited is the amount attributed to insurance products, recorded in policyholder benefits and claims, and the amount credited to policyholder account balances for investment-type products, recorded in interest credited to policyholder account balances. Interest credited on insurance products reflects the current period impact of the interest rate assumptions established at issuance or acquisition. Interest credited to policyholder account balances is subject to contractual terms, including some minimum guarantees. This tends to move gradually over time to reflect market interest rate movements and may reflect actions by management to respond to competitive pressures and, therefore, generally does not introduce volatility in expense. 20 MetLife, Inc.
  • 25.
    Net Investment Gains(Losses) Net investment losses increased by $1,296 million to a loss of $1,382 million for the year ended December 31, 2006 from a loss of $86 million for the comparable 2005 period. Excluding the impact of the acquisition of Travelers, which contributed a loss of $294 million during the first six months of 2006 to the year over year increase, net investment losses increased by $1,002 million. The increase in net investment losses was due to a combination of losses from the mark-to-market on derivatives and foreign currency transaction losses during 2006, largely driven by increases in U.S. interest rates and the weakening of the dollar against the major currencies the Company hedges, notably the euro and pound sterling. Underwriting Underwriting results are generally the difference between the portion of premium and fee income intended to cover mortality, morbidity or other insurance costs, less claims incurred, and the change in insurance-related liabilities. Underwriting results are significantly influenced by mortality, morbidity or other insurance-related experience trends and the reinsurance activity related to certain blocks of business and, as a result, can fluctuate from period to period. Underwriting results were favorable within the life products in the Individual segment, as well as in the Reinsurance segment, and in the group life and non-medical health & other products in the Institutional segment. Retirement & saving’s underwriting results were mixed across several products in the Institutional segment. Underwriting results, excluding catastrophes, in the Auto & Home segment were favorable for the year ended December 31, 2006, as the combined ratio, excluding catastrophes, decreased to 82.8% from 86.7% for the year ended December 31, 2005. Underwriting results in the International segment increased commensurate with the growth in the business for most countries with the exception of Brazil, which experienced unfavorable claim experience, and Argentina, which experienced improved claim experience. Other Expenses Other expenses increased by $1,519 million, or 16%, to $10,783 million for the year ended December 31, 2006 from $9,264 million for the comparable 2005 period. Excluding the impact of the acquisition of Travelers, which contributed $605 million during the first six months of 2006 to the year over year increase, other expenses increased by $914 million. The year ended December 31, 2006 includes a $35 million contribution to the MetLife Foundation. The year ended December 31, 2005 included a $28 million benefit associated with the reduction of a previously established real estate transfer tax liability related to MLIC’s demutualization in 2000. Excluding these items and the acquisition of Travelers, other expenses increased by $851 million from the comparable 2005 period. The following table provides the change in other expenses by segment, excluding Travelers, and certain transactions as mentioned above: $ Change % of Total $ Change (In millions) International . . . . . . . . . . . . . . . . . . . . . . . . . . . . . . . . . . . . . . . . . . . . . . . . . . . . . . . $326 38% Corporate & Other . . . . . . . . . . . . . . . . . . . . . . . . . . . . . . . . . . . . . . . . . . . . . . . . . . . 287 34 Reinsurance . . . . . . . . . . . . . . . . . . . . . . . . . . . . . . . . . . . . . . . . . . . . . . . . . . . . . . . 236 28 Institutional . . . . . . . . . . . . . . . . . . . . . . . . . . . . . . . . . . . . . . . . . . . . . . . . . . . . . . . . 79 9 Auto & Home. . . . . . . . . . . . . . . . . . . . . . . . . . . . . . . . . . . . . . . . . . . . . . . . . . . . . . . 17 2 Individual . . . . . . . . . . . . . . . . . . . . . . . . . . . . . . . . . . . . . . . . . . . . . . . . . . . . . . . . . (94) (11) Total change . . . . . . . . . . . . . . . . . . . . . . . . . . . . . . . . . . . . . . . . . . . . . . . . . . . $851 100% The International segment contributed to the year over year increase in other expenses primarily due to business growth commensurate with the increase in revenues discussed above and changes in foreign currency exchange rates. This was driven by the following factors: • Taiwan’s other expenses increased due to an increase in amortization of DAC, due to a loss recognition adjustment, refinements associated with the implementation of a new valuation system and a restructuring charge. • Mexico’s other expenses increased due to an increase in commissions commensurate with the revenue growth, higher DAC amortization, higher expenses related to growth initiatives and additional expenses associated with the Mexican pension business, partially offset by the unfavorable impact of contingent liabilities that were established in the prior year related to potential employment matters and which were eliminated in the current year. • South Korea’s other expenses increased due to an increase in DAC amortization and general expenses, partially offset by a decrease in DAC amortization associated with the implementation of a more refined reserve valuation system. • Brazil’s other expenses increased due to an increase in litigation liabilities. • Other expenses associated with the home office increased due to an increase in expenditures for information technology projects, growth initiative projects and integration costs, as well as an increase in compensation expense. • In addition, expenses were incurred related to the start-up of operations in Ireland. Corporate & Other contributed to the year over year variance in other expenses primarily due to higher interest expense, corporate support expenses, interest credited to bankholder deposits at MetLife Bank and legal-related costs, partially offset by lower integration costs. The Reinsurance segment also contributed to the increase in other expenses primarily due to an increase in expenses associated with DAC, interest expense and minority interest, as well as an increase in compensation, including equity compensation expense and overhead-related expenses. The Institutional segment contributed to the year over year increase primarily due to an increase in non-deferrable volume-related expenses, a charge associated with costs related to the sale of certain small market recordkeeping businesses, a charge associated with non-deferrable LTC commissions expense and a charge associated with costs related to a previously announced regulatory settlement, all within the current year, partially offset by the reduction in Travelers-related integration costs, principally incentive accruals and an adjustment of DAC for certain LTC products. 21MetLife, Inc.
  • 26.
    The Auto &Home segment contributed to the year over year increase primarily due to expenditures related to information technology, advertising and compensation costs. Partially offsetting the increases in other expenses was a decrease in the Individual segment. This decrease was primarily due to lower DAC amortization, partially offset by higher general spending in the current year, despite higher corporate incentives. In addition, the impact of revisions to certain expenses, premium tax, policyholder liabilities and pension and postretirement liabilities, in both periods, increased other expenses in the current year period. Net Income Income tax expense for the year ended December 31, 2006 was $1,097 million, or 26% of income from continuing operations before provision for income tax, compared with $1,222 million, or 28%, of such income, for the comparable 2005 period. Excluding the impact of the acquisition of Travelers, which contributed $118 million during the first six months of 2006, income tax expense was $979 million, or 26%, of income from continuing operations before provision for income tax, compared with $1,222 million, or 28%, of such income, for the comparable 2005 period. The 2006 and 2005 effective tax rates differ from the corporate tax rate of 35% primarily due to the impact of non- taxable investment income and tax credits for investments in low income housing. The 2006 effective tax rate also includes an adjustment of a benefit of $33 million consisting primarily of a revision in the estimate of income tax for 2005, and the 2005 effective tax rate also includes a tax benefit of $27 million related to the repatriation of foreign earnings pursuant to Internal Revenue Code Section 965 for which a U.S. deferred tax provision had previously been recorded and an adjustment of a benefit of $31 million consisting primarily of a revision in the estimate of income tax for 2004. Income from discontinued operations consisted of net investment income and net investment gains related to real estate properties that the Company had classified as available-for-sale or had sold and, for the years ended December 31, 2006 and 2005, the operations and gain upon disposal from the sale of SSRM on January 31, 2005 and for the year ended December 31, 2005, the operations of MetLife Indonesia which was sold on September 29, 2005. Income from discontinued operations, net of income tax, increased by $1,579 million, or 96%, to $3,222 million for the year ended December 31, 2006 from $1,643 million for the comparable 2005 period. This increase is primarily due to a gain of $3 billion, net of income tax, on the sale of the Peter Cooper Village and Stuyvesant Town properties in Manhattan, New York, as well as a gain of $32 million, net of income tax, related to the sale of SSRM during the year ended December 31, 2006. This increase was partially offset by gains during the year ended December 31, 2005 including $1,193 million, net of income tax, on the sales of the One Madison Avenue and 200 Park Avenue properties in Manhattan, New York, as well as gains on the sales of SSRM and MetLife Indonesia of $177 million and $10 million, respectively, both net of income tax. In addition, there was lower net investment income and net investment gains from discontinued operations related to real estate properties sold or held-for-sale during the year ended December 31, 2006 compared to the year ended December 31, 2005. Dividends on the Holding Company’s Preferred Shares issued in connection with financing the acquisition of Travelers increased by $71 million, to $134 million for the year ended December 31, 2006, from $63 million for the comparable 2005 period, as the preferred stock was issued in June 2005. 22 MetLife, Inc.
  • 27.
    Institutional The following tablepresents consolidated financial information for the Institutional segment for the years indicated: 2007 2006 2005 Years Ended December 31, (In millions) Revenues Premiums . . . . . . . . . . . . . . . . . . . . . . . . . . . . . . . . . . . . . . . . . . . . . . . . . . . $12,392 $11,867 $11,387 Universal life and investment-type product policy fees . . . . . . . . . . . . . . . . . . . . . . 803 775 772 Net investment income . . . . . . . . . . . . . . . . . . . . . . . . . . . . . . . . . . . . . . . . . . 8,179 7,265 5,942 Other revenues . . . . . . . . . . . . . . . . . . . . . . . . . . . . . . . . . . . . . . . . . . . . . . . 726 685 653 Net investment gains (losses) . . . . . . . . . . . . . . . . . . . . . . . . . . . . . . . . . . . . . . (580) (631) (10) Total revenues . . . . . . . . . . . . . . . . . . . . . . . . . . . . . . . . . . . . . . . . . . . . . . 21,520 19,961 18,744 Expenses Policyholder benefits and claims . . . . . . . . . . . . . . . . . . . . . . . . . . . . . . . . . . . . 13,806 13,367 12,776 Interest credited to policyholder account balances . . . . . . . . . . . . . . . . . . . . . . . . 3,094 2,593 1,652 Policyholder dividends . . . . . . . . . . . . . . . . . . . . . . . . . . . . . . . . . . . . . . . . . . — — 1 Other expenses . . . . . . . . . . . . . . . . . . . . . . . . . . . . . . . . . . . . . . . . . . . . . . . 2,438 2,314 2,229 Total expenses . . . . . . . . . . . . . . . . . . . . . . . . . . . . . . . . . . . . . . . . . . . . . . 19,338 18,274 16,658 Income from continuing operations before provision for income tax . . . . . . . . . . . . . . 2,182 1,687 2,086 Provision for income tax . . . . . . . . . . . . . . . . . . . . . . . . . . . . . . . . . . . . . . . . . 743 562 698 Income from continuing operations . . . . . . . . . . . . . . . . . . . . . . . . . . . . . . . . . . 1,439 1,125 1,388 Income from discontinued operations, net of income tax . . . . . . . . . . . . . . . . . . . . 10 42 174 Net income . . . . . . . . . . . . . . . . . . . . . . . . . . . . . . . . . . . . . . . . . . . . . . . . $ 1,449 $ 1,167 $ 1,562 Year ended December 31, 2007 compared with the year ended December 31, 2006 — Institutional Income from Continuing Operations Income from continuing operations increased $314 million, or 28%, to $1,439 million for the year ended December 31, 2007 from $1,125 million for the comparable 2006 period. Included in this increase are higher earnings of $33 million, net of income tax, from lower net investment losses. In addition, higher earnings of $11 million, net of income tax, resulted from an increase in policyholder benefits and claims related to net investment gains (losses). Excluding the impact of net investment gains (losses), income from continuing operations increased by $270 million, net of income tax, compared to the prior year. Interest margins increased $229 million, net of income tax, compared to the prior year. Management attributes this increase to a $146 million increase in retirement & savings, a $46 million increase in group life and a $37 million increase in non-medical health and other, respectively, all net of income tax. Interest margin is the difference between interest earned and interest credited to policyholder account balances. Interest earned approximates net investment income on investable assets attributed to the segment with minor adjustments related to the consolidation of certain separate accounts and other minor non-policyholder elements. Interest credited is the amount attributed to insurance products, recorded in policyholder benefits and claims, and the amount credited to policyholder account balances for investment-type products, recorded in interest credited to policyholder account balances. Interest credited on insurance products reflects the current year impact of the interest rate assumptions established at issuance or acquisition. Interest credited to policyholder account balances is subject to contractual terms, including some minimum guarantees. This tends to move gradually over time to reflect market interest rate movements, and may reflect actions by management to respond to competitive pressures and, therefore, generally does not introduce volatility in expense. An increase in underwriting results of $89 million, net of income tax, compared to the prior year, contributed to the increase in income from continuing operations. Management attributes this increase primarily to the non-medical health & other, group life and retirement & savings businesses with increases of $65 million, $16 million and $8 million, all net of income tax, respectively. Underwriting results are generally the difference between the portion of premium and fee income intended to cover mortality, morbidity, or other insurance costs less claims incurred, and the change in insurance-related liabilities. Underwriting results are significantly influenced by mortality, morbidity, or other insurance-related experience trends, as well as the reinsurance activity related to certain blocks of business. Consequently, results can fluctuate from period to period. Partially offsetting this increase in income from continuing operations were higher expenses related to an increase in non-deferrable volume-related expenses and corporate support expenses of $72 million, net of income tax, as well as an increase in DAC amortization of $44 million, net of income tax, primarily due to a $40 million, net of income tax, charge due to the ongoing impact on DAC and VOBA amortization resulting from the implementation of SOP 05-1 in the current year. This increase in expense was partially offset by the impact of certain revisions in both years for a net decrease of $34 million, net of income tax. The remaining increase in operating expenses was more than offset by the remaining increase in premiums, fees, and other revenues. Revenues Total revenues, excluding net investment gains (losses), increased by $1,508 million, or 7%, to $22,100 million for the year ended December 31, 2007 from $20,592 million for the comparable 2006 period. 23MetLife, Inc.
  • 28.
    Net investment incomeincreased by $914 million. Management attributes $742 million of this increase to growth in the average asset base primarily within mortgage loans on real estate, fixed maturity securities, real estate joint ventures, other limited partnership interests, and equity securities, driven by continued business growth, particularly growth in the funding agreements and global GIC businesses. Additionally, management attributes $172 million of this increase in net investment income to an increase in yields, primarily due to higher returns on fixed maturity securities, improved securities lending results, other limited partnership interests, and equity securities, partially offset by a decline in yields on real estate and real estate joint ventures and mortgage loans. The increase of $594 million in premiums, fees and other revenues was largely due to increases in the non-medical health & other business of $483 million, primarily due to growth in the dental, disability, AD&D and IDI businesses of $478 million. Partially offsetting these increases in the non-medical health & other business is a decline in the LTC business of $7 million, which includes a $66 million decrease resulting from a shift to deposit liability-type contracts in the current year. Excluding this shift, LTC premiums would have increased due to growth in the business. Group life increased $345 million, which management primarily attributes to a $262 million increase in term life, primarily due to growth in the business from new sales and an increase in reinsurance assumed, partially offset by the impact of an increase in experience rated refunds. In addition, corporate-owned life insurance and life insurance sold to postretirement benefit plans increased by $65 million and $30 million, respectively. The increase in corporate-owned life insurance is largely attributable to fees earned on a large sale in the current year. These increases in group life’s premiums, fees and other revenues were partially offset by a decrease of $5 million in the universal life insurance products. Partially offsetting the increase in premiums, fees and other revenues was a decline in retirement & savings’ premiums, fees and other revenues of $234 million, primarily from declines of $158 million and $79 million in structured settlement and pension closeout premiums, respectively, partially offset by an increase of $3 million across several products. The declines in the structured settlement and pension closeout businesses are predominantly due to the impact of lower sales in the current year. Premiums, fees and other revenues from retirement & savings products are significantly influenced by large transactions and, as a result, can fluctuate from period to period. Expenses Total expenses increased by $1,064 million, or 6%, to $19,338 million for the year ended December 31, 2007 from $18,274 million for the comparable 2006 period. The increase in expenses was attributable to higher interest credited to policyholder account balances of $501 million, higher policyholder benefits and claims of $439 million and an increase in operating expenses of $124 million. Management attributes the increase of $501 million in interest credited to policyholder account balances to a $352 million increase solely from growth in the average policyholder account balances, primarily resulting from growth in global GICs and funding agreements within the retirement & savings business and a $149 million increase from a rise in average crediting rates, largely due to the global GIC program, coupled with a rise in short-term interest rates in the current year. The increase in policyholder benefits and claims of $439 million included a $16 million decrease related to net investment gains (losses). Excluding the decrease related to net investment gains (losses), policyholder benefits and claims increased by $455 million. Non- medical health & other’s policyholder benefits and claims increased by $385 million. This increase was largely due to a $371 million increase in the dental, disability, IDI and AD&D businesses, resulting from the aforementioned growth in business. This increase was partially offset by favorable claim experience in the dental business and favorable morbidity experience in the disability, IDI and AD&D businesses. This increase included charges related to certain refinements of $14 million in the current year in LTD and the impact of a $22 million disability liability reduction in the prior year, which contributed to the increase. An increase in LTC of $14 million is largely attributable to business growth and an increase in interest credited, partially offset by the aforementioned $66 million shift to deposit liability-type contracts and the impact of more favorable claim experience in the current year. Group life’s policyholder benefits and claims increased by $264 million due mostly to an increase in the term life business of $245 million, which included the impact of less favorable mortality in the term life product, partially offset by the net impact of favorable liability refinements of $12 million in the current year. An increase of $29 million in life insurance sold to postretirement plans and $25 million for other group life products, including corporate- owned life insurance, also contributed to the increase in policyholder benefits and claims for group life. The increases in term life and life insurance sold to postretirement benefit plans are commensurate with the aforementioned premiums increases. These increases were partially offset by a decline in universal group life products of $36 million, primarily due to favorable claim experience. Retirement & savings’ policyholder benefits decreased by $194 million, which was largely due to decreases in the pension closeout and structured settlement businesses of $98 million and $97 million, respectively. The decrease in pension closeouts was primarily due to the aforementioned decrease in premiums and a decrease in interest credited. The decline in structured settlements was primarily a result of the aforemen- tioned decline in premiums, partially offset by an increase in interest credited and less favorable mortality experience in the current year. In addition, this decrease included the net impact of favorable liability refinements in the current year, which contributed a decrease of $20 million, and the net impact of favorable liability refinements in the prior year of $57 million, largely related to business associated with the acquisition of Travelers, principally in the structured settlement, pension closeout and general account businesses. Higher other expenses of $124 million included an increase in non-deferrable volume-related expenses and corporate support expenses of $108 million. Non-deferrable volume-related expenses included those expenses associated with direct departmental spending, information technology, commissions and premium taxes. Corporate support expenses included advertising, corporate over- head and consulting fees. The increase in other expenses was also attributable to higher DAC amortization of $68 million, primarily due to a $61 million charge as a result of the ongoing impact of DAC and VOBA amortization resulting from the implementation of SOP 05-1 in the current year. In addition, a charge of $14 million related to the reimbursement of certain dental claims and a $15 million charge related to the establishment of a contingent legal liability in the current year contributed to the increase in other expenses. The impact of certain revisions in both years also contributed to a net increase in other expenses of $2 million. These increases were partially offset by a $13 million benefit related to a reduction of an allowance for doubtful accounts in the current year. Additionally, the prior year included the impact of a $22 million charge for non-deferrable LTC commissions expense, a charge of $24 million associated with costs related to the sale of certain small market recordkeeping businesses and $24 million related to a regulatory settlement, which reduced other expenses in the current year. 24 MetLife, Inc.
  • 29.
    Year ended December31, 2006 compared with the year ended December 31, 2005 — Institutional Income from Continuing Operations Income from continuing operations decreased $263 million, or 19%, to $1,125 million for the year ended December 31, 2006 from $1,388 million for the comparable 2005 period. The acquisition of Travelers contributed $56 million during the first six months of 2006 to income from continuing operations, which included a decline of $104 million, net of income tax, of net investment gains (losses). Excluding the impact of Travelers, income from continuing operations decreased $319 million, or 23%, from the comparable 2005 period. Included in this decrease was a decline of $300 million, net of income tax, in net investment gains (losses), as well as a decline of $18 million, net of income tax, resulting from an increase in policyholder benefits and claims related to net investment gains (losses). Excluding the impact of Travelers and the decline in net investment gains (losses), income from continuing operations was flat when compared to the prior year period. A decrease in interest margins of $84 million, net of income tax, compared to the prior year period contributed to the decrease in income from continuing operations. Management attributes this decrease primarily to the group life and retirement & savings businesses of $60 million and $51 million, both net of income tax, respectively. Partially offsetting these decreases was an increase of $27 million, net of income tax, in the non-medical health & other business. Interest margin is the difference between interest earned and interest credited to policyholder account balances. Interest earned approximates net investment income on investable assets attributed to the segment with minor adjustments related to the consolidation of certain separate accounts and other minor non-policyholder elements. Interest credited is the amount attributed to insurance products, recorded in policyholder benefits and claims, and the amount credited to policyholder account balances for investment-type products, recorded in interest credited to policyholder account balances. Interest credited on insurance products reflects the current period impact of the interest rate assumptions established at issuance or acquisition. Interest credited to policyholder account balances is subject to contractual terms, including some minimum guarantees. This tends to move gradually over time to reflect market interest rate movements, may reflect actions by management to respond to competitive pressures and therefore, generally does not introduce volatility in expense. The year over year variance in income from continuing operations included charges recorded in other expenses of $17 million, net of income tax, associated with costs related to the sale of certain small market recordkeeping businesses, $16 million, net of income tax, due to costs associated with a previously announced regulatory settlement and $15 million, net of income tax, associated with non-deferrable LTC commission expense. Partially offsetting these increases in operating expenses were benefits due to prior year charges of $28 million, net of income tax, as a result of the impact of Travelers’ integration costs and $14 million, net of income tax, related to an adjustment of DAC for certain LTC products. Partially offsetting these decreases in income from continuing operations was an increase in underwriting results of $97 million, net of income tax, compared to the prior year period. This increase was primarily due to favorable results of $48 million, $38 million and $11 million, all net of income tax, in the group life, the non-medical health & other businesses and the retirement & savings businesses, respectively. The results in group life were primarily due to favorable mortality results, predominantly in the term life business, which included a benefit from reserve refinements in the current year. Non-medical health & other’s favorable underwriting results were primarily due to improvements in the IDI and dental businesses. The IDI results included certain reserve refinements in the prior year. Partially offsetting these increases was a decrease in the AD&D and disability businesses. Disability’s results include the benefit of prior and current year reserve refinements. Retirement & savings’ underwriting results were favorable with mixed underwriting across several products. Underwriting results are generally the difference between the portion of premium and fee income intended to cover mortality, morbidity, or other insurance costs less claims incurred, and the change in insurance-related liabilities. Underwriting results are significantly influenced by mortality, morbidity, or other insurance-related experience trends and the reinsurance activity related to certain blocks of business. The remaining increase in operating expenses more than offset the remaining increase in premiums, fees and other revenues. Revenues Total revenues, excluding net investment gains (losses), increased by $1,838 million, or 10%, to $20,592 million for the year ended December 31, 2006 from $18,754 million for the comparable 2005 period. The acquisition of Travelers contributed $797 million during the first six months of 2006 to the year over year increase. Excluding the impact of the Travelers acquisition, such revenues increased by $1,041 million, or 6%, from the comparable 2005 period. This increase was comprised of higher net investment income of $583 million and growth in premiums, fees and other revenues of $458 million. Net investment income increased by $583 million of which management attributes $463 million to growth in the average asset base driven by business growth throughout 2005 and 2006, particularly in the GIC and structured settlement businesses and $120 million to an increase in yields. The increase in yields was primarily attributable to higher yields on fixed maturity securities, an increase in short-term rates and higher returns on joint ventures. These increases were partially offset by a decline in securities lending results and commercial mortgage prepayment fees. The increase of $458 million in premiums, fees and other revenues was largely due to increases in the non-medical health & other business of $408 million, primarily due to growth in the dental, disability and AD&D products of $255 million. In addition, continued growth in the LTC and IDI businesses contributed $117 million and $25 million, respectively. Group life increased by $296 million, which management primarily attributes to the impact of sales and favorable persistency largely in term life business, which includes a significant increase in premiums from two large customers. Partially offsetting these increases was a decline in retirement & savings’ premiums, fees and other revenues of $246 million, resulting primarily from a decline of $320 million in structured settlements, predominantly due to the impact of lower sales. This decline was partially offset by a $83 million increase in MTF premiums. Premiums, fees and other revenues from retirement & savings products are significantly influenced by large transactions and, as a result, can fluctuate from period to period. Expenses Total expenses increased by $1,616 million, or 10%, to $18,274 million for the year ended December 31, 2006 from $16,658 million for the comparable 2005 period. The acquisition of Travelers contributed $551 million during the first six months of 2006 to the year over year 25MetLife, Inc.
  • 30.
    increase. Excluding theimpact of the Travelers acquisition, total expenses increased $1,065 million, or 6%, from the comparable 2005 period. The increase in expenses was attributable to higher interest credited to policyholder account balances of $621 million, policyholder benefits and claims of $366 million and operating expenses of $79 million. Management attributes the increase of $621 million in interest credited to policyholder account balances to $433 million from an increase in average crediting rates, which was largely due to the impact of higher short-term rates in the current year period and $188 million solely from growth in the average policyholder account balances, primarily resulting from GICs within the retirement & savings business. The increases in policyholder benefits and claims of $366 million included a $27 million increase related to net investment gains (losses). Excluding the increase related to net investment gains (losses), policyholder benefits and claims increased by $339 million. Non- medical health & other’s policyholder benefits and claims increased by $306 million, predominantly due to the aforementioned growth in business, as well as unfavorable morbidity in disability and unfavorable claim experience in AD&D. Partially offsetting these increases was favorable claim and morbidity experience in IDI, as well as the impact of an establishment of a $25 million liability for future losses in the prior year. In addition, favorable claim experience in the current year reduced dental policyholder benefits and claims. Additionally, disability business included a $22 million benefit which resulted from reserve refinements in the current year. The year over year variance in disability also includes the impact of an $18 million loss related to Hurricane Katrina in the prior year. Group life’s policyholder benefits and claims increased by $238 million, largely due to the aforementioned growth in the business, partially offset by favorable underwriting results, particularly in the term life business. Term life included a benefit of $16 million due to reserve refinements in the current year. Partially offsetting the increase was a retirement & savings’ policyholder benefits and claims decrease of $205 million, predominantly due to the aforementioned decrease in revenues, partially offset by higher FAS 60 interest credits recorded in policyholder benefits and claims due to growth in structured settlements and MTF. The increase in other expenses of $79 million was primarily due to an increase in the current year of $60 million in non-deferrable volume related expenses and corporate support expenses. Non-deferrable volume related expenses include those expenses associated with information technology, direct departmental spending and commission expenses. Corporate support expenses include advertising, corporate overhead and consulting fees. Also contributing to the increase was $26 million associated with costs related to the sale of certain small market recordkeeping businesses, $23 million of non-deferrable LTC commission expense, $24 million related to costs associated with a previously announced regulatory settlement and $11 million related to stock-based compensation. Partially offsetting these increases were benefits due to prior year charges of $43 million in Travelers-related integration costs, principally incentive accruals and $22 million related to an adjustment of DAC for certain LTC products. 26 MetLife, Inc.
  • 31.
    Individual The following tablepresents consolidated financial information for the Individual segment for the years indicated: 2007 2006 2005 Years Ended December 31, (In millions) Revenues Premiums . . . . . . . . . . . . . . . . . . . . . . . . . . . . . . . . . . . . . . . . . . . . . . . . . . . $ 4,496 $ 4,516 $ 4,485 Universal life and investment-type product policy fees . . . . . . . . . . . . . . . . . . . . . . 3,513 3,201 2,476 Net investment income . . . . . . . . . . . . . . . . . . . . . . . . . . . . . . . . . . . . . . . . . . 7,052 6,912 6,534 Other revenues . . . . . . . . . . . . . . . . . . . . . . . . . . . . . . . . . . . . . . . . . . . . . . . 599 527 477 Net investment gains (losses) . . . . . . . . . . . . . . . . . . . . . . . . . . . . . . . . . . . . . . (99) (598) (50) Total revenues . . . . . . . . . . . . . . . . . . . . . . . . . . . . . . . . . . . . . . . . . . . . . . 15,561 14,558 13,922 Expenses Policyholder benefits and claims . . . . . . . . . . . . . . . . . . . . . . . . . . . . . . . . . . . . 5,721 5,409 5,417 Interest credited to policyholder account balances . . . . . . . . . . . . . . . . . . . . . . . . 2,030 2,035 1,775 Policyholder dividends . . . . . . . . . . . . . . . . . . . . . . . . . . . . . . . . . . . . . . . . . . 1,718 1,697 1,670 Other expenses . . . . . . . . . . . . . . . . . . . . . . . . . . . . . . . . . . . . . . . . . . . . . . . 4,031 3,519 3,264 Total expenses . . . . . . . . . . . . . . . . . . . . . . . . . . . . . . . . . . . . . . . . . . . . . . 13,500 12,660 12,126 Income from continuing operations before provision for income tax . . . . . . . . . . . . . . 2,061 1,898 1,796 Provision for income tax . . . . . . . . . . . . . . . . . . . . . . . . . . . . . . . . . . . . . . . . . 705 652 594 Income from continuing operations . . . . . . . . . . . . . . . . . . . . . . . . . . . . . . . . . . 1,356 1,246 1,202 Income (loss) from discontinued operations, net of income tax. . . . . . . . . . . . . . . . . 1 18 296 Net income. . . . . . . . . . . . . . . . . . . . . . . . . . . . . . . . . . . . . . . . . . . . . . . . . . $ 1,357 $ 1,264 $ 1,498 Year ended December 31, 2007 compared with the year ended December 31, 2006 — Individual Income from Continuing Operations Income from continuing operations increased by $110 million, or 9%, to $1,356 million for the year ended December 31, 2007 from $1,246 million for the comparable 2006 period. Included in this increase was a decrease in net investment losses of $324 million, net of income tax. Excluding the impact of net investment gains (losses), income from continuing operations decreased by $214 million from the comparable 2006 period. The decrease in income from continuing operations for the year was driven by the following items: • Higher DAC amortization of $204 million, net of income tax, primarily resulting from business growth, lower net investment losses in the current year and revisions to management’s assumptions used to determine estimated gross profits and margins. • Unfavorable underwriting results in life products of $134 million, net of income tax. Underwriting results are generally the difference between the portion of premium and fee income intended to cover mortality, morbidity or other insurance costs less claims incurred and the change in insurance-related liabilities. Underwriting results are significantly influenced by mortality, morbidity, or other insurance-related experience trends, as well as the reinsurance activity related to certain blocks of business. Consequently, results can fluctuate from period to period. • Higher expenses of $129 million, net of income tax. Higher general expenses, the impact of revisions to certain liabilities in both periods, and the write-off of a receivable from one of the Company’s joint venture partners contributed to the increase in other expenses. • An increase in the closed block-related policyholder dividend obligation of $75 million, net of income tax, which was driven by net investment gains. • Higher annuity benefits of $24 million, net of income tax, primarily due to higher amortization of deferred costs, partially offset by lower costs of guaranteed annuity benefit riders and related hedging. • An increase in policyholder dividends of $14 million, net of income tax, due to growth in the business. • An increase in interest credited to policyholder account balances of $13 million, net of income tax, due primarily to lower amortization of the excess interest reserves on acquired annuity and universal life blocks of business. These aforementioned decreases in income from continuing operations were partially offset by the following items: • Higher fee income from separate account products of $271 million, net of income tax, primarily related to fees being earned on a higher average account balance resulting from a combination of growth in the business and overall market performance. • Higher net investment income on blocks of business not driven by interest margins of $85 million, net of income tax, due to an increase in yields and growth in the average asset base. • An increase in interest margins of $18 million, net of income tax. Interest margins relate primarily to the general account portion of investment-type products. Management attributed a $1 million decrease to the deferred annuity business offset by a $19 million increase to other investment-type products, both net of income tax. Interest margin is the difference between interest earned and interest credited to policyholder account balances related to the general account on these businesses. Interest earned approximates net investment income on invested assets attributed to these businesses with net adjustments for other non-policyholder elements. Interest credited approximates the amount recorded in interest credited to policyholder account balances. Interest credited to policyholder account balances is subject to contractual terms, including some minimum guarantees, and may reflect actions by management to respond to competitive pressures. Interest credited to policyholder account balances tends to move gradually over 27MetLife, Inc.
  • 32.
    time to reflectmarket interest rate movements, subject to any minimum guarantees and, therefore, generally does not introduce volatility in expense. The change in effective tax rates between periods accounts for the remainder of the decrease in income from continuing operations. Revenues Total revenues, excluding net investment gains (losses), increased by $504 million, or 3%, to $15,660 million for the year ended December 31, 2007 from $15,156 million for the comparable 2006 period. Premiums decreased by $20 million due to a decrease in immediate annuity premiums of $27 million, and an $89 million decline in premiums associated with the Company’s closed block of business, in line with expectations. These decreases were partially offset by growth in premiums from other life products of $96 million, primarily driven by increased sales of term life business. Universal life and investment-type product policy fees combined with other revenues increased by $384 million due to a combination of growth in the business and improved overall market performance, as well as revisions to management’s assumptions used to determine estimated gross profits and margins. Policy fees from variable life and annuity and investment-type products are typically calculated as a percentage of the average assets in policyholder accounts. The value of these assets can fluctuate depending on equity performance. Net investment income increased by $140 million. Net investment income from the general account portion of investment-type products and other businesses increased by $45 million and $95 million, respectively. Management attributes $5 million of this increase to an increase in yields, primarily due to higher returns on other limited partnership interests. Additionally, management attributes $135 million to growth in the average asset base across various investment types. Expenses Total expenses increased by $840 million, or 7%, to $13,500 million for the year ended December 31, 2007 from $12,660 million for the comparable 2006 period. Policyholder benefits and claims increased by $312 million primarily due to an increase in the closed block-related policyholder dividend obligation of $115 million which was primarily driven by net investment gains. Unfavorable mortality in the life products, as well as revisions to policyholder benefits in both periods, contributed $180 million to this increase. Included in this increase was $72 million of unfavorable mortality in the closed block and a prior year net increase of $15 million in the excess mortality liability on specific blocks of life insurance policies. Higher amortization of sales inducements resulting from business growth and revisions to management’s assumptions used to determine estimated gross profits and margins, partially offset by lower costs of guaranteed annuity benefit riders and related hedging increased annuity benefits by $37 million. Partially offsetting these increases, policyholder benefits and claims decreased by $20 million commensurate with the decrease in premiums discussed above. Interest credited to policyholder account balances decreased by $5 million. Interest credited on the general account portion of investment-type products and other businesses decreased by $15 million and $10 million, respectively. Of the $15 million decrease on the general account portion of investment-type products, management attributed $67 million to higher crediting rates, more than offset by $82 million due to lower average policyholder account balances. Partially offsetting these decreases was lower amortization of the excess interest reserves on acquired annuity and universal life blocks of business of $20 million primarily driven by lower lapses in the current year. Policyholder dividends increased by $21 million due to growth in the business. Higher other expenses of $512 million include higher DAC amortization of $314 million resulting from business growth, lower net investment losses and revisions to management’s assumptions used to determine estimated gross profits and margins. The remaining increase in other expenses of $198 million was comprised of $167 million associated with business growth, information technology and other general expenses, $7 million due to the impact of revisions to certain liabilities including pension and postretirement liabilities and policyholder liabilities in the prior year, and $24 million associated with the write-off of a receivable from one of the Company’s joint venture partners in the current year. Year ended December 31, 2006 compared with the year ended December 31, 2005 — Individual Income from Continuing Operations Income from continuing operations increased by $44 million, or 4%, to $1,246 million for the year ended December 31, 2006 from $1,202 million for the comparable 2005 period. The acquisition of Travelers contributed $112 million during the first six months of 2006 to income from continuing operations, which included $88 million, net of income tax, of net investment losses. Included in the Travelers results was a $21 million increase to the excess mortality liability on specific blocks of life insurance policies. Excluding the impact of Travelers, income from continuing operations decreased by $68 million, or 6%, to $1,134 million for the year ended December 31, 2006 from $1,202 million for the comparable 2005 period. Included in this decrease were net investment losses of $270 million, net of income tax. Excluding the impact of net investment gains (losses) and the acquisition of Travelers for the first six months of 2006, income from continuing operations increased by $202 million from the comparable 2005 period. The increase in income from continuing operations for the year was driven by the following items: • Higher fee income from separate account products of $151 million, net of income tax, primarily related to fees being earned on a higher average account balance resulting from a combination of growth in the business and overall market performance. • Lower DAC amortization of $113 million, net of income tax, resulting from investment losses and revisions to management’s assumptions used to determine estimated gross profits and margins. • A decrease in the closed block-related policyholder dividend obligation of $68 million, net of income tax. • Favorable underwriting results in life products of $61 million, net of income tax. Underwriting results are generally the difference between the portion of premium and fee income intended to cover mortality, morbidity or other insurance costs less claims incurred and the change in insurance-related liabilities. Underwriting results are significantly influenced by mortality, morbidity, or other insurance-related experience trends, as well as the reinsurance activity related to certain blocks of business. Consequently, results can fluctuate from period to period. • Higher net investment income on blocks of business that were not driven by interest margins of $16 million, net of income tax. 28 MetLife, Inc.
  • 33.
    These aforementioned increasesin income from continuing operations were partially offset by the following items: • A decline in interest margins of $58 million, net of income tax. Interest margins relate primarily to the general account portion of investment-type products. Management attributed $40 million of this decrease to the deferred annuity business and the remaining $18 million to other investment-type products. Interest margin is the difference between interest earned and interest credited to policyholder account balances related to the general account on these businesses. Interest earned approximates net investment income on invested assets attributed to these businesses with net adjustments for other non-policyholder elements. Interest credited approximates the amount recorded in interest credited to policyholder account balances. Interest credited to policyholder account balances is subject to contractual terms, including some minimum guarantees, and may reflect actions by management to respond to competitive pressures. Interest credited to policyholder account balances tends to move gradually over time to reflect market interest rate movements, subject to any minimum guarantees, and therefore, generally does not introduce volatility in expense. • Higher expenses of $52 million, net of income tax. Higher general spending in the current period was partially offset by higher corporate incentives in the prior year. • Higher annuity benefits of $30 million, net of income tax, primarily due to higher costs of the guaranteed annuity benefit riders and the related hedging, and revisions to future policyholder benefits. • An increase in interest credited to policyholder account balances of $26 million, net of income tax, due primarily to lower amortization of the excess interest reserves on acquired annuity and universal life blocks of business. • An increase in policyholder dividends of $18 million, net of income tax, due to growth in the business. The change in effective tax rates between periods accounts for the remainder of the increase in income from continuing operations. Revenues Total revenues, excluding net investment gains (losses), increased by $1,184 million, or 8%, to $15,156 million for the year ended December 31, 2006 from $13,972 million for the comparable 2005 period. The acquisition of Travelers contributed $1,009 million during the first six months of 2006 to the period over period increase. Excluding the impact of Travelers, such revenues increased by $175 million, or 1%, from the comparable 2005 period. Premiums decreased by $38 million due to a decrease in immediate annuity premiums of $22 million, and a $103 million expected decline in premiums associated with the Company’s closed block of business, partially offset by growth in premiums from other life products of $87 million. Higher universal life and investment-type product policy fees combined with other revenues of $267 million resulted from a combination of growth in the business and improved overall market performance. Policy fees from variable life and annuity and investment-type products are typically calculated as a percentage of the average assets in policyholder accounts. The value of these assets can fluctuate depending on equity performance. Net investment income decreased by $54 million. Net investment income from the general account portion of investment-type products decreased by $56 million which was partially offset by an increase of $2 million in other businesses. Management attributed a decrease of $146 million partially to lower yields in the current year primarily resulting from lower income from securities lending activities, mortgage and bond prepayment fee income, partially offset by higher corporate joint venture income. In addition, management attributed an increase of $92 million from growth in the average asset base primarily from equity securities and mortgage loans. Expenses Total expenses increased by $534 million, or 4%, to $12,660 million for the year ended December 31, 2006 from $12,126 million for the comparable 2005 period. The acquisition of Travelers contributed $706 million during the first six months of 2006 to the period over period increase. Included in the Travelers results was a $33 million increase to the excess mortality liability on specific blocks of life insurance policies. Excluding the impact of Travelers, total expenses decreased by $172 million, or 1%, from the comparable 2005 period. Policyholder benefits and claims decreased by $156 million primarily due to a reduction in the closed block-related policyholder dividend obligation of $105 million driven by higher net investment losses. A reduction of $49 million related to the excess mortality liability on a specific block of life insurance policies that lapsed or otherwise changed also contributed to the decrease. In addition, policyholder benefits and claims decreased by $38 million commensurate with the decrease in premiums discussed above. Unfavorable mortality in the closed block of $99 million was more than offset by favorable mortality in the life products of $109 million, contributing $10 million to the decrease in policyholder benefits and claims. Partially offsetting these decreases in policyholder benefits and claims was an increase in annuity benefits of $46 million primarily due to higher costs of the guaranteed annuity benefit riders and the related hedging, and revisions to future policyholder benefits. Partially offsetting these decreases, interest credited to policyholder account balances increased by $51 million. Lower amortization of the excess interest reserves on acquired annuity and universal life blocks of business resulting from higher lapses in the prior period, as well as an update of assumptions in the current period contributed $40 million to the increase. In addition, interest credited on the general account portion of investment-type products increased $16 million, while other businesses decreased by $5 million. Of the $16 million increase on the general account portion of investment-type products, management attributed $37 million to higher crediting rates, partially offset by $21 million due to lower average policyholder account balances. Partially offsetting these decreases in total expenses was a $27 million increase in policyholder dividends associated with growth in the business. Lower other expenses of $94 million include lower DAC amortization of $174 million resulting from changes in investment gains and losses of $154 million and $20 million related to management’s update of assumptions used to determine estimated gross margins. The remaining increase in other expenses was $80 million. The current year included higher general spending of $94 million primarily due to information technology and travel expenses while the prior year had higher corporate incentives of $39 million related to the Travelers integration. In addition, the impact of revisions to certain expenses, premium tax, policyholder liabilities and pension and postretirement liabilities in both periods was a net increase to expenses of $25 million in the current period. 29MetLife, Inc.
  • 34.
    Auto & Home Thefollowing table presents consolidated financial information for the Auto & Home segment for the years indicated: 2007 2006 2005 Years Ended December 31, (In millions) Revenues Premiums . . . . . . . . . . . . . . . . . . . . . . . . . . . . . . . . . . . . . . . . . . . . . . . . . . . . . $2,966 $2,924 $2,911 Net investment income . . . . . . . . . . . . . . . . . . . . . . . . . . . . . . . . . . . . . . . . . . . . . 196 177 181 Other revenues. . . . . . . . . . . . . . . . . . . . . . . . . . . . . . . . . . . . . . . . . . . . . . . . . . 45 22 33 Net investment gains (losses) . . . . . . . . . . . . . . . . . . . . . . . . . . . . . . . . . . . . . . . . 16 4 (12) Total revenues . . . . . . . . . . . . . . . . . . . . . . . . . . . . . . . . . . . . . . . . . . . . . . . . . 3,223 3,127 3,113 Expenses Policyholder benefits and claims. . . . . . . . . . . . . . . . . . . . . . . . . . . . . . . . . . . . . . . 1,807 1,717 1,994 Policyholder dividends . . . . . . . . . . . . . . . . . . . . . . . . . . . . . . . . . . . . . . . . . . . . . 4 6 3 Other expenses . . . . . . . . . . . . . . . . . . . . . . . . . . . . . . . . . . . . . . . . . . . . . . . . . 830 845 828 Total expenses . . . . . . . . . . . . . . . . . . . . . . . . . . . . . . . . . . . . . . . . . . . . . . . . 2,641 2,568 2,825 Income before provision for income tax . . . . . . . . . . . . . . . . . . . . . . . . . . . . . . . . . . 582 559 288 Provision for income tax . . . . . . . . . . . . . . . . . . . . . . . . . . . . . . . . . . . . . . . . . . . . 146 143 64 Net income . . . . . . . . . . . . . . . . . . . . . . . . . . . . . . . . . . . . . . . . . . . . . . . . . . . . $ 436 $ 416 $ 224 Year ended December 31, 2007 compared with the year ended December 31, 2006 — Auto & Home Net Income Net income increased by $20 million, or 5%, to $436 million for the year ended December 31, 2007 from $416 million for the comparable 2006 period. The increase in net income was primarily attributable to an increase in premiums of $28 million, net of income tax. The increase in premiums was principally due to an increase of $38 million, net of income tax, related to increased exposures, an increase of $4 million, net of income tax, from various voluntary and involuntary programs and an increase of $4 million, net of income tax, resulting from the change in estimate on auto rate refunds due to a regulatory examination. Offsetting these increases was a $14 million, net of income tax, decrease related to a reduction in average earned premium per policy and an increase in catastrophe reinsurance costs of $4 million, net of income tax. In addition, net investment income increased by $12 million, net of income tax, due primarily to a realignment of economic capital and an increase in net investment income from higher yields, somewhat offset by a lower asset base. Net investment gains (losses) increased by $11 million, net of income tax, for the year ended December 31, 2007 as compared to the prior year. In addition, other revenues increased by $16 million, net of income tax, due primarily to slower than anticipated claims payments in 2006 resulting in slower recognition of deferred income in 2006 related to a reinsurance contract as compared to 2007. Negatively impacting net income were additional policyholder benefits and claims of $60 million, net of income tax, primarily due to $39 million, $20 million, and $16 million, all net of income tax, of losses related to higher claim frequencies, higher earned exposures and higher losses due to severity, respectively. In addition, a $13 million increase, net of income tax, in unallocated claims adjusting expenses and an increase of $12 million, net of income tax, from a reduction in favorable development of prior year losses negatively impacted net income. Offsetting these increases was a $41 million, net of income tax, decrease in catastrophe losses, which included favorable development of prior year catastrophe reserves of $10 million, net of income tax. In addition, there was a decrease of $1 million, net of income tax, in policyholder dividends that positively impacted net income. Also favorably impacting net income was a reduction of $10 million, net of income tax, in other expenses related to lower information technology and advertising costs. Revenues Total revenues, excluding net investment gains (losses), increased by $84 million, or 3%, to $3,207 million for the year ended December 31, 2007 from $3,123 million for the comparable 2006 period. Premiums increased by $42 million due principally to a $59 million increase in premiums related to increased exposures, an increase of $5 million from various voluntary and involuntary programs and an increase in premiums of $5 million, resulting from the change in estimate on auto rate refunds due to a regulatory examination. Offsetting these increases was a $21 million decrease related to a reduction in average earned premium per policy and an increase in catastrophe reinsurance costs of $6 million. Net investment income increased by $19 million due to a realignment of economic capital and an increase in net investment income from higher yields, somewhat offset by a lower asset base. In addition, other revenues increased $23 million due primarily to slower than anticipated claims payments resulting in slower recognition of deferred income in 2006 related to a reinsurance contract as compared to 2007. Expenses Total expenses increased by $73 million, or 3%, to $2,641 million for the year ended December 31, 2007 from $2,568 million for the comparable 2006 period. Policyholder benefits and claims increased by $90 million which was primarily due to an increase of $59 million from higher claim frequencies, as a result of a return to normal weather patterns in 2007 compared to the milder weather in 2006 across the majority of the 30 MetLife, Inc.
  • 35.
    country, and a$25 million and $30 million increase in losses related to higher severity and higher earned exposures, respectively. In addition, an increase of $20 million in unallocated loss adjustment expenses, primarily resulting from an increase in claims-related information technology costs, and a $19 million decrease in favorable development of prior year losses, representing $148 million of favorable development for 2007 as compared to $167 million for the 2006 period, increased policyholder benefits and claims. Offsetting these increases in losses was a decrease of $63 million in catastrophe losses, which includes $15 million of favorable loss development from prior year catastrophes. Policyholder dividends decreased by $2 million in 2007 as compared to the prior year. Other expenses decreased by $15 million primarily related to lower information technology and advertising costs, partially offset by minor changes in a variety of expense categories. Underwriting results, excluding catastrophes, in the Auto & Home segment were favorable for the year ended December 31, 2007, although lower than the comparable period of 2006, as the combined ratio, excluding catastrophes, increased to 86.3% from 82.8% for the year ended December 31, 2006. Year ended December 31, 2006 compared with the year ended December 31, 2005 — Auto & Home Net Income Net income increased by $192 million, or 86%, to $416 million for the year ended December 31, 2006 from $224 million for the comparable 2005 period. The increase in net income was primarily attributable to a loss in the third quarter of 2005 from Hurricane Katrina of $124 million, net of income tax, related to losses, loss adjusting expenses and reinstatement and additional reinsurance-related premiums and a loss in the fourth quarter of 2005 related to losses and expenses from Hurricane Wilma of $32 million, net of income tax. Excluding the losses from Hurricanes Katrina and Wilma, net income increased by $36 million for the year ended December 31, 2006 from the comparable 2005 period. Favorable development of prior year loss reserves contributed $72 million, net of income tax, to the increase in net income. In addition, an improvement in non-catastrophe loss experience, primarily due to improved frequencies, contributed $16 million, net of income tax and a reduction in loss adjustment expenses, primarily due to improved claims handling practices, contributed $13 million, net of income tax, to the increase. The increase in net income was offset by higher catastrophe losses in the current year, excluding the impact of Katrina and Wilma, resulting in a decrease to net income of $49 million, net of income tax. Also impacting net income was a decrease in net earned premiums, excluding the impact of Hurricane Katrina, of $19 million, net of income tax, resulting primarily from an increase of $16 million, net of income tax, in catastrophe reinsurance costs and a reduction of $4 million, net of income tax, in involuntary assumed business, offset by an increase in premiums of $1 million, net of income tax, primarily from increased exposures, mostly offset by lower average premium per policy. In addition, other revenues decreased by $7 million, net of income tax, due to slower than anticipated claims payments resulting in slower recognition of deferred income related to a reinsurance contract. Net investment income decreased by $3 million, net of income tax, due to a $12 million decrease in net investment income related to a realignment of economic capital, partially offset by a $9 million increase in income as a result of a slightly higher asset base. Net investment gains (losses) increased $10 million, net of income tax, for the year ended December 31, 2006 compared to the comparable 2005 period. Other expenses increased by $11 million, net of income tax, primarily due to expenditures related to information technology, advertising and compensation costs. The change in effective tax rates between periods accounted for the remainder of the increase in net income. Revenues Total revenues, excluding net investment gains (losses), decreased by $2 million, or less than 1%, to $3,123 million for the year ended December 31, 2006 from $3,125 million for the comparable 2005 period. Premiums increased by $13 million due principally to the existence of a $43 million charge for reinstatement and additional reinsurance premiums in the third quarter of 2005 related to Hurricane Katrina. Premiums decreased by $30 million year over year after giving consideration to this charge. This decrease resulted from $25 million in additional catastrophe reinsurance costs and a decrease of $6 million in involuntary assumed business in 2006, mainly associated with the Massachusetts involuntary market. These changes were partially offset by an increase in premiums of $35 million resulting from increased exposures, offset by a $34 million decrease in premiums from a change in the average earned premium per policy. Net investment income decreased by $4 million primarily due to an $18 million decrease in net investment income related to a realignment of economic capital, mostly offset by a $14 million increase in income as a result of a slightly higher asset base with slightly higher yields. Other revenues decreased by $11 million due to slower than anticipated claims payments resulting in a slower recognition of deferred income related to a reinsurance contract. Expenses Total expenses decreased by $257 million, or 9%, to $2,568 million for the year ended December 31, 2006 from $2,825 million for the comparable 2005 period. Policyholder benefits and claims decreased by $277 million which was primarily due to $196 million in claims and expenses related to Hurricanes Katrina and Wilma incurred in 2005. The remainder of the decrease in policyholder benefits and claims for the year ended December 31, 2006, as compared to the same period in 2005, can be attributed to $111 million in additional favorable development of prior year losses, improvements in claim frequencies of $72 million and a decrease of $20 million in unallocated loss expense due primarily to improved claims handling practices. These decreases in policyholder benefits and claims for the year ended December 31, 2006, compared to the same period in 2005, were partially offset by $32 million of additional losses due to severity, $15 million of additional losses due to exposure growth and a $75 million increase in catastrophe losses, excluding Hurricanes Katrina and Wilma. Other expenses increased by $17 million primarily due to expenditures related to information technology, advertising and compensation costs. Underwriting results, excluding catastrophes, in the Auto & Home segment were favorable for the year ended December 31, 2006, as the combined ratio, excluding catastrophes, decreased to 82.8% from 86.7% for the year ended December 31, 2005. 31MetLife, Inc.
  • 36.
    International The following tablepresents consolidated financial information for the International segment for the years indicated: 2007 2006 2005 Years Ended December 31, (In millions) Revenues Premiums . . . . . . . . . . . . . . . . . . . . . . . . . . . . . . . . . . . . . . . . . . . . . . . . . . . . . $3,096 $2,722 $2,186 Universal life and investment-type product policy fees. . . . . . . . . . . . . . . . . . . . . . . . . 995 804 579 Net investment income . . . . . . . . . . . . . . . . . . . . . . . . . . . . . . . . . . . . . . . . . . . . . 1,248 950 794 Other revenues. . . . . . . . . . . . . . . . . . . . . . . . . . . . . . . . . . . . . . . . . . . . . . . . . . 23 28 20 Net investment gains (losses) . . . . . . . . . . . . . . . . . . . . . . . . . . . . . . . . . . . . . . . . 55 (10) 12 Total revenues . . . . . . . . . . . . . . . . . . . . . . . . . . . . . . . . . . . . . . . . . . . . . . . . . 5,417 4,494 3,591 Expenses Policyholder benefits and claims. . . . . . . . . . . . . . . . . . . . . . . . . . . . . . . . . . . . . . . 2,458 2,411 2,128 Interest credited to policyholder account balances . . . . . . . . . . . . . . . . . . . . . . . . . . . 355 289 240 Policyholder dividends . . . . . . . . . . . . . . . . . . . . . . . . . . . . . . . . . . . . . . . . . . . . . 4 (2) 5 Other expenses . . . . . . . . . . . . . . . . . . . . . . . . . . . . . . . . . . . . . . . . . . . . . . . . . 1,748 1,529 997 Total expenses . . . . . . . . . . . . . . . . . . . . . . . . . . . . . . . . . . . . . . . . . . . . . . . . 4,565 4,227 3,370 Income from continuing operations before provision for income tax . . . . . . . . . . . . . . . . 852 267 221 Provision for income tax . . . . . . . . . . . . . . . . . . . . . . . . . . . . . . . . . . . . . . . . . . . . 208 95 35 Income from continuing operations . . . . . . . . . . . . . . . . . . . . . . . . . . . . . . . . . . . . . 644 172 186 Income (loss) from discontinued operations, net of income tax . . . . . . . . . . . . . . . . . . . (9) 28 6 Net income . . . . . . . . . . . . . . . . . . . . . . . . . . . . . . . . . . . . . . . . . . . . . . . . . . . . $ 635 $ 200 $ 192 Year ended December 31, 2007 compared with the year ended December 31, 2006 — International Income from Continuing Operations Income from continuing operations increased by $472 million, or 274%, to $644 million for the year ended December 31, 2007 from $172 million for the comparable 2006 period. This increase includes the impact of net investment gains of $42 million, net of income tax. Excluding the impact of net investment gains (losses), income from continuing operations increased by $430 million from the comparable 2006 period. Income from continuing operations increased in: • Argentina by $146 million, net of income tax, primarily due to a net reduction of liabilities by $48 million, net of income tax, resulting from pension reform. Additionally, $66 million of a valuation allowance related to a deferred tax asset established in connection with such pension reform liabilities was reduced, resulting in a commensurate increase in income from continuing operations. Under the reform plan, fund administrators are no longer liable for death and disability claims of the plan participants, however administrators retain the obligation for administering certain existing and future participants’ accounts for which they receive no revenue. Also contributing is the favorable impact of reductions in claim liabilities resulting from experience reviews in both the current and prior years, higher premiums primarily due to higher pension contributions attributable to higher participant salaries, higher net investment income resulting from capital contributions in the prior year, and a smaller increase in market indexed policyholder liabilities without a corresponding decrease in net investment income, partially offset by the reduction of cost of insurance fees as a result of the new pension system reform regulation, an increase in retention incentives related to pension reform, as well as lower trading portfolio income. Argentina also benefited, in both the current and prior years, from the utilization of tax loss carryforwards against which valuation allowances had previously been established, and in the current year from the reduction of valuation allowances due to expected realizability of deferred tax assets. • Mexico by $139 million, net of income tax, primarily due to a decrease in certain policyholder liabilities caused by a decrease in the unrealized investment results on invested assets supporting those liabilities relative to the prior year, the favorable impact of experience refunds during the first quarter of 2007 in its institutional business, a reduction in claim liabilities resulting from experience reviews, the adverse impact in the prior year of an adjustment for experience refunds in its institutional business, a year over year decrease in DAC amortization as a result of management’s update of assumptions used to determine estimated gross profits in both the current and prior years, a decrease in liabilities based on a review of outstanding remittances, as well as growth in its institutional and universal life businesses. These increases were offset by lower fees resulting from management’s update of assumptions used to determine estimated gross profits, the favorable impact in the prior year associated with a large group policy that was not renewed by the policyholder, a decrease in various one-time revenue items, lower investment yields, the favorable impact in the prior year of liabilities related to employment matters that were reduced, and the benefit in the prior year from the elimination of liabilities for pending claims that were determined to be invalid following a review. • Taiwan by $51 million, net of income tax, primarily due to an increase in DAC amortization in the prior year due to a loss recognition adjustment and prior year restructuring costs of $11 million associated with the termination of the agency distribution channel, partially offset by the favorable impact of liability refinements in the prior year and higher policyholder liabilities related to loss recognition in the prior year. 32 MetLife, Inc.
  • 37.
    • Brazil by$37 million, net of income tax, due to the unfavorable impact of increases in policyholder liabilities due to higher than expected mortality on specific blocks of business in the prior year, an increase in litigation liabilities in the prior year and the unfavorable impact of the reversal of a tax credit in the prior year, as well as growth of the in-force business. • Ireland by $19 million, net of income tax, primarily due to the utilization of net operating losses for which a valuation allowance had been previously established as well as higher investment income resulting from higher invested assets from a capital contribution, partially offset by higher start-up expenses and currency transaction losses. • Japan by $22 million, net of income tax, due to improved hedge results and business growth, partially offset by the impact of foreign currency transaction losses. • Hong Kong by $9 million, net of income tax, due to the acquisition of the remaining 50% interest in MetLife Fubon and the resulting consolidation of the operation, as well as business growth. • Chile by $8 million, net of income tax, primarily due to continued growth of the in-force business, higher joint venture income and higher returns on inflation indexed securities, partially offset by higher compensation, infrastructure and marketing expenses. • The United Kingdom by $3 million, net of income tax, due to a reduction of claim liabilities resulting from an experience review, offset by an unearned premium calculation refinement. • Australia by $1 million, net of income tax, due to changes in foreign currency exchange rates offset by higher claims and business growth. Partially offsetting these increases, income from continuing operations decreased in: • The home office by $9 million, net of income tax, due to higher economic capital charges and investment expenses of $16 million, net of income tax, a $3 million increase in contingent tax expenses in the current year, as well as higher spending on growth and initiatives, partially offset by the elimination of certain intercompany expenses previously charged to the International segment and a tax benefit associated with a prior year income tax expense of $7 million related to a revision of an estimate. • India by $3 million, net of income tax, primarily due to headcount increases and growth initiatives, as well as the impact of valuation allowances established against losses in both years. • South Korea by $4 million, net of income tax, due to a favorable impact in the prior year of $38 million, net of income tax, in DAC amortization associated with the implementation of a more refined reserve valuation system, as well as additional expenses in the current year associated with growth and infrastructure initiatives, partially offset by continued growth in its variable universal life business, lower DAC amortization in the variable universal life business due to favorable market performance and a lower increase in claim liabilities. The remainder of the change in income from continuing operations can be attributed to contributions from the other countries. Revenues Total revenues, excluding net investment gains (losses), increased by $858 million, or 19%, to $5,362 million for the year ended December 31, 2007 from $4,504 million for the comparable 2006 period. Premiums, fees and other revenues increased by $560 million, or 16%, to $4,114 million for the year ended December 31, 2007 from $3,554 million for the comparable 2006 period. Premiums, fees and other revenues increased in: • Mexico by $133 million primarily due to higher fees and growth in its institutional and universal life businesses, a decrease of $13 million in experience refunds during the first quarter of 2007 on Mexico’s institutional business, as well as the adverse impact in the prior year of an adjustment for experience refunds on Mexico’s institutional business. These increases were offset by lower fees resulting from management’s update of assumptions used to determine estimated gross profits, and various one-time revenue items for which the prior year benefited by $16 million and the current year benefited by $4 million. • Hong Kong by $98 million due to the acquisition of the remaining 50% interest in MetLife Fubon and the resulting consolidation of the operation, as well as business growth. • Chile by $94 million primarily due to higher annuity sales resulting from a higher interest rate environment, improved competitive conditions and an expected rate increase in 2008, higher institutional premiums from its traditional and bank distribution channels, as well as the decrease in the prior year resulting from management’s decision not to match aggressive pricing in the marketplace. • South Korea by $90 million primarily due to higher fees from growth in its guaranteed annuity business and variable universal life business. • Brazil by $35 million primarily due to changes in foreign currency exchange rates and business growth. • The Company’s Japan operation by $31 million due to an increase in reinsurance assumed. • Australia by $26 million as a result of growth in the institutional and reinsurance in-force business, an increase in retention levels and changes in the foreign currency exchange rates. • Argentina by $21 million primarily due to an increase in premiums and fees from higher pension contributions resulting from higher participant salaries and a higher salary threshold subject to fees and growth in bancassurance, partially offset by the reduction of cost of insurance fees as a result of the new pension system reform regulation. • Taiwan and India by $21 million and $11 million, respectively, primarily due to business growth. Partially offsetting these increases, premiums, fees and other revenues decreased in: • The United Kingdom by $3 million due to an unearned premium calculation refinement partially offset by changes in foreign currency rates. The remainder of the change in premiums, fees and other revenues can be attributed to contributions from the other countries. Net investment income increased by $298 million, or 31%, to $1,248 million for the year ended December 31, 2007 from $950 million for the comparable 2006 period. Net investment income increased in: • Chile by $148 million due to the impact of higher inflation rates on indexed securities, the valuations and returns of which are linked to inflation rates, higher joint venture income, as well as an increase in invested assets. • Mexico by $46 million due to an increase in invested assets, partially offset by a decrease in yields, exclusive of inflation. 33MetLife, Inc.
  • 38.
    • Hong Kongby $43 million primarily due to the acquisition of the remaining 50% interest in MetLife Fubon and the resulting consolidation of the operation. • Japan by $19 million due to an increase of $52 million from hedging activities associated with Japan’s guaranteed annuity, offset by a decrease of $33 million, net of income tax, in the Company’s investment in Japan primarily due to an increase in the costs of guaranteed annuity benefits and the impact of foreign currency transaction losses, partially offset by business growth. • South Korea and Taiwan by $24 million and $6 million, respectively, primarily due to increases in invested assets. • Brazil by $14 million primarily due to increases in invested assets as well as changes in foreign currency exchange rates. • Australia by $12 million due to changes in foreign currency exchange rates, higher yields and increases in invested assets. • Ireland by $9 million due to an increase in invested assets resulting from capital contributions. • India by $4 million due to an increase in invested assets, as well as higher yields. Partially offsetting these increases in net investment income was a decrease in: • The home office of $25 million primarily due to an increase in the amount charged for economic capital and investment management expenses. • Argentina by $7 million primarily due to unfavorable results in the trading portfolio, partially offset by higher invested assets resulting from capital contributions in the prior year. Additionally, net investment income in the prior year did not decrease correspondingly with the decrease in policyholder benefits and claims discussed below because the prior year did not include interest- and inflation- indexed assets to support such liabilities. The remainder of the change in net investment income can be attributed to contributions from the other countries. Changes in foreign currency exchange rates accounted for a $106 million increase in total revenues, excluding net investment gains (losses). Expenses Total expenses increased by $338 million, or 8%, to $4,565 million for the year ended December 31, 2007 from $4,227 million for the comparable 2006 period. Policyholder benefits and claims, policyholder dividends and interest credited to policyholder account balances increased by $119 million, or 4%, to $2,817 million for the year ended December 31, 2007 from $2,698 million for the comparable 2006 period. Policyholder benefits and claims, policyholder dividends and interest credited to policyholder account balances increased in: • Chile by $221 million primarily due to an increase in inflation indexed policyholder liabilities as well as growth in its annuity and institutional businesses. • Hong Kong by $119 million due to the acquisition of the remaining 50% interest in MetLife Fubon and the resulting consolidation of the operation. • Taiwan by $65 million primarily due to a decrease of $14 million in the prior year from liability refinements associated with the conversion to a new valuation system, as well as higher policyholder liabilities related to loss recognition in the fourth quarter of 2006 and growth in the business. • South Korea by $27 million primarily due to business growth as well as changes in foreign currency exchange rates, partially offset by a lower increase in claims liabilities resulting from a change in the reinsurance allowance in the prior year. • Australia by $23 million due to higher claims, an increase in retention levels, business growth and changes in foreign currency exchange rates. • India by $4 million due to higher claims and business growth, partially offset by management’s update of assumptions used to determine estimated gross profits. Partially offsetting these increases in policyholder benefits and claims, policyholder dividends and interest credited to policyholder account balances were decreases in: • Argentina by $250 million primarily due to the elimination of liabilities for claims and premium deficiencies of $208 million resulting from pension reform. Under the reform plan, which is effective January 1, 2008, fund administrators are no longer liable for new death and disability claims of the plan participants. Also contributing is a decrease in interest- and market-indexed policyholder liabilities and the favorable impact of reductions in claim liabilities resulting from experience reviews in both the current and prior years. • Mexico by $63 million, primarily due to a decrease in certain policyholder liabilities of $117 million caused by a decrease in the unrealized investment results on the invested assets supporting those liabilities relative to the prior year and a reduction in claim liabilities resulting from experience reviews, offset by an increase of $10 million due to a decrease in the prior year of policyholder benefits associated with a large group policy that was not renewed by the policyholder, an increase of $6 million due to a benefit in the prior year from the elimination of liabilities for pending claims that were determined to be invalid following a review, as well as business growth. • Brazil of $13 million primarily due to the impact in the prior year of increases in policyholder liabilities from higher than expected mortality on specific blocks of business, partially offset by changes in foreign currency exchange rates. • The United Kingdom by $8 million, due to a reduction of claim liabilities based on a review of experience. Decreases in other countries accounted for the remainder of the change. Other expenses increased by $219 million, or 14%, to $1,748 million for the year ended December 31, 2007 from $1,529 million for the comparable 2006 period. Other expenses increased in: • Argentina by $153 million, primarily due to a liability of $128 million for servicing obligations that was established as a result of pension reform. Under the reform plan, which is effective January 1, 2008, the Company retains the obligation for administering certain existing and future participants’ accounts for which they receive no revenue. Also contributing is an increase in commissions on bancassurance business, an increase in retention incentives related to pension reform, the impact of management’s update of DAC assumptions as a result of pension reform and growth, partially offset by a lower increase in liabilities due to inflation and exchange rate indexing. • South Korea by $92 million, primarily due to the favorable impact in the prior year of $60 million in DAC amortization associated with the implementation of a more refined reserve valuation system and additional expenses in the current year associated with growth 34 MetLife, Inc.
  • 39.
    and infrastructure initiatives,as well as business growth and higher bank insurance fees, partially offset by a decrease in DAC amortization related to market performance. • Mexico by $27 million primarily due to higher expenses related to business growth and the favorable impact in the prior year of liabilities related to employment matters that were reduced, offset by a decrease in DAC amortization resulting from management’s update of assumptions used to determine estimated gross profits in both the current and prior years, and a decrease in liabilities based on a review of outstanding remittances. • India by $14 million primarily due to headcount increases and growth initiatives, partially offset by the impact of management’s update of assumptions used to determine estimated gross profits. • Australia by $12 million primarily due to business growth and changes in foreign currency exchange rates. • Chile by $12 million primarily due to higher compensation costs, higher spending on infrastructure and marketing programs and growth, partially offset by a decrease in DAC amortization related to inflation indexing. • Hong Kong by $11 million due to the acquisition of the remaining 50% interest in MetLife Fubon and the resulting consolidation of the operation. • Ireland by $10 million due to additional start-up costs, as well as $5 million of foreign currency transaction losses. • Brazil by $9 million primarily due to changes in foreign currency exchange rates, partially offset by an increase in litigation liabilities in the prior year. • The United Kingdom by $2 million due to changes in foreign currency rates and higher spending on business initiatives, partially offset by lower DAC amortization resulting from calculation refinements. Partially offsetting these increases in other expenses were decreases in: • Taiwan by $118 million primarily due to a one-time increase in DAC amortization in the prior year of $77 million due to a loss recognition adjustment resulting from low interest rates relative to product guarantees coupled with high persistency rates on certain blocks of business, an increase in DAC amortization in the prior year associated with the implementation of a new valuation system, expenses of $17 million in the prior year related the termination of the agency distribution channel and expense reductions recognized in the current year due to elimination of the agency distribution channel. • The home office of $4 million primarily due to the elimination of certain intercompany expenses previously charged to the International Segment, offset by higher spending on growth and infrastructure initiatives. Decreases in other countries accounted for the remainder of the change. Changes in foreign currency exchange rates accounted for a $105 million increase in total expenses. Year ended December 31, 2006 compared with the year ended December 31, 2005 — International Income from Continuing Operations Income from continuing operations decreased by $14 million, or 8%, to $172 million for the year ended December 31, 2006 from $186 million for the comparable 2005 period. The acquisition of Travelers contributed $20 million during the first six months of 2006 to income from continuing operations, which includes $3 million, net of income tax, of net investment gains. Included in the Travelers results is an increase to policyholder benefits and claims of $10 million, net of income tax, resulting from the increase in policyholder liabilities due to higher than expected mortality in Brazil on specific blocks of business written in the Travelers entity since the acquisition, and consistent with the increase in the existing MetLife entity as described more fully below. Excluding the impact of Travelers, income from continuing operations decreased by $34 million, or 18%, from the comparable 2005 period. This decrease includes the impact of net investment gains (losses) of ($17) million, net of income tax. Excluding the impact of Travelers and of net investment gains (losses), income from continuing operations decreased by $17 million from the comparable 2005 period. Income from continuing operations decreased in: • Taiwan by $59 million, net of income tax, due to a loss recognition adjustment (in the form of accelerated DAC amortization) of $50 million, net of income tax, and restructuring costs of $11 million, net of income tax, partially offset by reserve refinements of $3 million, net of income tax, associated with the conversion to a new valuation system. • Canada by $19 million, net of income tax, primarily due to the realignment of economic capital in the prior year. • Mexico by $12 million, net of income tax, due to an increase in amortization of DAC resulting from management’s update of assumptions used to determine estimated gross margins in both years, higher operating expenses from the pension business, the net impact of an adjustment to the liability for experience refunds on a block of business, a decrease in various one-time other revenue items for which the prior year benefited by $13 million, net of income tax, and the current year benefited by $11 million, net of income tax, as well as an increase of $27 million in tax due to tax benefits realized in the prior year from the American Jobs Creation Act of 2004 (“AJCA”).These were partially offset by a decrease in certain policyholder liabilities caused by a decrease in unrealized investment gains on invested assets supporting those liabilities relative to the prior year, a decrease in policyholder benefits associated with a large group policy that was not renewed by the policyholder, a benefit in the current year from the elimination of liabilities for pending claims that were determined to be invalid following a review, the unfavorable impact in the prior year of contingent liabilities that were established related to potential employment matters in that year and which were eliminated in the current year as well as overall business growth. • Brazil by $7 million, net of income tax, primarily due to a $10 million, net of income tax, increase in policyholder benefits and claims related to an increase in future policyholder benefit liabilities on specific blocks of business. This increase is due to significantly higher than expected mortality experience, of which a total of $20 million, net of income tax, of additional liabilities were recorded, $10 million, net of income tax, of which was associated with the acquired Travelers’ business, and of which $10 million, net of income tax, was related to the existing MetLife entities. Brazil’s income from continuing operations was also impacted by an increase in litigation liabilities, as well as adverse claim experience in the current year. • The Company’s investment in Japan by $4 million, net of income tax, due to variability in the hedging program. • The home office by $49 million primarily due to recorded higher infrastructure expenditures in support of segment growth of $39 million, net of income tax, as well as a $23 million, net of income tax, contingent tax liability. This was offset by an increase in income from continuing operations of $13 million, net of income tax, due to a reduction in the amount charged for economic capital. 35MetLife, Inc.
  • 40.
    • The Company’soperation in Ireland reduced operating income by $34 million, net of income tax, due to start-up expenses in the current year. A valuation allowance was established against the deferred income tax benefit resulting from the Ireland losses. Partially offsetting these decreases in income from continuing operations were increases in: • South Korea by $79 million, net of income tax, primarily due to continued growth of the in-force business, a one-time benefit of $38 million, net of income tax, associated with the implementation of a more refined reserve valuation system, as well as a benefit of $13 million from the impact of foreign currency exchange rates. • Argentina by $61 million, net of income tax, due to higher net investment income resulting from capital contributions since the completion of the Travelers acquisition, the release of liabilities for pending claims that were determined to be invalid following a review, the favorable impact of foreign currency exchange rates and inflation rates on certain contingent liabilities, the utilization of $4 million of net operating losses for which a valuation allowance had been previously established, a $12 million increase in the prior year period of a deferred income tax valuation allowance established against tax benefits in that year, as well as business growth. • Australia by $22 million, net of income tax, primarily due to reserve strengthening on a block of business in the prior year, as well as business growth. • Chile by $5 million, net of income tax, primarily due to growth in the institutional business of $2 million, as well as the favorable impact of foreign currency exchange rates of $2 million. • The United Kingdom by $5 million, net of income tax, primarily due to growth of the in-force business. The remainder of the decrease in income from continuing operations can be attributed to other countries. Changes in foreign currency exchange rates accounted for $2 million of the increase in income from continuing operations. Revenues Total revenues, excluding net investment gains (losses), increased by $925 million, or 26%, to $4,504 million for the year ended December 31, 2006 from $3,579 million for the comparable 2005 period. The acquisition of Travelers contributed $366 million during the first six months of 2006 to the period over period increase. Excluding the impact of Travelers, such revenues increased by $559 million, or 16%, over the comparable 2005 period. Premiums, fees and other revenues increased by $469 million, or 17%, to $3,254 million for the year ended December 31, 2006 from $2,785 million for the comparable 2005 period. Premiums, fees and other revenues increased in: • Mexico by $159 million, primarily due to higher fees and growth in its universal life and institutional business, partially offset by an adjustment for experience refunds on a block of business and various one-time other revenue items for which the prior year benefited by $19 million and the current year benefited by $16 million. • South Korea by $156 million primarily due to business growth driven by strong sales of its variable universal life product, as well as the favorable impact of foreign currency exchange rates of $56 million. • Brazil by $49 million due to business growth and higher bancassurance business, as well as an increase in amounts retained under reinsurance arrangements. • Chile by $22 million primarily due to the favorable impact of foreign currency exchange rates of $14 million, as well as an increase in institutional premiums through its bank distribution channel, partially offset by lower annuity sales due in part from management’s decision not to match aggressive pricing in the marketplace. • The United Kingdom, Argentina, Australia, and Taiwan by $21 million, $16 million, $15 million, and $12 million respectively, primarily due to business growth. Increases in other countries accounted for the remainder of the change. Net investment income increased by $90 million, or 11%, to $884 million for the year ended December 31, 2006 from $794 million for the comparable 2005 period. Net investment income increased in: • Argentina by $41 million primarily due to higher invested assets resulting from capital contributions since the completion of the Travelers acquisition. • Mexico by $28 million primarily due to higher inflation rates and increases in invested assets, partially offset by lower average investment yields. • South Korea, Brazil and Taiwan by $25 million, $14 million and $5 million, respectively, primarily due to increases in invested assets, as well as the favorable impact of foreign currency exchange rates of $10 million. • Home office by $17 million primarily due to a reduction in the amount charged for economic capital from the prior year. Partially offsetting these increases in net investment income were decreases in: • Chile by $8 million primarily due to a reduction in the inflation rate, partially offset by the favorable impact of foreign currency exchange rates of $8 million and increases in invested assets. The invested asset valuations and returns on these invested assets are linked to inflation rates in most of the Latin American countries in which the Company does business. • Canada by $33 million due to the realignment of economic capital. Increases in other countries accounted for the remainder of the change. Changes in foreign currency exchange rates had a favorable impact of $105 million on total revenues, excluding net investment gains (losses). Expenses Total expenses increased by $857 million, or 25%, to $4,227 million for the year ended December 31, 2006 from $3,370 million for the comparable 2005 period. The acquisition of Travelers contributed $346 million during the first six months of 2006 to the year over year increase. Excluding the impact of Travelers, total expenses increased by $511 million, or 15%, over the comparable 2005 period. Policyholder benefits and claims, policyholder dividends and interest credited to policyholder account balances increased by $187 million, or 8%, to $2,560 million for the year ended December 31, 2006 from $2,373 million for the comparable 2005 period. Policyholder benefits and claims, policyholder dividends and interest credited to policyholder account balances increased in: • Mexico by $113 million primarily due to an increase in other policyholder benefits and claims of $108 million and in interest credited to policyholder account balances of $39 million commensurate with the growth in revenue discussed above. These increases in Mexico 36 MetLife, Inc.
  • 41.
    were partially offsetby a decrease in certain policyholder liabilities of $18 million caused by a decrease in the unrealized investment gains on the invested assets supporting those liabilities, a $10 million benefit from a decrease in policyholder benefits associated with a large group policy that was not renewed by the policyholder, and a $6 million benefit in the current year from the elimination of liabilities for pending claims that were determined to be invalid following a review. • Brazil by $49 million primarily due to an increase in policyholder liabilities on these specific blocks of business as discussed above, an increase in amounts retained under reinsurance arrangements, as well as adverse claim experience in other lines of business. • South Korea by $44 million commensurate with the business growth discussed above, as well as the impact of foreign currency exchange rates of $33 million. Partially offsetting these increases, policyholder benefits and claims, policyholder dividends, and interest credited to policyholder account balances decreased in: • Australia by $22 million due to reserve strengthening in the prior year on a block of reinsurance business. • Chile by $7 million primarily due to a decrease in annuity liabilities related to the decrease in the inflation index and the decrease in annuity premiums discussed above, partially offset by growth in the institutional business, as well as the impact of foreign currency exchange rates of $17 million. • Taiwan by $2 million primarily due to a decrease of $14 million from reserve refinements associated with the implementation of a new valuation system, partially offset by an increase of $12 million primarily due to business growth. • Argentina by $2 million primarily due to the elimination of liabilities for pending claims that were determined to be invalid following a review, partially offset by business growth. Increases in other countries accounted for the remainder of the change. Other expenses increased by $324 million, or 32%, to $1,321 million for the year ended December 31, 2006 from $997 million for the comparable 2005 period. Other expenses increased in: • Taiwan by $110 million primarily due to a one-time increase in DAC amortization of $77 million due to a loss recognition adjustment resulting from low interest rates relative to product guarantees coupled with high persistency rates on certain blocks of business, an increase of $17 million related to the termination of the agency distribution channel in Taiwan, an increase of $9 million from refinements associated with the implementation of a new valuation system, as well as business growth. • Mexico by $49 million primarily due to an increase in commissions commensurate with the revenue growth discussed above, higher DAC amortization resulting from management’s update of assumptions used to determine estimated gross profits in both the current and prior years, higher expenses related to growth initiatives, and additional expenses associated with the Mexican pension business, partially offset by the favorable impact of contingent liabilities that were established in the prior year related to potential employment matters and which were eliminated in the current year. • South Korea by $25 million, primarily due to an increase in DAC amortization and general expenses, which were both due to the growth in business, the impact in the prior year of an accrual for an early retirement program and the impact of foreign currency exchange rates of $15 million. These were partially offset by a decrease of $60 million in DAC amortization associated with the implementation of a more refined reserve valuation system. • Brazil by $25 million primarily due to the growth in business discussed above, as well as an increase in litigation liabilities. • Chile by $13 million due to increased commissions and other expenses associated with its institutional business, as well as the impact of foreign currency exchange rates of $4 million. • The United Kingdom and Australia by $15 million and $3 million, respectively, primarily due to business growth. • Home office by $57 million primarily due to an increase in expenditures for information technology projects, growth initiative projects and integration costs, as well as an increase in compensation resulting from an increase in headcount from the comparable 2005 period. • Ireland by $34 million primarily related to the start-up of the Company’s operation in Ireland. Offsetting these increases, other expenses decreased in: • Argentina by $9 million primarily due to the favorable impact of foreign currency exchange rates and inflation rates on certain contingent liabilities. Increases in other countries accounted for the remainder of the change. Changes in foreign currency exchange rates accounted for $90 million of the increase in total expenses. 37MetLife, Inc.
  • 42.
    Reinsurance The following tablepresents consolidated financial information for the Reinsurance segment for the years indicated: 2007 2006 2005 Years Ended December 31, (In millions) Revenues Premiums . . . . . . . . . . . . . . . . . . . . . . . . . . . . . . . . . . . . . . . . . . . . . . . . . . . . . $4,910 $4,348 $3,869 Net investment income . . . . . . . . . . . . . . . . . . . . . . . . . . . . . . . . . . . . . . . . . . . . . 871 732 606 Other revenues. . . . . . . . . . . . . . . . . . . . . . . . . . . . . . . . . . . . . . . . . . . . . . . . . . 77 66 58 Net investment gains (losses) . . . . . . . . . . . . . . . . . . . . . . . . . . . . . . . . . . . . . . . . (177) 7 22 Total revenues . . . . . . . . . . . . . . . . . . . . . . . . . . . . . . . . . . . . . . . . . . . . . . . . . 5,681 5,153 4,555 Expenses Policyholder benefits and claims. . . . . . . . . . . . . . . . . . . . . . . . . . . . . . . . . . . . . . . 3,989 3,490 3,206 Interest credited to policyholder account balances . . . . . . . . . . . . . . . . . . . . . . . . . . . 262 254 220 Other expenses . . . . . . . . . . . . . . . . . . . . . . . . . . . . . . . . . . . . . . . . . . . . . . . . . 1,226 1,227 991 Total expenses . . . . . . . . . . . . . . . . . . . . . . . . . . . . . . . . . . . . . . . . . . . . . . . . 5,477 4,971 4,417 Income before provision for income tax . . . . . . . . . . . . . . . . . . . . . . . . . . . . . . . . . . 204 182 138 Provision for income tax . . . . . . . . . . . . . . . . . . . . . . . . . . . . . . . . . . . . . . . . . . . . 71 64 46 Net income . . . . . . . . . . . . . . . . . . . . . . . . . . . . . . . . . . . . . . . . . . . . . . . . . . . . $ 133 $ 118 $ 92 Year ended December 31, 2007 compared with the year ended December 31, 2006 — Reinsurance Net Income Net income increased by $15 million, or 13%, to $133 million for the twelve months ended December 31, 2007 from $118 million for the comparable 2006 period. The increase in net income was attributable to a 13% increase in premiums while policyholder benefits and claims increased by 14%, a 19% increase in net investment income while interest credited to policyholder account balances increased by 3%, and a 17% increase in other revenues. The increase in premiums, net of the increase in policyholder benefits and claims, added $41 million to net income, net of income tax, which was primarily due to additional business in-force from facultative and automatic treaties and renewal premiums on existing blocks of business in the U.S. and international operations. Policyholder benefits and claims as a percentage of premiums were 81% and are comparable to the prior year. The increase in net investment income, net of interest credited to policyholder account balances, added $85 million to net income and was due primarily to growth in the invested asset base. The increases in invested assets and net investment income, net of interest credited to policyholder account balances were substantially derived from the issuance of notes, which also increased interest expense within other expenses as described below. Additionally, positive operating cash flows and additional policyholder account balances contributed to the growth in the invested asset base. The increase in other revenues added $7 million to net income, net of income tax, and was primarily related to an increase in investment product fees on asset-intensive business and financial reinsurance fees during 2007. A decrease in other expenses added $1 million to net income, net of income tax. The decrease in other expenses was primarily related to a reduction of expenses associated with DAC, including reinsurance allowances paid, offset by an increase in interest, expense compensation and overhead-related expenses associated with RGA’s international expansion, and minority interest expense. The increase in interest expense is associated with the issuance of $850 million 30-year notes in June 2006 by a subsidiary of RGA to provide long-term collateral for Regulation XXX statutory reserves, RGA’s issuance of $300 million senior notes in March 2007, and FIN 48 interest expense. These increases in net income were partially offset by a $120 million increase in net investment losses, net of income tax. The increase in net investment losses was primarily due to a decrease in the fair value of embedded derivatives associated with the reinsurance of annuity products on a funds withheld basis. Additionally, a component of the increase in net income was a $4 million increase associated with foreign currency exchange rate movements. Revenues Total revenues, excluding net investment gains (losses), increased by $712 million, or 14%, to $5,858 million for the twelve months ended December 31, 2007 from $5,146 million for the comparable 2006 period. The increase in revenues was primarily associated with growth in premiums of $562 million from new facultative and automatic treaties and renewal premiums on existing blocks of business in all RGA operating segments, including the U.S., which contributed $221 million; Asia Pacific, which contributed $192 million; Europe and South Africa, which contributed $91 million; and Canada, which contributed $58 million. Premium levels are significantly influenced by large transactions and reporting practices of ceding companies and, as a result, can fluctuate from period to period. Net investment income increased by $139 million primarily due to growth in the invested asset base from net proceeds from the aforementioned notes offerings by RGA and its subsidiary, positive cash flows from operations, additional deposits associated with the coinsurance of annuity products, and a realignment of economic capital. The investment yield also increased slightly over the comparable prior year. Other revenues increased by $11 million primarily due to an increase in surrender charges on asset-intensive business reinsured and an increase in fees associated with financial reinsurance. 38 MetLife, Inc.
  • 43.
    Additionally, a componentof the increase in total revenues, excluding net investment gains (losses), was a $128 million increase associated with foreign currency exchange rate movements. Expenses Total expenses increased by $506 million, or 10%, to $5,477 million for the twelve months ended December 31, 2007 from $4,971 million for the comparable 2006 period. This increase in total expenses was primarily attributable to an increase of $499 million in policyholder benefits and claims, primarily associated with a growth in insurance in-force of $179 billion, and an increase of $8 million in interest credited to policyholder account balances. This increase in interest credited to policyholder account balances was more than offset by an increase in net investment income. In addition to the in-force growth, favorable mortality in the prior year in the international operations added to the increase in policyholder benefits and claims. Other expenses decreased by $1 million due to a $79 million decrease in expenses associated with DAC, including reinsurance allowances paid, offset by a $41 million increase in interest expense associated with the aforementioned notes offerings by RGA and its subsidiary and the application of FIN 48, and an $7 million increase in minority interest expense. Included in the $79 million decrease in expenses associated with DAC was a $113 million reduction of DAC amortization due to the change in the value of embedded derivatives associated with modified coinsurance arrangements as a result of the impact of widening credit spreads in the U.S. debt markets. An offsetting increase of $30 million was primarily due to compensation and overhead-related expenses associated with RGA’s international expansion and general growth in operations, including equity compensation expense. Additionally, a component of the increase in total expenses, was a $121 million increase associated with foreign currency exchange rate movements. Year ended December 31, 2006 compared with the year ended December 31, 2005 — Reinsurance Net Income Net income increased by $26 million, or 28%, to $118 million for the year ended December 31, 2006 from $92 million for the comparable 2005 period. The increase in net income was attributable to a 12% increase in premiums while policyholder benefits and claims increased by 9%, a 21% increase in net investment income while interest credited to policyholder account balances increased by 15%, and a 14% increase in other revenues. The increase in premiums, net of the increase in policyholder benefits and claims, added $127 million to net income which was primarily due to added business in-force from facultative and automatic treaties and renewal premiums on existing blocks of business in the U.S. and international operations. The increase in policyholder benefits and claims was partially offset by unfavorable mortality and an increase in the liabilities associated with RGA’s Argentine pension business, both in the prior-year period. The increase in net investment income and interest credited to policyholder account balances added $60 million to net income and was due to growth in the invested asset base. The increase in invested assets, and net investment income, substantially derived from the issuance of notes and a collateral financing facility, which increased interest expense within other expenses as described below. The increase in other revenues added $5 million to net income and was primarily related to an increase in investment product fees on asset-intensive business and financial reinsurance fees during 2006, partially offset by a decrease in foreign currency transaction gains in the prior-year period. These increases in net income were partially offset by a $153 million increase in other expenses and a $10 million decrease in net investment gains (losses), all net of income tax. Additionally, a higher effective tax rate in 2006 reduced net income by $3 million. The increase in other expenses was primarily related to expenses associated with DAC, including reinsurance allowances paid, interest expense associated with RGA’s issuance of $850 million 30-year notes to provide long-term collateral for Regulation XXX statutory reserves in June 2006 and $400 million of junior subordinated notes in December 2005, minority interest expense, and equity compensation expense. Revenues Total revenues, excluding net investment gains (losses), increased by $613 million, or 14%, to $5,146 million for the year ended December 31, 2006 from $4,533 million for the comparable 2005 period. The increase in such revenues was primarily associated with growth in premiums of $479 million from new facultative and automatic treaties and renewal premiums on existing blocks of business in all RGA operating segments, including the U.S., which contributed $220 million; Asia Pacific, which contributed $138 million; Canada, which contributed $86 million; and Europe and South Africa, which contributed $35 million. Premium levels were significantly influenced by large transactions and reporting practices of ceding companies and, as a result, can fluctuate from period to period. Net investment income increased by $126 million, primarily due to growth in the invested asset base from net proceeds of RGA’s $850 million 30-year notes offering in June 2006 and $400 million junior subordinated note offering in December 2005, positive operating cash inflows and additional deposits associated with the coinsurance of annuity products. Investment yields were down slightly compared to the prior-year period. The increase in net investment income was partially offset by a decrease related to a realignment of economic capital. Other revenues increased by $8 million primarily due to an increase in investment product fees on asset-intensive business and financial reinsurance fees during 2006, partially offset by a decrease in foreign currency transaction gains. Additionally, a component of the increase in total revenues, excluding net investment gains (losses), was a $36 million increase associated with foreign currency exchange rate movements. Expenses Total expenses increased by $554 million, or 13%, to $4,971 million for the year ended December 31, 2006 from $4,417 million for the comparable 2005 period. The increase in total expenses was commensurate with the growth in revenues and was primarily attributable to an increase of $284 million in policyholder benefits and claims, primarily associated with growth in insurance in-force of $245 billion, and a $34 million increase in interest credited due to growth in policyholder account balances associated with the coinsurance of annuity products, which is generally offset by a corresponding increase in net investment income. The increase in policyholder benefits and claims of $284 million was partially offset by favorable underwriting results in RGA’s international operations in the current year period, unfavorable mortality 39MetLife, Inc.
  • 44.
    experience in theU.S. and the United Kingdom in the prior-year period, and a $33 million increase in the liabilities associated with the Argentine pension business in the prior year period. Other expenses increased by $236 million due to a $92 million increase in expenses associated with DAC, including reinsurance allowances paid, a $47 million increase in interest expense primarily associated with RGA’s issuance of $850 million 30-year notes in June 2006 and $400 million of junior subordinated notes in December 2005, as well as a $47 million increase in minority interest expense on the larger earnings base in the current period. The remaining increase of $50 million was primarily related to overhead-related expenses associated with RGA’s international expansion and general growth in operations, including equity compensation expense. Additionally, a component of the increase in total expenses was a $33 million increase associated with foreign currency exchange rate movements. 40 MetLife, Inc.
  • 45.
    Corporate & Other Thefollowing table presents consolidated financial information for Corporate & Other for the years indicated: 2007 2006 2005 Years Ended December 31, (In millions) Revenues Premiums . . . . . . . . . . . . . . . . . . . . . . . . . . . . . . . . . . . . . . . . . . . . . . . . . . . . . $ 35 $ 35 $ 22 Universal life and investment-type product policy fees. . . . . . . . . . . . . . . . . . . . . . . . . — — 1 Net investment income . . . . . . . . . . . . . . . . . . . . . . . . . . . . . . . . . . . . . . . . . . . . . 1,460 1,046 699 Other revenues. . . . . . . . . . . . . . . . . . . . . . . . . . . . . . . . . . . . . . . . . . . . . . . . . . 63 34 30 Net investment gains (losses) . . . . . . . . . . . . . . . . . . . . . . . . . . . . . . . . . . . . . . . . 47 (154) (48) Total revenues . . . . . . . . . . . . . . . . . . . . . . . . . . . . . . . . . . . . . . . . . . . . . . . . . 1,605 961 704 Expenses Policyholder benefits and claims. . . . . . . . . . . . . . . . . . . . . . . . . . . . . . . . . . . . . . . 47 37 (15) Other expenses . . . . . . . . . . . . . . . . . . . . . . . . . . . . . . . . . . . . . . . . . . . . . . . . . 1,400 1,349 955 Total expenses . . . . . . . . . . . . . . . . . . . . . . . . . . . . . . . . . . . . . . . . . . . . . . . . 1,447 1,386 940 Income (loss) from continuing operations before provision (benefit) for income tax . . . . . . . 158 (425) (236) Income tax benefit . . . . . . . . . . . . . . . . . . . . . . . . . . . . . . . . . . . . . . . . . . . . . . . . (114) (419) (215) Income (loss) from continuing operations . . . . . . . . . . . . . . . . . . . . . . . . . . . . . . . . . 272 (6) (21) Income from discontinued operations, net of income tax . . . . . . . . . . . . . . . . . . . . . . . 35 3,134 1,167 Net income . . . . . . . . . . . . . . . . . . . . . . . . . . . . . . . . . . . . . . . . . . . . . . . . . . . . 307 3,128 1,146 Preferred stock dividends . . . . . . . . . . . . . . . . . . . . . . . . . . . . . . . . . . . . . . . . . . . 137 134 63 Net income available to common shareholders . . . . . . . . . . . . . . . . . . . . . . . . . . . . . $ 170 $2,994 $1,083 Year ended December 31, 2007 compared with the year ended December 31, 2006 — Corporate & Other Income from Continuing Operations Income from continuing operations increased by $278 million, to a gain of $272 million for the year ended December 31, 2007 from a loss of $6 million for the comparable 2006 period. Included in this increase were lower net investment losses of $132 million, net of income tax, resulting in a net investment gain. Excluding the impact of net investment gains (losses), income from continuing operations increased by $146 million. The increase in income from continuing operations was primarily attributable to higher net investment income, lower corporate expenses, higher other revenues, integration costs incurred in the prior year, and lower legal cost of $269 million, $56 million, $19 million, $17 million, and $7 million, respectively, each of which were net of income tax. This was partially offset by higher interest expense on debt, higher interest on tax contingencies, and higher interest credited to bankholder deposits of $86 million, $23 million, and $3 million respectively, each of which were net of income tax. Tax benefits decreased by $103 million over the comparable 2006 period due to the Company’s implementation of FIN 48, the difference of finalizing the Company’s 2006 tax return in 2007 when compared to finalizing the Company’s 2005 tax return in 2006 and the difference between the actual and the estimated tax rate allocated to the various segments. Revenues Total revenues, excluding net investment gains (losses), increased by $443 million, or 40%, to $1,558 million for the year ended December 31, 2007 from $1,115 million for the comparable 2006 period. This increase was primarily due to increased net investment income of $414 million, mainly on fixed maturity securities, driven by a higher asset base related to the reinvestment of proceeds from the sale of the Peter Cooper Village and Stuyvesant Town properties during the fourth quarter of 2006 and the investment of proceeds from issuances of junior subordinated debt in December 2006 and December 2007 and collateral financing arrangements to support statutory reserves in May 2007 and December 2007. Net investment income also increased on other limited partnerships, real estate and real estate joint ventures, and mortgage loans. Other revenues increased by $29 million primarily related to the resolution of an indemnification claim associated with the 2000 acquisition of GALIC, offset by an adjustment of surrender values on corporate-owned life insurance policies. Also included as a component of total revenues was the elimination of intersegment amounts which was offset within total expenses. Expenses Total expenses increased by $61 million, or 4%, to $1,447 million for the year ended December 31, 2007 from $1,386 million for the comparable 2006 period. Interest expense was higher by $133 million due to the issuances of junior subordinated debt in December 2006 and December 2007 and collateral financing arrangements in May 2007 and December 2007, respectively, and from settlement fees on the prepayment of shares subject to mandatory redemption in October 2007, partially offset by the maturity of senior notes in December 2006 and the reduction of commercial paper outstanding. Interest on tax contingencies was higher by $35 million as a result of an increase in published Internal Revenue Service (“IRS”) interest rates and a change in the method of estimating interest expense on tax contingencies associated with the Company’s implementation of FIN 48. As a result of higher interest rates, interest credited on bank deposits increased by $5 million at MetLife Bank. Corporate expenses are lower by $86 million primarily due to lower corporate support expenses of $63 million, which included advertising, start-up costs for new products and information technology costs, and lower costs from reductions of MetLife Foundation contributions of $23 million. Integration costs incurred in 2006 period were $25 million. Legal costs were lower by $11 million primarily due to a reduction in the current year of $35 million of legal liabilities resulting from the settlement of 41MetLife, Inc.
  • 46.
    certain cases, lowerother legal costs of $3 million partially offset by higher amortization and valuation of an asbestos insurance recoverable of $27 million. Also included as a component of total expenses were the elimination of intersegment amounts which were offset within total revenues. Year ended December 31, 2006 compared with the year ended December 31, 2005 — Corporate & Other Income (Loss) from Continuing Operations Income (loss) from continuing operations increased by $15 million, or 71%, to ($6) million for the year ended December 31, 2006 from ($21) million for the comparable 2005 period. The acquisition of Travelers, excluding Travelers financing and integration costs incurred by the Company, contributed $111 million during the first six months of 2006 to income (loss) from continuing operations, which included $3 million, net of income tax, of net investment losses. Excluding the impact of Travelers, income (loss) from continuing operations decreased by $96 million for the year ended December 31, 2006 from the comparable 2005 period. Included in this decrease were higher investment losses of $66 million, net of income tax. Excluding the impact of Travelers and the increase of net investment losses, income (loss) from continuing operations decreased by $30 million. The increase in income (loss) from continuing operations was primarily attributable to higher net investment income, lower integration costs and higher other revenues of $104 million, $62 million, and $4 million, respectively, all of which were net of income tax. This was partially offset by higher interest expense on debt (principally associated with the issuance of debt to finance the Travelers acquisition), corporate support expenses, interest credited to bankholder deposits, policyholder benefits and claims and legal-related liabilities of $125 million, $111 million, $55 million, $30 million and $5 million, respectively, all of which were net of income tax. Tax benefits increased by $113 million over the comparable 2005 period due to the difference of finalizing the Company’s 2005 tax return in 2006 when compared to finalizing the Company’s 2004 tax return in 2005 and the difference between the actual and the estimated tax rate allocated to the various segments. Revenues Total revenues, excluding net investment gains (losses), increased by $363 million, or 48%, to $1,115 million for the year ended December 31, 2006 from $752 million for the comparable 2005 period. The acquisition of Travelers contributed $200 million during the first six months of 2006 to the period over period increase. Excluding the impact of Travelers, revenues increased by $163 million, or 22%, from the comparable 2005 period. This increase was primarily attributable to increased net investment income of $171 million primarily from increases in income on fixed maturity securities due to improved yields from lengthening of the duration and a higher asset base, and the impact of higher short-term interest rates on cash equivalents and short-term investments. The increase also resulted from a higher asset base invested in mortgage loans on real estate, real estate joint ventures, and other limited partnership interests and was partially offset by a decline in securities lending results and leveraged leases. The remainder of the increase was primarily attributable to increased other revenues of $5 million, which primarily consisted of increased surrender values on corporate owned life insurance policies. Also included as a component of total revenues were the intersegment eliminations which were offset within total expenses. Expenses Total expenses increased by $446 million, or 47%, to $1,386 million for the year ended December 31, 2006 from $940 million for the comparable 2005 period. The acquisition of Travelers, excluding Travelers financing and integration costs, contributed $59 million during the first six months of 2006 to the period over period increase. Excluding the impact of Travelers, total expenses increased by $387 million, or 41%, for the year ended December 31, 2006 from the comparable 2005 period. This increase was primarily attributable to higher interest expense of $192 million. The principal reason was a result of the issuance of senior notes in 2005, which included $119 million of expenses from the financing of the acquisition of Travelers. Additionally, as a result of the issuance of commercial paper, short-term interest expense increased by $67 million. Corporate support expenses were higher by $170 million primarily due to higher corporate support expenses of $107 million, which included advertising, start-up costs for new products and information technology costs, a $35 million MetLife foundation contribution in the 2006 period and a $28 million benefit, in the 2005 period, associated with the reduction of a previously established real estate transfer tax liability related to MLIC’s demutualization in 2000. As a result of growth in the business and higher interest rates, interest credited to bankholder deposits increased by $85 million at MetLife Bank. Policyholder benefits and claims increased $47 million from a 2005 period benefit associated with a reduction of a previously established liability for settlement death benefits related to the Company’s sales practices class action settlement recorded in 1999. Legal- related costs were higher by $8 million, predominantly from the reduction of previously established liabilities related to legal disputes during the 2005 period. Integration costs were lower by $95 million. Also included as a component of total expenses were the elimination of intersegment amounts which were offset within total revenues. 42 MetLife, Inc.
  • 47.
    Liquidity and CapitalResources The Company Capital RBC requirements are used as minimum capital requirements by the National Association of Insurance Commissioners (“NAIC”) and the state insurance departments to identify companies that merit further regulatory action. RBC is based on a formula calculated by applying factors to various asset, premium and statutory reserve items. The formula takes into account the risk characteristics of the insurer, including asset risk, insurance risk, interest rate risk and business risk and is calculated on an annual basis. The formula is used as an early warning regulatory tool to identify possible inadequately capitalized insurers for purposes of initiating regulatory action, and not as a means to rank insurers generally. These rules apply to each of the Holding Company’s domestic insurance subsidiaries. State insurance laws provide insurance regulators the authority to require various actions by, or take various actions against, insurers whose total adjusted capital does not exceed certain RBC levels. As of the date of the most recent annual statutory financial statements filed with insurance regulators, the total adjusted capital of each of these subsidiaries was in excess of each of those RBC levels. Asset/Liability Management The Company actively manages its assets using an approach that balances quality, diversification, asset/liability matching, liquidity and investment return. The goals of the investment process are to optimize, net of income tax, risk-adjusted investment income and risk- adjusted total return while ensuring that the assets and liabilities are managed on a cash flow and duration basis. The asset/liability management process is the shared responsibility of the Portfolio Management Unit, the Financial Management and Oversight Asset/ Liability Management Unit, and the operating business segments under the supervision of the various product line specific Asset/Liability Management Committees (“ALM Committees”). The ALM Committees’ duties include reviewing and approving target portfolios on a periodic basis, establishing investment guidelines and limits and providing oversight of the asset/liability management process. The portfolio managers and asset sector specialists, who have responsibility on a day-to-day basis for risk management of their respective investing activities, implement the goals and objectives established by the ALM Committees. The Company establishes target asset portfolios for each major insurance product, which represent the investment strategies used to profitably fund its liabilities within acceptable levels of risk. These strategies are monitored through regular review of portfolio metrics, such as effective duration, yield curve sensitivity, convexity, liquidity, asset sector concentration and credit quality. In executing these asset/ liability matching strategies, management regularly reevaluates the estimates used in determining the approximate amounts and timing of payments to or on behalf of policyholders for insurance liabilities. Many of these estimates are inherently subjective and could impact the Company’s ability to achieve its asset/liability management goals and objectives. Liquidity Liquidity refers to a company’s ability to generate adequate amounts of cash to meet its needs. The Company’s liquidity position (cash and cash equivalents and short-term investments, excluding securities lending) was $12.3 billion and $7.7 billion at December 31, 2007 and 2006, respectively. Liquidity needs are determined from a rolling 12-month forecast by portfolio and are monitored daily. Asset mix and maturities are adjusted based on forecast. Cash flow testing and stress testing provide additional perspectives on liquidity. The Company believes that it has sufficient liquidity to fund its cash needs under various scenarios that include the potential risk of early contractholder and policyholder withdrawal. The Company includes provisions limiting withdrawal rights on many of its products, including general account institutional pension products (generally group annuities, including GICs, and certain deposit fund liabilities) sold to employee benefit plan sponsors. Certain of these provisions prevent the customer from making withdrawals prior to the maturity date of the product. In the event of significant unanticipated cash requirements beyond normal liquidity, the Company has multiple alternatives available based on market conditions and the amount and timing of the liquidity need. These options include cash flows from operations, the sale of liquid assets, global funding sources and various credit facilities. The Company’s ability to sell investment assets could be limited by accounting rules including rules relating to the intent and ability to hold impaired securities until the market value of those securities recovers. In extreme circumstances, all general account assets within a statutory legal entity are available to fund any obligation of the general account within that legal entity. A disruption in the financial markets could limit the Holding Company’s access to or cost of liquidity. Liquidity Sources Cash Flows from Operations. The Company’s principal cash inflows from its insurance activities come from insurance premiums, annuity considerations and deposit funds. A primary liquidity concern with respect to these cash inflows is the risk of early contractholder and policyholder withdrawal. The Company’s principal cash inflows from its investment activities come from repayments of principal, proceeds from maturities and sales of invested assets and investment income. The primary liquidity concerns with respect to these cash inflows are the risk of default by debtors and market volatilities. The Company closely monitors and manages these risks through its credit risk management process. Liquid Assets. An integral part of the Company’s liquidity management is the amount of liquid assets it holds. Liquid assets include cash, cash equivalents, short-term investments, and marketable fixed maturity and equity securities. Liquid assets exclude assets relating to securities lending activities. At December 31, 2007 and 2006, the Company had $188.4 billion and $186.5 billion in liquid assets, respectively. Global Funding Sources. Liquidity is also provided by a variety of both short-term and long-term instruments, including repurchase agreements, commercial paper, medium- and long-term debt, junior subordinated debt securities, shares subject to mandatory redemp- tion, capital securities and stockholders’ equity. The diversity of the Company’s funding sources enhances funding flexibility, limits dependence on any one source of funds and generally lowers the cost of funds. At December 31, 2007 and 2006, the Company had outstanding $667 million and $1.4 billion in short-term debt, respectively, and at December 31, 2007 and 2006, had outstanding $9.6 billion and $9.1 billion in long-term debt, respectively. At December 31, 2007 and 2006, the Company had outstanding $5.7 billion and $850 million in collateral financing arrangements, respectively. At December 31, 2007 43MetLife, Inc.
  • 48.
    and 2006, theCompany had outstanding $4.5 billion and $3.8 billion, respectively, in junior subordinated debt and $159 million and $278 million, respectively, in shares subject to mandatory redemption. Debt Issuances. In December 2007, MetLife Capital Trust IV (“Trust IV”), a variable interest entity (“VIE”) consolidated by the Company, issued exchangeable surplus trust securities (the “Trust Securities”) with a face amount of $700 million and a discount of $6 million ($694 million). The Trust Securities will be exchanged into a like amount of Holding Company junior subordinated debentures on December 15, 2037, the scheduled redemption date; mandatorily under certain circumstances; and at any time upon the Holding Company exercising its option to redeem the securities. The Trust Securities will be exchanged for junior subordinated debentures prior to repayment. The final maturity of the debentures is December 15, 2067. The Holding Company may cause the redemption of the Trust Securities or debentures (i) in whole or in part, at any time on or after December 15, 2032 at their principal amount plus accrued and unpaid interest to the date of redemption, or (ii) in certain circumstances, in whole or in part, prior to December 15, 2032 at their principal amount plus accrued and unpaid interest to the date of redemption or, if greater, a make-whole price. Interest on the Trust Securities or debentures is payable semi-annually at a fixed rate of 7.875% up to, but not including, December 15, 2037, the scheduled redemption date. In the event the Trust Securities or debentures are not redeemed on or before the scheduled redemption date, interest will accrue at an annual rate of 3-month LIBOR plus a margin equal to 3.96%, payable quarterly in arrears. The Holding Company has the right to, and in certain circumstances the requirement to, defer interest payments on the Trust Securities or debentures for a period up to ten years. Interest compounds during such periods of deferral. If interest is deferred for more than five consecutive years, the Holding Company may be required to use proceeds from the sale of its common stock or warrants on common stock to satisfy its obligation. In connection with the issuance of the Trust Securities, the Holding Company entered into a replacement capital covenant (“RCC”). As a part of the RCC, the Holding Company agreed that it will not repay, redeem, or purchase the debentures on or before December 15, 2057, unless, subject to certain limitations, it has received proceeds from the sale of specified capital securities. The RCC will terminate upon the occurrence of certain events, including an acceleration of the debentures due to the occurrence of an event of default. The RCC is not intended for the benefit of holders of the debentures and may not be enforced by them. The RCC is for the benefit of holders of one or more other designated series of its indebtedness (which will initially be its 5.70% senior notes due June 15, 2035). The Holding Company also entered into a replacement capital obligation which will commence in 2037 and under which the Holding Company must use reasonable commercial efforts to raise replacement capital through the issuance of certain qualifying capital securities. In December 2007, MLIC reinsured a portion of its closed block liabilities to MetLife Reinsurance Company of Charleston (“MRC”), a wholly-owned subsidiary of the Company. In connection with this transaction, MRC issued, to investors placed by an unaffiliated financial institution, $2.5 billion of 35-year surplus notes to provide statutory reserve support for the assumed closed block liabilities. Interest on the surplus notes accrues at an annual rate of 3-month LIBOR plus 55 basis points, payable quarterly. The ability of MRC to make interest and principal payments on the surplus notes is contingent upon South Carolina regulatory approval. Simultaneous with issuing the surplus notes, the Holding Company entered into an agreement with the unaffiliated financial institution, under which the Holding Company is entitled to the interest paid by MRC on the surplus notes of 3-month LIBOR plus 55 basis points in exchange for the payment of 3-month LIBOR plus 112 basis points, payable quarterly. Under this agreement, the Holding Company may also be required to make payments to the unaffiliated financial institution related to any decline in the market value of the surplus notes and in connection with any early termination of this agreement. A majority of the proceeds from the offering of the surplus notes were placed in trust to support MRC’s statutory obligations associated with the assumed closed block liabilities. The trust is a VIE which is consolidated by the Company. At December 31, 2007, the Company held assets in trust of $1.9 billion associated with the transaction. In May 2007, the Holding Company and MetLife Reinsurance Company of South Carolina (“MRSC”), a wholly-owned subsidiary of the Company, entered into a 30-year collateral financing arrangement with an unaffiliated financial institution that provides up to $3.5 billion of statutory reserve support for MRSC associated with reinsurance obligations under intercompany reinsurance agreements. Such statutory reserves are associated with universal life secondary guarantees and are required under U.S. Valuation of Life Policies Model Regulation (commonly referred to as Regulation A-XXX). At December 31, 2007, $2.4 billion had been drawn upon under the collateral financing arrangement. The collateral financing arrangement may be extended by agreement of the Holding Company and the unaffiliated financial institution on each anniversary of the closing. Proceeds from the collateral financing arrangement were placed in trust to support MRSC’s statutory obligations associated with the reinsurance of secondary guarantees. The trust is a VIE which is consolidated by the Company. The unaffiliated financial institution is entitled to the return on the investment portfolio held by the trust. Simultaneous with entering into the collateral financing arrangement, the Holding Company entered into an agreement with the same unaffiliated financial institution under which the Holding Company is entitled to the return on the investment portfolio held by the trust established in connection with this collateral financing arrangement in exchange for the payment of a stated rate of return to the unaffiliated financial institution of 3-month LIBOR plus 70 basis points, payable quarterly. The Holding Company may also be required to make payments to the unaffiliated financial institution, for deposit into the trust, related to any decline in the market value of the assets held by the trust, as well as amounts outstanding upon maturity or early termination of the collateral financing arrangement. At December 31, 2007, the Company held assets in trust of $2.3 billion associated with this transaction. In March 2007, RGA issued $300 million of 10-year senior notes with a fixed rate of 5.625%, payable semiannually. RGA used $50 million of the net proceeds of the offering to repay existing debt during the year ended December 31, 2007. In December 2006, the Holding Company issued junior subordinated debentures with a face amount of $1.25 billion. The debentures are scheduled for redemption on December 15, 2036; the final maturity of the debentures is December 15, 2066. The Holding Company may redeem the debentures (i) in whole or in part, at any time on or after December 15, 2031 at their principal amount plus accrued and unpaid interest to the date of redemption, or (ii) in certain circumstances, in whole or in part, prior to December 15, 2031 at their principal amount plus accrued and unpaid interest to the date of redemption or, if greater, a make-whole price. Interest is payable semi-annually at a fixed rate of 6.40% up to, but not including, December 15, 2036, the scheduled redemption date. In the event the debentures are not redeemed on or before the scheduled redemption date, interest will accrue at an annual rate of 3-month LIBOR plus a margin equal to 2.205%, payable quarterly in arrears. The Holding Company has the right to, and in certain circumstances the requirement to, defer interest payments on the debentures for a period up to ten years. Interest compounds during such periods of deferral. If interest is deferred for more than five consecutive years, the Holding Company may be required to use proceeds from the sale of its common stock or warrants on common stock to satisfy its obligation. In connection with the issuance of the debentures, the Holding Company entered into a RCC. As 44 MetLife, Inc.
  • 49.
    part of theRCC, the Holding Company agreed that it will not repay, redeem, or purchase the debentures on or before December 15, 2056, unless, subject to certain limitations, it has received proceeds from the sale of specified capital securities. The RCC will terminate upon the occurrence of certain events, including an acceleration of the debentures due to the occurrence of an event of default. The RCC is not intended for the benefit of holders of the debentures and may not be enforced by them. The RCC is for the benefit of holders of one or more other designated series of its indebtedness (which will initially be its 5.70% senior notes due June 15, 2035). The Holding Company also entered into a replacement capital obligation which will commence in 2036 and under which the Holding Company must use reasonable commercial efforts to raise replacement capital through the issuance of certain qualifying capital securities. In June 2006, Timberlake Financial L.L.C., (“Timberlake Financial”), a subsidiary of RGA, completed an offering of $850 million of Series A Floating Rate Insured Notes due June 2036 in a private placement. Interest on the notes accrues at an annual rate of 1-month LIBOR plus 29 basis points payable monthly. The payment of interest and principal on the notes is insured through a financial guaranty insurance policy with a third party. The notes represent senior, secured indebtedness of Timberlake Financial with no recourse to RGA or its other subsidiaries. Up to $150 million of additional notes may be offered in the future. In order to make payments of principal and interest on the notes, Timberlake Financial will rely upon the receipt of interest and principal payments on surplus note and dividend payments from its wholly-owned subsidiary, Timberlake Reinsurance Company II (“Timberlake Re”), a South Carolina captive insurance company. The ability of Timberlake Re to make interest and principal payments on the surplus note and dividend payments to Timberlake Financial is contingent upon South Carolina regulatory approval and the performance of specified term life insurance policies with guaranteed level premiums retroceded by RGA’s subsidiary, RGA Reinsurance Company (“RGA Reinsurance”), to Timberlake Re. Proceeds from the offering of the notes, along with a $113 million direct investment by RGA, collateralize the notes and are not available to satisfy the general obligations of RGA or the Company. Most of these assets were placed in a trust and provide long-term collateral as support for statutory reserves required by U.S. Valuation of Life Policies Model Regulation (commonly referred to as Regulation XXX) on term life insurance policies with guaranteed level premium periods reinsured by RGA Reinsurance. The trust is consolidated by Timberlake Re which in-turn is consolidated by Timberlake Financial. Timberlake Financial is considered to be a VIE and RGA is considered to be the primary beneficiary. As such, the results of Timberlake Financial have been consolidated by RGA and ultimately by the Company. At December 31, 2007, the Company held assets in trust of $899 million associated with the transaction. In addition the Company held $50 million in custody as of December 31, 2007. MetLife Bank has entered into several repurchase agreements with the Federal Home Loan Bank of New York (the “FHLB of NY”) whereby MetLife Bank has issued repurchase agreements in exchange for cash and for which the FHLB of NY has been granted a blanket lien on MetLife Bank’s residential mortgages and mortgage-backed securities to collateralize MetLife Bank’s obligations under the repurchase agreements. The repurchase agreements and the related security agreement represented by this blanket lien provide that upon any event of default by MetLife Bank, the FHLB of NY’s recovery is limited to the amount of MetLife Bank’s liability under the outstanding repurchase agreements. During the years ended December 31, 2007, 2006, and 2005, MetLife Bank received advances totaling $390 million, $260 million and $775 million, respectively, from the FHLB of NY, which were included in long-term debt. MetLife Bank also made repayments of $175 million, $117 million and $25 million to the FHLB of NY during the years ended December 31, 2007, 2006 and 2005, respectively. The amount of the Company’s liability for repurchase agreements with the FHLB of NY was $1.2 billion and $998 million at December 31, 2007 and 2006, respectively, which is included in long-term debt. In December 2005, RGA issued junior subordinated debentures with a face amount of $400 million. Interest is payable semi-annually at a fixed rate of 6.75% up to but not including the scheduled redemption date, December 15, 2015. The debentures may be redeemed (i) in whole or in part, at any time on or after December 15, 2015 at their principal amount plus accrued and unpaid interest to the date of redemption, or (ii) in whole or in part, prior to December 15, 2015 at their principal amount plus accrued and unpaid interest to the date of redemption or, if greater, a make-whole price. In the event the debentures are not redeemed on or before the scheduled redemption date of December 15, 2015, interest on these debentures will accrue at an annual rate of 3-month LIBOR plus a margin equal to 2.665%, payable quarterly in arrears. The final maturity of the debentures is December 15, 2065. RGA has the right to, and in certain circumstances the requirement to, defer interest payments on the debentures for a period up to ten years. Upon an optional or mandatory deferral of interest payments, RGA is generally not permitted to pay common stock dividends or make payments of interest or principal on securities which rank equal or junior to the subordinated debentures, until the accrued and unpaid interest on the subordinated debentures is paid. Interest compounds during periods of deferral. In June 2005, the Company issued, in connection with the common equity units more fully described in “— Liquidity and Capital Resources — The Holding Company — Liquidity Sources — Common Equity Units”, $1,067 million 4.82% Series A and $1,067 million 4.91% Series B junior subordinated debentures due no later than February 15, 2039 and February 15, 2040, respectively, for a total of $2,134 million. In June 2005, the Holding Company issued 400 million pounds sterling ($729.2 million at issuance) aggregate principal amount of 5.25% senior notes due June 29, 2020 at a discount of 4.5 million pounds sterling ($8.1 million at issuance), for aggregate proceeds of 395.5 million pounds sterling ($721.1 million at issuance). The senior notes were initially offered and sold outside the United States in reliance upon Regulation S under the Securities Act of 1933, as amended (the “Securities Act”). In June 2005, the Holding Company issued $1.0 billion aggregate principal amount of 5.00% senior notes due June 15, 2015 at a discount of $2.7 million ($997.3 million), and $1.0 billion aggregate principal amount of 5.70% senior notes due June 15, 2035 at a discount of $2.4 million ($997.6 million). MetLife Funding, Inc. (“MetLife Funding”), a subsidiary of MLIC, serves as a centralized finance unit for the Company. Pursuant to a support agreement, MLIC has agreed to cause MetLife Funding to have a tangible net worth of at least one dollar. At December 31, 2007 and 2006, MetLife Funding had a tangible net worth of $12 million and $11 million, respectively. MetLife Funding raises cash from various funding sources and uses the proceeds to extend loans, through MetLife Credit Corp., another subsidiary of MLIC, to the Holding Company, MLIC and other affiliates. MetLife Funding manages its funding sources to enhance the financial flexibility and liquidity of MLIC and other affiliated companies. At December 31, 2007 and 2006, MetLife Funding had total outstanding liabilities, including accrued interest payable, of $358 million and $840 million, respectively, consisting primarily of commercial paper. Credit Facilities. The Company maintains committed and unsecured credit facilities aggregating $4.0 billion as of December 31, 2007. When drawn upon, these facilities bear interest at varying rates in accordance with the respective agreements. The facilities can be used 45MetLife, Inc.
  • 50.
    for general corporatepurposes and at December 31, 2007, $3.0 billion of the facilities also served as back-up lines of credit for the Company’s commercial paper programs. Information on these credit facilities as of December 31, 2007 is as follows: Borrower(s) Expiration Capacity Letter of Credit Issuances Drawdowns Unused Commitments (In millions) MetLife, Inc. and MetLife Funding, Inc. . . . . . . June 2012 (1) $3,000 $1,532 $— $1,468 MetLife Bank, N.A. . . . . . . . . . . . . . . . . . . . July 2008 (2) 200 — — 200 Reinsurance Group of America, Incorporated . . May 2008 30 — 30 — Reinsurance Group of America, Incorporated . . September 2012(3) 750 406 — 344 Reinsurance Group of America, Incorporated . . March 2011 44 — — 44 Total . . . . . . . . . . . . . . . . . . . . . . . . . . . $4,024 $1,938 $30 $2,056 (1) In June 2007, the Holding Company and MetLife Funding entered into a $3.0 billion credit agreement with various financial institutions, the proceeds of which are available to be used for general corporate purposes, to support their commercial paper programs and for the issuance of letters of credit. All borrowings under the credit agreement must be repaid by June 2012, except that letters of credit outstanding upon termination may remain outstanding until June 2013. The borrowers and the lenders under this facility may agree to extend the term of all or part of the facility to no later than June 2014, except that letters of credit outstanding upon termination may remain outstanding until June 2015. The $1.5 billion credit agreement, with an April 2009 expiration, and the $1.5 billion credit agreement, with an April 2010 expiration, were both terminated in June 2007 and replaced by the aforementioned facility. (2) In July 2007, the facility was extended for one year to July 2008. (3) In September 2007, RGA and certain of its subsidiaries entered into a credit agreement with various financial institutions. Under the credit agreement, RGA may borrow and obtain letters of credit for general corporate purposes for its own account or for the account of its subsidiaries with an overall credit facility amount of up to $750 million. The credit agreement replaced a former credit agreement in the amount of $600 million which was scheduled to expire on September 29, 2010. Committed Facilities. Information on committed facilities as of December 31, 2007 is as follows: Account Party/Borrower(s) Expiration Capacity Drawdowns Letter of Credit Issuances Unused Commitments Maturity (Years) (In millions) Exeter Reassurance Company Ltd., MetLife, Inc., & Missouri Re . . . . . . . . . . . . . June 2016 (1) $ 500 $ — $ 490 $ 10 8 Exeter Reassurance Company Ltd. . . . . . . . . . December 2027 (2) 650 — 410 240 20 Timberlake Financial L.L.C. . . . . . . . . . . . . . . June 2036 (3) 1,000 850 — 150 29 MetLife Reinsurance Company of South Carolina & MetLife, Inc. . . . . . . . . . . . June 2037 (4) 3,500 2,382 — 1,118 30 MetLife Reinsurance Company of Vermont & MetLife, Inc. . . . . . . . . . . . . . . . December 2037 (2),(5) 2,896 — 1,235 1,661 30 Total . . . . . . . . . . . . . . . . . . . . . . . . . . . . $8,546 $3,232 $2,135 $3,179 (1) Letters of credit and replacements or renewals thereof issued under this facility of $280 million, $10 million and $200 million are set to expire no later than December 2015, March 2016 and June 2016, respectively. (2) The Holding Company is a guarantor under this agreement. (3) As described under “— Liquidity and Capital Resources — The Company — Liquidity Sources — Debt Issuances”, RGA may, at its option, offer up to $150 million of additional notes under this facility in the future. (4) In May 2007, MRSC terminated the $2.0 billion amended and restated five-year letter of credit and reimbursement agreement entered into among the Holding Company, MRSC and various financial institutions on April 25, 2005. In its place the Company entered into a 30-year collateral financing arrangement as described under “Liquidity Sources — Debt Issuances”, which may be extended by agreement of the Company and the financial institution on each anniversary of the closing of the facility for an additional one-year period. At December 31, 2007, $2.4 billion had been drawn upon under the collateral financing arrangement. (5) In December 2007, Exeter Reassurance Company Ltd. (“Exeter”) terminated four letters of credit, with expirations from March 2025 through December 2026, that were issued under a letter of credit facility with an unaffiliated financial institution in an aggregate amount of $1.7 billion. The letters of credit had served as collateral for Exeter’s obligations under a reinsurance agreement that was recaptured by MetLife Investors USA Insurance Company (“MLI-USA”) in December 2007. MLI-USA immediately thereafter entered into a new reinsurance agreement with MetLife Reinsurance Company of Vermont (“MRV”). To collateralize its reinsurance obligations, MRV and the Holding Company entered into a 30-year, $2.9 billion letter of credit facility with an unaffiliated financial institution. Letters of Credit. At December 31, 2007, the Company had outstanding $4.2 billion in letters of credit, all of which are associated with the aforementioned credit facilities, from various financial institutions, of which $2.1 billion and $1.9 billion were part of committed and credit facilities, respectively. As commitments associated with letters of credit and financing arrangements may expire unused, these amounts do not necessarily reflect the Company’s actual future cash funding requirements. 46 MetLife, Inc.
  • 51.
    Liquidity Uses Debt Repayments.On October 31, 2007, the Company redeemed $125 million of 8.525% GenAmerica Capital I Capital Securities which were due to mature on June 30, 2027. As a result of this repayment, the Company recognized additional interest expense of $10 million. During the year ended December 31, 2007, RGA repaid $50 million of long-term debt using the proceeds from its March 2007 10-year senior notes offering. See “— Liquidity and Capital Resources — The Company — Liquidity Sources — Debt Issuances” for further information. During the years ended December 31, 2007, 2006 and 2005, MetLife Bank made repayments of $175 million, $117 million and $25 million, respectively, to the FHLB of NY. See “— Liquidity and Capital Resources — The Company — Liquidity Sources — Debt Issuances” for further information. The Holding Company repaid a $500 million 5.25% senior note which matured in December 2006 and a $1,006 million 3.911% senior note which matured in May 2005.RGA repaid a $100 million 7.25% senior note which matured in April 2006. MLIC repaid a $250 million 7% surplus note which matured on November 1, 2005. Insurance Liabilities. The Company’s principal cash outflows primarily relate to the liabilities associated with its various life insurance, property and casualty, annuity and group pension products, operating expenses and income tax, as well as principal and interest on its outstanding debt obligations. Liabilities arising from its insurance activities primarily relate to benefit payments under the aforementioned products, as well as payments for policy surrenders, withdrawals and loans. Investment and Other. Additional cash outflows include those related to obligations of securities lending activities, investments in real estate, limited partnerships and joint ventures, as well as litigation-related liabilities. The following table summarizes the Company’s major contractual obligations as of December 31, 2007: Contractual Obligations Total Less Than One Year More Than One Year and Less Than Three Years More Than Three Years and Less Than Five Years More Than Five Years (In millions) Future policy benefits . . . . . . . . . . . . . . . . . . . (1) $288,837 $ 6,823 $ 9,471 $ 9,742 $262,801 Policyholder account balances . . . . . . . . . . . . . (2) 212,049 25,640 29,028 28,278 129,103 Other policyholder liabilities . . . . . . . . . . . . . . . (3) 10,592 8,322 93 112 2,065 Short-term debt . . . . . . . . . . . . . . . . . . . . . . (4) 667 667 — — — Long-term debt. . . . . . . . . . . . . . . . . . . . . . . (4) 16,832 975 1,797 2,330 11,730 Collateral financing arrangements . . . . . . . . . . . (4) 12,800 301 603 660 11,236 Junior subordinated debt securities . . . . . . . . . . (4) 8,758 1,314 1,398 324 5,722 Shares subject to mandatory redemption . . . . . . (4) 785 13 26 26 720 Payables for collateral under securities loaned and other transactions . . . . . . . . . . . . . . . . . (5) 44,136 44,136 — — — Commitments to lend funds . . . . . . . . . . . . . . . (6) 10,559 8,063 1,141 639 716 Operating leases . . . . . . . . . . . . . . . . . . . . . . (7) 2,167 254 442 316 1,155 Other . . . . . . . . . . . . . . . . . . . . . . . . . . . . . (8) 8,278 7,711 6 6 555 Total . . . . . . . . . . . . . . . . . . . . . . . . . . . . $616,460 $104,219 $44,005 $42,433 $425,803 (1) Future policyholder benefits include liabilities related to traditional whole life policies, term life policies, closeout and other group annuity contracts, structured settlements, MTF agreements, single premium immediate annuities, long-term disability policies, individual disability income policies, LTC policies and property and casualty contracts. Included within future policyholder benefits are contracts where the Company is currently making payments and will continue to do so until the occurrence of a specific event such as death as well as those where the timing of a portion of the payments has been determined by the contract. Also included are contracts where the Company is not currently making payments and will not make payments until the occurrence of an insurable event, such as death or illness, or where the occurrence of the payment triggering event, such as a surrender of a policy or contract, is outside the control of the Company. The Company has estimated the timing of the cash flows related to these contracts based on historical experience as well as its expectation of future payment patterns. Liabilities related to accounting conventions, or which are not contractually due, such as shadow liabilities, excess interest reserves and property and casualty loss adjustment expenses, of $1.1 billion have been excluded from amounts presented in the table above. Amounts presented in the table above, excluding those related to property and casualty contracts, represent the estimated cash payments for benefits under such contracts including assumptions related to the receipt of future premiums and assumptions related to mortality, morbidity, policy lapse, renewal, retirement, inflation, disability incidence, disability terminations, policy loans and other contingent events as appropriate to the respective product type. Payments for case reserve liabilities and incurred but not reported liabilities associated with property and casualty contracts of $1.6 billion have been included using an estimate of the ultimate amount to be settled under the policies based upon historical payment patterns. The ultimate amount to be paid under property and casualty contracts is not determined until the Company reaches a settlement with the claimant, which may vary significantly from the liability or contractual obligation presented above especially as it relates to incurred but not reported liabilities. All estimated cash payments presented in the table above are undiscounted as to interest, net of estimated future premiums on policies currently in-force and gross of any reinsurance recoverable. The more than five years category displays estimated payments due for periods extending for more than 100 years from the present date. The sum of the estimated cash flows shown for all years in the table of $288.8 billion exceeds the liability amount of $132.3 billion included on the consolidated balance sheet principally due to the time value of money, which accounts for at least 80% of the 47MetLife, Inc.
  • 52.
    difference, as wellas differences in assumptions, most significantly mortality, between the date the liabilities were initially established and the current date. For the majority of the Company’s insurance operations, estimated contractual obligations for future policyholder benefits and policyholder account balance liabilities as presented in the table above are derived from the annual asset adequacy analysis used to develop actuarial opinions of statutory reserve adequacy for state regulatory purposes. These cash flows are materially repre- sentative of the cash flows under generally accepted accounting principles. Actual cash payments to policyholders may differ significantly from the liabilities as presented in the consolidated balance sheet and the estimated cash payments as presented in the table above due to differences between actual experience and the assumptions used in the establishment of these liabilities and the estimation of these cash payments. See “— Liquidity and Capital Resources — The Company — Asset/Liability Management.” (2) Policyholder account balances include liabilities related to conventional guaranteed investment contracts, guaranteed investment contracts associated with formal offering programs, funding agreements, individual and group annuities, total control accounts, bank deposits, individual and group universal life, variable universal life and company-owned life insurance. Included within policyholder account balances are contracts where the amount and timing of the payment is essentially fixed and determinable. These amounts relate to policies where the Company is currently making payments and will continue to do so, as well as those where the timing of the payments has been determined by the contract. Other contracts involve payment obligations where the timing of future payments is uncertain and where the Company is not currently making payments and will not make payments until the occurrence of an insurable event, such as death, or where the occurrence of the payment triggering event, such as a surrender of or partial withdrawal on a policy or deposit contract, is outside the control of the Company. The Company has estimated the timing of the cash flows related to these contracts based on historical experience as well as its expectation of future payment patterns. Excess interest reserves representing purchase accounting adjustments of $794 million have been excluded from amounts presented in the table above as they represent an accounting convention and not a contractual obligation. Amounts presented in the table above represent the estimated cash payments to be made to policyholders undiscounted as to interest and including assumptions related to the receipt of future premiums and deposits; withdrawals, including unscheduled or partial withdrawals; policy lapses; surrender charges; annuitization; mortality; future interest credited; policy loans and other contingent events as appropriate to the respective product type. Such estimated cash payments are also presented net of estimated future premiums on policies currently in-force and gross of any reinsurance recoverable. For obligations denominated in foreign currencies, cash payments have been estimated using current spot rates. The sum of the estimated cash flows shown for all years in the table of $212.0 billion exceeds the liability amount of $137.3 billion included on the consolidated balance sheet principally due to the time value of money, which accounts for at least 80% of the difference, as well as differences in assumptions between the date the liabilities were initially established and the current date. See also comments under footnote 1 regarding the source and uncertainties associated with the estimation of the contractual obligations related to future policyholder benefits and policyholder account balances. (3) Other policyholder liabilities is comprised of other policyholder funds, policyholder dividends payable and the policyholder dividend obligation. Amounts included in the table above related to these liabilities are as follows: (a) Other policyholder funds includes liabilities for incurred but not reported claims and claims payable on group term life, long-term disability, LTC and dental; policyholder dividends left on deposit and policyholder dividends due and unpaid related primarily to traditional life and group life and health; and premiums received in advance. Liabilities related to unearned revenue of $2.0 billion have been excluded from the cash payments presented in the table above because they reflect an accounting convention and not a contractual obligation. With the exception of policyholder dividends left on deposit, and those items excluded as noted in the preceding sentence, the contractual obligation presented in the table above related to other policyholder funds is equal to the liability reflected in the consolidated balance sheet. Such amounts are reported in the less than one year category due to the short- term nature of the liabilities. Contractual obligations on policyholder dividends left on deposit are projected based on assumptions of policyholder withdrawal activity. (b) Policyholder dividends payable consists of liabilities related to dividends payable in the following calendar year on participating policies. As such, the contractual obligation related to policyholder dividends payable is presented in the table above in the less than one year category at the amount of the liability presented in the consolidated balance sheet. (c) The nature of the policyholder dividend obligation is described in Note 9 of the Notes to Consolidated Financial Statements. Because the exact timing and amount of the ultimate policyholder dividend obligation is subject to significant uncertainty and the amount of the policyholder dividend obligation is based upon a long-term projection of the performance of the closed block, management has reflected the obligation at the amount of the liability presented in the consolidated balance sheet in the more than five years category. This was done to reflect the long-duration of the liability and the uncertainty of the ultimate cash payment. (4) Amounts presented in the table above for short-term debt, long-term debt, collateral financing arrangements, junior subordinated debt securities and shares subject to mandatory redemption differ from the balances presented on the consolidated balance sheet as the amounts presented in the table above do not include premiums or discounts upon issuance or purchase accounting fair value adjustments. The amounts presented above also include interest on such obligations as described below. Short-term debt consists principally of 90-day commercial paper, with a remaining maturity of 54 days, and carries a variable rate of interest. The contractual obligation for short-term debt presented in the table above represents the amounts due upon maturity of the commercial paper plus the related variable interest which is calculated using the prevailing rates at December 31, 2007 through the date of maturity without consideration of any further issuances of commercial paper upon maturity of the amounts outstanding at December 31, 2007. Long-term debt bears interest at fixed and variable interest rates through their respective maturity dates. Interest on fixed rate debt was computed using the stated rate on the obligations through maturity. Interest on variable rate debt is computed using prevailing rates at December 31, 2007 and, as such, does not consider the impact of future rate movements. Collateral financing arrangements bear interest at fixed and variable interest rates through their respective maturity dates. Interest on fixed rate debt was computed using the stated rate on the obligations through maturity. Interest on variable rate debt is computed using prevailing rates at December 31, 2007 and, as such, does not consider the impact of future rate movements. 48 MetLife, Inc.
  • 53.
    Junior subordinated debtbears interest at fixed interest rates through their respective redemption dates. Interest was computed using the stated rate on the obligation through the scheduled redemption date as it is the Company’s expectation that the debt will be redeemed at that time. Inclusion of interest payments on junior subordinated debt through the final maturity date would increase the contractual obligation by $6.2 billion. Shares subject to mandatory redemption bear interest at fixed interest rates through their respective mandatory redemption dates. Interest on shares subject to mandatory redemption was computed using the stated fixed rate on the obligation through maturity. Long-term debt also includes payments under capital lease obligations of $13 million, $15 million, $3 million and $24 million, in the less than one year, one to three years, three to five years and more than five years categories, respectively. (5) The Company has accepted cash collateral in connection with securities lending and derivative transactions. As the securities lending transactions expire within the next year or the timing of the return of the collateral is uncertain, the return of the collateral has been included in the less than one year category in the table above. The Company also holds non-cash collateral, which is not reflected as a liability in the consolidated balance sheet, of $718 million as of December 31, 2007. (6) The Company commits to lend funds under mortgage loans, partnerships, bank credit facilities, bridge loans and private corporate bond investments. In the table above, the timing of the funding of mortgage loans and private corporate bond investments is based on the expiration date of the commitment. As it relates to commitments to lend funds to partnerships and under bank credit facilities, the Company anticipates that these amounts could be invested any time over the next five years; however, as the timing of the fulfillment of the obligation cannot be predicted, such obligations are presented in the less than one year category in the table above. Commitments to fund bridge loans are short-term obligations and, as a result, are presented in the less than one year category in the table above. See “— Off-Balance Sheet Arrangements.” (7) As a lessee, the Company has various operating leases, primarily for office space. Contractual provisions exist that could increase or accelerate those leases obligations presented, including various leases with early buyouts and/or escalation clauses. However, the impact of any such transactions would not be material to the Company’s financial position or results of operations. See “— Off-Balance Sheet Arrangements.” (8) Other includes those other liability balances which represent contractual obligations, as well as other miscellaneous contractual obligations of $32 million not included elsewhere in the table above. Other liabilities presented in the table above is principally comprised of amounts due under reinsurance arrangements, payables related to securities purchased but not yet settled, securities sold short, accrued interest on debt obligations, fair value of derivative obligations, deferred compensation arrangements, guaranty liabilities, the fair value of forward stock purchase contracts, as well as general accruals and accounts payable due under contractual obligations. If the timing of any of the other liabilities is sufficiently uncertain, the amounts are included within the less than one year category. The other liabilities presented in the table above differs from the amount presented in the consolidated balance sheet by $6.1 billion due primarily to the exclusion of items such as minority interests, legal liabilities, pension and postretirement benefit obligations, taxes due other than income tax, unrecognized tax benefits and related accrued interest, accrued severance and employee incentive compensation and other liabilities such as deferred gains and losses. Such items have been excluded from the table above as they represent accounting conventions or are not liabilities due under contractual obligations. The net funded status of the Company’s pension and other postretirement liabilities included within other liabilities has been excluded from the amounts presented in the table above. Rather, the amounts presented represent the discretionary contributions of $150 million to be made by the Company to the pension plan in 2008 and the discretionary contributions of $116 million, based on the next year’s expected gross benefit payments to participants, to be made by the Company to the postretirement benefit plans during 2008. Virtually all contributions to the pension and postretirement benefit plans are made by the insurance subsidiaries of the Holding Company with little impact on the Holding Company’s cash flows. Excluded from the table above are deferred income tax liabilities, unrecognized tax benefits, and accrued interest of $2.5 billion, $1.0 billion, and $252 million, respectively, for which the Company cannot reliably determine the timing of payment. Current income tax payable is also excluded from the table. See also “— Off-Balance Sheet Arrangements.” Separate account liabilities are excluded from the table above. Separate account liabilities represent the fair market value of the funds that are separately administered by the Company. Generally, the separate account owner, rather than the Company, bears the investment risk of these funds. The separate account liabilities are legally segregated and are not subject to the claims that arise out of any other business of the Company. Net deposits, net investment income and realized and unrealized capital gains and losses on the separate accounts are not reflected in the consolidated statements of income. The separate account liabilities will be fully funded by cash flows from the separate account assets. The Company also enters into agreements to purchase goods and services in the normal course of business; however, these purchase obligations are not material to its consolidated results of operations or financial position as of December 31, 2007. Additionally, the Company has agreements in place for services it conducts, generally at cost, between subsidiaries relating to insurance, reinsurance, loans, and capitalization. Intercompany transactions have appropriately been eliminated in consolidation. Inter- company transactions among insurance subsidiaries and affiliates have been approved by the appropriate departments of insurance as required. Support Agreements. The Holding Company and several of its subsidiaries (each, an “Obligor”) are parties to various capital support commitments, guarantees and contingent reinsurance agreements with certain subsidiaries of the Holding Company and a corporation in which the Holding Company owns 50% of the equity. Under these arrangements, each Obligor, with respect to the applicable entity, has agreed to cause such entity to meet specified capital and surplus levels, has guaranteed certain contractual obligations or has agreed to provide, upon the occurrence of certain contingencies, reinsurance for such entity’s insurance liabilities or for certain policies reinsured by such entity. Management does not anticipate that these arrangements will place any significant demands upon the Company’s liquidity resources. 49MetLife, Inc.
  • 54.
    Litigation. Putative orcertified class action litigation and other litigation, and claims and assessments against the Company, in addition to those discussed elsewhere herein and those otherwise provided for in the Company’s consolidated financial statements, have arisen in the course of the Company’s business, including, but not limited to, in connection with its activities as an insurer, employer, investor, investment advisor and taxpayer. Further, state insurance regulatory authorities and other federal and state authorities regularly make inquiries and conduct investigations concerning the Company’s compliance with applicable insurance and other laws and regulations. It is not possible to predict or determine the ultimate outcome of all pending investigations and legal proceedings or provide reasonable ranges of potential losses except as noted elsewhere herein in connection with specific matters. In some of the matters referred to herein, very large and/or indeterminate amounts, including punitive and treble damages, are sought. Although in light of these considerations, it is possible that an adverse outcome in certain cases could have a material adverse effect upon the Company’s financial position, based on information currently known by the Company’s management, in its opinion, the outcome of such pending investigations and legal proceedings are not likely to have such an effect. However, given the large and/or indeterminate amounts sought in certain of these matters and the inherent unpredictability of litigation, it is possible that an adverse outcome in certain matters could, from time to time, have a material adverse effect on the Company’s consolidated net income or cash flows in particular quarterly or annual periods. Other. Based on management’s analysis of its expected cash inflows from operating activities, the dividends it receives from subsidiaries, including MLIC, that are permitted to be paid without prior insurance regulatory approval and its portfolio of liquid assets and other anticipated cash flows, management believes there will be sufficient liquidity to enable the Company to make payments on debt, make cash dividend payments on its common and preferred stock, pay all operating expenses, and meet its cash needs. The nature of the Company’s diverse product portfolio and customer base lessens the likelihood that normal operations will result in any significant strain on liquidity. Consolidated Cash Flows. Net cash provided by operating activities increased by $3.4 billion to $10.0 billion for the year ended December 31, 2007 as compared to $6.6 billion for the year ended December 31, 2006 primarily due to higher net investment income and premiums, fees and other revenues. Net cash provided by operating activities decreased by $1.4 billion to $6.6 billion for the year ended December 31, 2006 as compared to $8.0 billion for the comparable 2005 period. The decrease in operating cash flows was primarily due to reinsurance receivables related to the sale of certain small market recordkeeping businesses. Partially offsetting the decrease was an increase in operating cash flows in 2006 over the comparable 2005 period primarily attributable to the acquisition of Travelers. Net cash provided by financing activities was $3.9 billion and $15.4 billion for the years ended December 31, 2007 and 2006, respectively. Accordingly, net cash provided by financing activities decreased by $11.5 billion for the year ended December 31, 2007 as compared to the prior year. Net cash provided by financing activities decreased primarily as a result of a decrease of $13.0 billion in the amount of securities lending cash collateral received in connection with the Company’s securities lending program and other cash collateral, $1.2 billion of an increase in shares acquired under the Company’s common stock repurchase program, a decrease in short- term debt borrowings of $0.8 billion and a decrease of $0.6 billion in net cash provided by policyholder account balances. In addition, net cash provided by financing activities was $0.5 billion lower than the comparable 2006 period due to the issuance of $0.7 billion of junior subordinated debt securities in 2007 as compared to $1.2 billion issued in 2006. These decreases were partially offset by an increase in the issuance of collateral financing arrangements of $4.0 billion and an increase in net issuances versus net repayments of long-term debt of $0.9 billion. Net cash provided by financing activities was $15.4 billion and $14.5 billion for the years ended December 31, 2006 and 2005, respectively. Accordingly, net cash provided by financing activities increased by $0.9 billion primarily as a result of an increase of $7.2 billion in the amount of securities lending cash collateral received in connection with the securities lending program, a decrease in long-term debt repayments of $0.7 billion, an increase in the issuance of collateral financing arrangements of $0.9 billion and an increase in short-term debt borrowings of $0.1 billion. Such increases were offset by decreases in financing cash flows resulting from a decrease in issuance of preferred stock, junior subordinated debt securities, and long-term debt aggregating $6.6 billion which were principally used to finance the acquisition of Travelers in 2005, combined with a decrease of $0.9 billion associated with a decrease in net policyholder account balance deposits and an increase of $0.5 billion of shares acquired under the Company’s common stock repurchase program which was resumed in the fourth quarter of 2006. Net cash used in investing activities was $10.6 billion and $18.9 billion for the years ended December 31, 2007 and 2006, respectively. Accordingly, net cash used in investing activities decreased by $8.3 billion for the year ended December 31, 2007 as compared to prior year. In the current year, cash available for the purchase of invested assets decreased by $11.5 billion as a result of the reduction in cash provided by financing activities discussed above. Also, partially offsetting this decrease was an increase of $3.4 billion in net cash provided by operating activities discussed above. The lower amount of cash available for investing activities resulted in a decrease in net purchases of fixed maturity securities of $15.9 billion, other invested assets of $1.4 billion, and a decrease in net origination of mortgage and consumer loans of $0.6 billion. This was partially offset by increases in the net purchases of real estate and real estate joint ventures of $6.3 billion, equity securities of $1.4 billion and other limited partnership interests of $0.8 billion. Also, there was a decrease in cash provided by short-term investments of $0.5 billion. In addition, the 2007 period includes the sale of MetLife Australia’s annuities and pension businesses and the acquisition of the remaining 50% interest in MetLife Fubon of $0.7 billion, while the 2006 period includes additional consideration paid related to purchases of businesses $0.1 billion. Net cash used in investing activities was $18.9 billion and $22.6 billion for the years ended December 31, 2006 and 2005, respectively. Accordingly, net cash used in investing activities decreased by $3.7 billion for the year ended December 31, 2006 as compared to prior year. Net cash used in investing activities in the prior year included cash used to acquire Travelers of $11.0 billion, less cash acquired of $0.9 billion for a net total cash paid of $10.1 billion, which was funded by $6.8 billion in securities issuances and $4.2 billion of cash provided by operations and the sale of invested assets. During the current year, cash available for investment as a result of cash collateral received in connection with the securities lending program increased by $7.2 billion. Cash available from operations and available for investment decreased by $1.4 billion. Cash available for the purchase of invested assets increased by $4.3 billion as a result of the increase in securities lending activities of $7.2 billion as well as a decrease in the cash required for acquisitions of $4.2 billion, offset by the decrease in issuance of preferred stock, junior subordinated debt securities, and long-term debt aggregating $6.6 billion as well as the 50 MetLife, Inc.
  • 55.
    decrease in cashflow from operations of $1.4 billion. Cash available for investing activities was used to increase purchases of fixed maturity securities, other invested assets, and short-term investments, as well as increase the origination of mortgage and consumer loans and decrease net sales of real estate and real estate joint ventures and equity securities. The Holding Company Capital Restrictions and Limitations on Bank Holding Companies and Financial Holding Companies — Capital. The Holding Company and its insured depository institution subsidiary, MetLife Bank, are subject to risk-based and leverage capital guidelines issued by the federal banking regulatory agencies for banks and financial holding companies. The federal banking regulatory agencies are required by law to take specific prompt corrective actions with respect to institutions that do not meet minimum capital standards. As of their most recently filed reports with the federal banking regulatory agencies, MetLife, Inc. and MetLife Bank met the minimum capital standards as per federal banking regulatory agencies with all of MetLife Bank’s risk-based and leverage capital ratios meeting the federal banking regulatory agencies’ “well capitalized” standards and all of MetLife, Inc.’s risk-based and leverage capital ratios meeting the “adequately capitalized” standards. The following table contains the RBC ratios and the regulatory requirements for MetLife, Inc., as a bank holding company, and MetLife Bank: MetLife, Inc. RBC Ratios — Bank Holding Company 2007 2006 Regulatory Requirements Minimum Regulatory Requirements “Well Capitalized” December 31, Total RBC Ratio . . . . . . . . . . . . . . . . . . . . . . . . . . . . . . . . . . 9.87% 9.89% 8.00% 10.00% Tier 1 RBC Ratio . . . . . . . . . . . . . . . . . . . . . . . . . . . . . . . . . . 9.56% 9.51% 4.00% 6.00% Tier 1 Leverage Ratio . . . . . . . . . . . . . . . . . . . . . . . . . . . . . . . 5.56% 5.55% 4.00% n/a MetLife Bank RBC Ratios — Bank 2007 2006 Regulatory Requirements Minimum Regulatory Requirements “Well Capitalized” December 31, Total RBC Ratio . . . . . . . . . . . . . . . . . . . . . . . . . . . . . . . . . 12.60% 11.44% 8.00% 10.00% Tier 1 RBC Ratio . . . . . . . . . . . . . . . . . . . . . . . . . . . . . . . . 12.03% 10.88% 4.00% 6.00% Tier 1 Leverage Ratio . . . . . . . . . . . . . . . . . . . . . . . . . . . . . 6.32% 5.98% 4.00% 5.00% Liquidity Liquidity is managed to preserve stable, reliable and cost-effective sources of cash to meet all current and future financial obligations and is provided by a variety of sources, including a portfolio of liquid assets, a diversified mix of short- and long-term funding sources from the wholesale financial markets and the ability to borrow through committed credit facilities. The Holding Company is an active participant in the global financial markets through which it obtains a significant amount of funding. These markets, which serve as cost-effective sources of funds, are critical components of the Holding Company’s liquidity management. Decisions to access these markets are based upon relative costs, prospective views of balance sheet growth and a targeted liquidity profile. A disruption in the financial markets could limit the Holding Company’s access to liquidity. The Holding Company’s ability to maintain regular access to competitively priced wholesale funds is fostered by its current high credit ratings from the major credit rating agencies. Management views its capital ratios, credit quality, stable and diverse earnings streams, diversity of liquidity sources and its liquidity monitoring procedures as critical to retaining high credit ratings. Liquidity is monitored through the use of internal liquidity risk metrics, including the composition and level of the liquid asset portfolio, timing differences in short-term cash flow obligations, access to the financial markets for capital and debt transactions and exposure to contingent draws on the Holding Company’s liquidity. Liquidity Sources Dividends. The primary source of the Holding Company’s liquidity is dividends it receives from its insurance subsidiaries. The Holding Company’s insurance subsidiaries are subject to regulatory restrictions on the payment of dividends imposed by the regulators of their respective domiciles. The dividend limitation for U.S. insurance subsidiaries is based on the surplus to policyholders as of the immediately preceding calendar year and statutory net gain from operations for the immediately preceding calendar year. Statutory accounting practices, as prescribed by insurance regulators of various states in which the Company conducts business, differ in certain respects from accounting principles used in financial statements prepared in conformity with GAAP. The significant differences relate to the treatment of DAC, certain deferred income tax, required investment reserves, reserve calculation assumptions, goodwill and surplus notes. Manage- ment of the Holding Company cannot provide assurances that the Holding Company’s insurance subsidiaries will have statutory earnings to support payment of dividends to the Holding Company in an amount sufficient to fund its cash requirements and pay cash dividends and that the applicable insurance departments will not disapprove any dividends that such insurance subsidiaries must submit for approval. 51MetLife, Inc.
  • 56.
    The table belowsets forth the dividends permitted to be paid by the respective insurance subsidiary without insurance regulatory approval and the respective dividends paid: Company Permitted w/o Approval(1) Paid(2) Permitted w/o Approval(3) Paid(2) Permitted w/o Approval(3) 200 8 2007 200 6 (In millions) Metropolitan Life Insurance Company . . . . . . . . . . . . $1,299 $500 $919 $ 863 $863 MetLife Insurance Company of Connecticut . . . . . . . . $1,026 $690 (5) $690 $ 917 (4) $ — Metropolitan Tower Life Insurance Company . . . . . . . . $ 113 $ — $104 $2,300 (6) $ 85 Metropolitan Property and Casualty Insurance Company . . . . . . . . . . . . . . . . . . . . . . . . . . . . . $ — $400 $ 16 $ 300 $178 (1) Reflects dividend amounts that may be paid during 2008 without prior regulatory approval. However, if paid before a specified date during 2008, some or all of such dividends may require regulatory approval. (2) Includes amounts paid including those requiring regulatory approval. (3) Reflects dividend amounts that could have been paid during the relevant year without prior regulatory approval. (4) Includes a return of capital of $259 million. (5) Includes a return of capital of $404 million as approved by the applicable insurance department, of which $350 million was paid to the Holding Company. (6) This dividend reflects the proceeds associated with the sale of Peter Cooper Village and Stuyvesant Town properties to be used for general corporate purposes. For the year ended December 31, 2007, $190 million in dividends from other subsidiaries were paid, of which $176 million were returns of capital, to the Holding Company. MetLife Mexico S.A. paid $116 million in dividends to the Holding Company for the year ended December 31, 2006. For the year ended December 31, 2006, there were returns of capital of $154 million to the Holding Company from other subsidiaries. Liquid Assets. An integral part of the Holding Company’s liquidity management is the amount of liquid assets it holds. Liquid assets include cash, cash equivalents, short-term investments and marketable fixed maturity securities. Liquid assets exclude assets relating to securities lending activities. At December 31, 2007 and 2006, the Holding Company had $2.3 billion and $3.9 billion in liquid assets, respectively. Global Funding Sources. Liquidity is also provided by a variety of both short-term and long-term instruments, commercial paper, medium- and long-term debt, junior subordinated debt securities, collateral financing arrangements, capital securities and stockholders’ equity. The diversity of the Holding Company’s funding sources enhances funding flexibility and limits dependence on any one source of funds and generally lowers the cost of funds. Other sources of the Holding Company’s liquidity include programs for short- and long-term borrowing, as needed. At December 31, 2007 and 2006, the Holding Company had $310 million and $616 million in short-term debt outstanding, respectively. At both December 31, 2007 and 2006, the Holding Company had $7.0 billion of unaffiliated long-term debt outstanding. At both December 31, 2007 and 2006, the Holding Company had $500 million of affiliated long-term debt outstanding. At both December 31, 2007 and 2006, the Holding Company had $3.4 billion of junior subordinated debt securities outstanding. At December 31, 2007, the Holding Company had $2.4 billion in collateral financing arrangements outstanding. The Holding Company did not have any collateral financing arrangements outstanding at December 31, 2006. In November 2007, the Holding Company filed a shelf registration statement (the “2007 Registration Statement”) with the SEC, which was automatically effective upon filing, in accordance with SEC rules which also allow for pay-as-you-go fees and the ability to add securities by filing automatically effective amendment for companies, such as the Holding Company, which qualify as “Well-Known Seasoned Issuers.” The 2007 Registration Statement registered an unlimited amount of debt and equity securities and supersedes the shelf registration statement that the Holding Company filed in April 2005. The terms of any offering will be established at the time of the offering. Debt Issuances. As described more fully in “— Liquidity and Capital Resources — The Company — Liquidity Sources — Debt Issuances”, during December 2007, Trust IV issued Trust Securities with a face amount of $700 million and a discount of $6 million ($694 million) and a fixed rate of interest of 7.875% up to, but not including, December 15, 2037, the scheduled redemption date. The beneficial interest of Trust IV held by the Holding Company is not represented by an investment in Trust IV but rather by a financing agreement between the Holding Company and Trust IV. The assets of Trust IV are $700 million of 7.375% surplus notes of MLIC, which are scheduled to mature December 15, 2037, and rights under the financing agreement. Under the financing agreement, the Holding Company has the obligation to make payments (i) semiannually at a fixed rate of 0.50% of the surplus notes outstanding and owned by Trust IV or if greater (ii) equal to the difference between the Trust Securities interest payment and the interest received by Trust IV on the surplus notes. The ability of MLIC to make interest and principal payments on the surplus notes to the Holding Company is contingent upon regulatory approval. The Trust Securities, will be exchanged into a like amount of Holding Company junior subordinated debentures on December 15, 2037, the scheduled redemption date; mandatorily under certain circumstances; and at any time upon the Holding Company exercising its option to redeem the securities. The Trust Securities will be exchanged for junior subordinated debentures prior to repayment and the Holding Company is ultimately responsible for repayment of the junior subordinated debentures. The Holding Company’s other rights and obligations as it relates to the deferral of interest, redemption, replacement capital obligation and replacement capital covenant associated with the issuance of the Trust Securities are more fully described in “— Liquidity and Capital Resources — The Company — Liquidity Sources — Debt Issuances.” 52 MetLife, Inc.
  • 57.
    As described morefully in “— Liquidity and Capital Resources — The Company — Liquidity Sources — Debt Issuances”: • In December 2007, the Holding Company, in connection with the collateral financing arrangement associated with MRC’s reinsurance of the closed block liabilities, entered into an agreement with an unaffiliated financial institution under which the Holding Company is entitled to the interest paid by MRC on the surplus notes of 3-month LIBOR plus 55 basis points in exchange for the payment of 3-month LIBOR plus 112 basis points, payable quarterly. Under this agreement, the Holding Company may also be required to make payments to the unaffiliated financial institution related to any decline in the market value of the surplus notes and in connection with any early termination of this agreement. The Holding Company’s net cost of 57 basis points has been allocated to MRC. For the year ended December 31, 2007, this amount was immaterial. • In May 2007, the Holding Company, in connection with the collateral financing arrangement associated with MRSC’s reinsurance of universal life secondary guarantees, entered into an agreement with an unaffiliated financial institution under which the Holding Company is entitled to the return on the investment portfolio held by the trust established in connection with this collateral financing arrangement in exchange for the payment of a stated rate of return to the unaffiliated financial institution of 3-month LIBOR plus 70 basis points, payable quarterly. The Holding Company may also be required to make payments to the unaffiliated financial institution, for deposit into the trust, related to any decline in the market value of the assets held by the trust, as well as amounts outstanding upon maturity or early termination of the collateral financing arrangement. As a result of this agreement, the Holding Company effectively assumed the $2.4 billion liability under the collateral financing arrangement along with a beneficial interest in the trust holding the associated assets. The Holding Company simultaneously contributed to MRSC its beneficial interest in the trust, along with any return to be received on the investment portfolio held by the trust. The Holding Company allocates the financing costs associated with the collateral financing arrangement to MRSC. In December 2006, the Holding Company issued junior subordinated debentures with a face amount of $1.25 billion. See “— Liquidity and Capital Resources — The Company — Liquidity Sources — Debt Issuances” for further information. In September 2006, the Holding Company issued $204 million of affiliated long-term debt with an interest rate of 6.07% maturing in 2016. In March 2006, the Holding Company issued $10 million of affiliated long-term debt with an interest rate of 5.70% maturing in 2016. In December 2005, the Holding Company issued $286 million of affiliated long-term debt with an interest rate of 5.24% maturing in 2015. In June 2005, the Holding Company issued $1.0 billion aggregate principal amount of 5.00% senior notes due June 15, 2015 at a discount of $2.7 million ($997.3 million), and $1.0 billion aggregate principal amount of 5.70% senior notes due June 15, 2035 at a discount of $2.4 million ($997.6 million). In June 2005, the Holding Company issued 400 million pounds sterling ($729.2 million at issuance) aggregate principal amount of 5.25% senior notes due June 29, 2020 at a discount of 4.5 million pounds sterling ($8.1 million at issuance), for aggregate proceeds of 395.5 million pounds sterling ($721.1 million at issuance). These notes were initially offered and sold outside the United States in reliance upon Regulation S under the Securities Act. The following table summarizes the Holding Company’s outstanding senior notes issuances, excluding any premium or discount: Issue Date Principal Interest Rate Maturity (In millions) June 2005 . . . . . . . . . . . . . . . . . . . . . . . . . . . . . . . . . . . . . . . . . . . . . . . . $1,000 5.00% 2015 June 2005 . . . . . . . . . . . . . . . . . . . . . . . . . . . . . . . . . . . . . . . . . . . . . . . . $1,000 5.70% 2035 June 2005(1) . . . . . . . . . . . . . . . . . . . . . . . . . . . . . . . . . . . . . . . . . . . . . . $ 794 5.25% 2020 December 2004(1) . . . . . . . . . . . . . . . . . . . . . . . . . . . . . . . . . . . . . . . . . . $ 695 5.38% 2024 June 2004 . . . . . . . . . . . . . . . . . . . . . . . . . . . . . . . . . . . . . . . . . . . . . . . . $ 350 5.50% 2014 June 2004 . . . . . . . . . . . . . . . . . . . . . . . . . . . . . . . . . . . . . . . . . . . . . . . . $ 750 6.38% 2034 November 2003 . . . . . . . . . . . . . . . . . . . . . . . . . . . . . . . . . . . . . . . . . . . . $ 500 5.00% 2013 November 2003 . . . . . . . . . . . . . . . . . . . . . . . . . . . . . . . . . . . . . . . . . . . . $ 200 5.88% 2033 December 2002 . . . . . . . . . . . . . . . . . . . . . . . . . . . . . . . . . . . . . . . . . . . . $ 400 5.38% 2012 December 2002 . . . . . . . . . . . . . . . . . . . . . . . . . . . . . . . . . . . . . . . . . . . . $ 600 6.50% 2032 November 2001 . . . . . . . . . . . . . . . . . . . . . . . . . . . . . . . . . . . . . . . . . . . . $ 750 6.13% 2011 (1) This amount represents the translation of pounds sterling into U.S. dollars using the noon buying rate on December 31, 2007 of $1.9843 as announced by the Federal Reserve Bank of New York. See also “— Liquidity and Capital Resources — The Holding Company — Liquidity Sources — Common Equity Units” for a description of $2,134 million of junior subordinated debt securities issued in connection with the issuance of common equity units. Preferred Stock. During the year ended December 31, 2007, the Holding Company issued no new preferred stock. In June 2005, the Holding Company issued 24 million shares of Floating Rate Non-Cumulative Preferred Stock, Series A (the “Series A preferred shares”) with a $0.01 par value per share, and a liquidation preference of $25 per share, for aggregate proceeds of $600 million. In June 2005, the Holding Company issued 60 million shares of 6.50% Non-Cumulative Preferred Stock, Series B (the “Series B preferred shares,” together with the Series A preferred shares, collectively, the “Preferred Shares”) with a $0.01 par value per share, and a liquidation preference of $25 per share for aggregate proceeds of $1.5 billion. The Preferred Shares rank senior to the common stock with respect to dividends and liquidation rights. Dividends on the Preferred Shares are not cumulative. Holders of the Preferred Shares will be entitled to receive dividend payments only when, as and if declared by the Holding Company’s Board of Directors or a duly authorized committee of the board. If dividends are declared on the Series A preferred shares, they will be payable quarterly, in arrears, at an annual rate of the greater of: (i) 1.00% above 3-month LIBOR on the related LIBOR determination date; or (ii) 4.00%. Any dividends declared on the Series B preferred shares will be payable quarterly, in arrears, at an annual fixed rate of 6.50%. Accordingly, in the event that dividends are not declared on the Preferred Shares for payment on any dividend payment date, then those dividends will cease to accrue and be payable. If a dividend is not declared before the dividend payment date, the Holding 53MetLife, Inc.
  • 58.
    Company has noobligation to pay dividends accrued for that dividend period whether or not dividends are declared and paid in future periods. No dividends may, however, be paid or declared on the Holding Company’s common stock — or any other securities ranking junior to the Preferred Shares — unless the full dividends for the latest completed dividend period on all Preferred Shares, and any parity stock, have been declared and paid or provided for. The Holding Company is prohibited from declaring dividends on the Preferred Shares if it fails to meet specified capital adequacy, net income and shareholders’ equity levels. In addition, under Federal Reserve Board policy, the Holding Company may not be able to pay dividends if it does not earn sufficient operating income. The Preferred Shares do not have voting rights except in certain circumstances where the dividends have not been paid for an equivalent of six or more dividend payment periods whether or not those periods are consecutive. Under such circumstances, the holders of the Preferred Shares have certain voting rights with respect to members of the Board of Directors of the Holding Company. The Preferred Shares are not subject to any mandatory redemption, sinking fund, retirement fund, purchase fund or similar provisions. The Preferred Shares are redeemable, but not prior to September 15, 2010. On and after that date, subject to regulatory approval, the Preferred Shares will be redeemable at the Holding Company’s option in whole or in part, at a redemption price of $25 per Preferred Share, plus declared and unpaid dividends. See “— Liquidity and Capital Resources — The Holding Company — Liquidity Uses — Dividends” for dividends paid on the Company’s preferred stock. Common Equity Units. In connection with financing the acquisition of Travelers on July 1, 2005, the Holding Company distributed and sold 82.8 million 6.375% common equity units for $2,070 million in proceeds in a registered public offering on June 21, 2005. Each common equity unit has an initial stated amount of $25 per unit and consists of: • a 1/80, or 1.25% ($12.50), undivided beneficial ownership interest in a series A trust preferred security of MetLife Capital Trust II (“Series A Trust”), with an initial liquidation amount of $1,000. • a 1/80, or 1.25% ($12.50), undivided beneficial ownership interest in a series B trust preferred security of MetLife Capital Trust III (“Series B Trust” and, together with the Series A Trust, the “Capital Trusts”), with an initial liquidation amount of $1,000. • a stock purchase contract under which the holder of the common equity unit will purchase and the Holding Company will sell, on each of the initial stock purchase date and the subsequent stock purchase date, a variable number of shares of the Holding Company’s common stock, par value $0.01 per share, for a purchase price of $12.50. The Holding Company issued $1,067 million 4.82% Series A and $1,067 million 4.91% Series B junior subordinated debt securities due no later than February 15, 2039 and February 15, 2040, respectively, for a total of $2,134 million, in exchange for $2,070 million in aggregate proceeds from the sale of the trust preferred securities by the Capital Trusts and $64 million in trust common securities issued equally by the Capital Trusts. The common and preferred securities of the Capital Trusts, totaling $2,134 million, represent undivided beneficial ownership interests in the assets of the Capital Trusts, have no stated maturity and must be redeemed upon maturity of the corresponding series of junior subordinated debt securities — the sole assets of the respective Capital Trusts. The Series A Trust and Series B Trust will each make quarterly distributions on the common and preferred securities at an annual rate of 4.82% and 4.91%, respectively. The Holding Company has directly guaranteed the repayment of the trust preferred securities to the holders thereof to the extent that there are funds available in the Capital Trusts. The guarantee will remain in place until the full redemption of the trust preferred securities. The trust preferred securities held by the common equity unit holders are pledged to the Holding Company to collateralize the obligation of the common equity unit holders under the related stock purchase contracts. The common equity unit holder may substitute certain zero coupon treasury securities in place of the trust preferred securities as collateral under the stock purchase contract. The trust preferred securities have remarketing dates which correspond with the initial and subsequent stock purchase dates to provide the holders of the common equity units with the proceeds to exercise the stock purchase contracts. The initial stock purchase date is expected to be August 15, 2008, but could be deferred for quarterly periods until February 15, 2009, and the subsequent stock purchase date is expected to be February 15, 2009, but could be deferred for quarterly periods until February 15, 2010. At the remarketing date, the remarketing agent will have the ability to reset the interest rate on the trust preferred securities to generate sufficient remarketing proceeds to satisfy the common equity unit holder’s obligation under the stock purchase contract, subject to a reset cap for each of the first two attempted remarketings of each series. The interest rate on the supporting junior subordinated debt securities issued by the Holding Company will be reset at a commensurate rate. If the initial remarketing is unsuccessful, the remarketing agent will attempt to remarket the trust preferred securities, as necessary, in subsequent quarters through February 15, 2009 for the Series A trust preferred securities and through February 15, 2010 for the Series B trust preferred securities. The final attempt at remarketing will not be subject to the reset cap. If all remarketing attempts are unsuccessful, the Holding Company has the right, as a secured party, to apply the liquidation amount on the trust preferred securities to the common equity unit holders obligation under the stock purchase contract and to deliver to the common equity unit holder a junior subordinated debt security payable on August 15, 2010 at an annual rate of 4.82% and 4.91% on the Series A and Series B trust preferred securities, respectively, in payment of any accrued and unpaid distributions. Each stock purchase contract requires (i) the Holding Company to pay the holder of the common equity unit quarterly contract payments on the stock purchase contracts at the annual rate of 1.510% on the stated amount of $25 per stock purchase contract until the initial stock purchase date and at the annual rate of 1.465% on the remaining stated amount of $12.50 per stock purchase contract thereafter; and (ii) the holder of the common equity unit to purchase, and the Holding Company to sell, for $12.50, on each of the initial stock purchase date and the subsequent stock purchase date, a number of newly issued or treasury shares of the Holding Company’s common stock, par value $0.01 per share, equal to the applicable settlement rate. The settlement rate at the respective stock purchase date will be calculated based on the closing price of the common stock during a specified 20-day period immediately preceding the applicable stock purchase date. Accordingly, upon settlement in the aggregate, the Holding Company will receive proceeds of $2,070 mil- lion and issue between 39.0 million and 47.8 million shares of its common stock. The stock purchase contract may be exercised at the option of the holder at any time prior to the settlement date. However, upon early settlement, the holder will receive the minimum settlement rate. 54 MetLife, Inc.
  • 59.
    Credit Facilities. InJune 2007, the Holding Company and MetLife Funding entered into a $3.0 billion credit agreement with various financial institutions, the proceeds of which are available to be used for general corporate purposes, to support their commercial paper programs and for the issuance of letters of credit. All borrowings under the credit agreement must be repaid by June 2012, except that letters of credit outstanding upon termination may remain outstanding until June 2013. The borrowers and the lenders under this facility may agree to extend the term of all or part of the facility to no later than June 2014, except that letters of credit outstanding upon termination may remain outstanding until June 2015. The $1.5 billion credit agreement, with an April 2009 expiration, and the $1.5 billion credit agreement, with an April 2010 expiration, were both terminated in June 2007 and replaced by the aforementioned facility. At December 31, 2007, $1.5 billion of letters of credit have been issued under these unsecured credit facilities on behalf of the Holding Company. Committed Facilities. Information on committed facilities as of December 31, 2007 is as follows: Account Party/Borrower(s) Expiration Capacity Drawdowns Letter of Credit Issuances Unused Commitments Maturity (Years) (In millions) Exeter Reassurance Company Ltd., MetLife, Inc., & Missouri Re . . . . . . . . . . . . . . . . . . June 2016 (1) $ 500 $ — $ 490 $ 10 8 Exeter Reassurance Company Ltd. . . . . . . . . . December 2027 (2) 650 — 410 240 20 MetLife Reinsurance Company of South Carolina & MetLife, Inc. . . . . . . . . . . . . . . . June 2037 (3) 3,500 2,382 — 1,118 30 MetLife Reinsurance Company of Vermont & MetLife, Inc. . . . . . . . . . . . . . . . . . . . . . . December 2037 (2),(4) 2,896 — 1,235 1,661 30 Total . . . . . . . . . . . . . . . . . . . . . . . . . . . . $7,546 $2,382 $2,135 $3,029 (1) Letters of credit and replacements or renewals thereof issued under this facility of $280 million, $10 million and $200 million are set to expire no later than December 2015, March 2016 and June 2016, respectively. (2) The Holding Company is a guarantor under this agreement. (3) In May 2007, MRSC terminated the $2.0 billion amended and restated five-year letter of credit and reimbursement agreement entered into among the Holding Company, MRSC and various institutional lenders on April 25, 2005. In its place the Company entered into a 30-year collateral financing arrangement as described under “— Liquidity and Capital Resources — The Company — Liquidity Sources — Debt Issuances”, which may be extended by agreement of the Holding Company and the financial institution on each anniversary of the closing of the facility for an additional one-year period. At December 31, 2007, $2.4 billion had been drawn upon under the collateral financing arrangement. (4) In December 2007, Exeter terminated four letters of credit, with expirations from March 2025 through December 2026, that were issued under a letter of credit facility with an unaffiliated financial institution in an aggregate amount of $1.7 billion. The letters of credit had served as collateral for Exeter’s obligations under a reinsurance agreement that was recaptured by MLI-USA in December 2007. MLI-USA immediately thereafter entered into a new reinsurance agreement with MRV. To collateralize its reinsurance obligations, MRV and the Holding Company entered into a 30-year, $2.9 billion letter of credit facility with an unaffiliated financial institution. Letters of Credit. At December 31, 2007, the Holding Company had $1.5 billion in outstanding letters of credit, all of which are associated with the aforementioned credit facilities, from various financial institutions. As commitments associated with letters of credit and financing arrangements may expire unused, these amounts do not necessarily reflect the Holding Company’s actual future cash funding requirements. Liquidity Uses The primary uses of liquidity of the Holding Company include debt service, cash dividends on common and preferred stock, capital contributions to subsidiaries, payment of general operating expenses, acquisitions and the repurchase of the Holding Company’s common stock. Dividends. The table below presents declaration, record and payment dates, as well as per share and aggregate dividend amounts, for the common stock: Declaration Date Record Date Payment Date Per Share Aggregate Dividend (In millions, except per share data) October 23, 2007 . . . . . . . . . . . . . . . . . . . . . . . November 6, 2007 December 14, 2007 $0.74 $541 October 24, 2006 . . . . . . . . . . . . . . . . . . . . . . . November 6, 2006 December 15, 2006 $0.59 $450 October 25, 2005 . . . . . . . . . . . . . . . . . . . . . . . November 7, 2005 December 15, 2005 $0.52 $394 Future common stock dividend decisions will be determined by the Holding Company’s Board of Directors after taking into consid- eration factors such as the Company’s current earnings, expected medium- and long-term earnings, financial condition, regulatory capital position, and applicable governmental regulations and policies. Furthermore, the payment of dividends and other distributions to the Holding Company by its insurance subsidiaries is regulated by insurance laws and regulations. 55MetLife, Inc.
  • 60.
    Information on thedeclaration, record and payment dates, as well as per share and aggregate dividend amounts, for the Preferred Shares is as follows: Declaration Date Record Date Payment Date Series A Per Share Series A Aggregate Series B Per Share Series B Aggregate Dividend (In millions, except per share data) November 15, 2007 . . . . . . . . . . November 30, 2007 December 17, 2007 $0.4230476 $11 $0.4062500 $24 August 15, 2007 . . . . . . . . . . . . August 31, 2007 September 17, 2007 $0.4063333 $10 $0.4062500 $24 May 15, 2007 . . . . . . . . . . . . . . May 31, 2007 June 15, 2007 $0.4060062 $10 $0.4062500 $24 March 5, 2007 . . . . . . . . . . . . . February 28, 2007 March 15, 2007 $0.3975000 $10 $0.4062500 $24 $41 $96 November 15, 2006 . . . . . . . . . . November 30, 2006 December 15, 2006 $0.4038125 $10 $0.4062500 $24 August 15, 2006 . . . . . . . . . . . . August 31, 2006 September 15, 2006 $0.4043771 $10 $0.4062500 $24 May 16, 2006 . . . . . . . . . . . . . . May 31, 2006 June 15, 2006 $0.3775833 $ 9 $0.4062500 $24 March 6, 2006 . . . . . . . . . . . . . February 28, 2006 March 15, 2006 $0.3432031 $ 9 $0.4062500 $24 $38 $96 November 15, 2005 . . . . . . . . . . November 30, 2005 December 15, 2005 $0.3077569 $ 8 $0.4062500 $24 August 22, 2005 . . . . . . . . . . . . August 31, 2005 September 15, 2005 $0.2865690 $ 7 $0.4017361 $24 $15 $48 See “— Subsequent Events.” Affiliated Capital Transactions. During the years ended December 31, 2007 and 2006, the Holding Company invested an aggregate of $2.8 billion and $1.8 billion, respectively, in various affiliates. In December 2005, RGA repurchased 1.6 million shares of its outstanding common stock at an aggregate price of $76 million under an accelerated share repurchase agreement with a major bank. The bank borrowed the stock sold to RGA from third parties and purchased the shares in the open market over the subsequent few months to return to the lenders. RGA would either pay or receive an amount based on the actual amount paid by the bank to purchase the shares. These repurchases resulted in an increase in the Company’s ownership percentage of RGA to approximately 53% at December 31, 2005 from approximately 52% at December 31, 2004. In February 2006, the final purchase price was determined, resulting in a cash settlement substantially equal to the aggregate cost. RGA recorded the initial repurchase of shares as treasury stock and recorded the amount received as an adjustment to the cost of the treasury stock. At December 31, 2007, the Company’s ownership was approximately 52% of RGA. The Holding Company lends funds, as necessary, to its affiliates, some of which are regulated, to meet their capital requirements. Such loans are included in loans to affiliates and consisted of the following at: Affiliate Interest Rate Maturity Date 2007 2006 December 31, (In millions) MLIC . . . . . . . . . . . . . . . . . . . . . . . . . . . . . 3-month LIBOR + 1.15% December 31, 2009 $ 700 $ — MLIC . . . . . . . . . . . . . . . . . . . . . . . . . . . . . 7.13% December 15, 2032 400 400 MLIC . . . . . . . . . . . . . . . . . . . . . . . . . . . . . 7.13% January 15, 2033 100 100 MLIC . . . . . . . . . . . . . . . . . . . . . . . . . . . . . 5.00% December 31, 2007 — 800 MetLife Investors USA Insurance Company . . . . . 7.35% April 1, 2035 400 400 Total . . . . . . . . . . . . . . . . . . . . . . . . . . . . $1,600 $1,700 Debt Repayments. The Holding Company repaid a $500 million 5.25% senior note which matured in December 2006 and a $1,006 million 3.911% senior note which matured in May 2005. Share Repurchase. In October 2004, the Holding Company’s Board of Directors authorized a $1 billion common stock repurchase program. In February 2007, the Holding Company’s Board of Directors authorized an additional $1 billion common stock repurchase program. In September 2007, the Holding Company’s Board of Directors authorized an additional $1 billion common stock repurchase program which began after the completion of the $1 billion common stock repurchase program authorized in February 2007. In January 2008, the Holding Company’s Board of Directors authorized an additional $1 billion common stock repurchase program, which began after the completion of the September 2007 program. (See “— Subsequent Events”). Under these authorizations, the Holding Company may purchase its common stock from the MetLife Policyholder Trust, in the open market (including pursuant to the terms of a pre-set trading plan meeting the requirements of Rule 10b5-1 under the Exchange Act and in privately negotiated transactions. The Holding Company has entered into the following accelerated common stock repurchase agreements: • In December 2007, the Holding Company entered into an accelerated common stock repurchase agreement with a major bank. Under the terms of the agreement, the Holding Company paid the bank $450 million in cash in January 2008 in exchange for 6.6 million shares of its outstanding common stock that the bank borrowed from third parties. Also, in January 2008, the bank delivered 1.1 million additional shares of Holding Company’s common stock to the Holding Company resulting in a total of 7.7 million shares being repurchased under the agreement. At December 31, 2007, the Holding Company recorded the obligation to pay $450 million to the bank as a reduction of additional paid-in capital. Upon settlement with the bank, the Holding Company increased additional paid-in capital and reduced treasury stock. 56 MetLife, Inc.
  • 61.
    • In November2007, the Holding Company repurchased 11.6 million shares of its outstanding common stock at an initial cost of $750 million under an accelerated common stock repurchase agreement with a major bank. The bank borrowed the stock sold to the Holding Company from third parties and purchased the common stock in the open market to return to such third parties. Also, in November 2007, the Holding Company received a cash adjustment of $19 million based on the trading price of the common stock during the repurchase period, for a final purchase price of $731 million. The Holding Company recorded the shares initially repurchased as treasury stock and recorded the amount received as an adjustment to the cost of the treasury stock. • In March 2007, the Holding Company repurchased 11.9 million shares of its outstanding common stock at an aggregate cost of $750 million under an accelerated common stock repurchase agreement with a major bank. The bank borrowed the common stock sold to the Holding Company from third parties and purchased common stock in the open market to return to such third parties. In June 2007, the Holding Company paid a cash adjustment of $17 million for a final purchase price of $767 million. The Holding Company recorded the shares initially repurchased as treasury stock and recorded the amount paid as an adjustment to the cost of the treasury stock. • In December 2006, the Holding Company repurchased 4.0 million shares of its outstanding common stock at an aggregate cost of $232 million under an accelerated common stock repurchase agreement with a major bank. The bank borrowed the common stock sold to the Holding Company from third parties and purchased the common stock in the open market to return to such third parties. In February 2007, the Holding Company paid a cash adjustment of $8 million for a final purchase price of $240 million. The Holding Company recorded the shares initially repurchased as treasury stock and recorded the amount paid as an adjustment to the cost of the treasury stock. • In December 2004, the Holding Company repurchased 7.3 million shares of its outstanding common stock at an aggregate cost of $300 million under an accelerated common stock repurchase agreement with a major bank. The bank borrowed the stock sold to the Holding Company from third parties and purchased the common stock in the open market to return to such third parties. In April 2005, the Holding Company received a cash adjustment of $7 million based on the actual amount paid by the bank to purchase the common stock, for a final purchase price of $293 million. The Holding Company recorded the shares initially repurchased as treasury stock and recorded the amount received as an adjustment to the cost of the treasury stock. The Company also repurchased 3.1 million and 4.6 million shares through open market purchases for $200 million and $268 million, respectively, during the years ended December 31, 2007 and 2006, respectively. Cumulatively, the Company repurchased 26.6 million and 8.6 million shares of its common stock for $1.7 billion and $500 million during the years ended December 31, 2007 and 2006, respectively. The Company did not repurchase any shares of its common stock during the year ended December 31, 2005. During the years ended December 31, 2007, 2006 and 2005, 3.9 million, 3.1 million and 25.0 million shares of common stock were issued from treasury stock for $172 million, $102 million and $819 million, respectively, of which 22.4 million shares with a market value of $1 billion were issued in connection with the acquisition of Travelers of July 1, 2005. At December 31, 2006, the Company had $216 million remaining on the October 2004 common stock repurchase program which was subsequently reduced by $8 million to $208 million after the February 2007 cash adjustment to the December 2006 accelerated common stock repurchase agreement. The February 2007 stock repurchase program authorization was fully utilized during 2007. At December 31, 2007, $511 million remained on the Company’s September 2007 common stock repurchase program. The $511 million remaining on the September 2007 common stock repurchase program was reduced by $450 million to $61 million upon settlement of the accelerated stock repurchase agreement executed during December 2007 but for which no settlement occurred until January 2008. Subsequent to the January 2008 authorization, the amount remaining under these repurchase programs was $1,061 million. After execution of the accelerated stock repurchase agreement in February 2008 and certain open market purchases as more fully described in “— Subsequent Events”, the Company’s remaining authorization is $261 million. Future common stock repurchases will be dependent upon several factors, including the Company’s capital position, its financial strength and credit ratings, general market conditions and the price of MetLife, Inc.’s common stock. See “— Subsequent Events” for further information relating to common stock repurchases subsequent to December 31, 2007. Support Agreements. The Holding Company is party to various capital support commitments with certain of its subsidiaries and a corporation in which it owns 50% of the equity. Under these arrangements, the Holding Company has agreed to cause each such entity to meet specified capital and surplus levels. Management does not anticipate that these arrangements will place any significant demands upon the Holding Company’s liquidity resources. Based on management’s analysis and comparison of its current and future cash inflows from the dividends it receives from subsidiaries that are permitted to be paid without prior insurance regulatory approval, its portfolio of liquid assets, anticipated securities issuances and other anticipated cash flows, management believes there will be sufficient liquidity to enable the Holding Company to make payments on debt, make cash dividend payments on its common and preferred stock, contribute capital to its subsidiaries, pay all operating expenses and meet its cash needs. Subsequent Events Dividends On February 19, 2008, the Company’s Board of Directors announced dividends of $0.3785745 per share, for a total of $9 million, on its Series A preferred shares, and $0.4062500 per share, for a total of $24 million, on its Series B preferred shares, subject to the final confirmation that it has met the financial tests specified in the Series A and Series B preferred shares, which the Company anticipates will be made on or about March 5, 2008, the earliest date permitted in accordance with the terms of the securities. Both dividends will be payable March 17, 2008 to shareholders of record as of February 29, 2008. Acquisitions On February 1, 2008, the Company announced its completion of the acquisition of SafeGuard Health Enterprises, Inc. (“Safeguard”) for approximately $190 million. Safeguard is primarily involved in providing dental and vision benefit plans, including health maintenance and preferred provider organization plan designs and administrative services. 57MetLife, Inc.
  • 62.
    On January 2,2008, the Company completed its acquisition of AFORE Actinver, S.A. de C.V. (“Actinver”) for approximately $125 million. Actinver manages retirement accounts for approximately 1.1 million individuals in Mexico. Stock Repurchases On January 15, 2008, the Company’s Board of Directors authorized a $1 billion common stock repurchase program, which began after the completion of an earlier $1 billion authorization that was announced in September 2007. As previously described, in December 2007, the Company entered into an accelerated common stock repurchase agreement with a major bank. Under the terms of the agreement, the Company paid the bank $450 million in cash in January 2008 in exchange for 6.6 million shares of the Company’s outstanding common stock that the bank borrowed from third parties. Also, in January 2008, the bank delivered 1.1 million additional shares of the Company’s common stock to the Company resulting in a total of 7.7 million shares being repurchased under the agreement. Upon settlement with the bank, the Company increased additional paid-in capital and reduced treasury stock. In February 2008, the Company entered into an accelerated common stock repurchase agreement with a major bank. Under the agreement, the Company paid the bank $711 million in cash and the bank delivered an initial amount of 11.2 million shares of the Company’s outstanding common stock that the bank borrowed from third parties. Final settlement of the agreement is scheduled to take place during the first half of 2008. The final number of shares the Company is repurchasing under the terms of the agreement and the timing of the final settlement will depend on, among other things, prevailing market conditions and the market prices of the common stock during the repurchase period. The Company recorded the consideration paid as a reduction to stockholders’ equity. From January 1, 2008 to February 25, 2008, the Company also repurchased 1.6 million of its shares through open market purchases for $89 million. Off-Balance Sheet Arrangements Commitments to Fund Partnership Investments The Company makes commitments to fund partnership investments in the normal course of business for the purpose of enhancing the Company’s total return on its investment portfolio. The amounts of these unfunded commitments were $5.3 billion and $3.0 billion at December 31, 2007 and 2006, respectively. The Company anticipates that these amounts will be invested in partnerships over the next five years. There are no other obligations or liabilities arising from such arrangements that are reasonably likely to become material. Mortgage Loan Commitments The Company commits to lend funds under mortgage loan commitments. The amounts of these mortgage loan commitments were $4.0 billion at both December 31, 2007 and 2006. The purpose of these loans is to enhance the Company’s total return on its investment portfolio. There are no other obligations or liabilities arising from such arrangements that are reasonably likely to become material. Commitments to Fund Bank Credit Facilities, Bridge Loans and Private Corporate Bond Investments The Company commits to lend funds under bank credit facilities, bridge loans and private corporate bond investments. The amounts of these unfunded commitments were $1.2 billion and $1.9 billion at December 31, 2007 and 2006, respectively. The purpose of these commitments and any related fundings is to enhance the Company’s total return on its investment portfolio. There are no other obligations or liabilities arising from such arrangements that are reasonably likely to become material. Lease Commitments The Company, as lessee, has entered into various lease and sublease agreements for office space, data processing and other equipment. The Company’s commitments under such lease agreements are included within the contractual obligations table. See “— Liquidity and Capital Resources — The Company — Liquidity Uses — Investment and Other.” Credit Facilities and Letters of Credit The Company maintains committed and unsecured credit facilities and letters of credit with various financial institutions. See “— Liquidity and Capital Resources — The Company — Liquidity Sources — Credit Facilities” and “— Letters of Credit” for further descriptions of such arrangements. Share-Based Arrangements In connection with the issuance of common equity units, the Holding Company issued forward stock purchase contracts under which the Holding Company will issue, in 2008 and 2009, between 39.0 and 47.8 million shares of its common stock, depending upon whether the share price is greater than $43.35 and less than $53.10. See “— Liquidity and Capital Resources — The Holding Company — Liquidity Sources — Common Equity Units.” Guarantees In the normal course of its business, the Company has provided certain indemnities, guarantees and commitments to third parties pursuant to which it may be required to make payments now or in the future. In the context of acquisition, disposition, investment and other transactions, the Company has provided indemnities and guarantees, including those related to tax, environmental and other specific liabilities, and other indemnities and guarantees that are triggered by, among other things, breaches of representations, warranties or covenants provided by the Company. In addition, in the normal course of business, the Company provides indemnifications to counter- parties in contracts with triggers similar to the foregoing, as well as for certain other liabilities, such as third party lawsuits. These obligations are often subject to time limitations that vary in duration, including contractual limitations and those that arise by operation of law, such as applicable statutes of limitation. In some cases, the maximum potential obligation under the indemnities and guarantees is subject to a contractual limitation ranging from less than $1 million to $800 million, with a cumulative maximum of $2.3 billion, while in other cases such limitations are not specified or applicable. Since certain of these obligations are not subject to limitations, the Company does not believe that it is possible to determine the maximum potential amount that could become due under these guarantees in the future. In addition, the Company indemnifies its directors and officers as provided in its charters and by-laws. Also, the Company indemnifies its agents for liabilities incurred as a result of their representation of the Company’s interests. Since these indemnities are generally not subject to limitation with respect to duration or amount, the Company does not believe that it is possible to determine the maximum potential amount that could become due under these indemnities in the future. 58 MetLife, Inc.
  • 63.
    The Company hasalso guaranteed minimum investment returns on certain international retirement funds in accordance with local laws. Since these guarantees are not subject to limitation with respect to duration or amount, the Company does not believe that it is possible to determine the maximum potential amount that could become due under these guarantees in the future. During the year ended December 31, 2007, the Company recorded a $1 million liability with respect to a guarantee previously provided to MLII, a former subsidiary. The Company’s recorded liabilities at December 31, 2007 and 2006 for indemnities, guarantees and commitments were $6 million and $5 million, respectively. In connection with synthetically created investment transactions, the Company writes credit default swap obligations that generally require payment of principal outstanding due in exchange for the referenced credit obligation. If a credit event, as defined by the contract, occurs the Company’s maximum amount at risk, assuming the value of the referenced credits becomes worthless, was $1.7 billion at December 31, 2007. The credit default swaps expire at various times during the next ten years. Other Commitments MetLife Insurance Company of Connecticut (“MICC”) is a member of the Federal Home Loan Bank of Boston (the “FHLB of Boston”) and holds $70 million of common stock of the FHLB of Boston at both December 31, 2007 and 2006, which is included in equity securities. MICC has also entered into funding agreements with the FHLB of Boston whereby MICC has issued such funding agreements in exchange for cash and for which the FHLB of Boston has been granted a blanket lien on certain MICC assets, including residential mortgage-backed securities, to collateralize MICC’s obligations under the funding agreements. MICC maintains control over these pledged assets, and may use, commingle, encumber or dispose of any portion of the collateral as long as there is no event of default and the remaining qualified collateral is sufficient to satisfy the collateral maintenance level. Upon any event of default by MICC, the FHLB of Boston’s recovery on the collateral is limited to the amount of MICC’s liability to the FHLB of Boston. The amount of the Company’s liability for funding agreements with the FHLB of Boston was $726 million and $926 million at December 31, 2007 and 2006, respectively, which is included in policyholder account balances. The advances on these funding agreements are collateralized by residential mortgage-backed securities with fair values of $901 million and $1.1 billion at December 31, 2007 and 2006, respectively. MLIC is a member of the FHLB of NY and holds $339 million and $136 million of common stock of the FHLB of NY at December 31, 2007 and 2006, respectively, which is included in equity securities. MLIC has also entered into funding agreements with the FHLB of NY whereby MLIC has issued such funding agreements in exchange for cash and for which the FHLB of NY has been granted a lien on certain MLIC assets, including residential mortgage-backed securities to collateralize MLIC’s obligations under the funding agreements. MLIC maintains control over these pledged assets, and may use, commingle, encumber or dispose of any portion of the collateral as long as there is no event of default and the remaining qualified collateral is sufficient to satisfy the collateral maintenance level. Upon any event of default by MLIC, the FHLB of NY’s recovery on the collateral is limited to the amount of MLIC’s liability to the FHLB of NY. The amount of the Company’s liability for funding agreements with the FHLB of NY was $4.6 billion at December 31, 2007, which is included in policyholder account balances. The advances on these agreements are collateralized by residential mortgage-backed securities with fair values of $4.8 billion at December 31, 2007. MLIC did not have any funding agreements with the FHLB of NY at December 31, 2006. MetLife Bank is a member of the FHLB of NY and holds $64 million and $54 million of common stock of the FHLB of NY at December 31, 2007 and 2006, respectively, which is included in equity securities. MetLife Bank has also entered into repurchase agreements with the FHLB of NY whereby MetLife Bank has issued repurchase agreements in exchange for cash and for which the FHLB of NY has been granted a blanket lien on MetLife Bank’s residential mortgages and mortgage-backed securities to collateralize MetLife Bank’s obligations under the repurchase agreements. MetLife Bank maintains control over these pledged assets, and may use, commingle, encumber or dispose of any portion of the collateral as long as there is no event of default and the remaining qualified collateral is sufficient to satisfy the collateral maintenance level. The repurchase agreements and the related security agreement represented by this blanket lien provide that upon any event of default by MetLife Bank, the FHLB of NY’s recovery is limited to the amount of MetLife Bank’s liability under the outstanding repurchase agreements. The amount of the Company’s liability for repurchase agreements with the FHLB of NY was $1.2 billion and $998 million at December 31, 2007 and 2006, respectively, which is included in long-term debt. The advances on these repurchase agreements are collateralized by residential mortgage-backed securities and residential mortgage loans with fair values of $1.3 billion at both December 31, 2007 and 2006. Collateral for Securities Lending The Company has non-cash collateral for securities lending on deposit from customers, which cannot be sold or repledged, and which has not been recorded on its consolidated balance sheets. The amount of this collateral was $40 million and $100 million at December 31, 2007 and 2006, respectively. Pensions and Other Postretirement Benefit Plans Description of Plans Plan Description Overview The Subsidiaries sponsor and/or administer various qualified and non-qualified defined benefit pension plans and other postretirement employee benefit plans covering employees and sales representatives who meet specified eligibility requirements. Pension benefits are provided utilizing either a traditional formula or cash balance formula. The traditional formula provides benefits based upon years of credited service and either final average or career average earnings. The cash balance formula utilizes hypothetical or notional accounts, which credit participants with benefits equal to a percentage of eligible pay, as well as earnings credits, determined annually based upon the average annual rate of interest on 30-year U.S. Treasury securities, for each account balance. As of December 31, 2007, virtually all of the Subsidiaries’ obligations have been calculated using the traditional formula. The non-qualified pension plans provide supplemental benefits, in excess of amounts permitted by governmental agencies, to certain executive level employees. The Subsidiaries also provide certain postemployment benefits and certain postretirement medical and life insurance benefits for retired employees. Employees of the Subsidiaries who were hired prior to 2003 (or, in certain cases, rehired during or after 2003) and meet age and service criteria while working for a covered subsidiary, may become eligible for these other postretirement benefits, at various levels, in accordance with the applicable plans. Virtually all retirees, or their beneficiaries, contribute a portion of the total cost of postretirement medical benefits. Employees hired after 2003 are not eligible for any employer subsidy for postretirement medical benefits. 59MetLife, Inc.
  • 64.
    Financial Summary Statement ofFinancial Accounting Standards (“SFAS”) No. 87, Employers’ Accounting for Pensions (“SFAS 87”), as amended, establishes the accounting for pension plan obligations. Under SFAS 87, the projected pension benefit obligation (“PBO”) is defined as the actuarially calculated present value of vested and non-vested pension benefits accrued based on future salary levels. The accumulated pension benefit obligation (“ABO”) is the actuarial present value of vested and non-vested pension benefits accrued based on current salary levels. The PBO and ABO of the pension plans are set forth in the following section. Prior to December 31, 2006, SFAS 87 also required the recognition of an additional minimum pension liability and an intangible asset (limited to unrecognized prior service cost) if the market value of pension plan assets was less than the ABO at the measurement date. The excess of the additional minimum pension liability over the allowable intangible asset was charged, net of taxes, to accumulated other comprehensive income. The Company’s additional minimum pension liability was $78 million, and the intangible asset was $12 million, at December 31, 2005. The excess of the additional minimum pension liability over the intangible asset of $66 million ($41 million, net of income tax) was recorded as a reduction of accumulated other comprehensive income. At December 31, 2006, the Company’s additional minimum pension liability was $92 million. The additional minimum pension liability of $59 million, net of income tax of $33 million, was recorded as a reduction of accumulated other comprehensive income. SFAS No. 106, Employers Accounting for Postretirement Benefits Other than Pensions, as amended, (“SFAS 106”), establishes the accounting for expected postretirement plan benefit obligations (“EPBO”) which represents the actuarial present value of all postretirement benefits expected to be paid after retirement to employees and their dependents. Unlike the PBO for pensions, the EPBO is not recorded in the financial statements but is used in measuring the periodic expense. The accumulated postretirement plan benefit obligation (“APBO”) represents the actuarial present value of future postretirement benefits attributed to employee services rendered through a particular date. The APBO is recorded in the financial statements and is set forth below. As described more fully in “— Adoption of New Accounting Pronouncements”, the Company adopted SFAS No. 158, Employers’ Accounting for Defined Benefit Pension and Other Postretirement Plans — an amendment of FASB Statements No. 87, 88, 106, and SFAS No. 132(r) (“SFAS 158”), effective December 31, 2006. Upon adoption, the Company was required to recognize in the consolidated balance sheet the funded status of defined benefit pension and other postretirement plans. Funded status is measured as the difference between the fair value of plan assets and the benefit obligation, which is the PBO for pension plans and the APBO for other postretirement plans. The change to recognize funded status eliminated the additional minimum pension liability provisions of SFAS 87. In addition, the Company recognized as an adjustment to accumulated other comprehensive income, net of income tax, those amounts of actuarial gains and losses, prior service costs and credits, and the remaining net transition asset or obligation that had not yet been included in net periodic benefit cost at the date of adoption. The adoption of SFAS 158 resulted in a reduction of $744 million, net of income tax, to accumulated other comprehensive income, which is included as a component of total consolidated stockholders’ equity. The following table summarizes the adjustments to the December 31, 2006 consolidated balance sheet in order to effect the adoption of SFAS 158. Balance Sheet Caption Pre SFAS 158 Adjustments Additional Minimum Pension Liability Adjustment Adoption of SFAS 158 Adjustment Post SFAS 158 Adjustments December 31, 2006 (In millions) Other assets: Prepaid pension benefit cost . . . . . . . . . . . . . . . . $1,937 $ — $ (993) $ 944 Other assets: Intangible asset . . . . . . . . . . . . . . . . . . . . . . . . $ 12 $(12) $ — $ — Other liabilities: Accrued pension benefit cost . . . . . . . . . . . . . . $ (505) $(14) $ (79) $ (598) Other liabilities: Accrued other postretirement benefit cost . . . . . . $ (802) $ — $ (99) $ (901) Accumulated other comprehensive income, before income tax: Defined benefit plans . . . . . . . . . . . . . . . . . . . . . . . . . . . . . $ (66) $(26) $(1,171) $(1,263) Minority interest. . . . . . . . . . . . . . . . . . . . . . . . . . . . . . . . . . $ — $ 8 Deferred income tax . . . . . . . . . . . . . . . . . . . . . . . . . . . . . . . $ 8 $ 419 Accumulated other comprehensive income, net of income tax: Defined benefit plans . . . . . . . . . . . . . . . . . . . . . . . . . . . . . $ (41) $(18) $ (744) $ (803) A December 31 measurement date is used for all the Company’s defined benefit pension and other postretirement benefit plans. The benefit obligations and funded status of the Subsidiaries’ defined benefit pension and other postretirement benefit plans, as determined in accordance with the applicable provisions described above, were as follows: 2007 2006 2007 2006 Pension Benefits Other Postretirement Benefits December 31, (In millions) Benefit obligation at end of year . . . . . . . . . . . . . . . . . . . . . . . . . . . . . . . . $5,775 $5,959 $1,610 $2,073 Fair value of plan assets at end of year . . . . . . . . . . . . . . . . . . . . . . . . . . . . 6,550 6,305 1,183 1,172 Funded status at end of year . . . . . . . . . . . . . . . . . . . . . . . . . . . . . . . . . . $ 775 $ 346 $ (427) $ (901) Amounts recognized in the consolidated balance sheet consist of: Other assets . . . . . . . . . . . . . . . . . . . . . . . . . . . . . . . . . . . . . . . . . . . $1,393 $ 944 $ — $ — Other liabilities . . . . . . . . . . . . . . . . . . . . . . . . . . . . . . . . . . . . . . . . . . (618) (598) (427) (901) Net amount recognized . . . . . . . . . . . . . . . . . . . . . . . . . . . . . . . . . . . . $ 775 $ 346 $ (427) $ (901) 60 MetLife, Inc.
  • 65.
    2007 2006 20072006 Pension Benefits Other Postretirement Benefits December 31, (In millions) Accumulated other comprehensive (income) loss: Net actuarial (gains) losses . . . . . . . . . . . . . . . . . . . . . . . . . . . . . . . . . . $ 623 $1,123 $ (112) $ 328 Prior service cost (credit) . . . . . . . . . . . . . . . . . . . . . . . . . . . . . . . . . . . 64 41 (193) (230) Net asset at transition . . . . . . . . . . . . . . . . . . . . . . . . . . . . . . . . . . . . . — — — 1 687 1,164 (305) 99 Deferred income tax and minority interest. . . . . . . . . . . . . . . . . . . . . . . . . (251) (423) 109 (37) $ 436 $ 741 $ (196) $ 62 The aggregate projected benefit obligation and aggregate fair value of plan assets for the pension plans were as follows: 2007 2006 2007 2006 2007 2006 Qualified Plans Non-Qualified Plans Total December 31, (In millions) Aggregate fair value of plan assets (principally Company contracts) . . . . . . $6,550 $6,305 $ — $ — $6,550 $6,305 Aggregate projected benefit obligation . . . . . . . . . . . . . . . . . . . . . . . . . 5,174 5,381 601 578 5,775 5,959 Over (under) funded . . . . . . . . . . . . . . . . . . . . . . . . . . . . . . . . . . . . . $1,376 $ 924 $(601) $(578) $ 775 $ 346 The accumulated benefit obligation for all defined benefit pension plans was $5,348 million and $5,505 million at December 31, 2007 and 2006, respectively. Information for pension plans with an accumulated benefit obligation in excess of plan assets is as follows: 2007 2006 December 31, (In millions) Projected benefit obligation . . . . . . . . . . . . . . . . . . . . . . . . . . . . . . . . . . . . . . . . . . . . . . . . . . . $616 $594 Accumulated benefit obligation . . . . . . . . . . . . . . . . . . . . . . . . . . . . . . . . . . . . . . . . . . . . . . . . . $533 $501 Fair value of plan assets . . . . . . . . . . . . . . . . . . . . . . . . . . . . . . . . . . . . . . . . . . . . . . . . . . . . . $ — $ — Information for pension and other postretirement plans with a projected benefit obligation in excess of plan assets is as follows: 2007 2006 2007 2006 Pension Benefits Other Postretirement Benefits December 31, (In millions) Projected benefit obligation . . . . . . . . . . . . . . . . . . . . . . . . . . . . . . . . . . . $ 646 $ 623 $1,610 $2,073 Fair value of plan assets . . . . . . . . . . . . . . . . . . . . . . . . . . . . . . . . . . . . . $ 28 $ 25 $1,183 $1,172 Pension and Other Postretirement Benefit Plan Obligations Pension Plan Obligations Obligations, both PBO and ABO, of the defined benefit pension plans are determined using a variety of actuarial assumptions, from which actual results may vary. Some of the more significant of these assumptions include the discount rate used to determine the present value of future benefit payments, the expected rate of compensation increases and average expected retirement age. Assumptions used in determining pension plan obligations were as follows: 2007 2006 December 31, Weighted average discount rate . . . . . . . . . . . . . . . . . . . . . . . . . . . . . . . . . . . . . . . . . . . 6.65% 6.00% Rate of compensation increase . . . . . . . . . . . . . . . . . . . . . . . . . . . . . . . . . . . . . . . . . . . 3.5% - 8% 3% - 8% Average expected retirement age . . . . . . . . . . . . . . . . . . . . . . . . . . . . . . . . . . . . . . . . . . 63 61 The discount rate is determined annually based on the yield, measured on a yield to worst basis, of a hypothetical portfolio constructed of high-quality debt instruments available on the valuation date, which would provide the necessary future cash flows to pay the aggregate PBO when due. The yield of this hypothetical portfolio, constructed of bonds rated AA or better by Moody’s Investors Services (“Moody’s) resulted in a discount rate of approximately 6.65% and 6.00% for the defined pension plans as of December 31, 2007 and 2006, respectively. A decrease (increase) in the discount rate increases (decreases) the PBO. This increase (decrease) to the PBO is amortized into earnings as an actuarial loss (gain). Based on the December 31, 2007 PBO, a 25 basis point decrease (increase) in the discount rate would result in an increase (decrease) in the PBO of $159 million. 61MetLife, Inc.
  • 66.
    At the endof 2007, total net actuarial losses were $623 million as compared to $1,123 million in 2006. In 2007, the majority of the reduction in the actuarial losses is due to the increase in the discount rate to 6.65% in 2007 from 6.00% in 2006. These losses will be amortized on a straight-line basis over the average remaining service period of active employees expected to receive benefits under the benefit plans. At the end of 2007, the average remaining service period of active employees was 8.2 years for the pension plans. As the benefits provided under the defined pension plans are calculated as a percentage of future earnings, an assumption of future compensation increases is required to determine the projected benefit obligation. These rates are derived through periodic analysis of historical demographic data conducted by an independent actuarial firm. The last review of such data was conducted using salary information through 2006 and the Company believes that no circumstances have subsequently occurred that would result in a material change to the compensation rate assumptions. Other Postretirement Benefit Plan Obligations The APBO is determined using a variety of actuarial assumptions, from which actual results may vary. Some of the more significant of these assumptions include the discount rate, the healthcare cost trend rate and the average expected retirement age. The determination of the discount rate and the average expected retirement age are substantially consistent with the determination described previously for the pension plans. The assumed healthcare cost trend rates used in measuring the APBO and net periodic benefit cost were as follows: 2007 2006 December 31, Pre-Medicare eligible claims . . . . . . . . . . . . . . . . . . . . . 8.5% down to 5% in 2014 9.0% down to 5% in 2014 Medicare eligible claims . . . . . . . . . . . . . . . . . . . . . . . . 10.5% down to 5% in 2018 11.0% down to 5% in 2018 Assumed healthcare cost trend rates may have a significant effect on the amounts reported for healthcare plans. A one-percentage point change in assumed healthcare cost trend rates would have the following effects: One Percent Increase One Percent Decrease (In millions) Effect on total of service and interest cost components. . . . . . . . . . . . . . . . . . . . . . . . . . $ 7 $ (6) Effect of accumulated postretirement benefit obligation . . . . . . . . . . . . . . . . . . . . . . . . . . $63 $(62) A decrease (increase) in the discount rate increases (decreases) the APBO. This increase (decrease) to the APBO is amortized into earnings as an actuarial loss (gain). Based on the December 31, 2007 APBO, a 25 basis point decrease (increase) in the discount rate would result in an increase (decrease) in the APBO of $44 million. At the end of 2007, total net actuarial gains were $112 million as compared to net actuarial losses of $328 million in 2006. The majority of the net actuarial gains are due to the increase in the discount rate, an increased number of retirees opting out of plan benefits and lower than expected medical inflation. These gains will be amortized on a straight-line basis over the average remaining service period of active employees expected to receive benefits under the other postretirement benefit plans. At the end of 2007, the average remaining service period of active employees was 8.3 years for the other postretirement benefit plans. In 2004, the Company adopted the guidance in FSP 106-2 Accounting and Disclosure Requirements Related to the Medicare Prescription Drug, Improvement and Modernization Act of 2003 (“FSP 106-2”), to account for future subsidies to be received under the Prescription Drug Act. The Company began receiving these subsidies during 2006. A summary of the reduction to the APBO and related reduction to the components of net periodic other postretirement benefit cost is as follows: 2007 2006 2005 December 31, (In millions) Cumulative reduction in benefit obligation: Beginning of year. . . . . . . . . . . . . . . . . . . . . . . . . . . . . . . . . . . . . . . . . . . . . . . . $328 $298 $230 Service cost . . . . . . . . . . . . . . . . . . . . . . . . . . . . . . . . . . . . . . . . . . . . . . . . . . . 7 6 6 Interest cost . . . . . . . . . . . . . . . . . . . . . . . . . . . . . . . . . . . . . . . . . . . . . . . . . . . 19 19 16 Net actuarial gains (losses) . . . . . . . . . . . . . . . . . . . . . . . . . . . . . . . . . . . . . . . . . (42) 15 46 Prescription drug subsidy . . . . . . . . . . . . . . . . . . . . . . . . . . . . . . . . . . . . . . . . . . (13) (10) — End of year . . . . . . . . . . . . . . . . . . . . . . . . . . . . . . . . . . . . . . . . . . . . . . . . . . $299 $328 $298 2007 2006 2005 Years Ended December 31, (In millions) Reduction in net periodic benefit cost: Service cost . . . . . . . . . . . . . . . . . . . . . . . . . . . . . . . . . . . . . . . . . . . . . . . . . . . . $ 7 $ 6 $ 6 Interest cost . . . . . . . . . . . . . . . . . . . . . . . . . . . . . . . . . . . . . . . . . . . . . . . . . . . . 19 19 16 Amortization of net actuarial gains (losses) . . . . . . . . . . . . . . . . . . . . . . . . . . . . . . . . . 5 30 23 Total reduction in net periodic benefit cost . . . . . . . . . . . . . . . . . . . . . . . . . . . . . . . $31 $55 $45 The Company received subsidies of $10 million and $8 million for the years ended December 31, 2007 and 2006, respectively. 62 MetLife, Inc.
  • 67.
    Pension and OtherPostretirement Net Periodic Benefit Cost Pension Cost Net periodic pension cost is comprised of the following: i) Service Cost — Service cost is the increase in the projected pension benefit obligation resulting from benefits payable to employees of the Subsidiaries on service rendered during the current year. ii) Interest Cost on the Liability — Interest cost is the time value adjustment on the projected pension benefit obligation at the end of each year. iii) Expected Return on Plan Assets — Expected return on plan assets is the assumed return earned by the accumulated pension fund assets in a particular year. iv) Amortization of Prior Service Cost — This cost relates to the increase or decrease to pension benefit cost for service provided in prior years due to amendments in plans or initiation of new plans. As the economic benefits of these costs are realized in the future periods, these costs are amortized to pension expense over the expected service years of the employees. v) Amortization of Net Actuarial Gains or Losses — Actuarial gains and losses result from differences between the actual experience and the expected experience on pension plan assets or projected pension benefit obligation during a particular period. These gains and losses are accumulated and, to the extent they exceed 10% of the greater of the projected pension benefit obligation or the market-related value of plan assets, they are amortized into pension expense over the expected service years of the employees. The Subsidiaries recognized pension expense of $98 million in 2007 as compared to $180 million in 2006 and $146 million in 2005. The major components of net periodic pension cost described above were as follows: 2007 2006 2005 Years Ended December 31, (In millions) Service cost . . . . . . . . . . . . . . . . . . . . . . . . . . . . . . . . . . . . . . . . . . . . . . . . . . . . . . $ 166 $ 163 $ 142 Interest cost . . . . . . . . . . . . . . . . . . . . . . . . . . . . . . . . . . . . . . . . . . . . . . . . . . . . . . 354 335 318 Expected return on plan assets . . . . . . . . . . . . . . . . . . . . . . . . . . . . . . . . . . . . . . . . . . (507) (454) (446) Amortization of net actuarial (gains) losses . . . . . . . . . . . . . . . . . . . . . . . . . . . . . . . . . . . 68 125 116 Amortization of prior service cost (credit) . . . . . . . . . . . . . . . . . . . . . . . . . . . . . . . . . . . . 17 11 16 Net periodic benefit cost . . . . . . . . . . . . . . . . . . . . . . . . . . . . . . . . . . . . . . . . . . . . . $ 98 $ 180 $ 146 The increase in expense from 2005 to 2006 was primarily a result of both increases in service and interest cost and amortization of net actuarial losses resulting largely from lower discount rates, partially offset by the impact of an increase in the expected return on plan assets due to a larger plan assets base. The decrease in expense from 2006 to 2007 was primarily the result of an increase in the expected return on plan assets and a decrease in amortization of net actuarial losses resulting from the $350 million contribution made in 2006. The increase in the interest cost resulted from the increase in the discount rate. The estimated net actuarial losses and prior service cost for the defined benefit pension plans that will be amortized from accumulated other comprehensive income into net periodic benefit cost over the next year are both $14 million. The weighted average discount rate used to calculate the net periodic pension cost was 6.00%, 5.82% and 5.83% for the years ended December 31, 2007, 2006 and 2005, respectively. The weighted average expected rate of return on pension plan assets used to calculate the net periodic pension cost for the years ended December 31, 2007, 2006 and 2005 was 8.25%, 8.25% and 8.50%, respectively. The expected rate of return on plan assets is based on anticipated performance of the various asset sectors in which the plan invests, weighted by target allocation percentages. Anticipated future performance is based on long-term historical returns of the plan assets by sector, adjusted for the Subsidiaries’ long- term expectations on the performance of the markets. While the precise expected return derived using this approach will fluctuate from year to year, the Subsidiaries’ policy is to hold this long-term assumption constant as long as it remains within reasonable tolerance from the derived rate. The actual net return on the investments has been an approximation of the estimated return for the pension plan in 2007, 2006 and 2005. Based on the December 31, 2007 asset balances, a 25 basis point increase (decrease) in the expected rate of return on plan assets would result in a decrease (increase) in net periodic benefit cost of $15 million for the pension plans. Other Postretirement Benefit Cost The net periodic other postretirement benefit cost consists of the following: i) Service Cost — Service cost is the increase in the expected postretirement plan benefit obligation resulting from benefits payable to employees of the Subsidiaries on service rendered during the current year. ii) Interest Cost on the Liability — Interest cost is the time value adjustment on the expected postretirement benefit obligation at the end of each year. iii) Expected Return on Plan Assets — Expected return on plan assets is the assumed return earned by the accumulated other postretirement fund assets in a particular year. iv) Amortization of Prior Service Cost — This cost relates to the increase or decrease to other postretirement benefit cost for service provided in prior years due to amendments in plans or initiation of new plans. As the economic benefits of these costs are realized in the future periods these costs are amortized to other postretirement benefit expense over the expected service years of the employees. v) Amortization of Net Actuarial Gains or Losses — Actuarial gains and losses result from differences between the actual experience and the expected experience on other postretirement benefit plan assets or expected postretirement plan benefit obligation during a particular year. These gains and losses are accumulated and, to the extent they exceed 10% of the greater 63MetLife, Inc.
  • 68.
    of the accumulatedpostretirement plan benefit obligation or the market-related value of plan assets, they are amortized into other postretirement benefit expense over the expected service years of the employees. The Subsidiaries recognized other postretirement benefit expense of $9 million in 2007 as compared to $60 million in 2006 and $77 million in 2005. The major components of net periodic other postretirement benefit cost described above were as follows: 2007 2006 2005 Years Ended December 31, (In millions) Service cost . . . . . . . . . . . . . . . . . . . . . . . . . . . . . . . . . . . . . . . . . . . . . . . . . . . . . . $ 27 $ 35 $ 37 Interest cost . . . . . . . . . . . . . . . . . . . . . . . . . . . . . . . . . . . . . . . . . . . . . . . . . . . . . . 104 117 121 Expected return on plan assets . . . . . . . . . . . . . . . . . . . . . . . . . . . . . . . . . . . . . . . . . . (86) (79) (79) Amortization of net actuarial (gains) losses . . . . . . . . . . . . . . . . . . . . . . . . . . . . . . . . . . . — 23 15 Amortization of prior service cost (credit) . . . . . . . . . . . . . . . . . . . . . . . . . . . . . . . . . . . . (36) (36) (17) Net periodic benefit cost . . . . . . . . . . . . . . . . . . . . . . . . . . . . . . . . . . . . . . . . . . . . . $ 9 $ 60 $ 77 The decrease in benefit cost from 2005 to 2006 was due to changes in plan benefits resulting in decreased service and interest cost and increases in amortization of prior service costs. The continued decrease from 2006 to 2007 primarily resulted from a change in the Medicare integration methodology for certain retirees. The estimated net actuarial losses and prior service credit for the other postretirement benefit plans that will be amortized from accumulated other comprehensive income into net periodic benefit cost over the next year are less than $1 million and $37 million, respectively. The weighted average discount rate used to calculate the net periodic postretirement cost was 6.00%, 5.82% and 5.98% for the years ended December 31, 2007, 2006 and 2005, respectively. The weighted average expected rate of return on plan assets used to calculate the net other postretirement benefit cost for the years ended December 31, 2007, 2006 and 2005 was 7.47%, 7.42% and 7.51%, respectively. The expected rate of return on plan assets is based on anticipated performance of the various asset sectors in which the plan invests, weighted by target allocation percentages. Anticipated future performance is based on long-term historical returns of the plan assets by sector, adjusted for the Subsidiaries’ long- term expectations on the performance of the markets. While the precise expected return derived using this approach will fluctuate from year to year, the Subsidiaries’ policy is to hold this long-term assumption constant as long as it remains within reasonable tolerance from the derived rate. The actual net return on the investments has been an approximation of the estimated return for the other postretirement plans in 2007, 2006 and 2005. Based on the December 31, 2007 asset balances, a 25 basis point increase (decrease) in the expected rate of return on plan assets would result in a decrease (increase) in net periodic benefit cost of $3 million for the other postretirement plans. Pension and Other Postretirement Benefit Plan Assets Pension Plan Assets Substantially all assets of the pension plans are invested within group annuity and life insurance contracts issued by the Subsidiaries. The majority of assets are held in separate accounts established by the Subsidiaries. The account values of assets held with the Subsidiaries were $6,440 million and $6,205 million as of December 31, 2007 and 2006, respectively. The terms of these contracts are consistent in all material respects with those the Subsidiaries offer to unaffiliated parties that are similarly situated. Net assets invested in separate accounts are stated at the aggregate fair value of units of participation. Such value reflects accumulated contributions, dividends and realized and unrealized investment gains or losses apportioned to such contributions, less withdrawals, distributions, allocable expenses relating to the purchase, sale and maintenance of the assets and an allocable part of such separate accounts’ investment expenses. Separate account investments in fixed income and equity securities are generally carried at published market value, or if published market values are not readily available, at estimated market values. Investments in short-term fixed income securities are generally reflected as cash equivalents and carried at fair value. Real estate investments are carried at estimated fair value based on appraisals performed by third-party real estate appraisal firms, and generally, determined by discounting projected cash flows over periods of time and at interest rates deemed appropriate for each investment. Information on the physical value of the property and the sales prices of comparable properties is used to corroborate fair value estimates. Estimated fair value of hedge fund net assets is generally determined by third-party pricing vendors using quoted market prices or through the use of pricing models which are affected by changes in interest rates, foreign currency exchange rates, financial indices, credit spreads, market supply and demand, market volatility and liquidity. The following table summarizes the actual and target weighted-average allocations of pension plan assets within the separate accounts: 2007 2006 2008 Weighted Average Actual Allocation Weighted Average Target Allocation December 31, Asset Category Equity securities . . . . . . . . . . . . . . . . . . . . . . . . . . . . . . . . . . . . . . . . . . . . . . . . . . . 38% 42% 30%-55% Fixed maturities . . . . . . . . . . . . . . . . . . . . . . . . . . . . . . . . . . . . . . . . . . . . . . . . . . . . 44% 42% 30%-65% Other (Real Estate and Alternative investments) . . . . . . . . . . . . . . . . . . . . . . . . . . . . . . . 18% 16% 10%-25% Total. . . . . . . . . . . . . . . . . . . . . . . . . . . . . . . . . . . . . . . . . . . . . . . . . . . . . . . . . . 100% 100% 64 MetLife, Inc.
  • 69.
    Target allocations ofassets are determined with the objective of maximizing returns and minimizing volatility of net assets through adequate asset diversification. Adjustments are made to target allocations based on an assessment of the impact of economic factors and market conditions. Other Postretirement Benefit Plan Assets Substantially all assets of the other postretirement benefit plans are invested within life insurance and reserve contracts issued by the Subsidiaries. The majority of assets are held in separate accounts established by the Subsidiaries. The account values of assets held with the Subsidiaries were $1,125 million and $1,116 million as of December 31, 2007 and 2006, respectively. The terms of these contracts are consistent in all material respects with those the Subsidiaries offer to unaffiliated parties that are similarly situated. The valuation of separate accounts and the investments within such separate accounts invested in by the other postretirement plans are similar to that described in the preceding section on pension plans. The following table summarizes the actual and target weighted-average allocations of other postretirement benefit plan assets within the separate accounts: 2007 2006 2008 Weighted Average Actual Allocation Weighted Average Target Allocation December 31, Asset Category Equity securities . . . . . . . . . . . . . . . . . . . . . . . . . . . . . . . . . . . . . . . . . . . . . . . . . . . 37% 37% 30%-45% Fixed maturities . . . . . . . . . . . . . . . . . . . . . . . . . . . . . . . . . . . . . . . . . . . . . . . . . . . . 58% 57% 45%-70% Other (Real Estate and Alternative investments) . . . . . . . . . . . . . . . . . . . . . . . . . . . . . . . 5% 6% 0%-10% Total. . . . . . . . . . . . . . . . . . . . . . . . . . . . . . . . . . . . . . . . . . . . . . . . . . . . . . . . . . 100% 100% Target allocations of assets are determined with the objective of maximizing returns and minimizing volatility of net assets through adequate asset diversification. Adjustments are made to target allocations based on an assessment of the impact of economic factors and market conditions. Funding and Cash Flows of Pension and Other Postretirement Benefit Plan Obligations Pension Plan Obligations It is the Subsidiaries’ practice to make contributions to the qualified pension plans to comply with minimum funding requirements of ERISA, as amended. In accordance with such practice, no contributions were required for the years ended December 31, 2007 or 2006. No contributions will be required for 2008. The Subsidiaries did not make any discretionary contributions to the qualified pension plans during the year ended December 31, 2007. During the year ended December 31, 2006, the Subsidiaries made discretionary contributions of $350 million. The Subsidiaries expect to make additional discretionary contributions of $150 million in 2008. Benefit payments due under the non-qualified pension plans are funded from the Subsidiaries’ general assets as they become due under the provision of the plans. These payments totaled $50 million and $38 million for the years ended December 31, 2007 and 2006, respectively. These benefit payments are expected to be at approximately the same level in 2008. Gross pension benefit payments for the next ten years, which reflect expected future service as appropriate, are expected to be as follows: Pension Benefits (In millions) 2008 . . . . . . . . . . . . . . . . . . . . . . . . . . . . . . . . . . . . . . . . . . . . . . . . . . . . . . . . . . . . . . . . . . . . $ 360 2009 . . . . . . . . . . . . . . . . . . . . . . . . . . . . . . . . . . . . . . . . . . . . . . . . . . . . . . . . . . . . . . . . . . . . $ 373 2010 . . . . . . . . . . . . . . . . . . . . . . . . . . . . . . . . . . . . . . . . . . . . . . . . . . . . . . . . . . . . . . . . . . . . $ 383 2011 . . . . . . . . . . . . . . . . . . . . . . . . . . . . . . . . . . . . . . . . . . . . . . . . . . . . . . . . . . . . . . . . . . . . $ 397 2012 . . . . . . . . . . . . . . . . . . . . . . . . . . . . . . . . . . . . . . . . . . . . . . . . . . . . . . . . . . . . . . . . . . . . $ 413 2013-2017 . . . . . . . . . . . . . . . . . . . . . . . . . . . . . . . . . . . . . . . . . . . . . . . . . . . . . . . . . . . . . . . . $2,288 Other Postretirement Benefit Plan Obligations Other postretirement benefits represent a non-vested, non-guaranteed obligation of the Subsidiaries and current regulations do not require specific funding levels for these benefits. While the Subsidiaries have funded such plans in advance, it has been the Subsidiaries’ practice to primarily use their general assets, net of participants’ contributions, to pay claims as they come due in lieu of utilizing plan assets. Total payments equaled $174 million and $152 million for the years ended December 31, 2007 and 2006, respectively. The Subsidiaries’ expect to make contributions of $116 million, net of participants’ contributions, towards the other postretirement plan obligations in 2008. As noted previously, the Subsidiaries expect to receive subsidies under the Prescription Drug Act to partially offset such payments. 65MetLife, Inc.
  • 70.
    Gross other postretirementbenefit payments for the next ten years, which reflect expected future service where appropriate, and gross subsidies to be received under the Prescription Drug Act are expected to be as follows: Gross Prescription Drug Subsidies Net (In millions) 2008 . . . . . . . . . . . . . . . . . . . . . . . . . . . . . . . . . . . . . . . . . . . . . . . . . . . . . . . $116 $ (14) $102 2009 . . . . . . . . . . . . . . . . . . . . . . . . . . . . . . . . . . . . . . . . . . . . . . . . . . . . . . . $120 $ (15) $105 2010 . . . . . . . . . . . . . . . . . . . . . . . . . . . . . . . . . . . . . . . . . . . . . . . . . . . . . . . $124 $ (16) $109 2011 . . . . . . . . . . . . . . . . . . . . . . . . . . . . . . . . . . . . . . . . . . . . . . . . . . . . . . . $129 $ (16) $113 2012 . . . . . . . . . . . . . . . . . . . . . . . . . . . . . . . . . . . . . . . . . . . . . . . . . . . . . . . $132 $ (17) $115 2013-2017 . . . . . . . . . . . . . . . . . . . . . . . . . . . . . . . . . . . . . . . . . . . . . . . . . . . $713 $(100) $613 Insolvency Assessments Most of the jurisdictions in which the Company is admitted to transact business require insurers doing business within the jurisdiction to participate in guaranty associations, which are organized to pay contractual benefits owed pursuant to insurance policies issued by impaired, insolvent or failed insurers. These associations levy assessments, up to prescribed limits, on all member insurers in a particular state on the basis of the proportionate share of the premiums written by member insurers in the lines of business in which the impaired, insolvent or failed insurer engaged. Some states permit member insurers to recover assessments paid through full or partial premium tax offsets. Assets and liabilities held for insolvency assessments are as follows: 2007 2006 December 31, (In millions) Other Assets: Premium tax offset for future undiscounted assessments . . . . . . . . . . . . . . . . . . . . . . . . . . . . . . . $40 $45 Premium tax offsets currently available for paid assessments . . . . . . . . . . . . . . . . . . . . . . . . . . . . . 6 7 Receivable for reimbursement of paid assessments(1) . . . . . . . . . . . . . . . . . . . . . . . . . . . . . . . . . 7 10 $53 $62 Liability: Insolvency assessments . . . . . . . . . . . . . . . . . . . . . . . . . . . . . . . . . . . . . . . . . . . . . . . . . . . . $74 $90 (1) The Company holds a receivable from the seller of a prior acquisition in accordance with the purchase agreement. Assessments levied against the Company were ($1) million, $2 million and $4 million for the years ended December 31, 2007, 2006 and 2005, respectively. Effects of Inflation The Company does not believe that inflation has had a material effect on its consolidated results of operations, except insofar as inflation may affect interest rates. Adoption of New Accounting Pronouncements Income Taxes Effective January 1, 2007, the Company adopted FIN 48. FIN 48 clarifies the accounting for uncertainty in income tax recognized in a company’s financial statements. FIN 48 requires companies to determine whether it is “more likely than not” that a tax position will be sustained upon examination by the appropriate taxing authorities before any part of the benefit can be recorded in the financial statements. It also provides guidance on the recognition, measurement, and classification of income tax uncertainties, along with any related interest and penalties. Previously recorded income tax benefits that no longer meet this standard are required to be charged to earnings in the period that such determination is made. As a result of the implementation of FIN 48, the Company recognized a $52 million increase in the liability for unrecognized tax benefits, a $4 million decrease in the interest liability for unrecognized tax benefits, and a corresponding reduction to the January 1, 2007 balance of retained earnings of $37 million, net of $11 million of minority interest. Insurance Contracts Effective January 1, 2007, the Company adopted SOP 05-1, Accounting by Insurance Enterprises for Deferred Acquisition Costs in Connection with Modifications or Exchanges of Insurance Contracts. SOP 05-1 which provides guidance on accounting by insurance enterprises for DAC on internal replacements of insurance and investment contracts other than those specifically described in SFAS No. 97, Accounting and Reporting by Insurance Enterprises for Certain Long-Duration Contracts and for Realized Gains and Losses from the Sale of Investments. SOP 05-1 defines an internal replacement and is effective for internal replacements occurring in fiscal years beginning after December 15, 2006. In addition, in February 2007, the American Institute of Certified Public Accountants (“AICPA”) issued related Technical Practice Aids (“TPAs”) to provide further clarification of SOP 05-1. The TPAs became effective concurrently with the adoption of SOP 05-1. As a result of the adoption of SOP 05-1 and the related TPAs, if an internal replacement modification substantially changes a contract, then the DAC is written off immediately through income and any new deferrable costs associated with the new replacement are deferred. If a contract modification does not substantially change the contract, the DAC amortization on the original contract will continue and any acquisition costs associated with the related modification are immediately expensed. The adoption of SOP 05-1 and the related TPAs resulted in a reduction to DAC and VOBA on January 1, 2007 and an acceleration of the amortization period relating primarily to the Company’s group life and health insurance contracts that contain certain rate reset provisions. Prior to the adoption of SOP 05-1, DAC on such contracts was amortized over the expected renewable life of the contract. Upon adoption 66 MetLife, Inc.
  • 71.
    of SOP 05-1,DAC on such contracts is to be amortized over the rate reset period. The impact as of January 1, 2007 was a cumulative effect adjustment of $292 million, net of income tax of $161 million, which was recorded as a reduction to retained earnings. Defined Benefit and Other Postretirement Plans Effective December 31, 2006, the Company adopted SFAS 158. The pronouncement revises financial reporting standards for defined benefit pension and other postretirement plans by requiring the: (i) recognition in the statement of financial position of the funded status of defined benefit plans measured as the difference between the fair value of plan assets and the benefit obligation, which is the projected benefit obligation for pension plans and the accumulated postretirement benefit obligation for other postretirement plans; (ii) recognition as an adjustment to accumulated other comprehensive income (loss), net of income tax, those amounts of actuarial gains and losses, prior service costs and credits, and net asset or obligation at transition that have not yet been included in net periodic benefit costs as of the end of the year of adoption; (iii) recognition of subsequent changes in funded status as a component of other comprehensive income; (iv) measurement of benefit plan assets and obligations as of the date of the statement of financial position; and (v) disclosure of additional information about the effects on the employer’s statement of financial position. The adoption of SFAS 158 resulted in a reduction of $744 million, net of income tax, to accumulated other comprehensive income, which is included as a component of total consolidated stockholders’ equity. As the Company’s measurement date for its pension and other postretirement benefit plans is already December 31 there was no impact of adoption due to changes in measurement date. See also “Summary of Critical Accounting Estimates.” Stock Compensation Plans As described previously, effective January 1, 2006, the Company adopted SFAS 123(r) including supplemental application guidance issued by the SEC in Staff Accounting Bulletin (“SAB”) No. 107, Share-Based Payment (“SAB 107”) — using the modified prospective transition method. In accordance with the modified prospective transition method, results for prior periods have not been restated. SFAS 123(r) requires that the cost of all stock-based transactions be measured at fair value and recognized over the period during which a grantee is required to provide goods or services in exchange for the award. The Company had previously adopted the fair value method of accounting for stock-based awards as prescribed by SFAS No. 123, Accounting for Stock-Based Compensation (“SFAS 123”) on a prospective basis effective January 1, 2003, and prior to January 1, 2003, accounted for its stock-based awards to employees under the intrinsic value method prescribed by APB 25. The Company did not modify the substantive terms of any existing awards prior to adoption of SFAS 123(r). Under the modified prospective transition method, compensation expense recognized during the year ended December 31, 2006 includes: (a) compensation expense for all stock-based awards granted prior to, but not yet vested as of January 1, 2006, based on the grant date fair value estimated in accordance with the original provisions of SFAS 123, and (b) compensation expense for all stock-based awards granted beginning January 1, 2006, based on the grant date fair value estimated in accordance with the provisions of SFAS 123(r). The adoption of SFAS 123(r) did not have a significant impact on the Company’s financial position or results of operations as all stock- based awards accounted for under the intrinsic value method prescribed by APB 25 had vested prior to the adoption date and the Company had adopted the fair value recognition provisions of SFAS 123 on January 1, 2003. SFAS 123 allowed forfeitures of stock-based awards to be recognized as a reduction of compensation expense in the period in which the forfeiture occurred. Upon adoption of SFAS 123(r), the Company changed its policy and now incorporates an estimate of future forfeitures into the determination of compensation expense when recognizing expense over the requisite service period. The impact of this change in accounting policy was not significant to the Company’s financial position or results of operations as of the date of adoption. Additionally, for awards granted after adoption, the Company changed its policy from recognizing expense for stock-based awards over the requisite service period to recognizing such expense over the shorter of the requisite service period or the period to attainment of retirement-eligibility. Prior to the adoption of SFAS 123(r), the Company presented tax benefits of deductions resulting from the exercise of stock options within operating cash flows in the consolidated statements of cash flows. SFAS 123(r) requires tax benefits resulting from tax deductions in excess of the compensation cost recognized for those options be classified and reported as a financing cash inflow upon adoption of SFAS 123(r). Derivative Financial Instruments The Company has adopted guidance relating to derivative financial instruments as follows: • Effective January 1, 2006, the Company adopted prospectively SFAS No. 155, Accounting for Certain Hybrid Instruments (“SFAS 155”). SFAS 155 amends SFAS No. 133, Accounting for Derivative Instruments and Hedging (“SFAS 133”) and SFAS No. 140, Accounting for Transfers and Servicing of Financial Assets and Extinguishments of Liabilities (“SFAS 140”). SFAS 155 allows financial instruments that have embedded derivatives to be accounted for as a whole, eliminating the need to bifurcate the derivative from its host, if the holder elects to account for the whole instrument on a fair value basis. In addition, among other changes, SFAS 155: (i) clarifies which interest-only strips and principal-only strips are not subject to the requirements of SFAS 133; (ii) establishes a requirement to evaluate interests in securitized financial assets to identify interests that are freestanding derivatives or that are hybrid financial instruments that contain an embedded derivative requiring bifurcation; (iii) clarifies that concentrations of credit risk in the form of subordination are not embedded derivatives; and (iv) amends SFAS 140 to eliminate the prohibition on a qualifying special-purpose entity (“QSPE”) from holding a derivative financial instrument that pertains to a beneficial interest other than another derivative financial interest. The adoption of SFAS 155 did not have a material impact on the Company’s consolidated financial statements. • Effective October 1, 2006, the Company adopted SFAS 133 Implementation Issue No. B40, Embedded Derivatives: Application of Paragraph 13(b) to Securitized Interests in Prepayable Financial Assets (“Issue B40”). Issue B40 clarifies that a securitized interest in prepayable financial assets is not subject to the conditions in paragraph 13(b) of SFAS 133, if it meets both of the following criteria: (i) the right to accelerate the settlement if the securitized interest cannot be controlled by the investor; and (ii) the securitized interest 67MetLife, Inc.
  • 72.
    itself does notcontain an embedded derivative (including an interest rate-related derivative) for which bifurcation would be required other than an embedded derivative that results solely from the embedded call options in the underlying financial assets. The adoption of Issue B40 did not have a material impact on the Company’s consolidated financial statements. • Effective January 1, 2006, the Company adopted prospectively SFAS 133 Implementation Issue No. B38, Embedded Derivatives: Evaluation of Net Settlement with Respect to the Settlement of a Debt Instrument through Exercise of an Embedded Put Option or Call Option (“Issue B38”) and SFAS 133 Implementation Issue No. B39, Embedded Derivatives: Application of Paragraph 13(b) to Call Options That Are Exercisable Only by the Debtor (“Issue B39”). Issue B38 clarifies that the potential settlement of a debtor’s obligation to a creditor occurring upon exercise of a put or call option meets the net settlement criteria of SFAS 133. Issue B39 clarifies that an embedded call option, in which the underlying is an interest rate or interest rate index, that can accelerate the settlement of a debt host financial instrument should not be bifurcated and fair valued if the right to accelerate the settlement can be exercised only by the debtor (issuer/borrower) and the investor will recover substantially all of its initial net investment. The adoption of Issues B38 and B39 did not have a material impact on the Company’s consolidated financial statements. Other Effective January 1, 2007, the Company adopted FASB Staff Position (“FSP”) Emerging Issues Task Force (“EITF”) 00-19-2, Accounting for Registration Payment Arrangements (“FSP EITF 00-19-2”). FSP EITF 00-19-2 specifies that the contingent obligation to make future payments or otherwise transfer consideration under a registration payment arrangement should be separately recognized and measured in accordance with SFAS No. 5, Accounting for Contingencies. The adoption of FSP EITF 00-19-2 did not have an impact on the Company’s consolidated financial statements. Effective January 1, 2007, the Company adopted FSP No. FAS 13-2, Accounting for a Change or Projected Change in the Timing of Cash Flows Relating to Income Taxes Generated by a Leveraged Lease Transaction (“FSP 13-2”). FSP 13-2 amends SFAS No. 13, Accounting for Leases, to require that a lessor review the projected timing of income tax cash flows generated by a leveraged lease annually or more frequently if events or circumstances indicate that a change in timing has occurred or is projected to occur. In addition, FSP 13-2 requires that the change in the net investment balance resulting from the recalculation be recognized as a gain or loss from continuing operations in the same line item in which leveraged lease income is recognized in the year in which the assumption is changed. The adoption of FSP 13-2 did not have a material impact on the Company’s consolidated financial statements. Effective January 1, 2007, the Company adopted SFAS No. 156, Accounting for Servicing of Financial Assets — an amendment of FASB Statement No. 140 (“SFAS 156”). Among other requirements, SFAS 156 requires an entity to recognize a servicing asset or servicing liability each time it undertakes an obligation to service a financial asset by entering into a servicing contract in certain situations. The adoption of SFAS 156 did not have an impact on the Company’s consolidated financial statements. Effective November 15, 2006, the Company adopted SAB No. 108, Considering the Effects of Prior Year Misstatements when Quantifying Misstatements in Current Year Financial Statements (“SAB 108”). SAB 108 provides guidance on how prior year misstatements should be considered when quantifying misstatements in current year financial statements for purposes of assessing materiality. SAB 108 requires that registrants quantify errors using both a balance sheet and income statement approach and evaluate whether either approach results in quantifying a misstatement that, when relevant quantitative and qualitative factors are considered, is material. SAB 108 permits companies to initially apply its provisions by either restating prior financial statements or recording a cumulative effect adjustment to the carrying values of assets and liabilities as of January 1, 2006 with an offsetting adjustment to retained earnings for errors that were previously deemed immaterial but are material under the guidance in SAB 108. The adoption of SAB 108 did not have a material impact on the Company’s consolidated financial statements. Effective January 1, 2006, the Company adopted prospectively EITF Issue No. 05-7, Accounting for Modifications to Conversion Options Embedded in Debt Instruments and Related Issues (“EITF 05-7”). EITF 05-7 provides guidance on whether a modification of conversion options embedded in debt results in an extinguishment of that debt. In certain situations, companies may change the terms of an embedded conversion option as part of a debt modification. The EITF concluded that the change in the fair value of an embedded conversion option upon modification should be included in the analysis of EITF Issue No. 96-19, Debtor’s Accounting for a Modification or Exchange of Debt Instruments, to determine whether a modification or extinguishment has occurred and that a change in the fair value of a conversion option should be recognized upon the modification as a discount (or premium) associated with the debt, and an increase (or decrease) in additional paid-in capital. The adoption of EITF 05-7 did not have a material impact on the Company’s consolidated financial statements. Effective January 1, 2006, the Company adopted EITF Issue No. 05-8, Income Tax Consequences of Issuing Convertible Debt with a Beneficial Conversion Feature (“EITF 05-8”). EITF 05-8 concludes that: (i) the issuance of convertible debt with a beneficial conversion feature results in a basis difference that should be accounted for as a temporary difference; and (ii) the establishment of the deferred tax liability for the basis difference should result in an adjustment to additional paid-in capital. EITF 05-8 was applied retrospectively for all instruments with a beneficial conversion feature accounted for in accordance with EITF Issue No. 98-5, Accounting for Convertible Securities with Beneficial Conversion Features or Contingently Adjustable Conversion Ratios, and EITF Issue No. 00-27, Application of Issue No. 98-5 to Certain Convertible Instruments. The adoption of EITF 05-8 did not have a material impact on the Company’s consolidated financial statements. Effective January 1, 2006, the Company adopted SFAS No. 154, Accounting Changes and Error Corrections, a replacement of APB Opinion No. 20 and FASB Statement No. 3 (“SFAS 154”). SFAS 154 requires retrospective application to prior periods’ financial statements for a voluntary change in accounting principle unless it is deemed impracticable. It also requires that a change in the method of depreciation, amortization, or depletion for long-lived, non-financial assets be accounted for as a change in accounting estimate rather than a change in accounting principle. The adoption of SFAS 154 did not have a material impact on the Company’s consolidated financial statements. In June 2005, the EITF reached consensus on Issue No. 04-5, Determining Whether a General Partner, or the General Partners as a Group, Controls a Limited Partnership or Similar Entity When the Limited Partners Have Certain Rights (“EITF 04-5”). EITF 04-5 provides a framework for determining whether a general partner controls and should consolidate a limited partnership or a similar entity in light of certain rights held by the limited partners. The consensus also provides additional guidance on substantive rights. EITF 04-5 was effective after June 29, 2005 for all newly formed partnerships and for any pre-existing limited partnerships that modified their partnership 68 MetLife, Inc.
  • 73.
    agreements after thatdate. For all other limited partnerships, EITF 04-5 required adoption by January 1, 2006 through a cumulative effect of a change in accounting principle recorded in opening equity or applied retrospectively by adjusting prior period financial statements. The adoption of the provisions of EITF 04-5 did not have a material impact on the Company’s consolidated financial statements. Effective November 9, 2005, the Company prospectively adopted the guidance in FSP No. FAS 140-2, Clarification of the Application of Paragraphs 40(b) and 40(c) of FAS 140 (“FSP 140-2”). FSP 140-2 clarified certain criteria relating to derivatives and beneficial interests when considering whether an entity qualifies as a QSPE. Under FSP 140-2, the criteria must only be met at the date the QSPE issues beneficial interests or when a derivative financial instrument needs to be replaced upon the occurrence of a specified event outside the control of the transferor. The adoption of FSP 140-2 did not have a material impact on the Company’s consolidated financial statements. Effective July 1, 2005, the Company adopted SFAS No. 153, Exchanges of Nonmonetary Assets, an amendment of APB Opinion No. 29 (“SFAS 153”). SFAS 153 amended prior guidance to eliminate the exception for nonmonetary exchanges of similar productive assets and replaced it with a general exception for exchanges of nonmonetary assets that do not have commercial substance. A nonmonetary exchange has commercial substance if the future cash flows of the entity are expected to change significantly as a result of the exchange. The provisions of SFAS 153 were required to be applied prospectively for fiscal periods beginning after June 15, 2005. The adoption of SFAS 153 did not have a material impact on the Company’s consolidated financial statements. Effective July 1, 2005, the Company adopted EITF Issue No. 05-6, Determining the Amortization Period for Leasehold Improvements (“EITF 05-6”). EITF 05-6 provides guidance on determining the amortization period for leasehold improvements acquired in a business combination or acquired subsequent to lease inception. As required by EITF 05-6, the Company adopted this guidance on a prospective basis which had no material impact on the Company’s consolidated financial statements. In June 2005, the FASB completed its review of EITF Issue No. 03-1, The Meaning of Other-Than-Temporary Impairment and Its Application to Certain Investments (“EITF 03-1”). EITF 03-1 provides accounting guidance regarding the determination of when an impairment of debt and marketable equity securities and investments accounted for under the cost method should be considered other- than-temporary and recognized in income. EITF 03-1 also requires certain quantitative and qualitative disclosures for debt and marketable equity securities classified as available-for-sale or held-to-maturity under SFAS No. 115, Accounting for Certain Investments in Debt and Equity Securities, that are impaired at the balance sheet date but for which an other-than-temporary impairment has not been recognized. The FASB decided not to provide additional guidance on the meaning of other-than-temporary impairment but has issued FSP Nos. FAS 115-1 and FAS 124-1, The Meaning of Other-Than-Temporary Impairment and its Application to Certain Investments (“FSP 115-1”), which nullifies the accounting guidance on the determination of whether an investment is other-than-temporarily impaired as set forth in EITF 03-1. As required by FSP 115-1, the Company adopted this guidance on a prospective basis, which had no material impact on the Company’s consolidated financial statements, and has provided the required disclosures. In December 2004, the FASB issued FSP No. FAS 109-2, Accounting and Disclosure Guidance for the Foreign Earnings Repatriation Provision within the American Jobs Creation Act of 2004 (“FSP 109-2”). The AJCA introduced a one-time dividend received deduction on the repatriation of certain earnings to a U.S. taxpayer. FSP 109-2 provides companies additional time beyond the financial reporting period of enactment to evaluate the effects of the AJCA on their plans to repatriate foreign earnings for purposes of applying SFAS No. 109, Accounting for Income Taxes. During 2005, the Company recorded a $27 million income tax benefit related to the repatriation of foreign earnings pursuant to Internal Revenue Code Section 965 for which a U.S. deferred income tax provision had previously been recorded. As of January 1, 2006, the repatriation provision of the AJCA no longer applies to the Company. Future Adoption of New Accounting Pronouncements Fair Value In September 2006, the FASB issued SFAS No. 157, Fair Value Measurements (“SFAS 157”). SFAS 157 defines fair value, establishes a framework for measuring fair value and requires enhanced disclosures about fair value measurements. Effective January 1, 2008, the Company adopted SFAS 157 and applied the provisions of the statement prospectively to assets and liabilities measured and disclosed at fair value. In addition to new disclosure requirements, the adoption of SFAS 157 changes the valuation of certain freestanding derivatives by moving from a mid to bid pricing convention as well as changing the valuation of embedded derivatives associated with annuity contracts. The change in valuation of embedded derivatives associated with annuity contracts results from the incorporation of risk margins and the Company’s own credit standing in their valuation. While the Company does not expect such changes in valuation to have a material impact on the Company’s financial statements at January 1, 2008, the addition of risk margins and the Company’s own credit spread in the valuation of embedded derivatives associated with annuity contracts may result in significant volatility in the Company’s consolidated net income. In February 2007, the FASB issued SFAS No. 159, The Fair Value Option for Financial Assets and Financial Liabilities (“SFAS 159”). SFAS 159 permits entities the option to measure most financial instruments and certain other items at fair value at specified election dates and to report related unrealized gains and losses in earnings. The fair value option is generally applied on an instrument-by-instrument basis and is generally an irrevocable election. Effective January 1, 2008, the Company has elected the fair value option on fixed maturity securities backing certain pension products sold in Brazil. Previously, these fixed maturity securities were accounted for as available-for- sale securities in accordance with FAS 115. The Company’s insurance joint venture in Japan also elected the fair value option for its single premium deferred annuities and supporting assets. These elections are not expected to have a material impact on the Company’s retained earnings or equity as of January 1, 2008. In June 2007, the AICPA issued SOP 07-1, Clarification of the Scope of the Audit and Accounting Guide Investment Companies and Accounting by Parent Companies and Equity Method Investors for Investments in Investment Companies (“SOP 07-1”) . Upon adoption of SOP 07-1, the Company must also adopt the provisions of FASB Staff Position No. FSP FIN 46(r)-7, Application of FASB Interpretation No. 46 to Investment Companies (“FSP FIN 46(r)-7”), which permanently exempts investment companies from applying the provisions of FIN No. 46(r), Consolidation of Variable Interest Entities — An Interpretation of Accounting Research Bulletin No. 51, and its December 2003 revision (“FIN 46(r)”) to investments carried at fair value. SOP 07-1 provides guidance for determining whether an entity falls within the scope of the AICPA Audit and Accounting Guide Investment Companies and whether investment company accounting should be retained by a parent company upon consolidation of an investment company subsidiary or by an equity method investor in an investment company. In certain circumstances, SOP 07-1 precludes retention of specialized accounting for investment companies (i.e., fair value accounting), when similar direct investments exist in the consolidated group and are measured on a basis inconsistent with that applied to investment 69MetLife, Inc.
  • 74.
    companies. Additionally, SOP07-1 precludes retention of specialized accounting for investment companies if the reporting entity does not distinguish through documented policies the nature and type of investments to be held in the investment companies from those made in the consolidated group where other accounting guidance is being applied. In February 2008, the FASB issued FSP No. SOP 7-1-1, Effective Date of AICPA Statement of Position 07-1, which delays indefinitely the effective date of SOP 07-1. The Company is closely monitoring further FASB developments. In May 2007, the FASB issued FSP No. FIN 39-1, Amendment of FASB Interpretation No. 39 (“FSP 39-1”). FSP 39-1 amends FIN No. 39, Offsetting of Amounts Related to Certain Contracts (“FIN 39”), to permit a reporting entity to offset fair value amounts recognized for the right to reclaim cash collateral (a receivable) or the obligation to return cash collateral (a payable) against fair value amounts recognized for derivative instruments executed with the same counterparty under the same master netting arrangement that have been offset in accordance with FIN 39. FSP 39-1 also amends FIN 39 for certain terminology modifications. FSP 39-1 applies to fiscal years beginning after November 15, 2007. FSP 39-1 will be applied retrospectively, unless it is impracticable to do so. Upon adoption of FSP 39-1, the Company is permitted to change its accounting policy to offset or not offset fair value amounts recognized for derivative instruments under master netting arrangements. The adoption of FSP 39-1 will not have an impact on the Company’s financial statements. Business Combinations In December 2007, the FASB issued SFAS No. 141 (revised 2007), Business Combinations — A Replacement of FASB Statement No. 141 (“SFAS 141(r)”) and SFAS No. 160, Noncontrolling Interests in Consolidated Financial Statements — An Amendment of ARB No. 51 (“SFAS 160”) which are effective for fiscal years beginning after December 15, 2008. Under SFAS 141(r) and SFAS 160: • All business combinations (whether full, partial, or “step” acquisitions) result in all assets and liabilities of an acquired business being recorded at fair value, with limited exceptions. • Acquisition costs are generally expensed as incurred; restructuring costs associated with a business combination are generally expensed as incurred subsequent to the acquisition date. • The fair value of the purchase price, including the issuance of equity securities, is determined on the acquisition date. • Certain acquired contingent liabilities are recorded at fair value at the acquisition date and subsequently measured at either the higher of such amount or the amount determined under existing guidance for non-acquired contingencies. • Changes in deferred tax asset valuation allowances and income tax uncertainties after the acquisition date generally affect income tax expense. • Noncontrolling interests (formerly known as “minority interests”) are valued at fair value at the acquisition date and are presented as equity rather than liabilities. • When control is attained on previously noncontrolling interests, the previously held equity interests are remeasured at fair value and a gain or loss is recognized. • Purchases or sales of equity interests that do not result in a change in control are accounted for as equity transactions. • When control is lost in a partial disposition, realized gains or losses are recorded on equity ownership sold and the remaining ownership interest is remeasured and holding gains or losses are recognized. The pronouncements are effective for fiscal years beginning on or after December 15, 2008 and apply prospectively to business combinations. Presentation and disclosure requirements related to noncontrolling interests must be retrospectively applied. The Company is currently evaluating the impact of SFAS 141(r) on its accounting for future acquisitions and the impact of SFAS 160 on its consolidated financial statements. Other In February 2008, the FASB issued FSP No. FAS 140-3, Accounting for Transfers of Financial Assets and Repurchase Financing Transactions (“FSP 140-3”). FSP 140-3 provides guidance for evaluating whether to account for a transfer of a financial asset and repurchase financing as a single transaction or as two separate transactions. FSP 140-3 is effective prospectively for financial statements issued for fiscal years beginning after November 15, 2008. The Company is currently evaluating the impact of FSP FAS 140-3 on its consolidated financial statements. In January 2008, the FASB cleared SFAS 133 Implementation Issue E23, Clarification of the Application of the Shortcut Method (“Issue E23”). Issue E23 amends SFAS 133 by permitting interest rate swaps to have a non-zero fair value at inception, as long as the difference between the transaction price (zero) and the fair value (exit price), as defined by SFAS 157, is solely attributable to a bid-ask spread. In addition, entities would not be precluded from assuming no ineffectiveness in a hedging relationship of interest rate risk involving an interest bearing asset or liability in situations where the hedged item is not recognized for accounting purposes until settlement date as long as the period between trade date and settlement date of the hedged item is consistent with generally established conventions in the marketplace. Issue E23 is effective for hedging relationships designated on or after January 1, 2008. The Company does not expect the adoption of Issue E23 to have a material impact on its consolidated financial statements. In December 2007, the FASB ratified as final the consensus on EITF Issue No. 07-6, Accounting for the Sale of Real Estate When the Agreement Includes a Buy-Sell Clause (“EITF 07-6”). EITF 07-6 addresses whether the existence of a buy-sell arrangement would preclude partial sales treatment when real estate is sold to a jointly owned entity. The consensus concludes that the existence of a buy-sell clause does not necessarily preclude partial sale treatment under current guidance. EITF 07-6 applies prospectively to new arrangements entered into and assessments on existing transactions performed in fiscal years beginning after December 15, 2008. The Company does not expect the adoption of EITF 07-6 to have a material impact on its consolidated financial statements. In November 2007, the SEC issued SAB No. 109, Written Loan Commitments Recorded at Fair Value through Earnings (“SAB 109”), which amends SAB No. 105, Application of Accounting Principles to Loan Commitments. SAB 109 provides guidance on: (i) incorporating expected net future cash flows when related to the associated servicing of a loan when measuring fair value; and (ii) broadening the SEC staff’s view that internally-developed intangible assets should not be recorded as part of the fair value of a derivative loan commitment or to written loan commitments that are accounted for at fair value through earnings. Internally-developed intangible assets are not considered a component of the related instruments. SAB 109 is effective for derivative loan commitments issued or modified in fiscal quarters beginning after December 15, 2007. The adoption of SAB 109 will not have an impact on the Company’s consolidated financial statements. 70 MetLife, Inc.
  • 75.
    Investments The Company’s primaryinvestment objective is to optimize, net of income tax, risk-adjusted investment income and risk-adjusted total return while ensuring that assets and liabilities are managed on a cash flow and duration basis. The Company is exposed to three primary sources of investment risk: • credit risk, relating to the uncertainty associated with the continued ability of a given obligor to make timely payments of principal and interest; • interest rate risk, relating to the market price and cash flow variability associated with changes in market interest rates; and • market valuation risk. The Company manages risk through in-house fundamental analysis of the underlying obligors, issuers, transaction structures and real estate properties. The Company also manages credit risk and market valuation risk through industry and issuer diversification and asset allocation. For real estate and agricultural assets, the Company manages credit risk and market valuation risk through geographic, property type and product type diversification and asset allocation. The Company manages interest rate risk as part of its asset and liability management strategies; product design, such as the use of market value adjustment features and surrender charges; and proactive monitoring and management of certain non-guaranteed elements of its products, such as the resetting of credited interest and dividend rates for policies that permit such adjustments. The Company also uses certain derivative instruments in the management of credit and interest rate risks. 71MetLife, Inc.
  • 76.
    Composition of InvestmentPortfolio Results The following table illustrates the net investment income, net investment gains (losses), annualized yields on average ending assets and ending carrying value for each of the components of the Company’s investment portfolio at: 2007 2006 2005 December 31, (In millions) FIXED MATURITY SECURITIES Yield(1) . . . . . . . . . . . . . . . . . . . . . . . . . . . . . . . . . . . . . . . . . . . . . . . . . . 6.34% 6.16% 6.41% Investment income(2). . . . . . . . . . . . . . . . . . . . . . . . . . . . . . . . . . . . . . . . . $ 12,882 $ 11,977 $ 10,351 Investment gains (losses) . . . . . . . . . . . . . . . . . . . . . . . . . . . . . . . . . . . . . . $ (622) $ (1,120) $ (868) Ending carrying value(2) . . . . . . . . . . . . . . . . . . . . . . . . . . . . . . . . . . . . . . . $243,021 $242,687 $229,303 MORTGAGE AND CONSUMER LOANS Yield(1) . . . . . . . . . . . . . . . . . . . . . . . . . . . . . . . . . . . . . . . . . . . . . . . . . . 6.55% 6.60% 6.81% Investment income(3). . . . . . . . . . . . . . . . . . . . . . . . . . . . . . . . . . . . . . . . . $ 2,701 $ 2,411 $ 2,236 Investment gains (losses) . . . . . . . . . . . . . . . . . . . . . . . . . . . . . . . . . . . . . . $ 2 $ (8) $ 17 Ending carrying value . . . . . . . . . . . . . . . . . . . . . . . . . . . . . . . . . . . . . . . . $ 47,030 $ 42,239 $ 37,190 REAL ESTATE AND REAL ESTATE JOINT VENTURES(4) Yield(1) . . . . . . . . . . . . . . . . . . . . . . . . . . . . . . . . . . . . . . . . . . . . . . . . . . 10.28% 11.55% 10.59% Investment income . . . . . . . . . . . . . . . . . . . . . . . . . . . . . . . . . . . . . . . . . . $ 607 $ 549 $ 467 Investment gains (losses) . . . . . . . . . . . . . . . . . . . . . . . . . . . . . . . . . . . . . . $ 57 $ 4,898 $ 2,139 Ending carrying value . . . . . . . . . . . . . . . . . . . . . . . . . . . . . . . . . . . . . . . . $ 6,769 $ 4,986 $ 4,665 POLICY LOANS Yield(1) . . . . . . . . . . . . . . . . . . . . . . . . . . . . . . . . . . . . . . . . . . . . . . . . . . 6.21% 5.99% 6.00% Investment income . . . . . . . . . . . . . . . . . . . . . . . . . . . . . . . . . . . . . . . . . . $ 637 $ 603 $ 572 Ending carrying value . . . . . . . . . . . . . . . . . . . . . . . . . . . . . . . . . . . . . . . . $ 10,419 $ 10,228 $ 9,981 EQUITY SECURITIES AND OTHER LIMITED PARTNERSHIP INTERESTS Yield(1) . . . . . . . . . . . . . . . . . . . . . . . . . . . . . . . . . . . . . . . . . . . . . . . . . . 15.59% 14.90% 12.83% Investment income . . . . . . . . . . . . . . . . . . . . . . . . . . . . . . . . . . . . . . . . . . $ 1,567 $ 1,067 $ 798 Investment gains (losses) . . . . . . . . . . . . . . . . . . . . . . . . . . . . . . . . . . . . . . $ 180 $ 85 $ 159 Ending carrying value . . . . . . . . . . . . . . . . . . . . . . . . . . . . . . . . . . . . . . . . $ 12,205 $ 9,875 $ 7,614 CASH AND SHORT-TERM INVESTMENTS Yield(1) . . . . . . . . . . . . . . . . . . . . . . . . . . . . . . . . . . . . . . . . . . . . . . . . . . 4.74% 5.51% 3.66% Investment income . . . . . . . . . . . . . . . . . . . . . . . . . . . . . . . . . . . . . . . . . . $ 437 $ 442 $ 362 Investment gains (losses) . . . . . . . . . . . . . . . . . . . . . . . . . . . . . . . . . . . . . . $ 3 $ (2) $ (2) Ending carrying value . . . . . . . . . . . . . . . . . . . . . . . . . . . . . . . . . . . . . . . . $ 13,016 $ 9,816 $ 7,324 OTHER INVESTED ASSETS(5) Yield(1) . . . . . . . . . . . . . . . . . . . . . . . . . . . . . . . . . . . . . . . . . . . . . . . . . . 8.98% 9.60% 8.96% Investment income . . . . . . . . . . . . . . . . . . . . . . . . . . . . . . . . . . . . . . . . . . $ 887 $ 821 $ 570 Investment gains (losses) . . . . . . . . . . . . . . . . . . . . . . . . . . . . . . . . . . . . . . $ (627) $ (736) $ 508 Ending carrying value . . . . . . . . . . . . . . . . . . . . . . . . . . . . . . . . . . . . . . . . $ 12,642 $ 10,428 $ 8,078 TOTAL INVESTMENTS Gross investment income yield(1) . . . . . . . . . . . . . . . . . . . . . . . . . . . . . . . . . 6.81% 6.62% 6.66% Investment fees and expenses yield . . . . . . . . . . . . . . . . . . . . . . . . . . . . . . . (0.15)% (0.15)% (0.15)% NET INVESTMENT INCOME YIELD . . . . . . . . . . . . . . . . . . . . . . . . . . . . . 6.66% 6.47% 6.51% Gross investment income . . . . . . . . . . . . . . . . . . . . . . . . . . . . . . . . . . . . . . $ 19,718 $ 17,870 $ 15,356 Investment fees and expenses. . . . . . . . . . . . . . . . . . . . . . . . . . . . . . . . . . . (440) (404) (339) NET INVESTMENT INCOME . . . . . . . . . . . . . . . . . . . . . . . . . . . . . . . . . . $ 19,278 $ 17,466 $ 15,017 Ending carrying value . . . . . . . . . . . . . . . . . . . . . . . . . . . . . . . . . . . . . . . . $345,102 $330,259 $304,155 Gross investment gains . . . . . . . . . . . . . . . . . . . . . . . . . . . . . . . . . . . . . . . $ 1,440 $ 5,754 $ 3,340 Gross investment losses . . . . . . . . . . . . . . . . . . . . . . . . . . . . . . . . . . . . . . (1,765) (2,036) (1,578) Writedowns . . . . . . . . . . . . . . . . . . . . . . . . . . . . . . . . . . . . . . . . . . . . . . . (148) (136) (116) Subtotal . . . . . . . . . . . . . . . . . . . . . . . . . . . . . . . . . . . . . . . . . . . . . . . . . $ (473) $ 3,582 $ 1,646 Derivative and other instruments not qualifying for hedge accounting . . . . . . . . . . (534) (465) 307 INVESTMENT GAINS (LOSSES) . . . . . . . . . . . . . . . . . . . . . . . . . . . . . . . . $ (1,007) $ 3,117 $ 1,953 Minority interest — investment gains (losses) . . . . . . . . . . . . . . . . . . . . . . . . . 33 — (9) Investment gains (losses) tax benefit (provision) . . . . . . . . . . . . . . . . . . . . . . . . 326 (1,114) (681) INVESTMENT GAINS (LOSSES), NET OF INCOME TAX . . . . . . . . . . . . . . . $ (648) $ 2,003 $ 1,263 (1) Yields are based on quarterly average asset carrying values, excluding recognized and unrealized investment gains (losses), and for yield calculation purposes, average assets exclude collateral associated with the Company’s securities lending program. (2) Fixed maturity securities include $779 million, $759 million and $825 million in ending carrying value related to trading securities at December 31, 2007, 2006 and 2005, respectively. Fixed maturity securities include $50 million, $71 million and $14 million of investment income related to trading securities for the years ended December 31, 2007, 2006 and 2005, respectively. (3) Investment income from mortgage and consumer loans includes prepayment fees. 72 MetLife, Inc.
  • 77.
    (4) Included ininvestment income from real estate and real estate joint ventures is $16 million, $94 million and $162 million related to discontinued operations for the years ended December 31, 2007, 2006 and 2005, respectively. Included in investment gains (losses) from real estate and real estate joint ventures is $13 million, $4.8 billion and $2.1 billion of gains related to discontinued operations for the years ended December 31, 2007, 2006 and 2005, respectively. (5) Included in investment income from other invested assets are scheduled periodic settlement payments on derivative instruments that do not qualify for hedge accounting under SFAS No. 133, Accounting for Derivative Instruments and Hedging, of $256 million, $290 million and $99 million for the years ended December 31, 2007, 2006 and 2005, respectively. These amounts are excluded from investment gains (losses). Additionally, excluded from investment gains (losses) is $26 million, $6 million and ($13) million for the years ended December 31, 2007, 2006 and 2005, respectively, related to settlement payments on derivatives used to hedge interest rate and currency risk on policyholders account balances that do not qualify for hedge accounting. Such amounts are included within interest credited to policyholders account balances. Fixed Maturity and Equity Securities Available-for-Sale Fixed maturity securities consisted principally of publicly traded and privately placed debt securities, and represented 70% and 73% of total cash and invested assets at December 31, 2007 and 2006, respectively. Based on estimated fair value, public fixed maturity securities represented $205.4 billion, or 85%, and $209.2 billion, or 86%, of total fixed maturity securities at December 31, 2007 and 2006, respectively. Based on estimated fair value, private fixed maturity securities represented $36.8 billion, or 15%, and $32.7 billion, or 14%, of total fixed maturity securities at December 31, 2007 and 2006, respectively. In cases where quoted market prices are not available, fair values are estimated using present value or valuation techniques. The fair value estimates are made at a specific point in time, based on available market information and judgments about the financial instruments, including estimates of the timing and amounts of expected future cash flows and the credit standing of the issuer or counterparty. Factors considered in estimating fair value include: coupon rate, maturity, estimated duration, call provisions, sinking fund requirements, credit rating, industry sector of the issuer and quoted market prices of comparable securities. The Securities Valuation Office of the NAIC evaluates the fixed maturity investments of insurers for regulatory reporting purposes and assigns securities to one of six investment categories called “NAIC designations.” The NAIC ratings are similar to the rating agency designations of the Nationally Recognized Statistical Rating Organizations (“NRSROs”) for marketable bonds. NAIC ratings 1 and 2 include bonds generally considered investment grade (rated “Baa3” or higher by Moody’s, or rated “BBB-” or higher by Standard & Poor’s (“S&P”) and Fitch Ratings Insurance Group (“Fitch”)), by such rating organizations. NAIC ratings 3 through 6 include bonds generally considered below investment grade (rated “Ba1” or lower by Moody’s, or rated “BB+” or lower by S&P and Fitch). The following table presents the Company’s total fixed maturity securities by NRSRO designation and the equivalent ratings of the NAIC, as well as the percentage, based on estimated fair value, that each designation is comprised of at: NAIC Rating Rating Agency Designation(1) Cost or Amortized Cost Estimated Fair Value % of Total Cost or Amortized Cost Estimated Fair Value % of Total December 31, 2007 December 31, 2006 (In millions) 1 Aaa/Aa/A . . . . . . . . . . . . . . . . . . . . . . $172,711 $175,651 72.5% $174,430 $177,969 73.6% 2 Baa . . . . . . . . . . . . . . . . . . . . . . . . . . 48,265 48,914 20.2 45,897 46,881 19.4 3 Ba . . . . . . . . . . . . . . . . . . . . . . . . . . . 10,676 10,738 4.4 9,332 9,738 4.0 4 B . . . . . . . . . . . . . . . . . . . . . . . . . . . 6,632 6,481 2.7 6,814 7,030 2.9 5 Caa and lower . . . . . . . . . . . . . . . . . . . 476 445 0.2 283 294 0.1 6 In or near default . . . . . . . . . . . . . . . . . 1 13 — 12 16 — Total fixed maturity securities . . . . . . . . . . $238,761 $242,242 100.0% $236,768 $241,928 100.0% (1) Amounts presented are based on rating agency designations. Comparisons between NAIC ratings and rating agency designations are published by the NAIC. The rating agency designations are based on availability and the midpoint of the applicable ratings among Moody’s, S&P and Fitch. If no rating is available from a rating agency, then the MetLife rating is used. The Company held fixed maturity securities at estimated fair values that were below investment grade or not rated by an independent rating agency that totaled $17.7 billion and $17.3 billion at December 31, 2007 and 2006, respectively. These securities had net unrealized gains (losses) of ($108) million and $627 million at December 31, 2007 and 2006, respectively. Non-income producing fixed maturity securities were $13 million and $16 million at December 31, 2007 and 2006, respectively. Net unrealized gains associated with non- income producing fixed maturity securities were $12 million and $4 million at December 31, 2007 and 2006, respectively. 73MetLife, Inc.
  • 78.
    The amortized costand estimated fair value of fixed maturity securities, by contractual maturity date (excluding scheduled sinking funds), are as follows: Amortized Cost Estimated Fair Value Amortized Cost Estimated Fair Value 2007 2006 December 31, (In millions) Due in one year or less . . . . . . . . . . . . . . . . . . . . . . . . . . . . . . . $ 4,537 $ 4,628 $ 6,923 $ 7,011 Due after one year through five years . . . . . . . . . . . . . . . . . . . . . . 42,453 43,167 45,331 45,928 Due after five years through ten years . . . . . . . . . . . . . . . . . . . . . 40,783 41,046 39,571 40,200 Due after ten years . . . . . . . . . . . . . . . . . . . . . . . . . . . . . . . . . . 65,496 68,143 63,023 66,728 Subtotal . . . . . . . . . . . . . . . . . . . . . . . . . . . . . . . . . . . 153,269 156,984 154,848 159,867 Mortgage-backed and asset-backed securities . . . . . . . . . . . . . . . 85,492 85,258 81,920 82,061 Total fixed maturity securities . . . . . . . . . . . . . . . . . . . . . $238,761 $242,242 $236,768 $241,928 Fixed maturity securities not due at a single maturity date have been included in the above table in the year of final contractual maturity. Actual maturities may differ from contractual maturities due to the exercise of prepayment options. Sales or disposals of fixed maturity and equity securities classified as available-for-sale are as follows: 2007 2006 2005 Years Ended December 31, (In millions) Proceeds . . . . . . . . . . . . . . . . . . . . . . . . . . . . . . . . . . . . . . . . . . . . . . . . . . $80,685 $89,869 $127,709 Gross investment gains . . . . . . . . . . . . . . . . . . . . . . . . . . . . . . . . . . . . . . . . . $ 831 $ 580 $ 704 Gross investment losses . . . . . . . . . . . . . . . . . . . . . . . . . . . . . . . . . . . . . . . . $ (1,183) $ (1,533) $ (1,391) The following tables present the cost or amortized cost, gross unrealized gain and loss, and estimated fair value of the Company’s fixed maturity and equity securities, the percentage that each sector represents by the total fixed maturity securities holdings and by the total equity securities holdings at: Cost or Amortized Cost Gain Loss Estimated Fair Value % of Total Gross Unrealized December 31, 2007 (In millions) U.S. corporate securities . . . . . . . . . . . . . . . . . . . . . . . . . . . $ 77,875 $1,725 $2,174 $ 77,426 32.0% Residential mortgage-backed securities . . . . . . . . . . . . . . . . . . 56,267 611 389 56,489 23.3 Foreign corporate securities . . . . . . . . . . . . . . . . . . . . . . . . . 37,359 1,740 794 38,305 15.8 U.S. Treasury/agency securities . . . . . . . . . . . . . . . . . . . . . . . 19,771 1,487 13 21,245 8.8 Commercial mortgage-backed securities . . . . . . . . . . . . . . . . . 17,676 251 199 17,728 7.3 Foreign government securities . . . . . . . . . . . . . . . . . . . . . . . . 13,535 1,924 188 15,271 6.3 Asset-backed securities . . . . . . . . . . . . . . . . . . . . . . . . . . . . 11,549 41 549 11,041 4.6 State and political subdivision securities . . . . . . . . . . . . . . . . . 4,394 140 115 4,419 1.8 Other fixed maturity securities . . . . . . . . . . . . . . . . . . . . . . . . 335 13 30 318 0.1 Total fixed maturity securities . . . . . . . . . . . . . . . . . . . . . . . $238,761 $7,932 $4,451 $242,242 100.0% Common stock . . . . . . . . . . . . . . . . . . . . . . . . . . . . . . . . . . $ 2,488 $ 568 $ 108 $ 2,948 48.7% Non-redeemable preferred stock . . . . . . . . . . . . . . . . . . . . . . 3,403 61 362 3,102 51.3 Total equity securities(1) . . . . . . . . . . . . . . . . . . . . . . $ 5,891 $ 629 $ 470 $ 6,050 100.0% 74 MetLife, Inc.
  • 79.
    Cost or Amortized Cost GainLoss Estimated Fair Value % of Total Gross Unrealized December 31, 2006 (In millions) U.S. corporate securities . . . . . . . . . . . . . . . . . . . . . . . . . . . $ 74,010 $2,047 $ 983 $ 75,074 31.0% Residential mortgage-backed securities . . . . . . . . . . . . . . . . . . 51,602 385 321 51,666 21.4 Foreign corporate securities . . . . . . . . . . . . . . . . . . . . . . . . . 33,029 1,687 378 34,338 14.2 U.S. Treasury/agency securities . . . . . . . . . . . . . . . . . . . . . . . 29,897 984 248 30,633 12.7 Commercial mortgage-backed securities . . . . . . . . . . . . . . . . . 16,467 193 138 16,522 6.8 Foreign government securities . . . . . . . . . . . . . . . . . . . . . . . . 11,406 1,835 34 13,207 5.4 Asset-backed securities . . . . . . . . . . . . . . . . . . . . . . . . . . . . 13,851 75 53 13,873 5.7 State and political subdivision securities . . . . . . . . . . . . . . . . . 6,121 230 51 6,300 2.6 Other fixed maturity securities . . . . . . . . . . . . . . . . . . . . . . . . 385 7 77 315 0.2 Total fixed maturity securities . . . . . . . . . . . . . . . . . . . . . . . $236,768 $7,443 $2,283 $241,928 100.0% Common stock . . . . . . . . . . . . . . . . . . . . . . . . . . . . . . . . . . $ 1,798 $ 487 $ 16 $ 2,269 44.5% Non-redeemable preferred stock . . . . . . . . . . . . . . . . . . . . . . 2,751 103 29 2,825 55.5 Total equity securities(1) . . . . . . . . . . . . . . . . . . . . . . $ 4,549 $ 590 $ 45 $ 5,094 100.0% (1) Equity securities primarily consist of investments in common and preferred stocks and mutual fund interests. Such securities include private equity securities with an estimated fair value of $599 million and $238 million at December 31, 2007 and 2006, respectively. The Company is not exposed to any significant concentrations of credit risk in its equity securities portfolio. The Company is exposed to concentrations of credit risk related to U.S. Treasury securities and obligations of U.S. government corporations and agencies. Addi- tionally, at December 31, 2007 and 2006, the Company had exposure to fixed maturity securities backed by sub-prime mortgages with estimated fair values of $2.2 billion and $3.0 billion, respectively, and unrealized losses of $219 million and $5 million, respectively. These securities are classified within asset-backed securities in the immediately preceding table. At December 31, 2007, 32% have been guaranteed by financial guarantors, of which 55% was guaranteed by financial guarantors who remain Aaa rated in 2008. Overall, at December 31, 2007, $6.7 billion of the estimated fair value of the Company’s fixed maturity securities were credit enhanced by financial guarantors of which $2.5 billion, $2.5 billion and $1.7 billion at December 31, 2007, are included within state and political subdivisions, corporate securities and asset-backed securities, respectively, and 80% were guaranteed by financial guarantors who remain Aaa rated in 2008. Fixed Maturity and Equity Security Impairment. The Company classifies all of its fixed maturity and equity securities as available-for- sale and marks them to market through other comprehensive income, except for non-marketable private equities, which are generally carried at cost and trading securities which are carried at fair value with subsequent changes in fair value recognized in net investment income. All securities with gross unrealized losses at the consolidated balance sheet date are subjected to the Company’s process for identifying other-than-temporary impairments. The Company writes down to fair value securities that it deems to be other-than-temporarily impaired in the period the securities are deemed to be so impaired. The assessment of whether such impairment has occurred is based on management’s case-by-case evaluation of the underlying reasons for the decline in fair value. Management considers a wide range of factors, as described in “— Summary of Critical Accounting Estimates — Investments,” about the security issuer and uses its best judgment in evaluating the cause of the decline in the estimated fair value of the security and in assessing the prospects for near-term recovery. Inherent in management’s evaluation of the security are assumptions and estimates about the operations of the issuer and its future earnings potential. The Company’s review of its fixed maturity and equity securities for impairments includes an analysis of the total gross unrealized losses by three categories of securities: (i) securities where the estimated fair value had declined and remained below cost or amortized cost by less than 20%; (ii) securities where the estimated fair value had declined and remained below cost or amortized cost by 20% or more for less than six months; and (iii) securities where the estimated fair value had declined and remained below cost or amortized cost by 20% or more for six months or greater. While all of these securities are monitored for potential impairment, the Company’s experience indicates that the first two categories do not present as great a risk of impairment and, often, fair values recover over time as the factors that caused the declines improve. The Company records impairments as investment losses and adjusts the cost basis of the fixed maturity and equity securities accordingly. The Company does not change the revised cost basis for subsequent recoveries in value. Impairments of fixed maturity and equity securities were $106 million, $82 million and $64 million for the years ended December 31, 2007, 2006 and 2005, respectively. The Company’s credit-related impairments of fixed maturity and equity securities were $86 million, $82 million and $64 million for the years ended December 31, 2007, 2006 and 2005, respectively. The Company’s three largest impairments totaled $19 million, $33 million and $40 million for the years ended December 31, 2007, 2006 and 2005, respectively. The circumstances that gave rise to these impairments were financial restructurings, bankruptcy filings or difficult underlying operating environments for the entities concerned. During the years ended December 31, 2007, 2006 and 2005, the Company sold or disposed of fixed maturity and equity securities at a loss that had a fair value of $46.8 billion, $70.3 billion and $93.9 billion, respectively. Gross losses excluding impairments for fixed maturity and equity securities were $1.2 billion, $1.5 billion and $1.4 billion for the years ended December 31, 2007, 2006 and 2005, respectively. 75MetLife, Inc.
  • 80.
    The following tablespresent the cost or amortized cost, gross unrealized loss and number of securities for fixed maturity and equity securities, where the estimated fair value had declined and remained below cost or amortized cost by less than 20%, or 20% or more at: Less than 20% 20% or more Less than 20% 20% or more Less than 20% 20% or more Cost or Amortized Cost Gross Unrealized Loss Number of Securities December 31, 2007 (In millions, except number of securities) Less than six months . . . . . . . . . . . . . . . . . . . . . . . . . . . . . . . . . . . $ 49,463 $1,943 $1,670 $555 6,339 644 Six months or greater but less than nine months. . . . . . . . . . . . . . . . . . 17,353 23 844 7 1,461 31 Nine months or greater but less than twelve months . . . . . . . . . . . . . . . 9,410 7 568 2 791 1 Twelve months or greater . . . . . . . . . . . . . . . . . . . . . . . . . . . . . . . . . 31,731 50 1,262 13 3,192 32 Total . . . . . . . . . . . . . . . . . . . . . . . . . . . . . . . . . . . . . . . . $107,957 $2,023 $4,344 $577 Less than 20% 20% or more Less than 20% 20% or more Less than 20% 20% or more Cost or Amortized Cost Gross Unrealized Loss Number of Securities December 31, 2006 (In millions, except number of securities) Less than six months . . . . . . . . . . . . . . . . . . . . . . . . . . . . . . . . . . $ 52,222 $35 $ 547 $12 9,093 81 Six months or greater but less than nine months . . . . . . . . . . . . . . . . . 2,682 3 42 1 415 2 Nine months or greater but less than twelve months . . . . . . . . . . . . . . 12,049 14 204 4 937 1 Twelve months or greater . . . . . . . . . . . . . . . . . . . . . . . . . . . . . . . . 47,462 29 1,511 7 4,634 6 Total. . . . . . . . . . . . . . . . . . . . . . . . . . . . . . . . . . . . . . . . $114,415 $81 $2,304 $24 At December 31, 2007 and 2006, $4.3 billion and $2.3 billion, respectively, of unrealized losses related to securities with an unrealized loss position of less than 20% of cost or amortized cost, which represented 4% and 2%, respectively, of the cost or amortized cost of such securities. At December 31, 2007, $577 million of unrealized losses related to securities with an unrealized loss position of 20% or more of cost or amortized cost, which represented 29% of the cost or amortized cost of such securities. Of such unrealized losses of $577 million, $555 million related to securities that were in an unrealized loss position for a period of less than six months. At December 31, 2006, $24 million of unrealized losses related to securities with an unrealized loss position of 20% or more of cost or amortized cost, which represented 30% of the cost or amortized cost of such securities. Of such unrealized losses of $24 million, $12 million related to securities that were in an unrealized loss position for a period of less than six months. The Company held 30 fixed maturity and equity securities, each with a gross unrealized loss at December 31, 2007 of greater than $10 million. These securities represented 9%, or $459 million in the aggregate, of the gross unrealized loss on fixed maturity and equity securities. The Company held eight fixed maturity and equity securities, each with a gross unrealized loss at December 31, 2006 of greater than $10 million. These securities represented 7%, or $169 million in the aggregate, of the gross unrealized loss on fixed maturity and equity securities. At December 31, 2007 and 2006, the Company had $4.9 billion and $2.3 billion, respectively, of gross unrealized losses related to its fixed maturity and equity securities. These securities are concentrated, calculated as a percentage of gross unrealized loss, as follows: 2007 2006 December 31, Sector: U.S. corporate securities . . . . . . . . . . . . . . . . . . . . . . . . . . . . . . . . . . . . . . . . . . . . . . . . . . . . . 44% 42% Foreign corporate securities . . . . . . . . . . . . . . . . . . . . . . . . . . . . . . . . . . . . . . . . . . . . . . . . . . . 16 16 Asset-backed securities . . . . . . . . . . . . . . . . . . . . . . . . . . . . . . . . . . . . . . . . . . . . . . . . . . . . . . 11 2 Residential mortgage-backed securities . . . . . . . . . . . . . . . . . . . . . . . . . . . . . . . . . . . . . . . . . . . . 8 14 Foreign government securities . . . . . . . . . . . . . . . . . . . . . . . . . . . . . . . . . . . . . . . . . . . . . . . . . . 4 1 Commercial mortgage-backed securities . . . . . . . . . . . . . . . . . . . . . . . . . . . . . . . . . . . . . . . . . . . 4 6 U.S. Treasury/agency securities . . . . . . . . . . . . . . . . . . . . . . . . . . . . . . . . . . . . . . . . . . . . . . . . . — 11 Other . . . . . . . . . . . . . . . . . . . . . . . . . . . . . . . . . . . . . . . . . . . . . . . . . . . . . . . . . . . . . . . . . . 13 8 Total . . . . . . . . . . . . . . . . . . . . . . . . . . . . . . . . . . . . . . . . . . . . . . . . . . . . . . . . . . . . . 100% 100% Industry: Finance. . . . . . . . . . . . . . . . . . . . . . . . . . . . . . . . . . . . . . . . . . . . . . . . . . . . . . . . . . . . . . . . . 34% 10% Industrial . . . . . . . . . . . . . . . . . . . . . . . . . . . . . . . . . . . . . . . . . . . . . . . . . . . . . . . . . . . . . . . . 18 23 Mortgage-backed . . . . . . . . . . . . . . . . . . . . . . . . . . . . . . . . . . . . . . . . . . . . . . . . . . . . . . . . . . 12 20 Utility . . . . . . . . . . . . . . . . . . . . . . . . . . . . . . . . . . . . . . . . . . . . . . . . . . . . . . . . . . . . . . . . . . 8 11 Government . . . . . . . . . . . . . . . . . . . . . . . . . . . . . . . . . . . . . . . . . . . . . . . . . . . . . . . . . . . . . . 4 12 Other . . . . . . . . . . . . . . . . . . . . . . . . . . . . . . . . . . . . . . . . . . . . . . . . . . . . . . . . . . . . . . . . . . 24 24 Total . . . . . . . . . . . . . . . . . . . . . . . . . . . . . . . . . . . . . . . . . . . . . . . . . . . . . . . . . . . . . 100% 100% 76 MetLife, Inc.
  • 81.
    As described previously,the Company performs a regular evaluation, on a security-by-security basis, of its investment holdings in accordance with its impairment policy in order to evaluate whether such securities are other-than-temporarily impaired. One of the criteria which the Company considers in its other-than-temporary impairment analysis is its intent and ability to hold securities for a period of time sufficient to allow for the recovery of their value to an amount equal to or greater than cost or amortized cost. The Company’s intent and ability to hold securities considers broad portfolio management objectives such as asset/liability duration management, issuer and industry segment exposures, interest rate views and the overall total return focus. In following these portfolio management objectives, changes in facts and circumstances that were present in past reporting periods may trigger a decision to sell securities that were held in prior reporting periods. Decisions to sell are based on current conditions or the Company’s need to shift the portfolio to maintain its portfolio management objectives including liquidity needs or duration targets on asset/liability managed portfolios. The Company attempts to anticipate these types of changes and if a sale decision has been made on an impaired security and that security is not expected to recover prior to the expected time of sale, the security will be deemed other-than-temporarily impaired in the period that the sale decision was made and an other-than-temporary impairment loss will be recognized. Based upon the Company’s current evaluation of the securities in accordance with its impairment policy, the cause of the decline being principally attributable to the general rise in interest rates during the holding period, and the Company’s current intent and ability to hold the fixed maturity and equity securities with unrealized losses for a period of time sufficient for them to recover, the Company has concluded that the aforementioned securities are not other-than-temporarily impaired. Corporate Fixed Maturity Securities. The table below shows the major industry types that comprise the corporate fixed maturity holdings at: Estimated Fair Value % of Total Estimated Fair Value % of Total December 31, 2007 December 31, 2006 (In millions) Industrial . . . . . . . . . . . . . . . . . . . . . . . . . . . . . . . . . . . . . . . . . . . . . $ 40,399 34.9% $ 39,296 35.9% Foreign(1) . . . . . . . . . . . . . . . . . . . . . . . . . . . . . . . . . . . . . . . . . . . . 38,305 33.1 34,338 31.5 Finance . . . . . . . . . . . . . . . . . . . . . . . . . . . . . . . . . . . . . . . . . . . . . . 22,013 19.0 21,559 19.7 Utility . . . . . . . . . . . . . . . . . . . . . . . . . . . . . . . . . . . . . . . . . . . . . . . . 13,780 11.9 13,038 11.9 Other . . . . . . . . . . . . . . . . . . . . . . . . . . . . . . . . . . . . . . . . . . . . . . . 1,234 1.1 1,181 1.0 Total . . . . . . . . . . . . . . . . . . . . . . . . . . . . . . . . . . . . . . . . . . $115,731 100.0% $109,412 100.0% (1) Includes U.S. dollar-denominated debt obligations of foreign obligors, and other foreign investments. The Company maintains a diversified corporate fixed maturity portfolio across industries and issuers. The portfolio does not have exposure to any single issuer in excess of 1% of the total invested assets of the portfolio. At December 31, 2007 and 2006, the Company’s combined holdings in the ten issuers to which it had the greatest exposure totaled $7.8 billion and $6.8 billion, respectively, each less than 3% of the Company’s total invested assets at such dates. The exposure to the largest single issuer of corporate fixed maturity securities held at December 31, 2007 and 2006 was $1.2 billion and $970 million, respectively. The Company has hedged all of its material exposure to foreign currency risk in its corporate fixed maturity portfolio. In the Company’s international insurance operations, both its assets and liabilities are generally denominated in local currencies. Structured Securities. The following table shows the types of structured securities the Company held at: Estimated Fair Value % of Total Estimated Fair Value % of Total December 31, 2007 December 31, 2006 (In millions) Residential mortgage-backed securities: Collateralized mortgage obligations . . . . . . . . . . . . . . . . . . . . . . . . . . . . $37,372 43.8% $33,034 40.3% Pass-through securities . . . . . . . . . . . . . . . . . . . . . . . . . . . . . . . . . . . 19,117 22.4 18,632 22.7 Total residential mortgage-backed securities . . . . . . . . . . . . . . . . . . . . . . . 56,489 66.2 51,666 63.0 Commercial mortgage-backed securities . . . . . . . . . . . . . . . . . . . . . . . . . . 17,728 20.8 16,522 20.1 Asset-backed securities . . . . . . . . . . . . . . . . . . . . . . . . . . . . . . . . . . . . 11,041 13.0 13,873 16.9 Total . . . . . . . . . . . . . . . . . . . . . . . . . . . . . . . . . . . . . . . . . . . . . . $85,258 100.0% $82,061 100.0% The majority of the residential mortgage-backed securities are guaranteed or otherwise supported by the Federal National Mortgage Association, the Federal Home Loan Mortgage Corporation or the Government National Mortgage Association. Alternative residential mortgage loans (“Alt-A”) are a classification of mortgage loans where the risk profile of the borrower falls between prime and sub-prime. At December 31, 2007 and 2006, $56.2 billion and $51.0 billion, respectively, or 99% for both, of the residential mortgage-backed securities were rated Aaa/AAA by Moody’s, S&P or Fitch. At December 31, 2007 and 2006, the Company’s Alt-A residential mortgage-backed securities exposure was $6.4 billion and $4.8 billion, respectively, with an unrealized loss of $143 million and $4 million, respectively. At December 31, 2007 and 2006, $15.5 billion and $13.7 billion, respectively, or 87% and 83%, respectively, of the commercial mortgage-backed securities were rated Aaa/AAA by Moody’s, S&P or Fitch. The Company’s asset-backed securities are diversified both by sector and by issuer. Credit card receivables and automobile receivables, accounting for about 36% and 11% of the total asset-backed holdings, respectively, constitute the largest exposures in the Company’s asset-backed securities portfolio. At December 31, 2007 and 2006, $6.0 billion and $7.9 billion, respectively, or 54% and 57%, respectively, of total asset-backed securities were rated Aaa/AAA by Moody’s, S&P or Fitch. 77MetLife, Inc.
  • 82.
    The Company’s asset-backedsecurities included in the structured securities table above include exposure to sub-prime residential mortgage-backed securities. Sub-prime mortgage lending is the origination of residential mortgage loans to customers with weak credit profiles. The Company is not an originator of below-prime mortgages. The Company’s exposure exists through investment in asset-backed securities which are supported by sub-prime mortgages. The slowing U.S. housing market, greater use of affordable mortgage products, and relaxed underwriting standards for some originators of below-prime loans have recently led to higher delinquency and loss rates, especially within the 2006 vintage year. These factors have caused a pull-back in market liquidity and repricing of risk, which has led to an increase in unrealized losses from December 31, 2006 to December 31, 2007. Based upon the analysis of the Company’s exposure to sub-prime mortgages through its investment in asset-backed securities, the Company expects to receive payments in accordance with the contractual terms of the securities. The following table shows the Company’s exposure to asset-backed securities supported by sub-prime mortgage loans by credit quality: Cost or Amortized Cost Fair Value Cost or Amortized Cost Fair Value Cost or Amortized Cost Fair Value Cost or Amortized Cost Fair Value Cost or Amortized Cost Fair Value Cost or Amortized Cost Fair Value Aaa Aa A Baa Below Investment Grade Total December 31, 2007 (In millions) 2003 & Prior . . . . . . . . . . . . . . . . $ 234 $ 223 $132 $125 $19 $17 $14 $13 $ 4 $ 2 $ 403 $ 380 2004 . . . . . . . . . . . . . . . . . . . . . 212 195 446 414 27 24 — — 1 — 686 633 2005 . . . . . . . . . . . . . . . . . . . . . 551 502 278 252 22 18 5 4 — — 856 776 2006 . . . . . . . . . . . . . . . . . . . . . 258 235 69 47 — — — — — — 327 282 2007 . . . . . . . . . . . . . . . . . . . . . 152 142 17 9 — — — — — — 169 151 Total . . . . . . . . . . . . . . . . . . . $1,407 $1,297 $942 $847 $68 $59 $19 $17 $ 5 $ 2 $2,441 $2,222 Cost or Amortized Cost Fair Value Cost or Amortized Cost Fair Value Cost or Amortized Cost Fair Value Cost or Amortized Cost Fair Value Cost or Amortized Cost Fair Value Cost or Amortized Cost Fair Value Aaa Aa A Baa Below Investment Grade Total December 31, 2006 (In millions) 2003 & Prior. . . . . . . . . . . . . . . $ 319 $ 317 $ 285 $ 285 $ 60 $ 60 $33 $33 $— $— $ 697 $ 695 2004 . . . . . . . . . . . . . . . . . . . 307 305 456 458 47 47 15 15 — — 825 825 2005 . . . . . . . . . . . . . . . . . . . 736 730 305 306 22 22 — — — — 1,063 1,058 2006 . . . . . . . . . . . . . . . . . . . 321 322 42 43 57 57 32 32 — — 452 454 Total . . . . . . . . . . . . . . . . . . $1,683 $1,674 $1,088 $1,092 $186 $186 $80 $80 $— $— $3,037 $3,032 At December 31, 2007 and 2006, the Company had $2.2 billion and $3.0 billion, respectively, of asset-backed securities supported by sub-prime mortgage loans as outlined in the tables above. At December 31, 2007, approximately 96% of the portfolio is rated Aaa, Aa or better of which 80% was in vintage year 2005 and prior. At December 31, 2006, approximately 91% of the portfolio was rated Aaa, Aa or better of which 87% was in vintage year 2005 and prior. These older vintages benefit from better underwriting, improved enhancement levels and higher house price appreciation. Asset-backed securities also include collateralized debt obligations backed by sub-prime mortgages at an aggregate cost of $64 million with a fair value of $48 million at December 31, 2007 and an aggregate cost of $93 million with a fair value of $92 million at December 31, 2006, which are not included in the tables above. Assets on Deposit and Held in Trust and Assets Pledged as Collateral The Company had investment assets on deposit with regulatory agencies with a fair market value of $1.8 billion and $1.3 billion at December 31, 2007 and 2006, respectively, consisting primarily of fixed maturity and equity securities. Company securities held in trust to satisfy collateral requirements had a cost or amortized cost of $7.1 billion and $3.0 billion at December 31, 2007 and 2006, respectively, consisting primarily of fixed maturity and equity securities. Certain of the Company’s fixed maturity securities are pledged as collateral for various transactions as described in “ — Composition of Investment Portfolio Results — Derivative Financial Instruments — Credit Risk.” Additionally, the Company has pledged certain of its fixed maturity securities in support of its debt and funding agreements as described in “ — Off-Balance Sheet Arrangements — Other Commitments.” Trading Securities The Company has a trading securities portfolio to support investment strategies that involve the active and frequent purchase and sale of securities, the execution of short sale agreements and asset and liability matching strategies for certain insurance products. Trading securities and short sale agreement liabilities are recorded at fair value with subsequent changes in fair value recognized in net investment income related to fixed maturity securities. At December 31, 2007 and 2006, trading securities were $779 million and $759 million, respectively, and liabilities associated with the short sale agreements in the trading securities portfolio, which were included in other liabilities, were $107 million and $387 million, respectively. The Company had pledged $407 million and $614 million of its assets, primarily consisting of trading securities, as collateral 78 MetLife, Inc.
  • 83.
    to secure theliabilities associated with the short sale agreements in the trading securities portfolio at December 31, 2007 and 2006, respectively. During the years ended December 31, 2007, 2006 and 2005, interest and dividends earned on trading securities in addition to the net realized and unrealized gains (losses) recognized on the trading securities and the related short sale agreement liabilities included within net investment income totaled $50 million, $71 million and $14 million, respectively. Included within unrealized gains (losses) on such trading securities and short sale agreement liabilities, are changes in fair value of ($4) million, $26 million and less than $1 million for the years ended December 31, 2007, 2006 and 2005, respectively. As part of the acquisition of Travelers on July 1, 2005, the Company acquired Travelers’ investment in Tribeca Citigroup Investments Ltd. (“Tribeca”). Tribeca was a feeder fund investment structure whereby the feeder fund invests substantially all of its assets in the master fund, Tribeca Global Convertible Instruments Ltd. The primary investment objective of the master fund is to achieve enhanced risk-adjusted return by investing in domestic and foreign equities and equity-related securities utilizing such strategies as convertible securities arbitrage. At December 31, 2005, MetLife was the majority owner of the feeder fund and consolidated the fund within its consolidated financial statements. Net investment income related to the trading activities of Tribeca, which included interest and dividends earned on trading securities in addition to the net realized and unrealized gains, was $12 million and $6 million for the six months ended December 31, 2006 and 2005, respectively. During the second quarter of 2006, MetLife’s ownership interests in Tribeca declined to a position whereby Tribeca is no longer consolidated and, as of June 30, 2006, was accounted for under the equity method of accounting. The equity method investment at December 31, 2006 of $82 million was included in other limited partnership interests. Net investment income related to the Company’s equity method investment in Tribeca was $9 million for the six months ended December 31, 2006. Mortgage and Consumer Loans The Company’s mortgage and consumer loans are principally collateralized by commercial, agricultural and residential properties, as well as automobiles. Mortgage and consumer loans comprised 13.6% and 12.7% of the Company’s total cash and invested assets at December 31, 2007 and 2006, respectively. The carrying value of mortgage and consumer loans is stated at original cost net of repayments, amortization of premiums, accretion of discounts and valuation allowances. The following table shows the carrying value of the Company’s mortgage and consumer loans by type at: Carrying Value % of Total Carrying Value % of Total December 31, 2007 December 31, 2006 (In millions) Commercial mortgage loans . . . . . . . . . . . . . . . . . . . . . . . . . . . . . . . . . . $35,501 75.5% $31,847 75.4% Agricultural mortgage loans . . . . . . . . . . . . . . . . . . . . . . . . . . . . . . . . . . . 10,484 22.3 9,213 21.8 Consumer loans . . . . . . . . . . . . . . . . . . . . . . . . . . . . . . . . . . . . . . . . . . 1,045 2.2 1,179 2.8 Total . . . . . . . . . . . . . . . . . . . . . . . . . . . . . . . . . . . . . . . . . . . . . . . . $47,030 100.0% $42,239 100.0% Commercial Mortgage Loans. The Company diversifies its commercial mortgage loans by both geographic region and property type. The following table presents the distribution across geographic regions and property types for commercial mortgage loans at: Carrying Value % of Total Carrying Value % of Total December 31, 2007 December 31, 2006 (In millions) Region Pacific . . . . . . . . . . . . . . . . . . . . . . . . . . . . . . . . . . . . . . . . . . . . . . . . $ 8,620 24.3% $ 7,663 24.0% South Atlantic . . . . . . . . . . . . . . . . . . . . . . . . . . . . . . . . . . . . . . . . . . . . 8,021 22.6 6,881 21.6 Middle Atlantic . . . . . . . . . . . . . . . . . . . . . . . . . . . . . . . . . . . . . . . . . . . 5,110 14.4 4,858 15.3 International . . . . . . . . . . . . . . . . . . . . . . . . . . . . . . . . . . . . . . . . . . . . . 3,642 10.3 2,832 8.9 East North Central . . . . . . . . . . . . . . . . . . . . . . . . . . . . . . . . . . . . . . . . . 2,957 8.3 2,879 9.0 West South Central . . . . . . . . . . . . . . . . . . . . . . . . . . . . . . . . . . . . . . . . 2,925 8.2 2,631 8.3 New England . . . . . . . . . . . . . . . . . . . . . . . . . . . . . . . . . . . . . . . . . . . . 1,499 4.2 1,301 4.1 Mountain . . . . . . . . . . . . . . . . . . . . . . . . . . . . . . . . . . . . . . . . . . . . . . . 1,086 3.1 859 2.7 West North Central . . . . . . . . . . . . . . . . . . . . . . . . . . . . . . . . . . . . . . . . 1,046 2.9 799 2.5 East South Central . . . . . . . . . . . . . . . . . . . . . . . . . . . . . . . . . . . . . . . . 503 1.4 452 1.4 Other . . . . . . . . . . . . . . . . . . . . . . . . . . . . . . . . . . . . . . . . . . . . . . . . . 92 0.3 692 2.2 Total . . . . . . . . . . . . . . . . . . . . . . . . . . . . . . . . . . . . . . . . . . . . . . . . $35,501 100.0% $31,847 100.0% 79MetLife, Inc.
  • 84.
    Carrying Value % of Total Carrying Value % of Total December31, 2007 December 31, 2006 (In millions) Property Type Office . . . . . . . . . . . . . . . . . . . . . . . . . . . . . . . . . . . . . . . . . . . . . . . . . $15,471 43.6% $15,083 47.4% Retail . . . . . . . . . . . . . . . . . . . . . . . . . . . . . . . . . . . . . . . . . . . . . . . . . 7,557 21.3 6,552 20.6 Apartments . . . . . . . . . . . . . . . . . . . . . . . . . . . . . . . . . . . . . . . . . . . . . 4,437 12.5 3,772 11.8 Hotel . . . . . . . . . . . . . . . . . . . . . . . . . . . . . . . . . . . . . . . . . . . . . . . . . 3,282 9.2 2,120 6.7 Industrial . . . . . . . . . . . . . . . . . . . . . . . . . . . . . . . . . . . . . . . . . . . . . . . 2,880 8.1 2,850 8.9 Other . . . . . . . . . . . . . . . . . . . . . . . . . . . . . . . . . . . . . . . . . . . . . . . . . 1,874 5.3 1,470 4.6 Total . . . . . . . . . . . . . . . . . . . . . . . . . . . . . . . . . . . . . . . . . . . . . . . . $35,501 100.0% $31,847 100.0% The following table presents the scheduled maturities for the Company’s commercial mortgage loans at: Carrying Value % of Total Carrying Value % of Total December 31, 2007 December 31, 2006 (In millions) Due in one year or less . . . . . . . . . . . . . . . . . . . . . . . . . . . . . . . . . . . . . . $ 2,963 8.3% $ 1,772 5.6% Due after one year through two years . . . . . . . . . . . . . . . . . . . . . . . . . . . . 4,247 12.0 3,006 9.4 Due after two years through three years . . . . . . . . . . . . . . . . . . . . . . . . . . . 4,151 11.7 4,173 13.1 Due after three years through four years . . . . . . . . . . . . . . . . . . . . . . . . . . . 3,892 11.0 3,822 12.0 Due after four years through five years . . . . . . . . . . . . . . . . . . . . . . . . . . . . 4,589 12.9 4,769 15.0 Due after five years . . . . . . . . . . . . . . . . . . . . . . . . . . . . . . . . . . . . . . . . 15,659 44.1 14,305 44.9 Total . . . . . . . . . . . . . . . . . . . . . . . . . . . . . . . . . . . . . . . . . . . . $35,501 100.0% $31,847 100.0% Restructured, Potentially Delinquent, Delinquent or Under Foreclosure. The Company monitors its mortgage loan investments on an ongoing basis, including reviewing loans that are restructured, potentially delinquent, delinquent or under foreclosure. These loan classifications are consistent with those used in industry practice. The Company defines restructured mortgage loans as loans in which the Company, for economic or legal reasons related to the debtor’s financial difficulties, grants a concession to the debtor that it would not otherwise consider. The Company defines potentially delinquent loans as loans that, in management’s opinion, have a high probability of becoming delinquent. The Company defines delinquent mortgage loans, consistent with industry practice, as loans in which two or more interest or principal payments are past due. The Company defines mortgage loans under foreclosure as loans in which foreclosure proceedings have formally commenced. The Company reviews all mortgage loans on an ongoing basis. These reviews may include an analysis of the property financial statements and rent roll, lease rollover analysis, property inspections, market analysis and tenant creditworthiness. The Company records valuation allowances for certain loans that it deems impaired. The Company’s valuation allowances are established both on a loan specific basis for those loans where a property or market specific risk has been identified that could likely result in a future default, as well as for pools of loans with similar high risk characteristics where a property specific or market risk has not been identified. Loan specific valuation allowances are established for the excess carrying value of the mortgage loan over the present value of expected future cash flows discounted at the loan’s original effective interest rate, the value of the loan’s collateral, or the loan’s market value if the loan is being sold. Valuation allowances for pools of loans are established based on property types and loan to value risk factors. The Company records valuation allowances as investment losses. The Company records subsequent adjustments to allowances as investment gains (losses). The following table presents the amortized cost and valuation allowance for commercial mortgage loans distributed by loan classi- fication at: Amortized Cost(1) % of Total Valuation Allowance % of Amortized Cost Amortized Cost (1) % of Total Valuation Allowance % of Amortized Cost December 31, 2007 December 31, 2006 (In millions) Performing . . . . . . . . . . . . . $35,665 100.0% $168 0.5% $31,996 100.0% $153 0.5% Potentially delinquent . . . . . . 3 — — — 3 — — — Delinquent or under foreclosure . . . . . . . . . . . . 1 — — — 1 — — — Total . . . . . . . . . . . . . . . . $35,669 100.0% $168 0.5% $32,000 100.0% $153 0.5% (1) Amortized cost is the carrying value before valuation allowances. 80 MetLife, Inc.
  • 85.
    The following tablepresents the changes in valuation allowances for commercial mortgage loans for the: 2007 2006 2005 Years Ended December 31, (In millions) Balance, beginning of period . . . . . . . . . . . . . . . . . . . . . . . . . . . . . . . . . . . . . . . . . . . $153 $147 $149 Additions . . . . . . . . . . . . . . . . . . . . . . . . . . . . . . . . . . . . . . . . . . . . . . . . . . . . . . . . 69 25 43 Deductions . . . . . . . . . . . . . . . . . . . . . . . . . . . . . . . . . . . . . . . . . . . . . . . . . . . . . . . (54) (19) (45) Balance, end of period . . . . . . . . . . . . . . . . . . . . . . . . . . . . . . . . . . . . . . . . . . . . . . . $168 $153 $147 Agricultural Mortgage Loans. The Company diversifies its agricultural mortgage loans by both geographic region and product type. Of the $10.5 billion of agricultural mortgage loans outstanding at December 31, 2007, 58%, were subject to rate resets prior to maturity. A substantial portion of these loans has been successfully renegotiated and remain outstanding to maturity. The process and policies for monitoring the agricultural mortgage loans and classifying them by performance status are generally the same as those for the commercial loans. The following table presents the amortized cost and valuation allowances for agricultural mortgage loans distributed by loan classi- fication at: Amortized Cost (1) % of Total Valuation Allowance % of Amortized Cost Amortized Cost(1) % of Total Valuation Allowance % of Amortized Cost December 31, 2007 December 31, 2006 (In millions) Performing . . . . . . . . . . . . . $10,440 99.4% $12 0.1% $9,172 99.4% $11 0.1% Restructured . . . . . . . . . . . . 2 — — — 9 0.1 — — Potentially delinquent . . . . . . 47 0.4 4 8.5 2 — — — Delinquent or under foreclosure . . . . . . . . . . . . 19 0.2 8 42.1 48 0.5 7 14.6 Total . . . . . . . . . . . . . . . . $10,508 100.0% $24 0.2% $9,231 100.0% $18 0.2% (1) Amortized cost is equal to carrying value before valuation allowances. The following table presents the changes in valuation allowances for agricultural mortgage loans for the: 2007 2006 2005 Years Ended December 31, (In millions) Balance, beginning of period . . . . . . . . . . . . . . . . . . . . . . . . . . . . . . . . . . . . . . . . . . . . . . . $18 $11 $ 7 Additions . . . . . . . . . . . . . . . . . . . . . . . . . . . . . . . . . . . . . . . . . . . . . . . . . . . . . . . . . . . . 8 10 4 Deductions . . . . . . . . . . . . . . . . . . . . . . . . . . . . . . . . . . . . . . . . . . . . . . . . . . . . . . . . . . (2) (3) — Balance, end of period . . . . . . . . . . . . . . . . . . . . . . . . . . . . . . . . . . . . . . . . . . . . . . . . . . . $24 $18 $11 Consumer Loans. Consumer loans consist of residential mortgages and auto loans. The following table presents the amortized cost and valuation allowances for consumer loans distributed by loan classification at: Amortized Cost(1) % of Total Valuation Allowance % of Amortized Cost Amortized Cost(1) % of Total Valuation Allowance % of Amortized Cost December 31, 2007 December 31, 2006 (In millions) Performing . . . . . . . . . . . . . $1,006 95.7% $ 5 0.5% $1,155 97.1% $10 0.9% Potentially delinquent . . . . . . 19 1.8 — — 17 1.4 — — Delinquent or under foreclosure . . . . . . . . . . . . 26 2.5 1 4.0 18 1.5 1 5.6 Total . . . . . . . . . . . . . . . . $1,051 100.0% $ 6 0.6% $1,190 100.0% $11 0.9% (1) Amortized cost is equal to carrying value before valuation allowances. 81MetLife, Inc.
  • 86.
    The following tablepresents the changes in valuation allowances for consumer loans for the: 2007 2006 2005 Years Ended December 31, (In millions) Balance, beginning of period . . . . . . . . . . . . . . . . . . . . . . . . . . . . . . . . . . . . . . . . . . . . . . . $11 $15 $ 1 Additions . . . . . . . . . . . . . . . . . . . . . . . . . . . . . . . . . . . . . . . . . . . . . . . . . . . . . . . . . . . . — — 17 Deductions . . . . . . . . . . . . . . . . . . . . . . . . . . . . . . . . . . . . . . . . . . . . . . . . . . . . . . . . . . (5) (4) (3) Balance, end of period . . . . . . . . . . . . . . . . . . . . . . . . . . . . . . . . . . . . . . . . . . . . . . . . . . . $ 6 $11 $15 Real Estate Holdings The Company’s real estate holdings consist of commercial properties located primarily in the United States. At December 31, 2007 and 2006, the carrying value of the Company’s real estate, real estate joint ventures and real estate held-for-sale was $6.8 billion and $5.0 billion, respectively, or 2.0% and 1.5%, of total cash and invested assets, respectively. The carrying value of real estate is stated at depreciated cost net of impairments and valuation allowances. The carrying value of real estate joint ventures is stated at the Company’s equity in the real estate joint ventures net of impairments and valuation allowances. The following table presents the carrying value of the Company’s real estate holdings at: Type Carrying Value % of Total Carrying Value % of Total December 31, 2007 December 31, 2006 (In millions) Real estate . . . . . . . . . . . . . . . . . . . . . . . . . . . . . . . . . . . . . . . . . . . . . . . $3,823 56.5% $3,322 66.6% Real estate joint ventures . . . . . . . . . . . . . . . . . . . . . . . . . . . . . . . . . . . . . 2,771 40.9 1,477 29.6 Foreclosed real estate . . . . . . . . . . . . . . . . . . . . . . . . . . . . . . . . . . . . . . . 3 0.1 3 0.1 6,597 97.5 4,802 96.3 Real estate held-for-sale . . . . . . . . . . . . . . . . . . . . . . . . . . . . . . . . . . . . . . 172 2.5 184 3.7 Total real estate holdings . . . . . . . . . . . . . . . . . . . . . . . . . . . . . . . . . . . . . . $6,769 100.0% $4,986 100.0% The Company’s carrying value of real estate held-for-sale of $172 million and $184 million at December 31, 2007 and 2006, respectively, have been reduced by impairments of $1 million and $17 million at December 31, 2007 and 2006, respectively. The Company records real estate acquired upon foreclosure of commercial and agricultural mortgage loans at the lower of estimated fair value or the carrying value of the mortgage loan at the date of foreclosure. Real estate holdings were categorized as follows: Amount Percent Amount Percent 2007 2006 December 31, (In millions) Office . . . . . . . . . . . . . . . . . . . . . . . . . . . . . . . . . . . . . . . . . . . . . . . . . $3,126 46% $2,709 55% Apartments . . . . . . . . . . . . . . . . . . . . . . . . . . . . . . . . . . . . . . . . . . . . . . 1,264 19 739 15 Development joint ventures. . . . . . . . . . . . . . . . . . . . . . . . . . . . . . . . . . . . 743 11 169 3 Retail . . . . . . . . . . . . . . . . . . . . . . . . . . . . . . . . . . . . . . . . . . . . . . . . . . 574 8 513 10 Real estate investment funds . . . . . . . . . . . . . . . . . . . . . . . . . . . . . . . . . . 516 8 401 8 Industrial . . . . . . . . . . . . . . . . . . . . . . . . . . . . . . . . . . . . . . . . . . . . . . . 283 4 291 6 Land . . . . . . . . . . . . . . . . . . . . . . . . . . . . . . . . . . . . . . . . . . . . . . . . . . 174 3 71 1 Agriculture . . . . . . . . . . . . . . . . . . . . . . . . . . . . . . . . . . . . . . . . . . . . . . 29 — 32 1 Other . . . . . . . . . . . . . . . . . . . . . . . . . . . . . . . . . . . . . . . . . . . . . . . . . . 60 1 61 1 Total real estate holdings . . . . . . . . . . . . . . . . . . . . . . . . . . . . . . . . . . . . $6,769 100% $4,986 100% The Company’s real estate holdings are primarily located in the United States. At December 31, 2007, 22%, 11%, 10% and 9% of the Company’s real estate holdings were located in California, New York, Florida and Texas, respectively. Certain of the Company’s investments in real estate joint ventures meet the definition of a VIE under FIN 46(r). See “— Composition of Investment Portfolio Results — Variable Interest Entities.” In the fourth quarter of 2006, the Company sold its Peter Cooper Village and Stuyvesant Town properties located in Manhattan, New York for $5.4 billion. The Peter Cooper Village and Stuyvesant Town properties together make up the largest apartment complex in Manhattan, New York totaling over 11,000 units, spread over 80 contiguous acres. The properties were owned by the Holding Company’s subsidiary, Metropolitan Tower Life Insurance Company. The sale resulted in a gain of $3 billion, net of income tax, and is included in income from discontinued operations in the consolidated statements of income. In the second quarter of 2005, the Company sold its One Madison Avenue and 200 Park Avenue properties in Manhattan, New York for $918 million and $1.72 billion, respectively, resulting in gains, net of income tax, of $431 million and $762 million, respectively, and is included in income from discontinued operations in the consolidated statements of income. In connection with the sale of the 200 Park 82 MetLife, Inc.
  • 87.
    Avenue property, theCompany has retained rights to existing signage and is leasing space for associates in the property for 20 years with optional renewal periods through 2205. Leveraged Leases Investment in leveraged leases, included in other invested assets, consisted of the following: 2007 2006 December 31, (In millions) Rental receivables, net . . . . . . . . . . . . . . . . . . . . . . . . . . . . . . . . . . . . . . . . . . . . . . . . . . . $ 1,491 $1,055 Estimated residual values . . . . . . . . . . . . . . . . . . . . . . . . . . . . . . . . . . . . . . . . . . . . . . . . . 1,881 887 Subtotal . . . . . . . . . . . . . . . . . . . . . . . . . . . . . . . . . . . . . . . . . . . . . . . . . . . . . . . . . . . 3,372 1,942 Unearned income . . . . . . . . . . . . . . . . . . . . . . . . . . . . . . . . . . . . . . . . . . . . . . . . . . . . . . (1,313) (694) Investment in leveraged leases . . . . . . . . . . . . . . . . . . . . . . . . . . . . . . . . . . . . . . . . . . . . $ 2,059 $1,248 The Company’s deferred income tax liability related to leveraged leases was $1.0 billion and $670 million at December 31, 2007 and 2006, respectively. The rental receivables set forth above are generally due in periodic installments. The payment periods range from one to 15 years, but in certain circumstances are as long as 30 years. The components of net income from investment in leveraged leases are as follows: 2007 2006 2005 Years Ended December 31, (In millions) Income from investment in leveraged leases (included in net investment income). . . . . . . . . . . . . $ 67 $ 51 $ 54 Less: Income tax expense on leveraged leases . . . . . . . . . . . . . . . . . . . . . . . . . . . . . . . . . . (24) (18) (19) Net income from investment in leveraged leases . . . . . . . . . . . . . . . . . . . . . . . . . . . . . . . . . $ 43 $ 33 $ 35 Other Limited Partnership Interests The carrying value of other limited partnership interests (which primarily represent ownership interests in pooled investment funds that make private equity investments in companies in the United States and overseas) was $6.2 billion and $4.8 billion at December 31, 2007 and 2006, respectively. Included within other limited partnership interests at December 31, 2007 and 2006 are $1.6 billion and $1.2 billion, respectively, of hedge funds. For the years ended December 31, 2007, 2006 and 2005, net investment income from other limited partnership interests included $89 million, $98 million and $24 million, respectively, related to hedge funds. The Company uses the equity method of accounting for investments in limited partnership interests in which it has more than a minor interest, has influence over the partnership’s operating and financial policies, but does not have a controlling interest and is not the primary beneficiary. The Company uses the cost method for minor interest investments and when it has virtually no influence over the partnership’s operating and financial policies. The Company’s investments in other limited partnership interests represented 1.8% and 1.4% of cash and invested assets at December 31, 2007 and 2006, respectively. Management anticipates that investment income and the related yields on other limited partnership interests may decline during 2008 due to increased volatility in the equity and credit markets during 2007. Some of the Company’s investments in other limited partnership interests meet the definition of a VIE under FIN 46(r). See “— Composition of Investment Portfolio Results — Variable Interest Entities.” Other Invested Assets The Company’s other invested assets consisted principally of leveraged leases of $2.2 billion and $1.3 billion, funds withheld at interest of $4.5 billion and $4.0 billion, and standalone derivatives with positive fair values and the fair value of embedded derivatives related to funds withheld and modified coinsurance contracts of $4.1 billion and $2.5 billion at December 31, 2007 and 2006, respectively. The leveraged leases are recorded net of non-recourse debt. The Company participates in lease transactions, which are diversified by industry, asset type and geographic area. The Company regularly reviews residual values and writes down residuals to expected values as needed. Funds withheld represent amounts contractually withheld by ceding companies in accordance with reinsurance agreements. For agree- ments written on a modified coinsurance basis and certain agreements written on a coinsurance basis, assets supporting the reinsured policies equal to the net statutory reserves are withheld and continue to be legally owned by the ceding company. Interest accrues to these funds withheld at rates defined by the treaty terms and may be contractually specified or directly related to the investment portfolio. The Company’s other invested assets represented 3.7% and 3.2% of cash and invested assets at December 31, 2007 and 2006, respectively. Derivative Financial Instruments The Company uses a variety of derivatives, including swaps, forwards, futures and option contracts, to manage its various risks. Additionally, the Company uses derivatives to synthetically create investments as permitted by its insurance subsidiaries’ Derivatives Use Plans approved by the applicable state insurance departments. 83MetLife, Inc.
  • 88.
    The following tablepresents the notional amount and current market or fair value of derivative financial instruments held at: Notional Amount Assets Liabilities Notional Amount Assets Liabilities Current Market or Fair Value Current Market or Fair Value December 31, 2007 December 31, 2006 (In millions) Interest rate swaps . . . . . . . . . . . . . . . . . . . . . . $ 62,519 $ 785 $ 768 $ 27,148 $ 639 $ 150 Interest rate floors . . . . . . . . . . . . . . . . . . . . . . 48,937 621 — 37,437 279 — Interest rate caps . . . . . . . . . . . . . . . . . . . . . . . 45,498 50 — 26,468 125 — Financial futures . . . . . . . . . . . . . . . . . . . . . . . 10,817 89 57 8,432 64 39 Foreign currency swaps . . . . . . . . . . . . . . . . . . 21,399 1,480 1,724 19,627 986 1,174 Foreign currency forwards . . . . . . . . . . . . . . . . . 4,185 76 16 2,934 31 27 Options . . . . . . . . . . . . . . . . . . . . . . . . . . . . . 2,043 713 1 587 306 8 Financial forwards . . . . . . . . . . . . . . . . . . . . . . 4,600 122 2 3,800 12 40 Credit default swaps . . . . . . . . . . . . . . . . . . . . . 6,850 58 35 6,357 5 21 Synthetic GICs . . . . . . . . . . . . . . . . . . . . . . . . 3,670 — — 3,739 — — Other . . . . . . . . . . . . . . . . . . . . . . . . . . . . . . . 250 43 — 250 56 — Total . . . . . . . . . . . . . . . . . . . . . . . . . . . . . . $210,768 $4,037 $2,603 $136,779 $2,503 $1,459 The above table does not include notional amounts for equity futures, equity variance swaps, and equity options. At December 31, 2007 and 2006, the Company owned 4,658 and 2,749 equity futures, respectively. Fair values of equity futures are included in financial futures in the preceding table. At December 31, 2007 and 2006, the Company owned 695,485 and 225,000 equity variance swaps, respectively. Fair values of equity variance swaps are included in financial forwards in the preceding table. At December 31, 2007 and 2006, the Company owned 77,374,937 and 74,864,483 equity options, respectively. Fair values of equity options are included in options in the preceding table. Credit Risk. The Company may be exposed to credit-related losses in the event of nonperformance by counterparties to derivative financial instruments. Generally, the current credit exposure of the Company’s derivative contracts is limited to the fair value at the reporting date. The credit exposure of the Company’s derivative transactions is represented by the fair value of contracts with a net positive fair value at the reporting date. The Company manages its credit risk related to over-the-counter derivatives by entering into transactions with creditworthy counter- parties, maintaining collateral arrangements and through the use of master agreements that provide for a single net payment to be made by one counterparty to another at each due date and upon termination. Because exchange traded futures are effected through regulated exchanges, and positions are marked to market on a daily basis, the Company has minimal exposure to credit-related losses in the event of nonperformance by counterparties to such derivative instruments. The Company enters into various collateral arrangements, which require both the pledging and accepting of collateral in connection with its derivative instruments. As of December 31, 2007 and 2006, the Company was obligated to return cash collateral under its control of $833 million and $428 million, respectively. This unrestricted cash collateral is included in cash and cash equivalents and the obligation to return it is included in payables for collateral under securities loaned and other transactions in the consolidated balance sheets. As of December 31, 2007 and 2006, the Company had also accepted collateral consisting of various securities with a fair market value of $678 million and $453 million, respectively, which are held in separate custodial accounts. The Company is permitted by contract to sell or repledge this collateral, but as of December 31, 2007 and 2006, none of the collateral had been sold or repledged. As of December 31, 2007 and 2006, the Company provided collateral of $162 million and $80 million, respectively, which is included in fixed maturity securities in the consolidated balance sheets. In addition, the Company has exchange traded futures, which require the pledging of collateral. As of December 31, 2007 and 2006, the Company pledged collateral of $167 million and $105 million, respectively, which is included in fixed maturity securities. The counterparties are permitted by contract to sell or repledge this collateral. 84 MetLife, Inc.
  • 89.
    Variable Interest Entities Thefollowing table presents the total assets of and maximum exposure to loss relating to VIEs for which the Company has concluded that: (i) it is the primary beneficiary and which are consolidated in the Company’s consolidated financial statements at December 31, 2007; and (ii) it holds significant variable interests but it is not the primary beneficiary and which have not been consolidated: Total Assets(1) Maximum Exposure to Loss(2) Total Assets(1) Maximum Exposure to Loss(2) Primary Beneficiary Not Primary Beneficiary December 31, 2007 (In millions) Asset-backed securitizations and collateralized debt obligations . . . . . $1,167 $1,167 $ 1,591 $ 184 Real estate joint ventures(3) . . . . . . . . . . . . . . . . . . . . . . . . . . . . . 48 26 276 42 Other limited partnership interests(4) . . . . . . . . . . . . . . . . . . . . . . . 2 1 42,141 2,080 Trust preferred securities(5) . . . . . . . . . . . . . . . . . . . . . . . . . . . . . 105 105 48,232 3,369 Other investments(6) . . . . . . . . . . . . . . . . . . . . . . . . . . . . . . . . . 1,119 1,119 3,258 260 Total. . . . . . . . . . . . . . . . . . . . . . . . . . . . . . . . . . . . . . . . . . . $2,441 $2,418 $95,498 $5,935 (1) The assets of the asset-backed securitizations and collateralized debt obligations are reflected at fair value. The assets of the real estate joint ventures, other limited partnership interests, trust preferred securities and other investments are reflected at the carrying amounts at which such assets would have been reflected on the Company’s consolidated balance sheet had the Company consolidated the VIE from the date of its initial investment in the entity. (2) The maximum exposure to loss relating to the asset-backed securitizations and collateralized debt obligations is equal to the carrying amounts of retained interests. In addition, the Company provides collateral management services for certain of these structures for which it collects a management fee. The maximum exposure to loss relating to real estate joint ventures, other limited partnership interests, trust preferred securities and other investments is equal to the carrying amounts plus any unfunded commitments, reduced by amounts guaranteed by other partners. Such a maximum loss would be expected to occur only upon bankruptcy of the issuer or investee. (3) Real estate joint ventures include partnerships and other ventures which engage in the acquisition, development, management and disposal of real estate investments. (4) Other limited partnership interests include partnerships established for the purpose of investing in public and private debt and equity securities. (5) Trust preferred securities are complex, uniquely structured investments which contain features of both equity and debt, may have an extended or no stated maturity, and may be callable at the issuer’s option after a defined period of time. (6) Other investments include securities that are not trust preferred securities, asset-backed securitizations or collateralized debt obligations. Securities Lending The Company participates in a securities lending program whereby blocks of securities, which are included in fixed maturity and equity securities, are loaned to third parties, primarily major brokerage firms. The Company requires a minimum of 102% of the fair value of the loaned securities to be separately maintained as collateral for the loans. Securities with a cost or amortized cost of $41.1 billion and $43.3 billion and an estimated fair value of $42.1 billion and $44.1 billion were on loan under the program at December 31, 2007 and 2006, respectively. Securities loaned under such transactions may be sold or repledged by the transferee. The Company was liable for cash collateral under its control of $43.3 billion and $45.4 billion at December 31, 2007 and 2006, respectively. Security collateral of $40 million and $100 million on deposit from customers in connection with the securities lending transactions at December 31, 2007 and 2006, respectively, may not be sold or repledged and is not reflected in the consolidated financial statements. Separate Accounts The Company held $160.2 billion and $144.4 billion in separate accounts, for which the Company does not bear investment risk, as of December 31, 2007 and 2006, respectively. The Company manages each separate account’s assets in accordance with the prescribed investment policy that applies to that specific separate account. The Company establishes separate accounts on a single client and multi- client commingled basis in compliance with insurance laws. Effective with the adoption of SOP 03-1, Accounting and Reporting by Insurance Enterprises for Certain Nontraditional Long-Duration Contracts and for Separate Accounts, on January 1, 2004, the Company reported separately, as assets and liabilities, investments held in separate accounts and liabilities of the separate accounts if: • such separate accounts are legally recognized; • assets supporting the contract liabilities are legally insulated from the Company’s general account liabilities; • investments are directed by the contractholder; and • all investment performance, net of contract fees and assessments, is passed through to the contractholder. The Company reports separate account assets meeting such criteria at their fair value. Investment performance (including investment income, net investment gains (losses) and changes in unrealized gains (losses)) and the corresponding amounts credited to contrac- tholders of such separate accounts are offset within the same line in the consolidated statements of income. The Company’s revenues reflect fees charged to the separate accounts, including mortality charges, risk charges, policy administration fees, investment management fees and surrender charges. Separate accounts not meeting the above criteria are combined on a line-by-line basis with the Company’s general account assets, liabilities, revenues and expenses. Quantitative and Qualitative Disclosures About Market Risk The Company must effectively manage, measure and monitor the market risk associated with its invested assets and interest rate sensitive insurance contracts. It has developed an integrated process for managing risk, which it conducts through its Corporate Risk 85MetLife, Inc.
  • 90.
    Management Department, ALMCommittees and additional specialists at the business segment level. The Company has established and implemented comprehensive policies and procedures at both the corporate and business segment level to minimize the effects of potential market volatility. The Company regularly analyzes its exposure to interest rate, equity market and foreign currency exchange risks. As a result of that analysis, the Company has determined that the fair value of its interest rate sensitive invested assets is materially exposed to changes in interest rates. The equity and foreign currency portfolios do not expose the Company to material market risks (as described below). MetLife generally uses option adjusted duration to manage interest rate risk and the methods and assumptions used are generally consistent with those used by the Company in 2006. The Company analyzes interest rate risk using various models, including multi- scenario cash flow projection models that forecast cash flows of the liabilities and their supporting investments, including derivative instruments. The Company uses a variety of strategies to manage interest rate, equity market, and foreign currency exchange risk, including the use of derivative instruments. Market Risk Exposures The Company has exposure to market risk through its insurance operations and investment activities. For purposes of this disclosure, “market risk” is defined as the risk of loss resulting from changes in interest rates, equity market prices and foreign currency exchange rates. Interest Rates. The Company’s exposure to interest rate changes results from its significant holdings of fixed maturity securities, as well as its interest rate sensitive liabilities. The fixed maturity securities include U.S. and foreign government bonds, securities issued by government agencies, corporate bonds and mortgage-backed securities, all of which are mainly exposed to changes in medium- and long- term treasury rates. The interest rate sensitive liabilities for purposes of this disclosure include GICs and annuities, which have the same type of interest rate exposure (medium- and long-term treasury rates) as fixed maturity securities. The Company employs product design, pricing and asset/liability management strategies to reduce the adverse effects of interest rate movements. Product design and pricing strategies include the use of surrender charges or restrictions on withdrawals in some products. Asset/liability management strategies include the use of derivatives, the purchase of securities structured to protect against prepayments, prepayment restrictions and related fees on mortgage loans and consistent monitoring of the pricing of the Company’s products in order to better match the duration of the assets and the liabilities they support. See also “Risk Factors — Changes in Market Interest Rates May Significantly Affect Our Profitability’’ in MetLife, Inc.’s Annual Report on Form 10-K for the year ended December 31, 2007. Equity Market Prices. The Company’s investments in equity securities and equity-based fixed maturity securities expose it to changes in equity prices, as do certain liabilities that involve long-term guarantees on equity performance. It manages this risk on an integrated basis with other risks through its asset/liability management strategies. The Company also manages equity market price risk through industry and issuer diversification, asset allocation techniques and the use of derivatives. Foreign Currency Exchange Rates. The Company’s exposure to fluctuations in foreign currency exchange rates against the U.S. dollar results from its holdings in non-U.S. dollar denominated fixed maturity securities, equity securities and liabilities, as well as through its investments in foreign subsidiaries. The principal currencies that create foreign currency exchange rate risk in the Company’s investment portfolios are the Euro, the Canadian dollar and the British pound. The Company mitigates its fixed maturity securities’ foreign currency exchange rate risk through the utilization of foreign currency swaps and forward contracts. Through its investments in foreign subsidiaries, the Company is primarily exposed to the Canadian dollar, the Mexican peso, the Australian dollar, the Argentinean peso, the South Korean won, the Chilean peso, the Taiwanese dollar and the Japanese yen. The Company has matched substantially all of its foreign currency liabilities in its foreign subsidiaries with their respective foreign currency assets, thereby reducing its risk to currency exchange rate fluctuation. Selectively, the Company uses U.S. dollar assets to support certain long duration foreign currency liabilities. Additionally, in some countries, local surplus is held entirely or in part in U.S. dollar assets which further minimizes exposure to exchange rate fluctuation risk. Risk Management Corporate Risk Management. MetLife has established several financial and non-financial senior management committees as part of its risk management process. These committees manage capital and risk positions, approve asset/liability management strategies and establish appropriate corporate business standards. MetLife also has a separate Corporate Risk Management Department, which is responsible for risk throughout MetLife and reports to MetLife’s Chief Financial Officer. The Corporate Risk Management Department’s primary responsibilities consist of: • implementing a Board of Directors-approved corporate risk framework, which outlines the Company’s approach for managing risk on an enterprise-wide basis; • developing policies and procedures for managing, measuring and monitoring those risks identified in the corporate risk framework; • establishing appropriate corporate risk tolerance levels; • deploying capital on an economic capital basis; and • reporting on a periodic basis to the Governance Committee of the Holding Company’s Board of Directors and various financial and non-financial senior management committees. Asset/Liability Management. The Company actively manages its assets using an approach that balances quality, diversification, asset/ liability matching, liquidity and investment return. The goals of the investment process are to optimize, net of income tax, risk-adjusted investment income and risk-adjusted total return while ensuring that the assets and liabilities are managed on a cash flow and duration basis. The asset/liability management process is the shared responsibility of the Portfolio Management Unit, the Financial Management and Oversight Asset/Liability Management Unit, and the operating business segments under the supervision of the various product line specific ALM Committees. The ALM Committees’ duties include reviewing and approving target portfolios on a periodic basis, establishing investment guidelines and limits and providing oversight of the asset/liability management process. The portfolio managers and asset sector specialists, who have responsibility on a day-to-day basis for risk management of their respective investing activities, implement the goals and objectives established by the ALM Committees. 86 MetLife, Inc.
  • 91.
    Each of MetLife’sbusiness segments has an asset/liability officer who works with portfolio managers in the investment department to monitor investment, product pricing, hedge strategy and liability management issues. MetLife establishes target asset portfolios for each major insurance product, which represent the investment strategies used to profitably fund its liabilities within acceptable levels of risk. These strategies are monitored through regular review of portfolio metrics, such as effective duration, yield curve sensitivity, convexity, liquidity, asset sector concentration and credit quality. To manage interest rate risk, the Company performs periodic projections of asset and liability cash flows to evaluate the potential sensitivity of its investments and liabilities to interest rate movements. These projections involve evaluating the potential gain or loss on most of the Company’s in-force business under various increasing and decreasing interest rate environments. Department regulations require that MetLife perform some of these analyses annually as part of MetLife’s review of the sufficiency of its regulatory reserves. For several of its legal entities, the Company maintains segmented operating and surplus asset portfolios for the purpose of asset/liability management and the allocation of investment income to product lines. For each segment, invested assets greater than or equal to the GAAP liabilities less the DAC asset and any non-invested assets allocated to the segment are maintained, with any excess swept to the surplus segment. The operating segments may reflect differences in legal entity, statutory line of business and any product market characteristic which may drive a distinct investment strategy with respect to duration, liquidity or credit quality of the invested assets. Certain smaller entities make use of unsegmented general accounts for which the investment strategy reflects the aggregate charac- teristics of liabilities in those entities. The Company measures relative sensitivities of the value of its assets and liabilities to changes in key assumptions utilizing Company models. These models reflect specific product characteristics and include assumptions based on current and anticipated experience regarding lapse, mortality and interest crediting rates. In addition, these models include asset cash flow projections reflecting interest payments, sinking fund payments, principal payments, bond calls, mortgage prepayments and defaults. Common industry metrics, such as duration and convexity, are also used to measure the relative sensitivity of assets and liability values to changes in interest rates. In computing the duration of liabilities, consideration is given to all policyholder guarantees and to how the Company intends to set indeterminate policy elements such as interest credits or dividends. Each asset portfolio has a duration constraint based on the liability duration and the investment objectives of that portfolio. Where a liability cash flow may exceed the maturity of available assets, as is the case with certain retirement and non-medical health products, the Company may support such liabilities with equity investments or curve mismatch strategies. Hedging Activities. To reduce interest rate risk, MetLife’s risk management strategies incorporate the use of various interest rate derivatives to adjust the overall duration and cash flow profile of its invested asset portfolios to better match the duration and cash flow profile of its liabilities. Such instruments include financial futures, financial forwards, interest rate and credit default swaps, caps, floors and options. MetLife also uses foreign currency swaps and forwards to hedge its foreign currency denominated fixed income investments. Risk Measurement: Sensitivity Analysis The Company measures market risk related to its holdings of invested assets and other financial instruments, including certain market risk sensitive insurance contracts, based on changes in interest rates, equity market prices and currency exchange rates, utilizing a sensitivity analysis. This analysis estimates the potential changes in fair value based on a hypothetical 10% change (increase or decrease) in interest rates, equity market prices and currency exchange rates. The Company believes that a 10% change (increase or decrease) in these market rates and prices is reasonably possible in the near-term. In performing this analysis, the Company used market rates at December 31, 2007 to re-price its invested assets and other financial instruments. The sensitivity analysis separately calculated each of MetLife’s market risk exposures (interest rate, equity market price and foreign currency exchange rate) related to its trading and non-trading invested assets and other financial instruments. The sensitivity analysis performed included the market risk sensitive holdings described above. The Company modeled the impact of changes in market rates and prices on the fair values of its invested assets as follows: • the net present values of its interest rate sensitive exposures resulting from a 10% change (increase or decrease) in interest rates; • the market value of its equity positions due to a 10% change (increase or decrease) in equity prices; and • the U.S. dollar equivalent balances of the Company’s currency exposures due to a 10% change (increase or decrease) in currency exchange rates. The sensitivity analysis is an estimate and should not be viewed as predictive of the Company’s future financial performance. The Company cannot assure that its actual losses in any particular year will not exceed the amounts indicated in the table below. Limitations related to this sensitivity analysis include: • the market risk information is limited by the assumptions and parameters established in creating the related sensitivity analysis, including the impact of prepayment rates on mortgages; • for derivatives that qualify as hedges, the impact on reported earnings may be materially different from the change in market values; • the analysis excludes other significant real estate holdings and liabilities pursuant to insurance contracts; and • the model assumes that the composition of assets and liabilities remains unchanged throughout the year. Accordingly, the Company uses such models as tools and not substitutes for the experience and judgment of its corporate risk and asset/liability management personnel. Based on its analysis of the impact of a 10% change (increase or decrease) in market rates and prices, MetLife has determined that such a change could have a material adverse effect on the fair value of its interest rate sensitive invested assets. The equity and foreign currency portfolios do not expose the Company to material market risk. 87MetLife, Inc.
  • 92.
    The table belowillustrates the potential loss in fair value of the Company’s interest rate sensitive financial instruments at December 31, 2007. In addition, the potential loss with respect to the fair value of currency exchange rates and the Company’s equity price sensitive positions at December 31, 2007 is set forth in the table below. The potential loss in fair value for each market risk exposure of the Company’s portfolio at December 31, 2007 was: December 31, 2007 (In millions) Non-trading: Interest rate risk . . . . . . . . . . . . . . . . . . . . . . . . . . . . . . . . . . . . . . . . . . . . . . . . . . . . . . . $5,170 Equity price risk . . . . . . . . . . . . . . . . . . . . . . . . . . . . . . . . . . . . . . . . . . . . . . . . . . . . . . . $ 96 Foreign currency exchange rate risk . . . . . . . . . . . . . . . . . . . . . . . . . . . . . . . . . . . . . . . . . . $ 711 Trading: Interest rate risk . . . . . . . . . . . . . . . . . . . . . . . . . . . . . . . . . . . . . . . . . . . . . . . . . . . . . . . $ 18 The table below provides additional detail regarding the potential loss in fair value of the Company’s non-trading interest sensitive financial instruments at December 31, 2007 by type of asset or liability: Notional Amount Estimated Fair Value Assuming a 10% increase in the yield curve December 31, 2007 (In millions) Assets Fixed maturity securities . . . . . . . . . . . . . . . . . . . . . . . . . . . . . . . . . . . . . . . . . . . . . . . $242,242 $(5,177) Equity securities . . . . . . . . . . . . . . . . . . . . . . . . . . . . . . . . . . . . . . . . . . . . . . . . . . . . 6,050 — Mortgage and consumer loans . . . . . . . . . . . . . . . . . . . . . . . . . . . . . . . . . . . . . . . . . . . 47,599 (594) Policy loans . . . . . . . . . . . . . . . . . . . . . . . . . . . . . . . . . . . . . . . . . . . . . . . . . . . . . . . 10,419 (235) Short-term investments . . . . . . . . . . . . . . . . . . . . . . . . . . . . . . . . . . . . . . . . . . . . . . . . 2,648 (15) Cash and cash equivalents . . . . . . . . . . . . . . . . . . . . . . . . . . . . . . . . . . . . . . . . . . . . . 10,368 — Mortgage loan commitments . . . . . . . . . . . . . . . . . . . . . . . . . . . . . . . . . . . . . . . . . . . . $ 4,035 (43) (50) Commitments to fund bank credit facilities, bridge loans and private corporate bond investments . . . . . . . . . . . . . . . . . . . . . . . . . . . . . . . . . . . . . . $ 1,196 (59) — Total assets . . . . . . . . . . . . . . . . . . . . . . . . . . . . . . . . . . . . . . . . . . . . . . . . . . . . . . $(6,071) Liabilities Policyholder account balances . . . . . . . . . . . . . . . . . . . . . . . . . . . . . . . . . . . . . . . . . . . $114,466 $ 840 Short-term debt . . . . . . . . . . . . . . . . . . . . . . . . . . . . . . . . . . . . . . . . . . . . . . . . . . . . 667 — Long-term debt . . . . . . . . . . . . . . . . . . . . . . . . . . . . . . . . . . . . . . . . . . . . . . . . . . . . . 9,532 307 Collateral financing arrangements . . . . . . . . . . . . . . . . . . . . . . . . . . . . . . . . . . . . . . . . . 5,365 — Junior subordinated debt securities . . . . . . . . . . . . . . . . . . . . . . . . . . . . . . . . . . . . . . . . 4,338 136 Shares subject to mandatory redemption . . . . . . . . . . . . . . . . . . . . . . . . . . . . . . . . . . . . 178 — Payables for collateral under securities loaned and other transactions . . . . . . . . . . . . . . . . . . 44,136 — Total liabilities . . . . . . . . . . . . . . . . . . . . . . . . . . . . . . . . . . . . . . . . . . . . . . . . . . . . $ 1,283 Other Derivative instruments (designated hedges or otherwise) Interest rate swaps . . . . . . . . . . . . . . . . . . . . . . . . . . . . . . . . . . . . . . . . . . . . . . . . . $62,519 $ 17 $ (132) Interest rate floors . . . . . . . . . . . . . . . . . . . . . . . . . . . . . . . . . . . . . . . . . . . . . . . . . . 48,937 621 (47) Interest rate caps . . . . . . . . . . . . . . . . . . . . . . . . . . . . . . . . . . . . . . . . . . . . . . . . . . 45,498 50 33 Financial futures . . . . . . . . . . . . . . . . . . . . . . . . . . . . . . . . . . . . . . . . . . . . . . . . . . . 10,817 32 (41) Foreign currency swaps . . . . . . . . . . . . . . . . . . . . . . . . . . . . . . . . . . . . . . . . . . . . . . 21,399 (244) (97) Foreign currency forwards . . . . . . . . . . . . . . . . . . . . . . . . . . . . . . . . . . . . . . . . . . . . 4,185 60 — Options . . . . . . . . . . . . . . . . . . . . . . . . . . . . . . . . . . . . . . . . . . . . . . . . . . . . . . . . 2,043 712 (93) Financial forwards . . . . . . . . . . . . . . . . . . . . . . . . . . . . . . . . . . . . . . . . . . . . . . . . . . 4,600 120 (5) Credit default swaps . . . . . . . . . . . . . . . . . . . . . . . . . . . . . . . . . . . . . . . . . . . . . . . . 6,850 23 (1) Synthetic GICs . . . . . . . . . . . . . . . . . . . . . . . . . . . . . . . . . . . . . . . . . . . . . . . . . . . . 3,670 — — Other . . . . . . . . . . . . . . . . . . . . . . . . . . . . . . . . . . . . . . . . . . . . . . . . . . . . . . . . . . 250 43 1 Total other . . . . . . . . . . . . . . . . . . . . . . . . . . . . . . . . . . . . . . . . . . . . . . . . . . . . . $ (382) Net change . . . . . . . . . . . . . . . . . . . . . . . . . . . . . . . . . . . . . . . . . . . . . . . . . . . . . . . . $(5,170) This quantitative measure of risk has decreased by $805 million, or 13%, to $5,170 million at December 31, 2007 from $5,975 million at December 31, 2006. A decrease in the yield curve has decreased our sensitivity by $1.5 billion. This decrease was partially offset by $140 million due to increased asset size, $270 million due to increased derivative usage and $285 million due to duration charges and other. In addition to the analysis above, as part of its asset liability management program, the Company also performs an analysis of the sensitivity to changes in interest rates, including both insurance liabilities and financial instruments. As of December 31, 2007, a hypothetical instantaneous 10% decrease in interest rates applied to the Company’s liabilities, insurance and associated asset portfolios would reduce the fair value of equity by $12 million. Management does not expect that this sensitivity would produce a liquidity strain on the Company. 88 MetLife, Inc.
  • 93.
    Changes in andDisagreements With Accountants on Accounting and Financial Disclosure None. Management’s Annual Report on Internal Control Over Financial Reporting Management of MetLife, Inc. and subsidiaries is responsible for establishing and maintaining adequate internal control over financial reporting. In fulfilling this responsibility, estimates and judgments by management are required to assess the expected benefits and related costs of control procedures. The objectives of internal control include providing management with reasonable, but not absolute, assurance that assets are safeguarded against loss from unauthorized use or disposition, and that transactions are executed in accordance with management’s authorization and recorded properly to permit the preparation of consolidated financial statements in conformity with GAAP. Financial management has documented and evaluated the effectiveness of the internal control of the Company as of December 31, 2007 pertaining to financial reporting in accordance with the criteria established in Internal Control — Integrated Framework issued by the Committee of Sponsoring Organizations of the Treadway Commission. In the opinion of management, MetLife, Inc. maintained effective internal control over financial reporting as of December 31, 2007. Deloitte & Touche LLP, an independent registered public accounting firm, has audited the consolidated financial statements and consolidated financial statement schedules included in the Annual Report on Form 10-K for the year ended December 31, 2007. The Report of the Independent Registered Public Accounting Firm on their audit of the consolidated financial statements and consolidated financial statement schedules is included at page F-1. Attestation Report of the Company’s Registered Public Accounting Firm The Company’s independent registered public accounting firm, Deloitte & Touche LLP, has issued their attestation report on management’s internal control over financial reporting which is set forth below. 89MetLife, Inc.
  • 94.
    REPORT OF INDEPENDENTREGISTERED PUBLIC ACCOUNTING FIRM To the Board of Directors and Stockholders of MetLife, Inc.: We have audited the internal control over financial reporting of MetLife, Inc. and subsidiaries (the “Company”) as of December 31, 2007, based on criteria established in Internal Control — Integrated Framework issued by the Committee of Sponsoring Organizations of the Treadway Commission. The Company’s management is responsible for maintaining effective internal control over financial reporting and for its assessment of the effectiveness of internal control over financial reporting, included in the accompanying Management’s Annual Report on Internal Control over Financial Reporting. Our responsibility is to express an opinion on the Company’s internal control over financial reporting based on our audit. We conducted our audit in accordance with the standards of the Public Company Accounting Oversight Board (United States). Those standards require that we plan and perform the audit to obtain reasonable assurance about whether effective internal control over financial reporting was maintained in all material respects. Our audit included obtaining an understanding of internal control over financial reporting, assessing the risk that a material weakness exists, testing and evaluating the design and operating effectiveness of internal control based on the assessed risk, and performing such other procedures as we considered necessary in the circumstances. We believe that our audit provides a reasonable basis for our opinion. A company’s internal control over financial reporting is a process designed by, or under the supervision of, the company’s principal executive and principal financial officers, or persons performing similar functions, and effected by the company’s board of directors, management, and other personnel to provide reasonable assurance regarding the reliability of financial reporting and the preparation of financial statements for external purposes in accordance with generally accepted accounting principles. A company’s internal control over financial reporting includes those policies and procedures that (1) pertain to the maintenance of records that, in reasonable detail, accurately and fairly reflect the transactions and dispositions of the assets of the company; (2) provide reasonable assurance that transactions are recorded as necessary to permit preparation of financial statements in accordance with generally accepted accounting principles, and that receipts and expenditures of the company are being made only in accordance with authorizations of management and directors of the company; and (3) provide reasonable assurance regarding prevention or timely detection of unauthorized acquisition, use, or disposition of the company’s assets that could have a material effect on the financial statements. Because of the inherent limitations of internal control over financial reporting, including the possibility of collusion or improper management override of controls, material misstatements due to error or fraud may not be prevented or detected on a timely basis. Also, projections of any evaluation of the effectiveness of the internal control over financial reporting to future periods are subject to the risk that the controls may become inadequate because of changes in conditions, or that the degree of compliance with the policies or procedures may deteriorate. In our opinion, the Company maintained, in all material respects, effective internal control over financial reporting as of December 31, 2007, based on the criteria established in Internal Control — Integrated Framework issued by the Committee of Sponsoring Organizations of the Treadway Commission. We have also audited, in accordance with the standards of the Public Company Accounting Oversight Board (United States), the consolidated financial statements as of and for the year ended December 31, 2007, of the Company, and our report dated February 28, 2008, expressed an unqualified opinion on those consolidated financial statements and included an explanatory paragraph regarding changes in the Company’s method of accounting for deferred acquisition costs and for income taxes as required by accounting guidance adopted on January 1, 2007. /s/ DELOITTE & TOUCHE LLP DELOITTE & TOUCHE LLP New York, New York February 28, 2008 90 MetLife, Inc.
  • 95.
    Financial Statements INDEX TOCONSOLIDATED FINANCIAL STATEMENTS Page Report of Independent Registered Public Accounting Firm . . . . . . . . . . . . . . . . . . . . . . . . . . . . . . . . . . . . . . . . . . . . . . . F-1 Financial Statements at December 31, 2007 and 2006 and for the Years Ended December 31, 2007, 2006 and 2005: Consolidated Balance Sheets . . . . . . . . . . . . . . . . . . . . . . . . . . . . . . . . . . . . . . . . . . . . . . . . . . . . . . . . . . . . . . . F-2 Consolidated Statements of Income . . . . . . . . . . . . . . . . . . . . . . . . . . . . . . . . . . . . . . . . . . . . . . . . . . . . . . . . . . . F-3 Consolidated Statements of Stockholders’ Equity . . . . . . . . . . . . . . . . . . . . . . . . . . . . . . . . . . . . . . . . . . . . . . . . . . . F-4 Consolidated Statements of Cash Flows . . . . . . . . . . . . . . . . . . . . . . . . . . . . . . . . . . . . . . . . . . . . . . . . . . . . . . . . F-5 Notes to Consolidated Financial Statements . . . . . . . . . . . . . . . . . . . . . . . . . . . . . . . . . . . . . . . . . . . . . . . . . . . . . . F-7 91MetLife, Inc.
  • 96.
  • 97.
    REPORT OF INDEPENDENTREGISTERED PUBLIC ACCOUNTING FIRM To the Board of Directors and Stockholders of MetLife, Inc.: We have audited the accompanying consolidated balance sheets of MetLife, Inc. and subsidiaries (the “Company”) as of December 31, 2007 and 2006, and the related consolidated statements of income, stockholders’ equity, and cash flows for each of the three years in the period ended December 31, 2007. These consolidated financial statements are the responsibility of the Company’s management. Our responsibility is to express an opinion on the consolidated financial statements based on our audits. We conducted our audits in accordance with the standards of the Public Company Accounting Oversight Board (United States). Those standards require that we plan and perform the audit to obtain reasonable assurance about whether the consolidated financial statements are free of material misstatement. An audit includes examining, on a test basis, evidence supporting the amounts and disclosures in the consolidated financial statements. An audit also includes assessing the accounting principles used and significant estimates made by management, as well as evaluating the overall financial statement presentation. We believe that our audits provide a reasonable basis for our opinion. In our opinion, such consolidated financial statements present fairly, in all material respects, the financial position of MetLife, Inc. and subsidiaries as of December 31, 2007 and 2006, and the results of their operations and their cash flows for each of the three years in the period ended December 31, 2007, in conformity with accounting principles generally accepted in the United States of America. As discussed in Note 1, the Company changed its method of accounting for deferred acquisition costs and for income taxes as required by accounting guidance adopted on January 1, 2007, and changed its method of accounting for defined benefit pension and other postretirement plans as required by accounting guidance adopted on December 31, 2006. We have also audited, in accordance with the standards of the Public Company Accounting Oversight Board (United States), the Company’s internal control over financial reporting as of December 31, 2007, based on the criteria established in Internal Control — Integrated Framework issued by the Committee of Sponsoring Organizations of the Treadway Commission, and our report, dated February 28, 2008, expressed an unqualified opinion on the Company’s internal control over financial reporting. /s/ DELOITTE & TOUCHE LLP DELOITTE & TOUCHE LLP New York, New York February 28, 2008 F-1MetLife, Inc.
  • 98.
    MetLife, Inc. Consolidated BalanceSheets December 31, 2007 and 2006 (In millions, except share and per share data) 2007 2006 Assets Investments: Fixed maturity securities available-for-sale, at estimated fair value (amortized cost: $238,761 and $236,768, respectively) . . . . . . . . . . . . . . . . . . . . . . . . . . . . . . . . . . . . . . . . . . . . . . . . . . . . . . . $242,242 $241,928 Equity securities available-for-sale, at estimated fair value (cost: $5,891 and $4,549, respectively) . . . . . . . . 6,050 5,094 Trading securities, at estimated fair value (cost: $768 and $727, respectively) . . . . . . . . . . . . . . . . . . . . . 779 759 Mortgage and consumer loans . . . . . . . . . . . . . . . . . . . . . . . . . . . . . . . . . . . . . . . . . . . . . . . . . . . . 47,030 42,239 Policy loans . . . . . . . . . . . . . . . . . . . . . . . . . . . . . . . . . . . . . . . . . . . . . . . . . . . . . . . . . . . . . . . . 10,419 10,228 Real estate and real estate joint ventures held-for-investment . . . . . . . . . . . . . . . . . . . . . . . . . . . . . . . . 6,597 4,802 Real estate held-for-sale . . . . . . . . . . . . . . . . . . . . . . . . . . . . . . . . . . . . . . . . . . . . . . . . . . . . . . . . 172 184 Other limited partnership interests . . . . . . . . . . . . . . . . . . . . . . . . . . . . . . . . . . . . . . . . . . . . . . . . . . 6,155 4,781 Short-term investments . . . . . . . . . . . . . . . . . . . . . . . . . . . . . . . . . . . . . . . . . . . . . . . . . . . . . . . . 2,648 2,709 Other invested assets . . . . . . . . . . . . . . . . . . . . . . . . . . . . . . . . . . . . . . . . . . . . . . . . . . . . . . . . . 12,642 10,428 Total investments . . . . . . . . . . . . . . . . . . . . . . . . . . . . . . . . . . . . . . . . . . . . . . . . . . . . . . . . 334,734 323,152 Cash and cash equivalents . . . . . . . . . . . . . . . . . . . . . . . . . . . . . . . . . . . . . . . . . . . . . . . . . . . . . . . 10,368 7,107 Accrued investment income . . . . . . . . . . . . . . . . . . . . . . . . . . . . . . . . . . . . . . . . . . . . . . . . . . . . . . . 3,630 3,347 Premiums and other receivables . . . . . . . . . . . . . . . . . . . . . . . . . . . . . . . . . . . . . . . . . . . . . . . . . . . . 14,607 14,490 Deferred policy acquisition costs and value of business acquired . . . . . . . . . . . . . . . . . . . . . . . . . . . . . . . 21,521 20,838 Current income tax recoverable . . . . . . . . . . . . . . . . . . . . . . . . . . . . . . . . . . . . . . . . . . . . . . . . . . . . . 303 — Goodwill. . . . . . . . . . . . . . . . . . . . . . . . . . . . . . . . . . . . . . . . . . . . . . . . . . . . . . . . . . . . . . . . . . . . 4,910 4,897 Assets of subsidiaries held-for-sale . . . . . . . . . . . . . . . . . . . . . . . . . . . . . . . . . . . . . . . . . . . . . . . . . . — 1,563 Other assets . . . . . . . . . . . . . . . . . . . . . . . . . . . . . . . . . . . . . . . . . . . . . . . . . . . . . . . . . . . . . . . . . 8,330 7,956 Separate account assets . . . . . . . . . . . . . . . . . . . . . . . . . . . . . . . . . . . . . . . . . . . . . . . . . . . . . . . . . 160,159 144,365 Total assets . . . . . . . . . . . . . . . . . . . . . . . . . . . . . . . . . . . . . . . . . . . . . . . . . . . . . . . . . . . . $558,562 $527,715 Liabilities and Stockholders’ Equity Liabilities: Future policy benefits . . . . . . . . . . . . . . . . . . . . . . . . . . . . . . . . . . . . . . . . . . . . . . . . . . . . . . . . . . $132,262 $127,489 Policyholder account balances . . . . . . . . . . . . . . . . . . . . . . . . . . . . . . . . . . . . . . . . . . . . . . . . . . . . 137,349 131,948 Other policyholder funds . . . . . . . . . . . . . . . . . . . . . . . . . . . . . . . . . . . . . . . . . . . . . . . . . . . . . . . . 10,176 9,139 Policyholder dividends payable. . . . . . . . . . . . . . . . . . . . . . . . . . . . . . . . . . . . . . . . . . . . . . . . . . . . 994 960 Policyholder dividend obligation . . . . . . . . . . . . . . . . . . . . . . . . . . . . . . . . . . . . . . . . . . . . . . . . . . . 789 1,063 Short-term debt . . . . . . . . . . . . . . . . . . . . . . . . . . . . . . . . . . . . . . . . . . . . . . . . . . . . . . . . . . . . . 667 1,449 Long-term debt . . . . . . . . . . . . . . . . . . . . . . . . . . . . . . . . . . . . . . . . . . . . . . . . . . . . . . . . . . . . . . 9,628 9,129 Collateral financing arrangements . . . . . . . . . . . . . . . . . . . . . . . . . . . . . . . . . . . . . . . . . . . . . . . . . . 5,732 850 Junior subordinated debt securities . . . . . . . . . . . . . . . . . . . . . . . . . . . . . . . . . . . . . . . . . . . . . . . . . 4,474 3,780 Shares subject to mandatory redemption . . . . . . . . . . . . . . . . . . . . . . . . . . . . . . . . . . . . . . . . . . . . . 159 278 Liabilities of subsidiaries held-for-sale . . . . . . . . . . . . . . . . . . . . . . . . . . . . . . . . . . . . . . . . . . . . . . . — 1,595 Current income tax payable . . . . . . . . . . . . . . . . . . . . . . . . . . . . . . . . . . . . . . . . . . . . . . . . . . . . . . — 1,465 Deferred income tax liability . . . . . . . . . . . . . . . . . . . . . . . . . . . . . . . . . . . . . . . . . . . . . . . . . . . . . . 2,457 2,278 Payables for collateral under securities loaned and other transactions . . . . . . . . . . . . . . . . . . . . . . . . . . 44,136 45,846 Other liabilities . . . . . . . . . . . . . . . . . . . . . . . . . . . . . . . . . . . . . . . . . . . . . . . . . . . . . . . . . . . . . . 14,401 12,283 Separate account liabilities . . . . . . . . . . . . . . . . . . . . . . . . . . . . . . . . . . . . . . . . . . . . . . . . . . . . . . 160,159 144,365 Total liabilities. . . . . . . . . . . . . . . . . . . . . . . . . . . . . . . . . . . . . . . . . . . . . . . . . . . . . . . . . . . 523,383 493,917 Contingencies, Commitments and Guarantees (Note 16) Stockholders’ Equity: Preferred stock, par value $0.01 per share; 200,000,000 shares authorized; 84,000,000 shares issued and outstanding; $2,100 aggregate liquidation preference . . . . . . . . . . . . . . . . . . . . . . . . . . . . . . . . . . . . . 1 1 Common stock, par value $0.01 per share; 3,000,000,000 shares authorized; 786,766,664 shares issued; 729,223,440 and 751,984,799 shares outstanding at December 31, 2007 and 2006, respectively. . . . . . . . 8 8 Additional paid-in capital . . . . . . . . . . . . . . . . . . . . . . . . . . . . . . . . . . . . . . . . . . . . . . . . . . . . . . . . . 17,098 17,454 Retained earnings . . . . . . . . . . . . . . . . . . . . . . . . . . . . . . . . . . . . . . . . . . . . . . . . . . . . . . . . . . . . . 19,884 16,574 Treasury stock, at cost; 57,543,224 shares and 34,781,865 shares at December 31, 2007 and 2006, respectively . . . . . . . . . . . . . . . . . . . . . . . . . . . . . . . . . . . . . . . . . . . . . . . . . . . . . . . . . . . . . . . . (2,890) (1,357) Accumulated other comprehensive income . . . . . . . . . . . . . . . . . . . . . . . . . . . . . . . . . . . . . . . . . . . . . 1,078 1,118 Total stockholders’ equity . . . . . . . . . . . . . . . . . . . . . . . . . . . . . . . . . . . . . . . . . . . . . . . . . . . . . . 35,179 33,798 Total liabilities and stockholders’ equity . . . . . . . . . . . . . . . . . . . . . . . . . . . . . . . . . . . . . . . . . . . . . $558,562 $527,715 See accompanying notes to consolidated financial statements. F-2 MetLife, Inc.
  • 99.
    MetLife, Inc. Consolidated Statementsof Income For the Years Ended December 31, 2007, 2006 and 2005 (In millions, except per share data) 2007 2006 2005 Revenues Premiums . . . . . . . . . . . . . . . . . . . . . . . . . . . . . . . . . . . . . . . . . . . . . . . . . . . . . . . . . . . . . $27,895 $26,412 $24,860 Universal life and investment-type product policy fees . . . . . . . . . . . . . . . . . . . . . . . . . . . . . . . . 5,311 4,780 3,828 Net investment income . . . . . . . . . . . . . . . . . . . . . . . . . . . . . . . . . . . . . . . . . . . . . . . . . . . . 19,006 17,082 14,756 Other revenues . . . . . . . . . . . . . . . . . . . . . . . . . . . . . . . . . . . . . . . . . . . . . . . . . . . . . . . . . 1,533 1,362 1,271 Net investment gains (losses) . . . . . . . . . . . . . . . . . . . . . . . . . . . . . . . . . . . . . . . . . . . . . . . . (738) (1,382) (86) Total revenues . . . . . . . . . . . . . . . . . . . . . . . . . . . . . . . . . . . . . . . . . . . . . . . . . . . . 53,007 48,254 44,629 Expenses Policyholder benefits and claims . . . . . . . . . . . . . . . . . . . . . . . . . . . . . . . . . . . . . . . . . . . . . . 27,828 26,431 25,506 Interest credited to policyholder account balances . . . . . . . . . . . . . . . . . . . . . . . . . . . . . . . . . . 5,741 5,171 3,887 Policyholder dividends . . . . . . . . . . . . . . . . . . . . . . . . . . . . . . . . . . . . . . . . . . . . . . . . . . . . . 1,726 1,701 1,679 Other expenses . . . . . . . . . . . . . . . . . . . . . . . . . . . . . . . . . . . . . . . . . . . . . . . . . . . . . . . . . 11,673 10,783 9,264 Total expenses . . . . . . . . . . . . . . . . . . . . . . . . . . . . . . . . . . . . . . . . . . . . . . . . . . . . 46,968 44,086 40,336 Income from continuing operations before provision for income tax . . . . . . . . . . . . . . . . . . . . . . . . 6,039 4,168 4,293 Provision for income tax . . . . . . . . . . . . . . . . . . . . . . . . . . . . . . . . . . . . . . . . . . . . . . . . . . . . 1,759 1,097 1,222 Income from continuing operations . . . . . . . . . . . . . . . . . . . . . . . . . . . . . . . . . . . . . . . . . . . . . 4,280 3,071 3,071 Income from discontinued operations, net of income tax . . . . . . . . . . . . . . . . . . . . . . . . . . . . . . . 37 3,222 1,643 Net income . . . . . . . . . . . . . . . . . . . . . . . . . . . . . . . . . . . . . . . . . . . . . . . . . . . . . . . . . . . . 4,317 6,293 4,714 Preferred stock dividends . . . . . . . . . . . . . . . . . . . . . . . . . . . . . . . . . . . . . . . . . . . . . . . . . . . 137 134 63 Net income available to common shareholders . . . . . . . . . . . . . . . . . . . . . . . . . . . . . . . . . . . . . $ 4,180 $ 6,159 $ 4,651 Income from continuing operations available to common shareholders per common share Basic . . . . . . . . . . . . . . . . . . . . . . . . . . . . . . . . . . . . . . . . . . . . . . . . . . . . . . . . . . . . . . $ 5.57 $ 3.85 $ 4.02 Diluted . . . . . . . . . . . . . . . . . . . . . . . . . . . . . . . . . . . . . . . . . . . . . . . . . . . . . . . . . . . . . $ 5.44 $ 3.81 $ 3.98 Net income available to common shareholders per common share Basic . . . . . . . . . . . . . . . . . . . . . . . . . . . . . . . . . . . . . . . . . . . . . . . . . . . . . . . . . . . . . . $ 5.62 $ 8.09 $ 6.21 Diluted . . . . . . . . . . . . . . . . . . . . . . . . . . . . . . . . . . . . . . . . . . . . . . . . . . . . . . . . . . . . . $ 5.48 $ 7.99 $ 6.16 Cash dividends per common share . . . . . . . . . . . . . . . . . . . . . . . . . . . . . . . . . . . . . . . . . . . . $ 0.74 $ 0.59 $ 0.52 See accompanying notes to consolidated financial statements. F-3MetLife, Inc.
  • 100.
    MetLife, Inc. Consolidated Statementsof Stockholders’ Equity For the Years Ended December 31, 2007, 2006 and 2005 (In millions) Preferred Stock Common Stock Additional Paid-in Capital Retained Earnings Treasury Stock at Cost Net Unrealized Investment Gains (Losses) Foreign Currency Translation Adjustments Defined Benefit Plans Adjustment Total Accumulated Other Comprehensive Income Balance at January 1, 2005 . . . . . . . . . . . . . $— $8 $15,037 $ 6,608 (1,785) $ 2,994 $ 92 $(130) $22,824 Treasury stock transactions, net . . . . . . . . . . 58 99 157 Common stock issued in connection with acquisition . . . . . . . . . . . . . . . . . . . . . . 283 727 1,010 Issuance of preferred stock . . . . . . . . . . . . . 1 2,042 2,043 Issuance of stock purchase contracts related to common equity units . . . . . . . . . . . . . . . . (146) (146) Dividends on preferred stock . . . . . . . . . . . . (63) (63) Dividends on common stock . . . . . . . . . . . . (394) (394) Comprehensive income: Net income . . . . . . . . . . . . . . . . . . . . . . 4,714 4,714 Other comprehensive income (loss): Unrealized gains (losses) on derivative instruments, net of income tax . . . . . . . 233 233 Unrealized investment gains (losses), net of related offsets and income tax . . . . . . . (1,285) (1,285) Foreign currency translation adjustments, net of income tax . . . . . . . . . . . . . . . (81) (81) Additional minimum pension liability adjustment, net of income tax . . . . . . . . 89 89 Other comprehensive income (loss). . . . . . . . . (1,044) Comprehensive income . . . . . . . . . . . . . . 3,670 Balance at December 31, 2005. . . . . . . . . . . 1 8 17,274 10,865 (959) 1,942 11 (41) 29,101 Treasury stock transactions, net . . . . . . . . . . 180 (398) (218) Dividends on preferred stock . . . . . . . . . . . . (134) (134) Dividends on common stock . . . . . . . . . . . . (450) (450) Comprehensive income: Net income . . . . . . . . . . . . . . . . . . . . . . 6,293 6,293 Other comprehensive income (loss): Unrealized gains (losses) on derivative instruments, net of income tax . . . . . . . (43) (43) Unrealized investment gains (losses), net of related offsets and income tax . . . . . . . (35) (35) Foreign currency translation adjustments, net of income tax . . . . . . . . . . . . . . . 46 46 Additional minimum pension liability adjustment, net of income tax . . . . . . . . (18) (18) Other comprehensive income (loss). . . . . . . . . (50) Comprehensive income . . . . . . . . . . . . . . 6,243 Adoption of SFAS 158, net of income tax . . . (744) (744) Balance at December 31, 2006. . . . . . . . . . . 1 8 17,454 16,574 (1,357) 1,864 57 (803) 33,798 Cumulative effect of changes in accounting principles, net of income tax (Note 1) . . . . . . (329) (329) Balance at January 1, 2007 . . . . . . . . . . . . . 1 8 17,454 16,245 (1,357) 1,864 57 (803) 33,469 Treasury stock transactions, net . . . . . . . . . . 94 (1,533) (1,439) Obligation under accelerated common stock repurchase agreement (Note 18) . . . . . . . . (450) (450) Dividends on preferred stock . . . . . . . . . . . . (137) (137) Dividends on common stock . . . . . . . . . . . . (541) (541) Comprehensive income: Net income . . . . . . . . . . . . . . . . . . . . . . 4,317 4,317 Other comprehensive income (loss): Unrealized gains (losses) on derivative instruments, net of income tax . . . . . . . (40) (40) Unrealized investment gains (losses), net of related offsets and income tax . . . . . . . (853) (853) Foreign currency translation adjustments, net of income tax . . . . . . . . . . . . . . . 290 290 Defined benefit plans adjustment, net of income tax . . . . . . . . . . . . . . . . . . . . 563 563 Other comprehensive income (loss) . . . . . (40) Comprehensive income . . . . . . . . . . . . . . 4,277 Balance at December 31, 2007. . . . . . . . . . . $ 1 $8 $17,098 $19,884 $(2,890) $ 971 $347 $(240) $35,179 See accompanying notes to consolidated financial statements. F-4 MetLife, Inc.
  • 101.
    MetLife, Inc. Consolidated Statementsof Cash Flows For the Years Ended December 31, 2007, 2006 and 2005 (In millions) 2007 2006 2005 Cash flows from operating activities Net income . . . . . . . . . . . . . . . . . . . . . . . . . . . . . . . . . . . . . . . . . . . . . . . . . . . . . . . . $ 4,317 $ 6,293 $ 4,714 Adjustments to reconcile net income to net cash provided by operating activities: Depreciation and amortization expenses . . . . . . . . . . . . . . . . . . . . . . . . . . . . . . . . . . 457 394 352 Amortization of premiums and accretion of discounts associated with investments, net . . . . (955) (618) (201) (Gains) losses from sales of investments and businesses, net . . . . . . . . . . . . . . . . . . . . . 619 (3,492) (2,271) Undistributed equity earnings of real estate joint ventures and other limited partnership interests. . . . . . . . . . . . . . . . . . . . . . . . . . . . . . . . . . . (606) (459) (416) Interest credited to policyholder account balances . . . . . . . . . . . . . . . . . . . . . . . . . . . . 5,790 5,246 3,925 Interest credited to bank deposits . . . . . . . . . . . . . . . . . . . . . . . . . . . . . . . . . . . . . . . 200 193 106 Universal life and investment-type product policy fees . . . . . . . . . . . . . . . . . . . . . . . . . . (5,311) (4,780) (3,828) Change in accrued investment income . . . . . . . . . . . . . . . . . . . . . . . . . . . . . . . . . . . (275) (315) (157) Change in premiums and other receivables . . . . . . . . . . . . . . . . . . . . . . . . . . . . . . . . . (283) (2,655) (37) Change in deferred policy acquisition costs, net . . . . . . . . . . . . . . . . . . . . . . . . . . . . . (1,178) (1,317) (1,043) Change in insurance-related liabilities . . . . . . . . . . . . . . . . . . . . . . . . . . . . . . . . . . . . 5,463 5,031 5,709 Change in trading securities . . . . . . . . . . . . . . . . . . . . . . . . . . . . . . . . . . . . . . . . . . 200 (432) (244) Change in income tax payable . . . . . . . . . . . . . . . . . . . . . . . . . . . . . . . . . . . . . . . . . 101 2,039 528 Change in other assets . . . . . . . . . . . . . . . . . . . . . . . . . . . . . . . . . . . . . . . . . . . . . 643 1,712 347 Change in other liabilities . . . . . . . . . . . . . . . . . . . . . . . . . . . . . . . . . . . . . . . . . . . . 729 (202) 506 Other, net . . . . . . . . . . . . . . . . . . . . . . . . . . . . . . . . . . . . . . . . . . . . . . . . . . . . . . 51 (38) 29 Net cash provided by operating activities . . . . . . . . . . . . . . . . . . . . . . . . . . . . . . . . . . . . . 9,962 6,600 8,019 Cash flows from investing activities Sales, maturities and repayments of: Fixed maturity securities . . . . . . . . . . . . . . . . . . . . . . . . . . . . . . . . . . . . . . . . . . . . 112,062 113,321 155,709 Equity securities . . . . . . . . . . . . . . . . . . . . . . . . . . . . . . . . . . . . . . . . . . . . . . . . . . 1,738 1,313 1,062 Mortgage and consumer loans . . . . . . . . . . . . . . . . . . . . . . . . . . . . . . . . . . . . . . . . . 9,854 8,348 8,462 Real estate and real estate joint ventures . . . . . . . . . . . . . . . . . . . . . . . . . . . . . . . . . . 664 6,211 3,668 Other limited partnership interests. . . . . . . . . . . . . . . . . . . . . . . . . . . . . . . . . . . . . . . 1,121 1,768 1,132 Purchases of: Fixed maturity securities . . . . . . . . . . . . . . . . . . . . . . . . . . . . . . . . . . . . . . . . . . . . . (112,534) (129,644) (169,111) Equity securities . . . . . . . . . . . . . . . . . . . . . . . . . . . . . . . . . . . . . . . . . . . . . . . . . . (2,883) (1,052) (1,509) Mortgage and consumer loans . . . . . . . . . . . . . . . . . . . . . . . . . . . . . . . . . . . . . . . . . (14,365) (13,472) (10,902) Real estate and real estate joint ventures . . . . . . . . . . . . . . . . . . . . . . . . . . . . . . . . . . (2,228) (1,523) (1,451) Other limited partnership interests. . . . . . . . . . . . . . . . . . . . . . . . . . . . . . . . . . . . . . . (2,041) (1,915) (1,105) Net change in short-term investments . . . . . . . . . . . . . . . . . . . . . . . . . . . . . . . . . . . . . 55 595 2,267 Additional consideration related to purchases of businesses . . . . . . . . . . . . . . . . . . . . . . . — (115) — Purchases of businesses, net of cash received of $13, $0 and $852, respectively . . . . . . . . . (43) — (10,160) Proceeds from sales of businesses, net of cash disposed of $763, $0 and $43, respectively. . (694) 48 260 Net change in other invested assets . . . . . . . . . . . . . . . . . . . . . . . . . . . . . . . . . . . . . . (1,020) (2,411) (450) Other, net . . . . . . . . . . . . . . . . . . . . . . . . . . . . . . . . . . . . . . . . . . . . . . . . . . . . . . . . (330) (358) (489) Net cash used in investing activities . . . . . . . . . . . . . . . . . . . . . . . . . . . . . . . . . . . . . . . . $ (10,644) $ (18,886) $ (22,617) See accompanying notes to consolidated financial statements. F-5MetLife, Inc.
  • 102.
    2007 2006 2005 Cashflows from financing activities Policyholder account balances: Deposits . . . . . . . . . . . . . . . . . . . . . . . . . . . . . . . . . . . . . . . . . . . . . . . . . . . . . . . . . $ 58,026 $ 53,947 $ 52,077 Withdrawals . . . . . . . . . . . . . . . . . . . . . . . . . . . . . . . . . . . . . . . . . . . . . . . . . . . . . . . (55,256) (50,574) (47,827) Net change in payables for collateral under securities loaned and other transactions . . . . . . . . . (1,710) 11,331 4,138 Net change in short-term debt . . . . . . . . . . . . . . . . . . . . . . . . . . . . . . . . . . . . . . . . . . . . (782) 35 (56) Long-term debt issued . . . . . . . . . . . . . . . . . . . . . . . . . . . . . . . . . . . . . . . . . . . . . . . . . 726 284 3,541 Long-term debt repaid. . . . . . . . . . . . . . . . . . . . . . . . . . . . . . . . . . . . . . . . . . . . . . . . . . (286) (732) (1,430) Collateral financing arrangements issued . . . . . . . . . . . . . . . . . . . . . . . . . . . . . . . . . . . . . . 4,882 850 — Shares subject to mandatory redemption. . . . . . . . . . . . . . . . . . . . . . . . . . . . . . . . . . . . . . (131) — — Preferred stock issued . . . . . . . . . . . . . . . . . . . . . . . . . . . . . . . . . . . . . . . . . . . . . . . . . — — 2,100 Dividends on preferred stock . . . . . . . . . . . . . . . . . . . . . . . . . . . . . . . . . . . . . . . . . . . . . (137) (134) (63) Junior subordinated debt securities issued . . . . . . . . . . . . . . . . . . . . . . . . . . . . . . . . . . . . 694 1,248 2,533 Treasury stock acquired . . . . . . . . . . . . . . . . . . . . . . . . . . . . . . . . . . . . . . . . . . . . . . . . . (1,705) (500) — Dividends on common stock . . . . . . . . . . . . . . . . . . . . . . . . . . . . . . . . . . . . . . . . . . . . . . (541) (450) (394) Stock options exercised . . . . . . . . . . . . . . . . . . . . . . . . . . . . . . . . . . . . . . . . . . . . . . . . 110 83 72 Debt and equity issuance costs. . . . . . . . . . . . . . . . . . . . . . . . . . . . . . . . . . . . . . . . . . . . (14) (25) (128) Other, net . . . . . . . . . . . . . . . . . . . . . . . . . . . . . . . . . . . . . . . . . . . . . . . . . . . . . . . . . . 67 12 (53) Net cash provided by financing activities . . . . . . . . . . . . . . . . . . . . . . . . . . . . . . . . . . . . . . . 3,943 15,375 14,510 Change in cash and cash equivalents . . . . . . . . . . . . . . . . . . . . . . . . . . . . . . . . . . . . . . . . . 3,261 3,089 (88) Cash and cash equivalents, beginning of year . . . . . . . . . . . . . . . . . . . . . . . . . . . . . . . . . . . . 7,107 4,018 4,106 Cash and cash equivalents, end of year . . . . . . . . . . . . . . . . . . . . . . . . . . . . . . . . . . . . . $ 10,368 $ 7,107 $ 4,018 Cash and cash equivalents, subsidiaries held-for-sale, beginning of year . . . . . . . . . . . . . . . . . . $ — $ — $ 58 Cash and cash equivalents, subsidiaries held-for-sale, end of year . . . . . . . . . . . . . . . . . $ — $ — $ — Cash and cash equivalents, from continuing operations, beginning of year . . . . . . . . . . . . . . . . . $ 7,107 $ 4,018 $ 4,048 Cash and cash equivalents, from continuing operations, end of year. . . . . . . . . . . . . . . . $ 10,368 $ 7,107 $ 4,018 Supplemental disclosures of cash flow information: Net cash paid during the year for: Interest . . . . . . . . . . . . . . . . . . . . . . . . . . . . . . . . . . . . . . . . . . . . . . . . . . . . . . . . . . $ 1,011 $ 819 $ 579 Income tax . . . . . . . . . . . . . . . . . . . . . . . . . . . . . . . . . . . . . . . . . . . . . . . . . . . . . . . . $ 2,128 $ 409 $ 1,391 Non-cash transactions during the year: Business acquisitions: Assets acquired . . . . . . . . . . . . . . . . . . . . . . . . . . . . . . . . . . . . . . . . . . . . . . . . . . . $ — $ — $102,112 Less: liabilities assumed. . . . . . . . . . . . . . . . . . . . . . . . . . . . . . . . . . . . . . . . . . . . . . — — 90,090 Net assets acquired . . . . . . . . . . . . . . . . . . . . . . . . . . . . . . . . . . . . . . . . . . . . . . . . — — 12,022 Less: cash paid . . . . . . . . . . . . . . . . . . . . . . . . . . . . . . . . . . . . . . . . . . . . . . . . . . . — — 11,012 Business acquisition, common stock issued . . . . . . . . . . . . . . . . . . . . . . . . . . . . . . . . . $ — $ — $ 1,010 Business dispositions: Assets disposed. . . . . . . . . . . . . . . . . . . . . . . . . . . . . . . . . . . . . . . . . . . . . . . . . . . $ — $ — $ 366 Less: liabilities disposed . . . . . . . . . . . . . . . . . . . . . . . . . . . . . . . . . . . . . . . . . . . . . — — 269 Net assets disposed . . . . . . . . . . . . . . . . . . . . . . . . . . . . . . . . . . . . . . . . . . . . . . . . — — 97 Plus: equity securities received . . . . . . . . . . . . . . . . . . . . . . . . . . . . . . . . . . . . . . . . . — — 43 Less: cash disposed . . . . . . . . . . . . . . . . . . . . . . . . . . . . . . . . . . . . . . . . . . . . . . . . — — 43 Business disposition, net of cash disposed . . . . . . . . . . . . . . . . . . . . . . . . . . . . . . . . . $ — $ — $ 97 Contribution of equity securities to MetLife Foundation . . . . . . . . . . . . . . . . . . . . . . . . . . $ 12 $ — $ 1 Accrual for stock purchase contracts related to common equity units . . . . . . . . . . . . . . . . $ — $ — $ 97 Real estate acquired in satisfaction of debt . . . . . . . . . . . . . . . . . . . . . . . . . . . . . . . . . $ 1 $ 6 $ 1 See accompanying notes to consolidated financial statements. F-6 MetLife, Inc. MetLife, Inc. Consolidated Statements of Cash Flows — (Continued) For the Years Ended December 31, 2007, 2006 and 2005 (In millions)
  • 103.
    MetLife, Inc. Notes toConsolidated Financial Statements 1. Business, Basis of Presentation, and Summary of Significant Accounting Policies Business “MetLife” or the “Company” refers to MetLife, Inc., a Delaware corporation incorporated in 1999 (the “Holding Company”), and its subsidiaries, including Metropolitan Life Insurance Company (“MLIC”). MetLife is a leading provider of insurance and other financial services with operations throughout the United States and the regions of Latin America, Europe, and Asia Pacific. Through its domestic and international subsidiaries and affiliates, MetLife offers life insurance, annuities, automobile and homeowners insurance, retail banking and other financial services to individuals, as well as group insurance, reinsurance and retirement & savings products and services to corporations and other institutions. Basis of Presentation The accompanying consolidated financial statements include the accounts of (i) the Holding Company and its subsidiaries; (ii) part- nerships and joint ventures in which the Company has control; and (iii) variable interest entities (“VIEs”) for which the Company is deemed to be the primary beneficiary. Closed block assets, liabilities, revenues and expenses are combined on a line-by-line basis with the assets, liabilities, revenues and expenses outside the closed block based on the nature of the particular item. See Note 9. Intercompany accounts and transactions have been eliminated. The Company uses the equity method of accounting for investments in equity securities in which it has more than a 20% interest and for real estate joint ventures and other limited partnership interests in which it has more than a minor equity interest or more than a minor influence over the joint venture’s or partnership’s operations, but does not have a controlling interest and is not the primary beneficiary. The Company uses the cost method of accounting for investments in real estate joint ventures and other limited partnership interests in which it has a minor equity investment and virtually no influence over the joint venture’s or partnership’s operations. Minority interest related to consolidated entities included in other liabilities was $1.8 billion and $1.4 billion at December 31, 2007 and 2006, respectively. Certain amounts in the prior year periods’ consolidated financial statements have been reclassified to conform with the 2007 presen- tation. Such reclassifications include $850 million relating to long-term debt reclassified to collateral financing arrangements on the consolidated balance sheet at December 31, 2006 and the consolidated statement of cash flow for the year ended December 31, 2006. See Note 11 for a description of the transaction. See also Note 23 for reclassifications related to discontinued operations. On July 1, 2005, the Holding Company completed the acquisition of The Travelers Insurance Company, excluding certain assets, most significantly, Primerica, from Citigroup Inc. (“Citigroup”), and substantially all of Citigroup’s international insurance businesses (collectively, “Travelers”), which is described in Note 2. The acquisition was accounted for using the purchase method of accounting. Travelers’ assets, liabilities and results of operations were included in the Company’s results beginning July 1, 2005. The accounting policies of Travelers were conformed to those of MetLife upon acquisition. Summary of Significant Accounting Policies and Critical Accounting Estimates The preparation of financial statements in conformity with accounting principles generally accepted in the United States of America (“GAAP”) requires management to adopt accounting policies and make estimates and assumptions that affect amounts reported in the consolidated financial statements. The most critical estimates include those used in determining: i) the fair value of investments in the absence of quoted market values; ii) investment impairments; iii) the recognition of income on certain investments; iv) the application of the consolidation rules to certain investments; v) the fair value of and accounting for derivatives; vi) the capitalization and amortization of deferred policy acquisition costs (“DAC”) and the establishment and amortization of value of business acquired (“VOBA”); vii) the measurement of goodwill and related impairment, if any; viii) the liability for future policyholder benefits; ix) accounting for income taxes and the valuation of deferred tax assets; x) accounting for reinsurance transactions; xi) accounting for employee benefit plans; and xii) the liability for litigation and regulatory matters. A description of such critical estimates is incorporated within the discussion of the related accounting policies which follow. The application of purchase accounting requires the use of estimation techniques in determining the fair values of assets acquired and liabilities assumed — the most significant of which relate to the aforementioned critical estimates. In applying these policies, management makes subjective and complex judgments that frequently require estimates about matters that are inherently uncertain. Many of these policies, estimates and related judgments are common in the insurance and financial services industries; others are specific to the Company’s businesses and operations. Actual results could differ from these estimates. Investments The Company’s principal investments are in fixed maturity and equity securities, mortgage and consumer loans, policy loans, real estate, real estate joint ventures and other limited partnerships, short-term investments, and other invested assets. The accounting policies related to each are as follows: Fixed Maturity and Equity Securities. The Company’s fixed maturity and equity securities are classified as available-for-sale, except for trading securities, and are reported at their estimated fair value. Unrealized investment gains and losses on these securities are recorded as a separate component of other comprehensive income or loss, net of policyholder related amounts and deferred F-7MetLife, Inc.
  • 104.
    income taxes. Allsecurity transactions are recorded on a trade date basis. Investment gains and losses on sales of securities are determined on a specific identification basis. Interest income on fixed maturity securities is recorded when earned using an effective yield method giving effect to amortization of premiums and accretion of discounts. Dividends on equity securities are recorded when declared. These dividends and interest income are recorded as part of net investment income. Included within fixed maturity securities are loan-backed securities including mortgage-backed and asset-backed securities. Amortization of the premium or discount from the purchase of these securities considers the estimated timing and amount of prepayments of the underlying loans. Actual prepayment experience is periodically reviewed and effective yields are recalculated when differences arise between the prepayments originally anticipated and the actual prepayments received and currently antic- ipated. Prepayment assumptions for single class and multi-class mortgage-backed and asset-backed securities are obtained from broker-dealer survey values or internal estimates. For credit-sensitive mortgage-backed and asset-backed securities and certain prepayment-sensitive securities, the effective yield is recalculated on a prospective basis. For all other mortgage-backed and asset- backed securities, the effective yield is recalculated on a retrospective basis. The cost of fixed maturity and equity securities is adjusted for impairments in value deemed to be other-than-temporary in the period in which the determination is made. These impairments are included within net investment gains (losses) and the cost basis of the fixed maturity and equity securities is reduced accordingly. The Company does not change the revised cost basis for subsequent recoveries in value. The assessment of whether impairments have occurred is based on management’s case-by-case evaluation of the underlying reasons for the decline in fair value. The Company’s review of its fixed maturity and equity securities for impairments includes an analysis of the total gross unrealized losses by three categories of securities: (i) securities where the estimated fair value had declined and remained below cost or amortized cost by less than 20%; (ii) securities where the estimated fair value had declined and remained below cost or amortized cost by 20% or more for less than six months; and (iii) securities where the estimated fair value had declined and remained below cost or amortized cost by 20% or more for six months or greater. Additionally, management considers a wide range of factors about the security issuer and uses its best judgment in evaluating the cause of the decline in the estimated fair value of the security and in assessing the prospects for near-term recovery. Inherent in management’s evaluation of the security are assumptions and estimates about the operations of the issuer and its future earnings potential. Considerations used by the Company in the impairment evaluation process include, but are not limited to: (i) the length of time and the extent to which the market value has been below cost or amortized cost; (ii) the potential for impairments of securities when the issuer is experiencing significant financial difficulties; (iii) the potential for impairments in an entire industry sector or sub-sector; (iv) the potential for impairments in certain economically depressed geographic locations; (v) the potential for impair- ments of securities where the issuer, series of issuers or industry has suffered a catastrophic type of loss or has exhausted natural resources; (vi) the Company’s ability and intent to hold the security for a period of time sufficient to allow for the recovery of its value to an amount equal to or greater than cost or amortized cost (See also Note 3); (vii) unfavorable changes in forecasted cash flows on mortgage-backed and asset-backed securities; and (viii) other subjective factors, including concentrations and information obtained from regulators and rating agencies. The Company purchases and receives beneficial interests in special purpose entities (“SPEs”), which enhance the Company’s total return on its investment portfolio principally by providing equity-based returns on debt securities. These investments are generally made through structured notes and similar instruments (collectively, “Structured Investment Transactions”). The Company has not guaranteed the performance, liquidity or obligations of the SPEs and its exposure to loss is limited to its carrying value of the beneficial interests in the SPEs. The Company does not consolidate such SPEs as it has determined it is not the primary beneficiary. These Structured Investment Transactions are included in fixed maturity securities and their income is generally recognized using the retrospective interest method. Impairments of these investments are included in net investment gains (losses). Trading Securities. The Company’s trading securities portfolio, principally consisting of fixed maturity and equity securities, supports investment strategies that involve the active and frequent purchase and sale of securities and the execution of short sale agreements, and supports asset and liability matching strategies for certain insurance products. Trading securities and short sale agreement liabilities are recorded at fair value with subsequent changes in fair value recognized in net investment income. Related dividends and investment income are also included in net investment income. Securities Lending. Securities loaned transactions are treated as financing arrangements and are recorded at the amount of cash received. The Company obtains collateral in an amount equal to 102% of the fair value of the securities loaned. The Company monitors the market value of the securities loaned on a daily basis with additional collateral obtained as necessary. Substantially all of the Company’s securities loaned transactions are with large brokerage firms. Income and expenses associated with securities loaned transactions are reported as investment income and investment expense, respectively, within net investment income. Mortgage and Consumer Loans. Mortgage and consumer loans are stated at unpaid principal balance, adjusted for any unamortized premium or discount, deferred fees or expenses, net of valuation allowances. Interest income is accrued on the principal amount of the loan based on the loan’s contractual interest rate. Amortization of premiums and discounts is recorded using the effective yield method. Interest income, amortization of premiums and discounts, and prepayment fees are reported in net investment income. Loans are considered to be impaired when it is probable that, based upon current information and events, the Company will be unable to collect all amounts due under the contractual terms of the loan agreement. Valuation allowances are established for the excess carrying value of the loan over the present value of expected future cash flows discounted at the loan’s original effective F-8 MetLife, Inc. MetLife, Inc. Notes to Consolidated Financial Statements — (Continued)
  • 105.
    interest rate, thevalue of the loan’s collateral if the loan is in the process of foreclosure or otherwise collateral dependent, or the loan’s market value if the loan is being sold. The Company also establishes allowances for loan losses when a loss contingency exists for pools of loans with similar characteristics, such as mortgage loans based on similar property types or loan to value risk factors. A loss contingency exists when the likelihood that a future event will occur is probable based on past events. Interest income earned on impaired loans is accrued on the principal amount of the loan based on the loan’s contractual interest rate. However, interest ceases to be accrued for loans on which interest is generally more than 60 days past due and/or where the collection of interest is not considered probable. Cash receipts on such impaired loans are recorded as a reduction of the recorded investment. Gains and losses from the sale of loans and changes in valuation allowances are reported in net investment gains (losses). Policy Loans. Policy loans are stated at unpaid principal balances. Interest income on such loans is recorded as earned using the contractually agreed upon interest rate. Generally, interest is capitalized on the policy’s anniversary date. Real Estate. Real estate held-for-investment, including related improvements, is stated at cost less accumulated depreciation. Depreciation is provided on a straight-line basis over the estimated useful life of the asset (typically 20 to 55 years). Rental income is recognized on a straight-line basis over the term of the respective leases. The Company classifies a property as held-for-sale if it commits to a plan to sell a property within one year and actively markets the property in its current condition for a price that is reasonable in comparison to its fair value. The Company classifies the results of operations and the gain or loss on sale of a property that either has been disposed of or classified as held-for-sale as discontinued operations, if the ongoing operations of the property will be eliminated from the ongoing operations of the Company and if the Company will not have any significant continuing involvement in the operations of the property after the sale. Real estate held-for-sale is stated at the lower of depreciated cost or fair value less expected disposition costs. Real estate is not depreciated while it is classified as held-for-sale. The Company periodically reviews its properties held-for-investment for impairment and tests properties for recoverability whenever events or changes in circumstances indicate the carrying amount of the asset may not be recoverable and the carrying value of the property exceeds its fair value. Properties whose carrying values are greater than their undiscounted cash flows are written down to their fair value, with the impairment loss included in net investment gains (losses). Impairment losses are based upon the estimated fair value of real estate, which is generally computed using the present value of expected future cash flows from the real estate discounted at a rate commensurate with the underlying risks. Real estate acquired upon foreclosure of commercial and agricultural mortgage loans is recorded at the lower of estimated fair value or the carrying value of the mortgage loan at the date of foreclosure. Real Estate Joint Ventures and Other Limited Partnership Interests. The Company uses the equity method of accounting for investments in real estate joint ventures and other limited partnership interests in which it has more than a minor equity interest or more than a minor influence over the joint ventures or partnership’s operations, but does not have a controlling interest and is not the primary beneficiary. The Company uses the cost method of accounting for investments in real estate joint ventures and other limited partnership interests in which it has a minor equity investment and virtually no influence over the joint ventures or the partnership’s operations. In addition to the investees performing regular evaluations for the impairment of underlying investments, the Company routinely evaluates its investments in real estate joint ventures and other limited partnerships for impairments. For its cost method investments, the Company follows an impairment analysis which is similar to the process followed for its fixed maturity and equity securities as described previously. For equity method investees, the Company considers financial and other information provided by the investee, other known information and inherent risks in the underlying investments, as well as future capital commitments, in determining whether an impairment has occurred. When an other-than-temporary impairment is deemed to have occurred, the Company records a realized capital loss within net investment gains (losses) to record the investment at its fair value. Short-term Investments. Short-term investments include investments with remaining maturities of one year or less, but greater than three months, at the time of acquisition and are stated at amortized cost, which approximates fair value. Other Invested Assets. Other invested assets consist principally of leveraged leases and funds withheld at interest. Leveraged leases are recorded net of non-recourse debt. The Company participates in lease transactions which are diversified by industry, asset type and geographic area. The Company recognizes income on the leveraged leases by applying the leveraged lease’s estimated rate of return to the net investment in the lease. The Company regularly reviews residual values and impairs them to expected values as needed. Funds withheld represent amounts contractually withheld by ceding companies in accordance with reinsurance agreements. For agreements written on a modified coinsurance basis and certain agreements written on a coinsurance basis, assets supporting the reinsured policies, and equal to the net statutory reserves, are withheld and continue to be legally owned by the ceding companies. The Company records a funds withheld receivable rather than the underlying investments. The Company recognizes interest on funds withheld at rates defined by the treaty terms which may be contractually specified or directly related to the investment portfolio and records it in net investment income. Other invested assets also include stand-alone derivatives with positive fair values and the fair value of embedded derivatives related to funds withheld and modified coinsurance contracts. Estimates and Uncertainties. The Company’s investments are exposed to three primary sources of risk: credit, interest rate and market valuation. The financial statement risks, stemming from such investment risks, are those associated with the recognition of impairments, the recognition of income on certain investments, and the determination of fair values. F-9MetLife, Inc. MetLife, Inc. Notes to Consolidated Financial Statements — (Continued)
  • 106.
    The determination ofthe amount of allowances and impairments, as applicable, are described previously by investment type. The determination of such allowances and impairments is highly subjective and is based upon the Company’s periodic evaluation and assessment of known and inherent risks associated with the respective asset class. Such evaluations and assessments are revised as conditions change and new information becomes available. Management updates its evaluations regularly and reflects changes in allowances and impairments in operations as such evaluations are revised. The recognition of income on certain investments (e.g. loan-backed securities, including mortgage-backed and asset-backed securities, certain investment transactions, trading securities, etc.) is dependent upon market conditions, which could result in prepayments and changes in amounts to be earned. The fair values of publicly held fixed maturity securities and publicly held equity securities are based on quoted market prices or estimates from independent pricing services. However, in cases where quoted market prices are not available, such as for private fixed maturity securities, fair values are estimated using present value or valuation techniques. The determination of fair values is based on: (i) valuation methodologies; (ii) securities the Company deems to be comparable; and (iii) assumptions deemed appropriate given the circumstances. The fair value estimates are made at a specific point in time, based on available market information and judgments about financial instruments, including estimates of the timing and amounts of expected future cash flows and the credit standing of the issuer or counterparty. Factors considered in estimating fair value include: coupon rate, maturity, estimated duration, call provisions, sinking fund requirements, credit rating, industry sector of the issuer, and quoted market prices of comparable securities. The use of different methodologies and assumptions may have a material effect on the estimated fair value amounts. Additionally, when the Company enters into certain structured investment transactions, real estate joint ventures and other limited partnerships for which the Company may be deemed to be the primary beneficiary under Financial Accounting Standards Board (“FASB”) Interpretation (“FIN”) No. 46(r), Consolidation of Variable Interest Entities — An Interpretation of ARB No. 51, it may be required to consolidate such investments. The accounting rules for the determination of the primary beneficiary are complex and require evaluation of the contractual rights and obligations associated with each party involved in the entity, an estimate of the entity’s expected losses and expected residual returns and the allocation of such estimates to each party. The use of different methodologies and assumptions as to the determination of the fair value of investments, the timing and amount of impairments, the recognition of income, or consolidation of investments may have a material effect on the amounts presented within the consolidated financial statements. Derivative Financial Instruments Derivatives are financial instruments whose values are derived from interest rates, foreign currency exchange rates, or other financial indices. Derivatives may be exchange-traded or contracted in the over-the-counter market. The Company uses a variety of derivatives, including swaps, forwards, futures and option contracts, to manage the risk associated with variability in cash flows or changes in fair values related to the Company’s financial instruments. The Company also uses derivative instruments to hedge its currency exposure associated with net investments in certain foreign operations. To a lesser extent, the Company uses credit derivatives, such as credit default swaps, to synthetically replicate investment risks and returns which are not readily available in the cash market. The Company also purchases certain securities, issues certain insurance policies and investment contracts and engages in certain reinsurance contracts that have embedded derivatives. Freestanding derivatives are carried on the Company’s consolidated balance sheet either as assets within other invested assets or as liabilities within other liabilities at fair value as determined by quoted market prices or through the use of pricing models. The determination of fair value, when quoted market values are not available, is based on valuation methodologies and assumptions deemed appropriate under the circumstances. Derivative valuations can be affected by changes in interest rates, foreign currency exchange rates, financial indices, credit spreads, market volatility, and liquidity. Values can also be affected by changes in estimates and assumptions used in pricing models. Such assumptions include estimates of volatility, interest rates, foreign currency exchange rates, other financial indices and credit ratings. Essential to the analysis of the fair value is risk of counterparty default. The use of different assumptions may have a material effect on the estimated derivative fair value amounts, as well as the amount of reported net income. If a derivative is not designated as an accounting hedge or its use in managing risk does not qualify for hedge accounting, changes in the fair value of the derivative are generally reported in net investment gains (losses) except for those (i) in policyholder benefits and claims for economic hedges of liabilities embedded in certain variable annuity products offered by the Company, and (ii) in net investment income for economic hedges of equity method investments in joint ventures, or for all derivatives held in relation to the trading portfolios. The fluctuations in fair value of derivatives which have not been designated for hedge accounting can result in significant volatility in net income. To qualify for hedge accounting, at the inception of the hedging relationship, the Company formally documents its risk management objective and strategy for undertaking the hedging transaction, as well as its designation of the hedge as either (i) a hedge of the fair value of a recognized asset or liability or an unrecognized firm commitment (“fair value hedge”); (ii) a hedge of a forecasted transaction or of the variability of cash flows to be received or paid related to a recognized asset or liability (“cash flow hedge”); or (iii) a hedge of a net investment in a foreign operation. In this documentation, the Company sets forth how the hedging instrument is expected to hedge the designated risks related to the hedged item and sets forth the method that will be used to retrospectively and prospectively assess the hedging instrument’s effectiveness and the method which will be used to measure ineffectiveness. A derivative designated as a hedging instrument must be assessed as being highly effective in offsetting the designated risk of the hedged item. Hedge effectiveness is formally assessed at inception and periodically throughout the life of the designated hedging relationship. Assessments of hedge effectiveness and measurements of ineffectiveness are also subject to interpretation and estimation and different interpretations or estimates may have a material effect on the amount reported in net income. The accounting for derivatives is complex and interpretations of the primary accounting standards continue to evolve in practice. Judgment is applied in determining the availability and application of hedge accounting designations and the appropriate accounting F-10 MetLife, Inc. MetLife, Inc. Notes to Consolidated Financial Statements — (Continued)
  • 107.
    treatment under theseaccounting standards. If it was determined that hedge accounting designations were not appropriately applied, reported net income could be materially affected. Differences in judgment as to the availability and application of hedge accounting designations and the appropriate accounting treatment may result in a differing impact on the consolidated financial statements of the Company from that previously reported. Under a fair value hedge, changes in the fair value of the hedging derivative, including amounts measured as ineffectiveness, and changes in the fair value of the hedged item related to the designated risk being hedged, are reported within net investment gains (losses). The fair values of the hedging derivatives are exclusive of any accruals that are separately reported in the consolidated statement of income within interest income or interest expense to match the location of the hedged item. Under a cash flow hedge, changes in the fair value of the hedging derivative measured as effective are reported within other comprehensive income (loss), a separate component of stockholders’ equity, and the deferred gains or losses on the derivative are reclassified into the consolidated statement of income when the Company’s earnings are affected by the variability in cash flows of the hedged item. Changes in the fair value of the hedging instrument measured as ineffectiveness are reported within net investment gains (losses). The fair values of the hedging derivatives are exclusive of any accruals that are separately reported in the consolidated statement of income within interest income or interest expense to match the location of the hedged item. In a hedge of a net investment in a foreign operation, changes in the fair value of the hedging derivative that are measured as effective are reported within other comprehensive income (loss) consistent with the translation adjustment for the hedged net investment in the foreign operation. Changes in the fair value of the hedging instrument measured as ineffectiveness are reported within net investment gains (losses). The Company discontinues hedge accounting prospectively when: (i) it is determined that the derivative is no longer highly effective in offsetting changes in the fair value or cash flows of a hedged item; (ii) the derivative expires, is sold, terminated, or exercised; (iii) it is no longer probable that the hedged forecasted transaction will occur; (iv) a hedged firm commitment no longer meets the definition of a firm commitment; or (v) the derivative is de-designated as a hedging instrument. When hedge accounting is discontinued because it is determined that the derivative is not highly effective in offsetting changes in the fair value or cash flows of a hedged item, the derivative continues to be carried on the consolidated balance sheet at its fair value, with changes in fair value recognized currently in net investment gains (losses). The carrying value of the hedged recognized asset or liability under a fair value hedge is no longer adjusted for changes in its fair value due to the hedged risk, and the cumulative adjustment to its carrying value is amortized into income over the remaining life of the hedged item. Provided the hedged forecasted transaction is still probable of occurrence, the changes in fair value of derivatives recorded in other comprehensive income (loss) related to discontinued cash flow hedges are released into the consolidated statement of income when the Company’s earnings are affected by the variability in cash flows of the hedged item. When hedge accounting is discontinued because it is no longer probable that the forecasted transactions will occur by the end of the specified time period or the hedged item no longer meets the definition of a firm commitment, the derivative continues to be carried on the consolidated balance sheet at its fair value, with changes in fair value recognized currently in net investment gains (losses). Any asset or liability associated with a recognized firm commitment is derecognized from the consolidated balance sheet, and recorded currently in net investment gains (losses). Deferred gains and losses of a derivative recorded in other comprehensive income (loss) pursuant to the cash flow hedge of a forecasted transaction are recognized immediately in net investment gains (losses). In all other situations in which hedge accounting is discontinued, the derivative is carried at its fair value on the consolidated balance sheet, with changes in its fair value recognized in the current period as net investment gains (losses). The Company is also a party to financial instruments that contain terms which are deemed to be embedded derivatives. The Company assesses each identified embedded derivative to determine whether it is required to be bifurcated. If the instrument would not be accounted for in its entirety at fair value and it is determined that the terms of the embedded derivative are not clearly and closely related to the economic characteristics of the host contract, and that a separate instrument with the same terms would qualify as a derivative instrument, the embedded derivative is bifurcated from the host contract and accounted for as a freestanding derivative. Such embedded derivatives are carried on the consolidated balance sheet at fair value with the host contract and changes in their fair value are reported currently in net investment gains (losses). If the Company is unable to properly identify and measure an embedded derivative for separation from its host contract, the entire contract is carried on the balance sheet at fair value, with changes in fair value recognized in the current period in net investment gains (losses). Additionally, the Company may elect to carry an entire contract on the balance sheet at fair value, with changes in fair value recognized in the current period in net investment gains (losses) if that contract contains an embedded derivative that requires bifurcation. There is a risk that embedded derivatives requiring bifurcation may not be identified and reported at fair value in the consolidated financial statements and that their related changes in fair value could materially affect reported net income. Cash and Cash Equivalents The Company considers all highly liquid investments purchased with an original or remaining maturity of three months or less at the date of purchase to be cash equivalents. Property, Equipment, Leasehold Improvements and Computer Software Property, equipment and leasehold improvements, which are included in other assets, are stated at cost, less accumulated depre- ciation and amortization. Depreciation is determined using either the straight-line or sum-of-the-years-digits method over the estimated useful lives of the assets, as appropriate. The estimated life for company occupied real estate property is generally 40 years. Estimated lives generally range from five to ten years for leasehold improvements and three to seven years for all other property and equipment. The cost basis of the property, equipment and leasehold improvements was $1.6 billion and $1.5 billion at December 31, 2007 and 2006, respectively. Accumulated depreciation and amortization of property, equipment and leasehold improvements was $828 million and F-11MetLife, Inc. MetLife, Inc. Notes to Consolidated Financial Statements — (Continued)
  • 108.
    $721 million atDecember 31, 2007 and 2006, respectively. Related depreciation and amortization expense was $136 million, $129 million and $117 million for the years ended December 31, 2007, 2006 and 2005, respectively. Computer software, which is included in other assets, is stated at cost, less accumulated amortization. Purchased software costs, as well as certain internal and external costs incurred to develop internal-use computer software during the application development stage, are capitalized. Such costs are amortized generally over a four-year period using the straight-line method. The cost basis of computer software was $1.4 billion and $1.2 billion at December 31, 2007 and 2006, respectively. Accumulated amortization of capitalized software was $876 million and $752 million at December 31, 2007 and 2006, respectively. Related amortization expense was $126 million, $112 million and $111 million for the years ended December 31, 2007, 2006 and 2005, respectively. Deferred Policy Acquisition Costs and Value of Business Acquired The Company incurs significant costs in connection with acquiring new and renewal insurance business. Costs that vary with and relate to the production of new business are deferred as DAC. Such costs consist principally of commissions and agency and policy issue expenses. VOBA is an intangible asset that reflects the estimated fair value of in-force contracts in a life insurance company acquisition and represents the portion of the purchase price that is allocated to the value of the right to receive future cash flows from the business in-force at the acquisition date. VOBA is based on actuarially determined projections, by each block of business, of future policy and contract charges, premiums, mortality and morbidity, separate account performance, surrenders, operating expenses, investment returns and other factors. Actual experience on the purchased business may vary from these projections. The recovery of DAC and VOBA is dependent upon the future profitability of the related business. DAC and VOBA are aggregated in the financial statements for reporting purposes. DAC for property and casualty insurance contracts, which is primarily composed of commissions and certain underwriting expenses, is amortized on a pro rata basis over the applicable contract term or reinsurance treaty. DAC and VOBA on life insurance or investment-type contracts are amortized in proportion to gross premiums, gross margins or gross profits, depending on the type of contract as described below. The Company amortizes DAC and VOBA related to non-participating and non-dividend-paying traditional contracts (term insurance, non-participating whole life insurance, non-medical health insurance, and traditional group life insurance) over the entire premium paying period in proportion to the present value of actual historic and expected future gross premiums. The present value of expected premiums is based upon the premium requirement of each policy and assumptions for mortality, morbidity, persistency, and investment returns at policy issuance, or policy acquisition, as it relates to VOBA, that include provisions for adverse deviation and are consistent with the assumptions used to calculate future policyholder benefit liabilities. These assumptions are not revised after policy issuance or acquisition unless the DAC or VOBA balance is deemed to be unrecoverable from future expected profits. Absent a premium deficiency, variability in amortization after policy issuance or acquisition is caused only by variability in premium volumes. The Company amortizes DAC and VOBA related to participating, dividend-paying traditional contracts over the estimated lives of the contracts in proportion to actual and expected future gross margins. The amortization includes interest based on rates in effect at inception or acquisition of the contracts. The future gross margins are dependent principally on investment returns, policyholder dividend scales, mortality, persistency, expenses to administer the business, creditworthiness of reinsurance counterparties, and certain economic variables, such as inflation. For participating contracts (dividend paying traditional contracts within the closed block) future gross margins are also dependent upon changes in the policyholder dividend obligation. Of these factors, the Company anticipates that investment returns, expenses, persistency, and other factor changes and policyholder dividend scales are reasonably likely to impact significantly the rate of DAC and VOBA amortization. Each reporting period, the Company updates the estimated gross margins with the actual gross margins for that period. When the actual gross margins change from previously estimated gross margins, the cumulative DAC and VOBA amortization is re-estimated and adjusted by a cumulative charge or credit to current operations. When actual gross margins exceed those previously estimated, the DAC and VOBA amortization will increase, resulting in a current period charge to earnings. The opposite result occurs when the actual gross margins are below the previously estimated gross margins. Each reporting period, the Company also updates the actual amount of business in-force, which impacts expected future gross margins. The Company amortizes DAC and VOBA related to fixed and variable universal life contracts and fixed and variable deferred annuity contracts over the estimated lives of the contracts in proportion to actual and expected future gross profits. The amortization includes interest based on rates in effect at inception or acquisition of the contracts. The amount of future gross profits is dependent principally upon returns in excess of the amounts credited to policyholders, mortality, persistency, interest crediting rates, expenses to administer the business, creditworthiness of reinsurance counterparties, the effect of any hedges used, and certain economic variables, such as inflation. Of these factors, the Company anticipates that investment returns, expenses, and persistency are reasonably likely to impact significantly the rate of DAC and VOBA amortization. Each reporting period, the Company updates the estimated gross profits with the actual gross profits for that period. When the actual gross profits change from previously estimated gross profits, the cumulative DAC and VOBA amortization is re-estimated and adjusted by a cumulative charge or credit to current operations. When actual gross profits exceed those previously estimated, the DAC and VOBA amortization will increase, resulting in a current period charge to earnings. The opposite result occurs when the actual gross profits are below the previously estimated gross profits. Each reporting period, the Company also updates the actual amount of business remaining in-force, which impacts expected future gross profits. Separate account rates of return on variable universal life contracts and variable deferred annuity contracts affect in-force account balances on such contracts each reporting period. Returns that are higher than the Company’s long-term expectation produce higher account balances, which increases the Company’s future fee expectations and decreases future benefit payment expectations on minimum death benefit guarantees, resulting in higher expected future gross profits. The opposite result occurs when returns are lower than the Company’s long-term expectation. The Company’s practice to determine the impact of gross profits resulting from returns on separate accounts assumes that long-term appreciation in equity markets is not changed by short-term market fluctuations, but is only changed when sustained interim deviations are expected. The Company monitors these changes and only changes the assumption when its long-term expectation changes. F-12 MetLife, Inc. MetLife, Inc. Notes to Consolidated Financial Statements — (Continued)
  • 109.
    The Company alsoreviews periodically other long-term assumptions underlying the projections of estimated gross margins and profits. These include investment returns, policyholder dividend scales, interest crediting rates, mortality, persistency, and expenses to administer business. Management annually updates assumptions used in the calculation of estimated gross margins and profits which may have significantly changed. If the update of assumptions causes expected future gross margins and profits to increase, DAC and VOBA amortization will decrease, resulting in a current period increase to earnings. The opposite result occurs when the assumption update causes expected future gross margins and profits to decrease. Prior to 2007, DAC related to any internally replaced contract was generally expensed at the date of replacement. As described more fully in “Adoption of New Accounting Pronouncements”, effective January 1, 2007, the Company adopted Statement of Position (“SOP”) 05-1, Accounting by Insurance Enterprises for Deferred Acquisition Costs in Connection with Modifications or Exchanges of Insurance Contracts (“SOP 05-1”). Under SOP 05-1, an internal replacement is defined as a modification in product benefits, features, rights or coverages that occur by the exchange of a contract for a new contract, or by amendment, endorsement, or rider to a contract, or by election or coverage within a contract. If the modification substantially changes the contract, the DAC is written off immediately through income and any new deferrable costs associated with the replacement contract are deferred. If the modification does not substantially change the contract, the DAC amortization on the original contract will continue and any acquisition costs associated with the related modification are expensed. Sales Inducements The Company has two different types of sales inducements which are included in other assets: (i) the policyholder receives a bonus whereby the policyholder’s initial account balance is increased by an amount equal to a specified percentage of the customer’s deposit; and (ii) the policyholder receives a higher interest rate using a dollar cost averaging method than would have been received based on the normal general account interest rate credited. The Company defers sales inducements and amortizes them over the life of the policy using the same methodology and assumptions used to amortize DAC. Goodwill Goodwill is the excess of cost over the fair value of net assets acquired. Goodwill is not amortized but is tested for impairment at least annually or more frequently if events or circumstances, such as adverse changes in the business climate, indicate that there may be justification for conducting an interim test. Impairment testing is performed using the fair value approach, which requires the use of estimates and judgment, at the “reporting unit” level. A reporting unit is the operating segment or a business one level below the operating segment, if discrete financial information is prepared and regularly reviewed by management at that level. For purposes of goodwill impairment testing, goodwill within Corporate & Other is allocated to reporting units within the Company’s business segments. If the carrying value of a reporting unit’s goodwill exceeds its fair value, the excess is recognized as an impairment and recorded as a charge against net income. The fair values of the reporting units are determined using a market multiple, a discounted cash flow model, or a cost approach. The critical estimates necessary in determining fair value are projected earnings, comparative market multiples and the discount rate. Liability for Future Policy Benefits and Policyholder Account Balances The Company establishes liabilities for amounts payable under insurance policies, including traditional life insurance, traditional annuities and non-medical health insurance. Generally, amounts are payable over an extended period of time and related liabilities are calculated as the present value of future expected benefits to be paid reduced by the present value of future expected premiums. Such liabilities are established based on methods and underlying assumptions in accordance with GAAP and applicable actuarial standards. Principal assumptions used in the establishment of liabilities for future policy benefits are mortality, morbidity, policy lapse, renewal, retirement, disability incidence, disability terminations, investment returns, inflation, expenses and other contingent events as appropriate to the respective product type. Utilizing these assumptions, liabilities are established on a block of business basis. Future policy benefit liabilities for participating traditional life insurance policies are equal to the aggregate of (i) net level premium reserves for death and endowment policy benefits (calculated based upon the non-forfeiture interest rate, ranging from 3% to 10% for domestic business and 3% to 10% for international business, and mortality rates guaranteed in calculating the cash surrender values described in such contracts); and (ii) the liability for terminal dividends. Future policy benefits for non-participating traditional life insurance policies are equal to the aggregate of the present value of expected future benefit payments and related expenses less the present value of expected future net premiums. Assumptions as to mortality and persistency are based upon the Company’s experience when the basis of the liability is established. Interest rates for the aggregate future policy benefit liabilities range from 3% to 10% for domestic business and 3% to 12% for international business. Participating business represented approximately 9% and 10% of the Company’s life insurance in-force, and 33% and 38% of the number of life insurance policies in-force, at December 31, 2007 and 2006, respectively. Participating policies represented approximately 31% and 30%, 30% and 29%, and 31% and 30% of gross and net life insurance premiums for the years ended December 31, 2007, 2006 and 2005, respectively. The percentages indicated are calculated excluding the business of the reinsurance segment. Future policy benefit liabilities for individual and group traditional fixed annuities after annuitization are equal to the present value of expected future payments. Interest rates used in establishing such liabilities range from 3% to 11% for domestic business and 4% to 10% for international business. Future policy benefit liabilities for non-medical health insurance are calculated using the net level premium method and assumptions as to future morbidity, withdrawals and interest, which provide a margin for adverse deviation. Interest rates used in establishing such liabilities range from 3% to 7% for domestic business and 3% to 10% for international business. F-13MetLife, Inc. MetLife, Inc. Notes to Consolidated Financial Statements — (Continued)
  • 110.
    Future policy benefitliabilities for disabled lives are estimated using the present value of benefits method and experience assumptions as to claim terminations, expenses and interest. Interest rates used in establishing such liabilities range from 3% to 8% for domestic business and 2% to 10% for international business. Liabilities for unpaid claims and claim expenses for property and casualty insurance are included in future policyholder benefits and represent the amount estimated for claims that have been reported but not settled and claims incurred but not reported. Liabilities for unpaid claims are estimated based upon the Company’s historical experience and other actuarial assumptions that consider the effects of current developments, anticipated trends and risk management programs, reduced for anticipated salvage and subrogation. The effects of changes in such estimated liabilities are included in the results of operations in the period in which the changes occur. The Company establishes future policy benefit liabilities for minimum death and income benefit guarantees relating to certain annuity contracts and secondary and paid-up guarantees relating to certain life policies as follows: • Annuity guaranteed minimum death benefit (“GMDB”) liabilities are determined by estimating the expected value of death benefits in excess of the projected account balance and recognizing the excess ratably over the accumulation period based on total expected assessments. The Company regularly evaluates estimates used and adjusts the additional liability balance, with a related charge or credit to benefit expense, if actual experience or other evidence suggests that earlier assumptions should be revised. The assumptions used in estimating the GMDB liabilities are consistent with those used for amortizing DAC, and are thus subject to the same variability and risk. The assumptions of investment performance and volatility are consistent with the historical experience of the Standard & Poor’s 500 Index (“S&P”). The benefits used in calculating the liabilities are based on the average benefits payable over a range of scenarios. • Guaranteed minimum income benefit (“GMIB”) liabilities are determined by estimating the expected value of the income benefits in excess of the projected account balance at any future date of annuitization and recognizing the excess ratably over the accumulation period based on total expected assessments. The Company regularly evaluates estimates used and adjusts the additional liability balance, with a related charge or credit to benefit expense, if actual experience or other evidence suggests that earlier assumptions should be revised. The assumptions used for estimating the GMIB liabilities are consistent with those used for estimating the GMDB liabilities. In addition, the calculation of guaranteed annuitization benefit liabilities incorporates an assumption for the percentage of the potential annuitizations that may be elected by the contractholder. Liabilities for universal and variable life secondary guarantees and paid-up guarantees are determined by estimating the expected value of death benefits payable when the account balance is projected to be zero and recognizing those benefits ratably over the accumulation period based on total expected assessments. The Company regularly evaluates estimates used and adjusts the additional liability balances, with a related charge or credit to benefit expense, if actual experience or other evidence suggests that earlier assumptions should be revised. The assumptions used in estimating the secondary and paid-up guarantee liabilities are consistent with those used for amortizing DAC, and are thus subject to the same variability and risk. The assumptions of investment performance and volatility for variable products are consistent with historical S&P experience. The benefits used in calculating the liabilities are based on the average benefits payable over a range of scenarios. The Company establishes policyholder account balances for guaranteed minimum benefit riders relating to certain variable annuity products as follows: • Guaranteed minimum withdrawal benefit riders (“GMWB”) guarantee the contractholder a return of their purchase payment via partial withdrawals, even if the account value is reduced to zero, provided that the contractholder’s cumulative withdrawals in a contract year do not exceed a certain limit. The initial guaranteed withdrawal amount is equal to the initial benefit base as defined in the contract (typically, the initial purchase payments plus applicable bonus amounts). The GMWB is an embedded derivative, which is measured at fair value separately from the host variable annuity product. • Guaranteed minimum accumulation benefit riders (“GMAB”) provide the contractholder, after a specified period of time determined at the time of issuance of the variable annuity contract, with a minimum accumulation of their purchase payments even if the account value is reduced to zero. The initial guaranteed accumulation amount is equal to the initial benefit base as defined in the contract (typically, the initial purchase payments plus applicable bonus amounts). The GMAB is also an embedded derivative, which is measured at fair value separately from the host variable annuity product. • For both GMWB and GMAB, the initial benefit base is increased by additional purchase payments made within a certain time period and decreases by benefits paid and/or withdrawal amounts. After a specified period of time, the benefit base may also increase as a result of an optional reset as defined in the contract. The fair values of the GMWB and GMAB riders are calculated based on actuarial and capital market assumptions related to the projected cash flows, including benefits and related contract charges, over the lives of the contracts, incorporating expectations concerning policyholder behavior. In measuring the fair value of GMWBs and GMABs, the Company attributes a portion of the fees collected from the policyholder equal to the present value of expected future guaranteed minimum withdrawal and accumulation benefits (at inception). The changes in fair value are reported in net investment gains (losses). Any additional fees represent “excess” fees and are reported in universal life and investment-type product policy fees. These riders may be more costly than expected in volatile or declining markets, causing an increase in liabilities for future policy benefits, negatively affecting net income. The Company periodically reviews its estimates of actuarial liabilities for future policy benefits and compares them with its actual experience. Differences between actual experience and the assumptions used in pricing these policies, guarantees and riders and in the establishment of the related liabilities result in variances in profit and could result in losses. The effects of changes in such estimated liabilities are included in the results of operations in the period in which the changes occur. Policyholder account balances relate to investment-type contracts and universal life-type policies. Investment-type contracts principally include traditional individual fixed annuities in the accumulation phase and non-variable group annuity contracts. Policyholder account balances are equal to (i) policy account values, which consist of an accumulation of gross premium payments; (ii) credited interest, ranging F-14 MetLife, Inc. MetLife, Inc. Notes to Consolidated Financial Statements — (Continued)
  • 111.
    from 1% to17% for domestic business and 1% to 15% for international business, less expenses, mortality charges, and withdrawals; and (iii) fair value adjustments relating to business combinations. Bank deposits are also included in policyholder account balances. Other Policyholder Funds Other policyholder funds include policy and contract claims, unearned revenue liabilities, premiums received in advance, policyholder dividends due and unpaid, and policyholder dividends left on deposit. The liability for policy and contract claims generally relates to incurred but not reported death, disability, long-term care and dental claims as well as claims which have been reported but not yet settled. The liability for these claims is based on the Company’s estimated ultimate cost of settling all claims. The Company derives estimates for the development of incurred but not reported claims principally from actuarial analyses of historical patterns of claims and claims development for each line of business. The methods used to determine these estimates are continually reviewed. Adjustments resulting from this continuous review process and differences between estimates and payments for claims are recognized in policyholder benefits and claims expense in the period in which the estimates are changed or payments are made. The unearned revenue liability relates to universal life-type and investment-type products and represents policy charges for services to be provided in future periods. The charges are deferred as unearned revenue and amortized using the product’s estimated gross profits and margins, similar to DAC. Such amortization is recorded in universal life and investment-type product policy fees. The Company accounts for the prepayment of premiums on its individual life, group life and health contracts as premium received in advance and applies the cash received to premiums when due. Also included in other policyholder funds are policyholder dividends due and unpaid on participating policies and policyholder dividends left on deposit. Such liabilities are presented at amounts contractually due to policyholders. Recognition of Insurance Revenue and Related Benefits Premiums related to traditional life and annuity policies with life contingencies are recognized as revenues when due from policyholders. Policyholder benefits and expenses are provided against such revenues to recognize profits over the estimated lives of the policies. When premiums are due over a significantly shorter period than the period over which benefits are provided, any excess profit is deferred and recognized into operations in a constant relationship to insurance in-force or, for annuities, the amount of expected future policy benefit payments. Premiums related to non-medical health and disability contracts are recognized on a pro rata basis over the applicable contract term. Deposits related to universal life-type and investment-type products are credited to policyholder account balances. Revenues from such contracts consist of amounts assessed against policyholder account balances for mortality, policy administration and surrender charges and are recorded in universal life and investment-type product policy fees in the period in which services are provided. Amounts that are charged to operations include interest credited and benefit claims incurred in excess of related policyholder account balances. Premiums related to property and casualty contracts are recognized as revenue on a pro rata basis over the applicable contract term. Unearned premiums, representing the portion of premium written relating to the unexpired coverage, are included in future policy benefits. Premiums, policy fees, policyholder benefits and expenses are presented net of reinsurance. Other Revenues Other revenues include advisory fees, broker-dealer commissions and fees, and administrative service fees. Such fees and com- missions are recognized in the period in which services are performed. Other revenues also include changes in account value relating to corporate-owned life insurance (“COLI”). Under certain COLI contracts, if the Company reports certain unlikely adverse results in its consolidated financial statements, withdrawals would not be immediately available and would be subject to market value adjustment, which could result in a reduction of the account value. Policyholder Dividends Policyholder dividends are approved annually by the insurance subsidiaries’ boards of directors. The aggregate amount of policyholder dividends is related to actual interest, mortality, morbidity and expense experience for the year, as well as management’s judgment as to the appropriate level of statutory surplus to be retained by the insurance subsidiaries. Income Taxes The Holding Company and its includable life insurance and non-life insurance subsidiaries file a consolidated U.S. federal income tax return in accordance with the provisions of the Internal Revenue Code of 1986, as amended (the “Code”). Non-includable subsidiaries file either separate individual corporate tax returns or separate consolidated tax returns. The Company’s accounting for income taxes represents management’s best estimate of various events and transactions. Deferred tax assets and liabilities resulting from temporary differences between the financial reporting and tax bases of assets and liabilities are measured at the balance sheet date using enacted tax rates expected to apply to taxable income in the years the temporary differences are expected to reverse. The realization of deferred tax assets depends upon the existence of sufficient taxable income within the carryback or carryforward periods under the tax law in the applicable tax jurisdiction. Valuation allowances are established when management determines, based on available information, that it is more likely than not that deferred income tax assets will not be realized. Significant judgment is required in determining whether valuation allowances should be established as well as the amount of such allowances. When making such determination, consideration is given to, among other things, the following: (i) future taxable income exclusive of reversing temporary differences and carryforwards; (ii) future reversals of existing taxable temporary differences; F-15MetLife, Inc. MetLife, Inc. Notes to Consolidated Financial Statements — (Continued)
  • 112.
    (iii) taxable incomein prior carryback years; and (iv) tax planning strategies. The Company may be required to change its provision for income taxes in certain circumstances. Examples of such circumstances include when the ultimate deductibility of certain items is challenged by taxing authorities (See also Note 15) or when estimates used in determining valuation allowances on deferred tax assets significantly change or when receipt of new information indicates the need for adjustment in valuation allowances. Additionally, future events, such as changes in tax laws, tax regulations, or interpretations of such laws or regulations, could have an impact on the provision for income tax and the effective tax rate. Any such changes could significantly affect the amounts reported in the consolidated financial statements in the year these changes occur. As described more fully in “Adoption of New Accounting Pronouncements”, the Company adopted FIN No. 48, Accounting for Uncertainty in Income Taxes — An Interpretation of FASB Statement No. 109 (“FIN 48”) effective January 1, 2007. Under FIN 48, the Company determines whether it is more-likely-than-not that a tax position will be sustained upon examination by the appropriate taxing authorities before any part of the benefit can be recorded in the financial statements. A tax position is measured at the largest amount of benefit that is greater than 50 percent likely of being realized upon settlement. Unrecognized tax benefits due to tax uncertainties that do not meet the threshold are included within other liabilities and are charged to earnings in the period that such determination is made. The Company classifies interest recognized as interest expense and penalties recognized as a component of income tax. Reinsurance The Company enters into reinsurance transactions as both a provider and a purchaser of reinsurance for its life and property and casualty insurance products. For each of its reinsurance contracts, the Company determines if the contract provides indemnification against loss or liability relating to insurance risk in accordance with applicable accounting standards. The Company reviews all contractual features, particularly those that may limit the amount of insurance risk to which the reinsurer is subject or features that delay the timely reimbursement of claims. For reinsurance of existing in-force blocks of long-duration contracts that transfer significant insurance risk, the difference, if any, between the amounts paid (received), and the liabilities ceded (assumed) related to the underlying contracts is considered the net cost of reinsurance at the inception of the contract. The net cost of reinsurance is recorded as an adjustment to DAC and recognized as a component of other expenses on a basis consistent with the way the acquisition costs on the underlying reinsured contracts would be recognized. Subsequent amounts paid (received) on the reinsurance of in-force blocks, as well as amounts paid (received) related to new business, are recorded as ceded (assumed) premiums and ceded (assumed) future policy benefit liabilities are established. For prospective reinsurance of short-duration contracts that meet the criteria for reinsurance accounting, amounts paid (received) are recorded as ceded (assumed) premiums and ceded (assumed) unearned premiums and are reflected as a component of premiums and other receivables (future policy benefits). Such amounts are amortized through earned premiums over the remaining contract period in proportion to the amount of protection provided. For retroactive reinsurance of short-duration contracts that meet the criteria of reinsurance accounting, amounts paid (received) in excess of (which do not exceed) the related insurance liabilities ceded (assumed) are recognized immediately as a loss. Any gains on such retroactive contracts are deferred and recorded in other liabilities. The gains are amortized primarily using the recovery method. The assumptions used to account for both long and short-duration reinsurance contracts are consistent with those used for the underlying contracts. Ceded policyholder and contract related liabilities, other than those currently due, are reported gross on the balance sheet. Amounts currently recoverable under reinsurance contracts are included in premiums and other receivables and amounts currently payable are included in other liabilities. Such assets and liabilities relating to reinsurance contracts with the same reinsurer may be recorded net on the balance sheet, if a right of offset exists within the reinsurance contract. Premiums, fees and policyholder benefits and claims include amounts assumed under reinsurance contracts and are net of reinsurance ceded. If the Company determines that a reinsurance contract does not expose the reinsurer to a reasonable possibility of a significant loss from insurance risk, the Company records the contract using the deposit method of accounting. Deposits received are included in other liabilities and deposits made are included within other assets. As amounts are paid or received, consistent with the underlying contracts, the deposit assets or liabilities are adjusted. Interest on such deposits is recorded as other revenues or other expenses, as appropriate. Periodically, the Company evaluates the adequacy of the expected payments or recoveries and adjusts the deposit asset or liability through other revenues or other expenses, as appropriate. Amounts received from reinsurers for policy administration are reported in other revenues. Accounting for reinsurance requires extensive use of assumptions and estimates, particularly related to the future performance of the underlying business and the potential impact of counterparty credit risks. The Company periodically reviews actual and anticipated experience compared to the aforementioned assumptions used to establish assets and liabilities relating to ceded and assumed reinsurance and evaluates the financial strength of counterparties to its reinsurance agreements using criteria similar to that evaluated in the security impairment process discussed previously. Separate Accounts Separate accounts are established in conformity with insurance laws and are generally not chargeable with liabilities that arise from any other business of the Company. Separate account assets are subject to general account claims only to the extent the value of such assets exceeds the separate account liabilities. The Company reports separately, as assets and liabilities, investments held in separate accounts and liabilities of the separate accounts if (i) such separate accounts are legally recognized; (ii) assets supporting the contract liabilities are legally insulated from the Company’s general account liabilities; (iii) investments are directed by the contractholder; and (iv) all investment performance, net of contract fees and assessments, is passed through to the contractholder. The Company reports separate account F-16 MetLife, Inc. MetLife, Inc. Notes to Consolidated Financial Statements — (Continued)
  • 113.
    assets meeting suchcriteria at their fair value. Investment performance (including investment income, net investment gains (losses) and changes in unrealized gains (losses)) and the corresponding amounts credited to contractholders of such separate accounts are offset within the same line in the consolidated statements of income. The Company’s revenues reflect fees charged to the separate accounts, including mortality charges, risk charges, policy administration fees, investment management fees and surrender charges. Separate accounts not meeting the above criteria are combined on a line-by-line basis with the Company’s general account assets, liabilities, revenues and expenses. Employee Benefit Plans Certain subsidiaries of the Holding Company (the “Subsidiaries”) sponsor and/or administer various plans that provide defined benefit pension and other postretirement benefits covering eligible employees and sales representatives. A December 31 measurement date is used for all of the Subsidiaries’ defined benefit pension and other postretirement benefit plans. Pension benefits are provided utilizing either a traditional formula or cash balance formula. The traditional formula provides benefits based upon years of credited service and either final average or career average earnings. The cash balance formula utilizes hypothetical or notional accounts which credit participants with benefits equal to a percentage of eligible pay as well as earnings credits, determined annually based upon the average annual rate of interest on 30-year Treasury securities, for each account balance. As of December 31, 2007, virtually all the obligations are calculated using the traditional formula. The Subsidiaries also provide certain postemployment benefits and certain postretirement medical and life insurance benefits for retired employees. Employees of the Subsidiaries who were hired prior to 2003 (or, in certain cases, rehired during or after 2003) and meet age and service criteria while working for one of the Subsidiaries, may become eligible for these other postretirement benefits, at various levels, in accordance with the applicable plans. Virtually all retirees, or their beneficiaries, contribute a portion of the total cost of postretirement medical benefits. Employees hired after 2003 are not eligible for any employer subsidy for postretirement medical benefits. SFAS No. 87, Employers’ Accounting for Pensions (“SFAS 87”), as amended, established the accounting for pension plan obligations. Under SFAS 87, the projected pension benefit obligation (“PBO”) is defined as the actuarially calculated present value of vested and non- vested pension benefits accrued based on future salary levels. The accumulated pension benefit obligation (“ABO”) is the actuarial present value of vested and non-vested pension benefits accrued based on current salary levels. Obligations, both PBO and ABO, of the defined benefit pension plans are determined using a variety of actuarial assumptions, from which actual results may vary, as described below. SFAS No. 106, Employers’ Accounting for Postretirement Benefits Other than Pensions (“SFAS 106”), as amended, established the accounting for expected postretirement plan benefit obligations (“EPBO”) which represents the actuarial present value of all other postretirement benefits expected to be paid after retirement to employees and their dependents. Unlike for pensions, the EPBO is not recorded in the financial statements but is used in measuring the periodic expense. The accumulated postretirement plan benefit obligations (“APBO”) represents the actuarial present value of future other postretirement benefits attributed to employee services rendered through a particular date and is the valuation basis upon which liabilities are established. The APBO is determined using a variety of actuarial assumptions, from which actual results may vary, as described below. Prior to December 31, 2006, the funded status of the pension and other postretirement plans, which is the difference between the fair value of plan assets and the PBO for pension plans and the APBO for other postretirement plans (collectively, the “Benefit Obligations”), were offset by the unrecognized actuarial gains or losses, prior service cost and transition obligations to determine prepaid or accrued benefit cost, as applicable. The net amount was recorded as a prepaid or accrued benefit cost, as applicable. Further, for pension plans, if the ABO exceeded the fair value of the plan assets, that excess was recorded as an additional minimum pension liability with a corresponding intangible asset. Recognition of the intangible asset was limited to the amount of any unrecognized prior service cost. Any additional minimum pension liability in excess of the allowable intangible asset was charged, net of income tax, to accumulated other comprehensive income. As described more fully in “Adoption of New Accounting Pronouncements”, effective December 31, 2006, the Company adopted SFAS No. 158, Employers’ Accounting for Defined Benefit Pension and Other Postretirement Plans — an amendment of FASB Statements No. 87, 88, 106, and SFAS No. 132(r) (“SFAS 158”). Effective with the adoption of SFAS 158 on December 31, 2006, the Company recognizes the funded status of the Benefit Obligations for each of its plans on the consolidated balance sheet. The actuarial gains or losses, prior service costs and credits, and the remaining net transition asset or obligation that had not yet been included in net periodic benefit costs as of December 31, 2006 are now charged, net of income tax, to accumulated other comprehensive income. Additionally, these changes eliminated the additional minimum pension liability provisions of SFAS 87. Net periodic benefit cost is determined using management estimates and actuarial assumptions to derive service cost, interest cost, and expected return on plan assets for a particular year. Net periodic benefit cost also includes the applicable amortization of any prior service cost (credit) arising from the increase (decrease) in prior years’ benefit costs due to plan amendments or initiation of new plans. These costs are amortized into net periodic benefit cost over the expected service years of employees whose benefits are affected by such plan amendments. Actual experience related to plan assets and/or the benefit obligations may differ from that originally assumed when determining net periodic benefit cost for a particular period, resulting in gains or losses. To the extent such aggregate gains or losses exceed 10 percent of the greater of the benefit obligations or the market-related asset value of the plans, they are amortized into net periodic benefit cost over the expected service years of employees expected to receive benefits under the plans. The obligations and expenses associated with these plans require an extensive use of assumptions such as the discount rate, expected rate of return on plan assets, rate of future compensation increases, healthcare cost trend rates, as well as assumptions regarding participant demographics such as rate and age of retirements, withdrawal rates and mortality. Management, in consultation with its external consulting actuarial firm, determines these assumptions based upon a variety of factors such as historical performance of the plan and its assets, currently available market and industry data, and expected benefit payout streams. The assumptions used may differ materially from actual results due to, among other factors, changing market and economic conditions and changes in participant demographics. These differences may have a significant effect on the Company’s consolidated financial statements and liquidity. F-17MetLife, Inc. MetLife, Inc. Notes to Consolidated Financial Statements — (Continued)
  • 114.
    The Subsidiaries alsosponsor defined contribution savings and investment plans (“SIP”) for substantially all employees under which a portion of employee contributions are matched. Applicable matching contributions are made each payroll period. Accordingly, the Company recognizes compensation cost for current matching contributions. As all contributions are transferred currently as earned to the SIP trust, no liability for matching contributions is recognized in the consolidated balance sheets. Stock-Based Compensation Stock-based compensation grants prior to January 1, 2003 were accounted for using the intrinsic value method prescribed by Accounting Principles Board (“APB”) Opinion No. 25, Accounting for Stock Issued to Employees (“APB 25”), and related interpretations. Compensation expense, if any, was recorded based upon the excess of the quoted market price at grant date over the amount the employee was required to pay to acquire the stock. Under the provisions of APB 25, there was no compensation expense resulting from the issuance of stock options as the exercise price was equivalent to the fair market value at the date of grant. Compensation expense was recognized under the Long-Term Performance Compensation Plan (“LTPCP”), as described more fully in Note 18. Stock-based awards granted after December 31, 2002 but prior to January 1, 2006 were accounted for on a prospective basis using the fair value accounting method prescribed by SFAS No. 123, Accounting for Stock-Based Compensation (“SFAS 123”), as amended by SFAS No. 148, Accounting for Stock-Based Compensation — Transition and Disclosure (“SFAS 148”). The fair value method of SFAS 123 required compensation expense to be measured based on the fair value of the equity instrument at the grant or award date. Stock-based compensation was accrued over the vesting period of the grant or award, including grants or awards to retirement-eligible employees. As required by SFAS 148, the Company discloses the pro forma impact as if the stock options granted prior to January 1, 2003 had been accounted for using the fair value provisions of SFAS 123 rather than the intrinsic value method prescribed by APB 25. See Note 18. Effective January 1, 2006, the Company adopted, using the modified prospective transition method, SFAS No. 123 (revised 2004), Share-Based Payment (“SFAS 123(r)”), which replaces SFAS 123 and supersedes APB 25. The adoption of SFAS 123(r) did not have a significant impact on the Company’s financial position or results of operations. SFAS 123(r) requires that the cost of all stock-based transactions be measured at fair value and recognized over the period during which a grantee is required to provide goods or services in exchange for the award. Although the terms of the Company’s stock-based plans do not accelerate vesting upon retirement, or the attainment of retirement eligibility, the requisite service period subsequent to attaining such eligibility is considered nonsubstantive. Accordingly, the Company recognizes compensation expense related to stock-based awards over the shorter of the requisite service period or the period to attainment of retirement eligibility. SFAS 123(r) also requires an estimation of future forfeitures of stock-based awards to be incorporated into the determination of compensation expense when recognizing expense over the requisite service period. Foreign Currency Balance sheet accounts of foreign operations are translated at the exchange rates in effect at each year-end and income and expense accounts are translated at the average rates of exchange prevailing during the year. The local currencies of foreign operations generally are the functional currencies unless the local economy is highly inflationary. Translation adjustments are charged or credited directly to other comprehensive income or loss. Gains and losses from foreign currency transactions are reported as net investment gains (losses) in the period in which they occur. Discontinued Operations The results of operations of a component of the Company that either has been disposed of or is classified as held-for-sale are reported in discontinued operations if the operations and cash flows of the component have been or will be eliminated from the ongoing operations of the Company as a result of the disposal transaction and the Company will not have any significant continuing involvement in the operations of the component after the disposal transaction. Earnings Per Common Share Basic earnings per common share are computed based on the weighted average number of common shares outstanding during the period. The difference between the number of shares assumed issued and number of shares assumed purchased represents the dilutive shares. Diluted earnings per common share include the dilutive effect of the assumed: (i) exercise or issuance of stock-based awards using the treasury stock method; (ii) settlement of stock purchase contracts underlying common equity units using the treasury stock method; and (iii) settlement of accelerated common stock repurchase contract. Under the treasury stock method, exercise or issuance of stock-based awards and settlement of the stock purchase contracts underlying common equity units is assumed to occur with the proceeds used to purchase common stock at the average market price for the period. See Notes 13, 18 and 20. Litigation Contingencies The Company is a party to a number of legal actions and is involved in a number of regulatory investigations. Given the inherent unpredictability of these matters, it is difficult to estimate the impact on the Company’s financial position. Liabilities are established when it is probable that a loss has been incurred and the amount of the loss can be reasonably estimated. On a quarterly and annual basis, the Company reviews relevant information with respect to liabilities for litigation, regulatory investigations and litigation-related contingencies to be reflected in the Company’s consolidated financial statements. It is possible that an adverse outcome in certain of the Company’s litigation and regulatory investigations, or the use of different assumptions in the determination of amounts recorded could have a material effect upon the Company’s consolidated net income or cash flows in particular quarterly or annual periods. F-18 MetLife, Inc. MetLife, Inc. Notes to Consolidated Financial Statements — (Continued)
  • 115.
    Adoption of NewAccounting Pronouncements Income Taxes Effective January 1, 2007, the Company adopted FIN 48. FIN 48 clarifies the accounting for uncertainty in income tax recognized in a company’s financial statements. FIN 48 requires companies to determine whether it is “more likely than not” that a tax position will be sustained upon examination by the appropriate taxing authorities before any part of the benefit can be recorded in the financial statements. It also provides guidance on the recognition, measurement, and classification of income tax uncertainties, along with any related interest and penalties. Previously recorded income tax benefits that no longer meet this standard are required to be charged to earnings in the period that such determination is made. As a result of the implementation of FIN 48, the Company recognized a $52 million increase in the liability for unrecognized tax benefits, a $4 million decrease in the interest liability for unrecognized tax benefits, and a corresponding reduction to the January 1, 2007 balance of retained earnings of $37 million, net of $11 million of minority interest. See also Note 15. Insurance Contracts Effective January 1, 2007, the Company adopted SOP 05-1 which provides guidance on accounting by insurance enterprises for DAC on internal replacements of insurance and investment contracts other than those specifically described in SFAS 97, Accounting and Reporting by Insurance Enterprises for Certain Long-Duration Contracts and for Realized Gains and Losses from the Sale of Investments. SOP 05-1 defines an internal replacement and is effective for internal replacements occurring in fiscal years beginning after December 15, 2006. In addition, in February 2007, the American Institute of Certified Public Accountants (“AICPA”) issued related Technical Practice Aids (“TPAs”) to provide further clarification of SOP 05-1. The TPAs became effective concurrently with the adoption of SOP 05-1. As a result of the adoption of SOP 05-1 and the related TPAs, if an internal replacement modification substantially changes a contract, then the DAC is written off immediately through income and any new deferrable costs associated with the new replacement are deferred. If a contract modification does not substantially change the contract, the DAC amortization on the original contract will continue and any acquisition costs associated with the related modification are immediately expensed. The adoption of SOP 05-1 and the related TPAs resulted in a reduction to DAC and VOBA on January 1, 2007 and an acceleration of the amortization period relating primarily to the Company’s group life and health insurance contracts that contain certain rate reset provisions. Prior to the adoption of SOP 05-1, DAC on such contracts was amortized over the expected renewable life of the contract. Upon adoption of SOP 05-1, DAC on such contracts is to be amortized over the rate reset period. The impact as of January 1, 2007 was a cumulative effect adjustment of $292 million, net of income tax of $161 million, which was recorded as a reduction to retained earnings. Defined Benefit and Other Postretirement Plans Effective December 31, 2006, the Company adopted SFAS 158. The pronouncement revises financial reporting standards for defined benefit pension and other postretirement plans by requiring the: (i) recognition in the statement of financial position of the funded status of defined benefit plans measured as the difference between the fair value of plan assets and the benefit obligation, which is the projected benefit obligation for pension plans and the accumulated postretirement benefit obligation for other postretirement plans; (ii) recognition as an adjustment to accumulated other comprehensive income (loss), net of income tax, those amounts of actuarial gains and losses, prior service costs and credits, and net asset or obligation at transition that have not yet been included in net periodic benefit costs as of the end of the year of adoption; (iii) recognition of subsequent changes in funded status as a component of other comprehensive income; (iv) measurement of benefit plan assets and obligations as of the date of the statement of financial position; and (v) disclosure of additional information about the effects on the employer’s statement of financial position. The adoption of SFAS 158 resulted in a reduction of $744 million, net of income tax, to accumulated other comprehensive income, which is included as a component of total consolidated stockholders’ equity. As the Company’s measurement date for its pension and other postretirement benefit plans is already December 31 there was no impact of adoption due to changes in measurement date. See also “Summary of Significant Accounting Policies and Critical Accounting Estimates” and Note 17. Stock Compensation Plans As described previously, effective January 1, 2006, the Company adopted SFAS 123(r) including supplemental application guidance issued by the U.S. Securities and Exchange Commission (“SEC”) in Staff Accounting Bulletin (“SAB”) No. 107, Share-Based Payment (“SAB 107”) — using the modified prospective transition method. In accordance with the modified prospective transition method, results for prior periods have not been restated. SFAS 123(r) requires that the cost of all stock-based transactions be measured at fair value and recognized over the period during which a grantee is required to provide goods or services in exchange for the award. The Company had previously adopted the fair value method of accounting for stock-based awards as prescribed by SFAS 123 on a prospective basis effective January 1, 2003, and prior to January 1, 2003, accounted for its stock-based awards to employees under the intrinsic value method prescribed by APB 25. The Company did not modify the substantive terms of any existing awards prior to adoption of SFAS 123(r). Under the modified prospective transition method, compensation expense recognized during the year ended December 31, 2006 includes: (a) compensation expense for all stock-based awards granted prior to, but not yet vested as of January 1, 2006, based on the grant date fair value estimated in accordance with the original provisions of SFAS 123, and (b) compensation expense for all stock-based awards granted beginning January 1, 2006, based on the grant date fair value estimated in accordance with the provisions of SFAS 123(r). The adoption of SFAS 123(r) did not have a significant impact on the Company’s financial position or results of operations as all stock- based awards accounted for under the intrinsic value method prescribed by APB 25 had vested prior to the adoption date and the Company had adopted the fair value recognition provisions of SFAS 123 on January 1, 2003. As required by SFAS 148, and carried F-19MetLife, Inc. MetLife, Inc. Notes to Consolidated Financial Statements — (Continued)
  • 116.
    forward in theprovisions of SFAS 123(r), the Company discloses the pro forma impact as if stock-based awards accounted for under APB 25 had been accounted for under the fair value method in Note 18. SFAS 123 allowed forfeitures of stock-based awards to be recognized as a reduction of compensation expense in the period in which the forfeiture occurred. Upon adoption of SFAS 123(r), the Company changed its policy and now incorporates an estimate of future forfeitures into the determination of compensation expense when recognizing expense over the requisite service period. The impact of this change in accounting policy was not significant to the Company’s financial position or results of operations as of the date of adoption. Additionally, for awards granted after adoption, the Company changed its policy from recognizing expense for stock-based awards over the requisite service period to recognizing such expense over the shorter of the requisite service period or the period to attainment of retirement-eligibility. The pro forma impact of this change in expense recognition policy for stock-based compensation is detailed in Note 18. Prior to the adoption of SFAS 123(r), the Company presented tax benefits of deductions resulting from the exercise of stock options within operating cash flows in the consolidated statements of cash flows. SFAS 123(r) requires tax benefits resulting from tax deductions in excess of the compensation cost recognized for those options be classified and reported as a financing cash inflow upon adoption of SFAS 123(r). Derivative Financial Instruments The Company has adopted guidance relating to derivative financial instruments as follows: k Effective January 1, 2006, the Company adopted prospectively SFAS No. 155, Accounting for Certain Hybrid Instruments (“SFAS 155”). SFAS 155 amends SFAS 133 and SFAS No. 140, Accounting for Transfers and Servicing of Financial Assets and Extinguishments of Liabilities (“SFAS 140”). SFAS 155 allows financial instruments that have embedded derivatives to be accounted for as a whole, eliminating the need to bifurcate the derivative from its host, if the holder elects to account for the whole instrument on a fair value basis. In addition, among other changes, SFAS 155: (i) clarifies which interest-only strips and principal-only strips are not subject to the requirements of SFAS 133; (ii) establishes a requirement to evaluate interests in securitized financial assets to identify interests that are freestanding derivatives or that are hybrid financial instruments that contain an embedded derivative requiring bifurcation; (iii) clarifies that concentrations of credit risk in the form of subordination are not embedded derivatives; and (iv) amends SFAS 140 to eliminate the prohibition on a qualifying special-purpose entity (“QSPE”) from holding a derivative financial instrument that pertains to a beneficial interest other than another derivative financial interest. The adoption of SFAS 155 did not have a material impact on the Company’s consolidated financial statements. k Effective October 1, 2006, the Company adopted SFAS 133 Implementation Issue No. B40, Embedded Derivatives: Application of Paragraph 13(b) to Securitized Interests in Prepayable Financial Assets (“Issue B40”). Issue B40 clarifies that a securitized interest in prepayable financial assets is not subject to the conditions in paragraph 13(b) of SFAS 133, if it meets both of the following criteria: (i) the right to accelerate the settlement if the securitized interest cannot be controlled by the investor; and (ii) the securitized interest itself does not contain an embedded derivative (including an interest rate-related derivative) for which bifurcation would be required other than an embedded derivative that results solely from the embedded call options in the underlying financial assets. The adoption of Issue B40 did not have a material impact on the Company’s consolidated financial statements. k Effective January 1, 2006, the Company adopted prospectively SFAS 133 Implementation Issue No. B38, Embedded Derivatives: Evaluation of Net Settlement with Respect to the Settlement of a Debt Instrument through Exercise of an Embedded Put Option or Call Option (“Issue B38”) and SFAS 133 Implementation Issue No. B39, Embedded Derivatives: Application of Paragraph 13(b) to Call Options That Are Exercisable Only by the Debtor (“Issue B39”). Issue B38 clarifies that the potential settlement of a debtor’s obligation to a creditor occurring upon exercise of a put or call option meets the net settlement criteria of SFAS 133. Issue B39 clarifies that an embedded call option, in which the underlying is an interest rate or interest rate index, that can accelerate the settlement of a debt host financial instrument should not be bifurcated and fair valued if the right to accelerate the settlement can be exercised only by the debtor (issuer/borrower) and the investor will recover substantially all of its initial net investment. The adoption of Issues B38 and B39 did not have a material impact on the Company’s consolidated financial statements. Other Effective January 1, 2007, the Company adopted FASB Staff Position (“FSP”) Emerging Issues Task Force (“EITF”) 00-19-2, Accounting for Registration Payment Arrangements (“FSP EITF 00-19-2”). FSP EITF 00-19-2 specifies that the contingent obligation to make future payments or otherwise transfer consideration under a registration payment arrangement should be separately recognized and measured in accordance with SFAS No. 5, Accounting for Contingencies. The adoption of FSP EITF 00-19-2 did not have an impact on the Company’s consolidated financial statements. Effective January 1, 2007, the Company adopted FSP No. FAS 13-2, Accounting for a Change or Projected Change in the Timing of Cash Flows Relating to Income Taxes Generated by a Leveraged Lease Transaction (“FSP 13-2”). FSP 13-2 amends SFAS No. 13, Accounting for Leases, to require that a lessor review the projected timing of income tax cash flows generated by a leveraged lease annually or more frequently if events or circumstances indicate that a change in timing has occurred or is projected to occur. In addition, FSP 13-2 requires that the change in the net investment balance resulting from the recalculation be recognized as a gain or loss from continuing operations in the same line item in which leveraged lease income is recognized in the year in which the assumption is changed. The adoption of FSP 13-2 did not have a material impact on the Company’s consolidated financial statements. Effective January 1, 2007, the Company adopted SFAS No. 156, Accounting for Servicing of Financial Assets — an amendment of FASB Statement No. 140 (“SFAS 156”). Among other requirements, SFAS 156 requires an entity to recognize a servicing asset or servicing liability each time it undertakes an obligation to service a financial asset by entering into a servicing contract in certain situations. The adoption of SFAS 156 did not have an impact on the Company’s consolidated financial statements. F-20 MetLife, Inc. MetLife, Inc. Notes to Consolidated Financial Statements — (Continued)
  • 117.
    Effective November 15,2006, the Company adopted SAB No. 108, Considering the Effects of Prior Year Misstatements when Quantifying Misstatements in Current Year Financial Statements (“SAB 108”). SAB 108 provides guidance on how prior year misstatements should be considered when quantifying misstatements in current year financial statements for purposes of assessing materiality. SAB 108 requires that registrants quantify errors using both a balance sheet and income statement approach and evaluate whether either approach results in quantifying a misstatement that, when relevant quantitative and qualitative factors are considered, is material. SAB 108 permits companies to initially apply its provisions by either restating prior financial statements or recording a cumulative effect adjustment to the carrying values of assets and liabilities as of January 1, 2006 with an offsetting adjustment to retained earnings for errors that were previously deemed immaterial but are material under the guidance in SAB 108. The adoption of SAB 108 did not have a material impact on the Company’s consolidated financial statements. Effective January 1, 2006, the Company adopted prospectively EITF Issue No. 05-7, Accounting for Modifications to Conversion Options Embedded in Debt Instruments and Related Issues (“EITF 05-7”). EITF 05-7 provides guidance on whether a modification of conversion options embedded in debt results in an extinguishment of that debt. In certain situations, companies may change the terms of an embedded conversion option as part of a debt modification. The EITF concluded that the change in the fair value of an embedded conversion option upon modification should be included in the analysis of EITF Issue No. 96-19, Debtor’s Accounting for a Modification or Exchange of Debt Instruments, to determine whether a modification or extinguishment has occurred and that a change in the fair value of a conversion option should be recognized upon the modification as a discount (or premium) associated with the debt, and an increase (or decrease) in additional paid-in capital. The adoption of EITF 05-7 did not have a material impact on the Company’s consolidated financial statements. Effective January 1, 2006, the Company adopted EITF Issue No. 05-8, Income Tax Consequences of Issuing Convertible Debt with a Beneficial Conversion Feature (“EITF 05-8”). EITF 05-8 concludes that: (i) the issuance of convertible debt with a beneficial conversion feature results in a basis difference that should be accounted for as a temporary difference; and (ii) the establishment of the deferred tax liability for the basis difference should result in an adjustment to additional paid-in capital. EITF 05-8 was applied retrospectively for all instruments with a beneficial conversion feature accounted for in accordance with EITF Issue No. 98-5, Accounting for Convertible Securities with Beneficial Conversion Features or Contingently Adjustable Conversion Ratios, and EITF Issue No. 00-27, Application of Issue No. 98-5 to Certain Convertible Instruments. The adoption of EITF 05-8 did not have a material impact on the Company’s consolidated financial statements. Effective January 1, 2006, the Company adopted SFAS No. 154, Accounting Changes and Error Corrections, a replacement of APB Opinion No. 20 and FASB Statement No. 3 (“SFAS 154”). SFAS 154 requires retrospective application to prior periods’ financial statements for a voluntary change in accounting principle unless it is deemed impracticable. It also requires that a change in the method of depreciation, amortization, or depletion for long-lived, non-financial assets be accounted for as a change in accounting estimate rather than a change in accounting principle. The adoption of SFAS 154 did not have a material impact on the Company’s consolidated financial statements. In June 2005, the EITF reached consensus on Issue No. 04-5, Determining Whether a General Partner, or the General Partners as a Group, Controls a Limited Partnership or Similar Entity When the Limited Partners Have Certain Rights (“EITF 04-5”). EITF 04-5 provides a framework for determining whether a general partner controls and should consolidate a limited partnership or a similar entity in light of certain rights held by the limited partners. The consensus also provides additional guidance on substantive rights. EITF 04-5 was effective after June 29, 2005 for all newly formed partnerships and for any pre-existing limited partnerships that modified their partnership agreements after that date. For all other limited partnerships, EITF 04-5 required adoption by January 1, 2006 through a cumulative effect of a change in accounting principle recorded in opening equity or applied retrospectively by adjusting prior period financial statements. The adoption of the provisions of EITF 04-5 did not have a material impact on the Company’s consolidated financial statements. Effective November 9, 2005, the Company prospectively adopted the guidance in FSP No. FAS 140-2, Clarification of the Application of Paragraphs 40(b) and 40(c) of FAS 140 (“FSP 140-2”). FSP 140-2 clarified certain criteria relating to derivatives and beneficial interests when considering whether an entity qualifies as a QSPE. Under FSP 140-2, the criteria must only be met at the date the QSPE issues beneficial interests or when a derivative financial instrument needs to be replaced upon the occurrence of a specified event outside the control of the transferor. The adoption of FSP 140-2 did not have a material impact on the Company’s consolidated financial statements. Effective July 1, 2005, the Company adopted SFAS No. 153, Exchanges of Nonmonetary Assets, an amendment of APB Opinion No. 29 (“SFAS 153”). SFAS 153 amended prior guidance to eliminate the exception for nonmonetary exchanges of similar productive assets and replaced it with a general exception for exchanges of nonmonetary assets that do not have commercial substance. A nonmonetary exchange has commercial substance if the future cash flows of the entity are expected to change significantly as a result of the exchange. The provisions of SFAS 153 were required to be applied prospectively for fiscal periods beginning after June 15, 2005. The adoption of SFAS 153 did not have a material impact on the Company’s consolidated financial statements. Effective July 1, 2005, the Company adopted EITF Issue No. 05-6, Determining the Amortization Period for Leasehold Improvements (“EITF 05-6”). EITF 05-6 provides guidance on determining the amortization period for leasehold improvements acquired in a business combination or acquired subsequent to lease inception. As required by EITF 05-6, the Company adopted this guidance on a prospective basis which had no material impact on the Company’s consolidated financial statements. In June 2005, the FASB completed its review of EITF Issue No. 03-1, The Meaning of Other-Than-Temporary Impairment and Its Application to Certain Investments (“EITF 03-1”). EITF 03-1 provides accounting guidance regarding the determination of when an impairment of debt and marketable equity securities and investments accounted for under the cost method should be considered other-than-temporary and recognized in income. EITF 03-1 also requires certain quantitative and qualitative disclosures for debt and marketable equity securities classified as available-for-sale or held-to-maturity under SFAS No. 115, Accounting for Certain Investments in Debt and Equity Securities, that are impaired at the balance sheet date but for which an other-than-temporary impairment has not been recognized. The FASB decided not to provide additional guidance on the meaning of other-than-temporary impairment but has issued FSP F-21MetLife, Inc. MetLife, Inc. Notes to Consolidated Financial Statements — (Continued)
  • 118.
    Nos. FAS 115-1and FAS 124-1, The Meaning of Other-Than-Temporary Impairment and its Application to Certain Investments (“FSP 115-1”), which nullifies the accounting guidance on the determination of whether an investment is other-than-temporarily impaired as set forth in EITF 03-1. As required by FSP 115-1, the Company adopted this guidance on a prospective basis, which had no material impact on the Company’s consolidated financial statements, and has provided the required disclosures. In December 2004, the FASB issued FSP No. FAS 109-2, Accounting and Disclosure Guidance for the Foreign Earnings Repatriation Provision within the American Jobs Creation Act of 2004 (“FSP 109-2”). The American Jobs Creation Act of 2004 (“AJCA”) introduced a one-time dividend received deduction on the repatriation of certain earnings to a U.S. taxpayer. FSP 109-2 provides companies additional time beyond the financial reporting period of enactment to evaluate the effects of the AJCA on their plans to repatriate foreign earnings for purposes of applying SFAS No. 109, Accounting for Income Taxes. During 2005, the Company recorded a $27 million income tax benefit related to the repatriation of foreign earnings pursuant to Internal Revenue Code Section 965 for which a U.S. deferred income tax provision had previously been recorded. As of January 1, 2006, the repatriation provision of the AJCA no longer applies to the Company. Future Adoption of New Accounting Pronouncements Fair Value In September 2006, the FASB issued SFAS No. 157, Fair Value Measurements (“SFAS 157”). SFAS 157 defines fair value, establishes a framework for measuring fair value and requires enhanced disclosures about fair value measurements. Effective January 1, 2008, the Company adopted SFAS 157 and applied the provisions of the statement prospectively to assets and liabilities measured and disclosed at fair value. In addition to new disclosure requirements, the adoption of SFAS 157 changes the valuation of certain freestanding derivatives by moving from a mid to bid pricing convention as well as changing the valuation of embedded derivatives associated with annuity contracts. The change in valuation of embedded derivatives associated with annuity contracts results from the incorporation of risk margins and the Company’s own credit standing in their valuation. While the Company does not expect such changes in valuation to have a material impact on the Company’s financial statements at January 1, 2008, the addition of risk margins and the Company’s own credit spread in the valuation of embedded derivatives associated with annuity contracts may result in significant volatility in the Company’s consolidated net income. In February 2007, the FASB issued SFAS No. 159, The Fair Value Option for Financial Assets and Financial Liabilities (“SFAS 159”). SFAS 159 permits entities the option to measure most financial instruments and certain other items at fair value at specified election dates and to report related unrealized gains and losses in earnings. The fair value option is generally applied on an instrument-by-instrument basis and is generally an irrevocable election. Effective January 1, 2008, the Company has elected the fair value option on fixed maturity securities backing certain pension products sold in Brazil. Previously, these fixed maturity securities were accounted for as availa- ble-for-sale securities in accordance with FAS 115. The Company’s insurance joint venture in Japan also elected the fair value option for its single premium deferred annuities and supporting assets. These elections are not expected to have a material impact on the Company’s retained earnings or equity as of January 1, 2008. In June 2007, the AICPA issued SOP 07-1, Clarification of the Scope of the Audit and Accounting Guide Investment Companies and Accounting by Parent Companies and Equity Method Investors for Investments in Investment Companies (“SOP 07-1”) . Upon adoption of SOP 07-1, the Company must also adopt the provisions of FASB Staff Position No. FSP FIN 46(r)-7, Application of FASB Interpretation No. 46 to Investment Companies (“FSP FIN 46(r)-7”), which permanently exempts investment companies from applying the provisions of FIN No. 46(r), Consolidation of Variable Interest Entities — An Interpretation of Accounting Research Bulletin No. 51, and its December 2003 revision (“FIN 46(r)”) to investments carried at fair value. SOP 07-1 provides guidance for determining whether an entity falls within the scope of the AICPA Audit and Accounting Guide Investment Companies and whether investment company accounting should be retained by a parent company upon consolidation of an investment company subsidiary or by an equity method investor in an investment company. In certain circumstances, SOP 07-1 precludes retention of specialized accounting for investment companies (i.e., fair value accounting), when similar direct investments exist in the consolidated group and are measured on a basis inconsistent with that applied to investment companies. Additionally, SOP 07-1 precludes retention of specialized accounting for investment companies if the reporting entity does not distinguish through documented policies the nature and type of investments to be held in the investment companies from those made in the consolidated group where other accounting guidance is being applied. In February 2008, the FASB issued FSP No. SOP 7-1-1, Effective Date of AICPA Statement of Position 07-1, which delays indefinitely the effective date of SOP 07-1. The Company is closely monitoring further FASB developments. In May 2007, the FASB issued FSP No. FIN 39-1, Amendment of FASB Interpretation No. 39 (“FSP 39-1”). FSP 39-1 amends FIN No. 39, Offsetting of Amounts Related to Certain Contracts (“FIN 39”), to permit a reporting entity to offset fair value amounts recognized for the right to reclaim cash collateral (a receivable) or the obligation to return cash collateral (a payable) against fair value amounts recognized for derivative instruments executed with the same counterparty under the same master netting arrangement that have been offset in accordance with FIN 39. FSP 39-1 also amends FIN 39 for certain terminology modifications. FSP 39-1 applies to fiscal years beginning after November 15, 2007. FSP 39-1 will be applied retrospectively, unless it is impracticable to do so. Upon adoption of FSP 39-1, the Company is permitted to change its accounting policy to offset or not offset fair value amounts recognized for derivative instruments under master netting arrangements. The adoption of FSP 39-1 will not have an impact on the Company’s financial statements. Business Combinations In December 2007, the FASB issued SFAS No. 141 (revised 2007), Business Combinations — A Replacement of FASB Statement No. 141 (“SFAS 141(r)”) and SFAS No. 160, Noncontrolling Interests in Consolidated Financial Statements — An Amendment of ARB No. 51 (“SFAS 160”) which are effective for fiscal years beginning after December 15, 2008. Under SFAS 141(r) and SFAS 160: • All business combinations (whether full, partial, or “step” acquisitions) result in all assets and liabilities of an acquired business being recorded at fair value, with limited exceptions. F-22 MetLife, Inc. MetLife, Inc. Notes to Consolidated Financial Statements — (Continued)
  • 119.
    • Acquisition costsare generally expensed as incurred; restructuring costs associated with a business combination are generally expensed as incurred subsequent to the acquisition date. • The fair value of the purchase price, including the issuance of equity securities, is determined on the acquisition date. • Certain acquired contingent liabilities are recorded at fair value at the acquisition date and subsequently measured at either the higher of such amount or the amount determined under existing guidance for non-acquired contingencies. • Changes in deferred tax asset valuation allowances and income tax uncertainties after the acquisition date generally affect income tax expense. • Noncontrolling interests (formerly known as “minority interests”) are valued at fair value at the acquisition date and are presented as equity rather than liabilities. • When control is attained on previously noncontrolling interests, the previously held equity interests are remeasured at fair value and a gain or loss is recognized. • Purchases or sales of equity interests that do not result in a change in control are accounted for as equity transactions. • When control is lost in a partial disposition, realized gains or losses are recorded on equity ownership sold and the remaining ownership interest is remeasured and holding gains or losses are recognized. The pronouncements are effective for fiscal years beginning on or after December 15, 2008 and apply prospectively to business combinations. Presentation and disclosure requirements related to noncontrolling interests must be retrospectively applied. The Company is currently evaluating the impact of SFAS 141(r) on its accounting for future acquisitions and the impact of SFAS 160 on its consolidated financial statements. Other In February 2008, the FASB issued FSP No. FAS 140-3, Accounting for Transfers of Financial Assets and Repurchase Financing Transactions (“FSP 140-3”). FSP 140-3 provides guidance for evaluating whether to account for a transfer of a financial asset and repurchase financing as a single transaction or as two separate transactions. FSP 140-3 is effective prospectively for financial statements issued for fiscal years beginning after November 15, 2008. The Company is currently evaluating the impact of FSP FAS 140-3 on its consolidated financial statements. In January 2008, the FASB cleared SFAS 133 Implementation Issue E23, Clarification of the Application of the Shortcut Method (“Issue E23”). Issue E23 amends SFAS 133 by permitting interest rate swaps to have a non-zero fair value at inception, as long as the difference between the transaction price (zero) and the fair value (exit price), as defined by SFAS 157, is solely attributable to a bid-ask spread. In addition, entities would not be precluded from assuming no ineffectiveness in a hedging relationship of interest rate risk involving an interest bearing asset or liability in situations where the hedged item is not recognized for accounting purposes until settlement date as long as the period between trade date and settlement date of the hedged item is consistent with generally established conventions in the marketplace. Issue E23 is effective for hedging relationships designated on or after January 1, 2008. The Company does not expect the adoption of Issue E23 to have a material impact on its consolidated financial statements. In December 2007, the FASB ratified as final the consensus on EITF Issue No. 07-6, Accounting for the Sale of Real Estate When the Agreement Includes a Buy-Sell Clause (“EITF 07-6”). EITF 07-6 addresses whether the existence of a buy-sell arrangement would preclude partial sales treatment when real estate is sold to a jointly owned entity. The consensus concludes that the existence of a buy-sell clause does not necessarily preclude partial sale treatment under current guidance. EITF 07-6 applies prospectively to new arrangements entered into and assessments on existing transactions performed in fiscal years beginning after December 15, 2008. The Company does not expect the adoption of EITF 07-6 to have a material impact on its consolidated financial statements. In November 2007, the SEC issued SAB No. 109, Written Loan Commitments Recorded at Fair Value through Earnings (“SAB 109”), which amends SAB No. 105, Application of Accounting Principles to Loan Commitments. SAB 109 provides guidance on (i) incorporating expected net future cash flows when related to the associated servicing of a loan when measuring fair value; and (ii) broadening the SEC staff’s view that internally-developed intangible assets should not be recorded as part of the fair value of a derivative loan commitment or to written loan commitments that are accounted for at fair value through earnings. Internally-developed intangible assets are not considered a component of the related instruments. SAB 109 is effective for derivative loan commitments issued or modified in fiscal quarters beginning after December 15, 2007. The adoption of SAB 109 will not have an impact on the Company’s consolidated financial statements. 2. Acquisitions and Dispositions Travelers On July 1, 2005, the Company completed the acquisition of Travelers for $12.1 billion. The results of Travelers’ operations were included in the Company’s financial statements beginning July 1, 2005. As a result of the acquisition, management of the Company increased significantly the size and scale of the Company’s core insurance and annuity products and expanded the Company’s presence in both the retirement & savings’ domestic and international markets. The distribution agreements executed with Citigroup as part of the acquisition provide the Company with one of the broadest distribution networks in the industry. The initial consideration paid in 2005 by the Company for the acquisition consisted of $10.9 billion in cash and 22,436,617 shares of the Company’s common stock with a market value of $1.0 billion to Citigroup and $100 million in other transaction costs. The Company revised the purchase price as a result of the finalization by both parties of their review of the June 30, 2005 financial statements and final resolution as to the interpretation of the provisions of the acquisition agreement which resulted in a payment of additional consideration of $115 million by the Company to Citigroup in 2006. In addition to cash on-hand, the purchase price was financed through the issuance of common stock as described previously, debt securities as described in Note 10, common equity units as described in Note 13 and preferred stock as described in Note 18. The acquisition was accounted for using the purchase method of accounting, which requires that the assets and liabilities of Travelers be measured at their fair values. The net fair value of assets acquired and liabilities assumed totaled $7.8 billion, resulting in goodwill of F-23MetLife, Inc. MetLife, Inc. Notes to Consolidated Financial Statements — (Continued)
  • 120.
    $4.3 billion, ofwhich $1.6 billion is deductible for income tax purposes. Further information on goodwill is described in Note 6. See Note 5 for the VOBA acquired as part of the acquisition and Note 7 for the value of distribution agreements (“VODA”) and the value of customer relationships acquired (“VOCRA”). As part of the integration of Travelers’ operations, management approved and initiated plans to reduce approximately 1,000 domestic and international Travelers positions, which was completed in December 2006. MetLife initially recorded restructuring costs, including severance, relocation and outplacement services of Travelers’ employees, as liabilities assumed in the purchase business combination of $49 million. For the years ended December 31, 2006 and 2005, the liability for restructuring costs was reduced by $4 million and $1 million, respectively, due to a reduction in the estimate of severance benefits to be paid to Travelers employees. The restructuring costs associated with the Travelers acquisition were as follows: 2006 2005 Years Ended December 31, (In millions) Balance at January 1, . . . . . . . . . . . . . . . . . . . . . . . . . . . . . . . . . . . . . . . . . . . . . . . . . . . $ 28 $ — Acquisition . . . . . . . . . . . . . . . . . . . . . . . . . . . . . . . . . . . . . . . . . . . . . . . . . . . . . . . . . . — 49 Cash payments . . . . . . . . . . . . . . . . . . . . . . . . . . . . . . . . . . . . . . . . . . . . . . . . . . . . . . . (24) (20) Other reductions . . . . . . . . . . . . . . . . . . . . . . . . . . . . . . . . . . . . . . . . . . . . . . . . . . . . . . (4) (1) Balance at December 31, . . . . . . . . . . . . . . . . . . . . . . . . . . . . . . . . . . . . . . . . . . . . . . . . $ — $ 28 Other Acquisitions and Dispositions On June 28, 2007, the Company acquired the remaining 50% interest in a joint venture in Hong Kong, MetLife Fubon Limited (“MetLife Fubon”), for $56 million in cash, resulting in MetLife Fubon becoming a consolidated subsidiary of the Company. The transaction was treated as a step acquisition, and at June 30, 2007, total assets and liabilities of MetLife Fubon of $839 million and $735 million, respectively, were included in the Company’s consolidated balance sheet. The Company’s investment for the initial 50% interest in MetLife Fubon was $48 million. The Company used the equity method of accounting for such investment in MetLife Fubon. The Company’s share of the joint venture’s results for the six months ended June 30, 2007, was a loss of $3 million. The fair value of the assets acquired and the liabilities assumed in the step acquisition at June 30, 2007, was $427 million and $371 million, respectively. No additional goodwill was recorded as a part of the step acquisition. As a result of this acquisition, additional VOBA and VODA of $45 million and $5 million, respectively, were recorded and both have a weighted average amortization period of 16 years. Further information on VOBA and VODA is described in Note 5 and Note 7, respectively. On June 1, 2007, the Company completed the sale of its Bermuda insurance subsidiary, MetLife International Insurance, Ltd. (“MLII”), to a third party for $33 million in cash consideration, resulting in a gain upon disposal of $3 million, net of income tax. The net assets of MLII at disposal were $27 million. A liability of $1 million was recorded with respect to a guarantee provided in connection with this disposition. Further information on guarantees is described in Note 16. On September 1, 2005, the Company completed the acquisition of CitiStreet Associates, a division of CitiStreet LLC, which is primarily involved in the distribution of annuity products and retirement plans to the education, healthcare, and not-for-profit markets, for $56 million, of which $2 million was allocated to goodwill and $54 million to other identifiable intangibles, specifically the value of customer relationships acquired, which have a weighted average amortization period of 16 years. CitiStreet Associates was integrated with MetLife Resources, a focused distribution channel of MetLife, which is dedicated to provide retirement plans and financial services to the same markets. Further information on goodwill and VOCRA is described in Note 6 and Note 7, respectively. See Note 23 for information on the disposition of the annuities and pension businesses of MetLife Insurance Limited (“MetLife Australia”), P.T. Sejahtera (“MetLife Indonesia”) and SSRM Holdings, Inc. (“SSRM”). See Note 25 for information on the Company’s acquisitions subsequent to December 31, 2007. F-24 MetLife, Inc. MetLife, Inc. Notes to Consolidated Financial Statements — (Continued)
  • 121.
    3. Investments Fixed Maturityand Equity Securities Available-for-Sale The following tables present the cost or amortized cost, gross unrealized gain and loss, and estimated fair value of the Company’s fixed maturity and equity securities, the percentage that each sector represents by the total fixed maturity securities holdings and by the total equity securities holdings at: Cost or Amortized Cost Gain Loss Estimated Fair Value % of Total Gross Unrealized December 31, 2007 (In millions) U.S. corporate securities . . . . . . . . . . . . . . . . . . . . . . . . . . . . . . . . $ 77,875 $1,725 $2,174 $ 77,426 32.0% Residential mortgage-backed securities . . . . . . . . . . . . . . . . . . . . . . 56,267 611 389 56,489 23.3 Foreign corporate securities . . . . . . . . . . . . . . . . . . . . . . . . . . . . . . 37,359 1,740 794 38,305 15.8 U.S.Treasury/agency securities . . . . . . . . . . . . . . . . . . . . . . . . . . . . 19,771 1,487 13 21,245 8.8 Commercial mortgage-backed securities . . . . . . . . . . . . . . . . . . . . . . 17,676 251 199 17,728 7.3 Foreign government securities . . . . . . . . . . . . . . . . . . . . . . . . . . . . 13,535 1,924 188 15,271 6.3 Asset-backed securities . . . . . . . . . . . . . . . . . . . . . . . . . . . . . . . . 11,549 41 549 11,041 4.6 State and political subdivision securities . . . . . . . . . . . . . . . . . . . . . . 4,394 140 115 4,419 1.8 Other fixed maturity securities . . . . . . . . . . . . . . . . . . . . . . . . . . . . . 335 13 30 318 0.1 Total fixed maturity securities . . . . . . . . . . . . . . . . . . . . . . . . . . . . $238,761 $7,932 $4,451 $242,242 100.0% Common stock . . . . . . . . . . . . . . . . . . . . . . . . . . . . . . . . . . . . . . $ 2,488 $ 568 $ 108 $ 2,948 48.7% Non-redeemable preferred stock . . . . . . . . . . . . . . . . . . . . . . . . . . . 3,403 61 362 3,102 51.3 Total equity securities . . . . . . . . . . . . . . . . . . . . . . . . . . . . . . . . . $ 5,891 $ 629 $ 470 $ 6,050 100.0% Cost or Amortized Cost Gain Loss Estimated Fair Value % of Total Gross Unrealized December 31, 2006 (In millions) U.S. corporate securities . . . . . . . . . . . . . . . . . . . . . . . . . . . . . . . . $ 74,010 $2,047 $ 983 $ 75,074 31.0% Residential mortgage-backed securities . . . . . . . . . . . . . . . . . . . . . . 51,602 385 321 51,666 21.4 Foreign corporate securities . . . . . . . . . . . . . . . . . . . . . . . . . . . . . . 33,029 1,687 378 34,338 14.2 U.S. Treasury/agency securities . . . . . . . . . . . . . . . . . . . . . . . . . . . 29,897 984 248 30,633 12.7 Commercial mortgage-backed securities . . . . . . . . . . . . . . . . . . . . . . 16,467 193 138 16,522 6.8 Foreign government securities . . . . . . . . . . . . . . . . . . . . . . . . . . . . 11,406 1,835 34 13,207 5.4 Asset-backed securities . . . . . . . . . . . . . . . . . . . . . . . . . . . . . . . . 13,851 75 53 13,873 5.7 State and political subdivision securities . . . . . . . . . . . . . . . . . . . . . . 6,121 230 51 6,300 2.6 Other fixed maturity securities . . . . . . . . . . . . . . . . . . . . . . . . . . . . . 385 7 77 315 0.2 Total fixed maturity securities . . . . . . . . . . . . . . . . . . . . . . . . . . . . $236,768 $7,443 $2,283 $241,928 100.0% Common stock . . . . . . . . . . . . . . . . . . . . . . . . . . . . . . . . . . . . . . $ 1,798 $ 487 $ 16 $ 2,269 44.5% Non-redeemable preferred stock . . . . . . . . . . . . . . . . . . . . . . . . . . . 2,751 103 29 2,825 55.5 Total equity securities . . . . . . . . . . . . . . . . . . . . . . . . . . . . . . . . . $ 4,549 $ 590 $ 45 $ 5,094 100.0% The Company held foreign currency derivatives with notional amounts of $9.2 billion and $8.9 billion to hedge the exchange rate risk associated with foreign denominated fixed maturity securities at December 31, 2007 and 2006, respectively. The Company is not exposed to any significant concentrations of credit risk in its equity securities portfolio. The Company is exposed to concentrations of credit risk related to U.S. Treasury securities and obligations of U.S. government corporations and agencies. Addi- tionally, at December 31, 2007 and 2006, the Company had exposure to fixed maturity securities backed by sub-prime mortgages with estimated fair values of $2.2 billion and $3.0 billion, respectively, and unrealized losses of $219 million and $5 million, respectively. These securities are classified within asset-backed securities in the immediately preceding table. At December 31, 2007, 32% have been guaranteed by financial guarantors, of which 55% was guaranteed by financial guarantors who remain Aaa rated in 2008. Overall, at December 31, 2007, $6.7 billion of the estimated fair value of the Company’s fixed maturity securities were credit enhanced by financial guarantors of which $2.5 billion, $2.5 billion and $1.7 billion at December 31, 2007, are included within state and political subdivisions, corporate securities and asset-backed securities, respectively, and 80% were guaranteed by financial guarantors who remain Aaa rated in 2008. The Company held fixed maturity securities at estimated fair values that were below investment grade or not rated by an independent rating agency that totaled $17.7 billion and $17.3 billion at December 31, 2007 and 2006, respectively. These securities had net unrealized gains (losses) of ($108) million and $627 million at December 31, 2007 and 2006, respectively. Non-income producing fixed maturity securities were $13 million and $16 million at December 31, 2007 and 2006, respectively. Net unrealized gains associated with non- income producing fixed maturity securities were $12 million and $4 million at December 31, 2007 and 2006, respectively. F-25MetLife, Inc. MetLife, Inc. Notes to Consolidated Financial Statements — (Continued)
  • 122.
    The amortized costand estimated fair value of fixed maturity securities, by contractual maturity date (excluding scheduled sinking funds), are as follows: Amortized Cost Estimated Fair Value Amortized Cost Estimated Fair Value 2007 2006 December 31, (In millions) Due in one year or less. . . . . . . . . . . . . . . . . . . . . . . . . . . . . . . . . . . . $ 4,537 $ 4,628 $ 6,923 $ 7,011 Due after one year through five years . . . . . . . . . . . . . . . . . . . . . . . . . . 42,453 43,167 45,331 45,928 Due after five years through ten years . . . . . . . . . . . . . . . . . . . . . . . . . . 40,783 41,046 39,571 40,200 Due after ten years . . . . . . . . . . . . . . . . . . . . . . . . . . . . . . . . . . . . . . 65,496 68,143 63,023 66,728 Subtotal . . . . . . . . . . . . . . . . . . . . . . . . . . . . . . . . . . . . . . . . . . . . 153,269 156,984 154,848 159,867 Mortgage-backed and asset-backed securities . . . . . . . . . . . . . . . . . . . . 85,492 85,258 81,920 82,061 Total fixed maturity securities . . . . . . . . . . . . . . . . . . . . . . . . . . . . . . $238,761 $242,242 $236,768 $241,928 Fixed maturity securities not due at a single maturity date have been included in the above table in the year of final contractual maturity. Actual maturities may differ from contractual maturities due to the exercise of prepayment options. Sales or disposals of fixed maturity and equity securities classified as available-for-sale are as follows: 2007 2006 2005 Years Ended December 31, (In millions) Proceeds. . . . . . . . . . . . . . . . . . . . . . . . . . . . . . . . . . . . . . . . . . . . . . . . . . . . . . . $80,685 $89,869 $127,709 Gross investment gains . . . . . . . . . . . . . . . . . . . . . . . . . . . . . . . . . . . . . . . . . . . . . $ 831 $ 580 $ 704 Gross investment losses . . . . . . . . . . . . . . . . . . . . . . . . . . . . . . . . . . . . . . . . . . . . . $ (1,183) $ (1,533) $ (1,391) Unrealized Loss for Fixed Maturity and Equity Securities Available-for-Sale The following tables present the estimated fair value and gross unrealized loss of the Company’s fixed maturity (aggregated by sector) and equity securities in an unrealized loss position, aggregated by length of time that the securities have been in a continuous unrealized loss position at: Estimated Fair Value Gross Unrealized Loss Estimated Fair Value Gross Unrealized Loss Estimated Fair Value Gross Unrealized Loss Less than 12 months Equal to or Greater than 12 months Total December 31, 2007 (In millions, except number of securities) U.S. corporate securities . . . . . . . . . . . . . . . . . . . . . . . . . $29,237 $1,431 $12,119 $ 743 $ 41,356 $2,174 Residential mortgage-backed securities . . . . . . . . . . . . . . . . 14,404 279 6,195 110 20,599 389 Foreign corporate securities . . . . . . . . . . . . . . . . . . . . . . . 11,189 484 6,321 310 17,510 794 U.S. Treasury/agency securities . . . . . . . . . . . . . . . . . . . . . 432 3 625 10 1,057 13 Commercial mortgage-backed securities . . . . . . . . . . . . . . . 2,518 102 3,797 97 6,315 199 Foreign government securities . . . . . . . . . . . . . . . . . . . . . . 3,593 161 515 27 4,108 188 Asset-backed securities . . . . . . . . . . . . . . . . . . . . . . . . . . 7,627 442 1,271 107 8,898 549 State and political subdivision securities . . . . . . . . . . . . . . . 1,334 81 476 34 1,810 115 Other fixed maturity securities . . . . . . . . . . . . . . . . . . . . . . 91 30 1 — 92 30 Total fixed maturity securities . . . . . . . . . . . . . . . . . . . . . $70,425 $3,013 $31,320 $1,438 $101,745 $4,451 Equity securities . . . . . . . . . . . . . . . . . . . . . . . . . . . . . . . $ 2,771 $ 398 $ 543 $ 72 $ 3,314 $ 470 Total number of securities in an unrealized loss position . . . . . 8,395 3,063 F-26 MetLife, Inc. MetLife, Inc. Notes to Consolidated Financial Statements — (Continued)
  • 123.
    Estimated Fair Value Gross Unrealized Loss Estimated Fair Value Gross Unrealized Loss Estimated Fair Value Gross Unrealized Loss Less than 12months Equal to or Greater than 12 months Total December 31, 2006 (In millions, except number of securities) U.S. corporate securities . . . . . . . . . . . . . . . . . . . . . . . . . $17,537 $285 $16,780 $ 698 $ 34,317 $ 983 Residential mortgage-backed securities . . . . . . . . . . . . . . . . 15,300 78 13,640 243 28,940 321 Foreign corporate securities . . . . . . . . . . . . . . . . . . . . . . . 6,401 102 7,277 276 13,678 378 U.S. Treasury/agency securities . . . . . . . . . . . . . . . . . . . . . 15,006 157 1,560 91 16,566 248 Commercial mortgage-backed securities . . . . . . . . . . . . . . . 4,960 30 4,029 108 8,989 138 Foreign government securities . . . . . . . . . . . . . . . . . . . . . . 1,160 18 507 16 1,667 34 Asset-backed securities . . . . . . . . . . . . . . . . . . . . . . . . . . 4,519 31 1,077 22 5,596 53 State and political subdivision securities . . . . . . . . . . . . . . . 334 12 532 39 866 51 Other fixed maturity securities . . . . . . . . . . . . . . . . . . . . . . 146 77 4 — 150 77 Total fixed maturity securities . . . . . . . . . . . . . . . . . . . . . $65,363 $790 $45,406 $1,493 $110,769 $2,283 Equity securities . . . . . . . . . . . . . . . . . . . . . . . . . . . . . . . $ 832 $ 20 $ 567 $ 25 $ 1,399 $ 45 Total number of securities in an unrealized loss position . . . . . 10,529 4,640 Aging of Gross Unrealized Loss for Fixed Maturity and Equity Securities Available-for-Sale The following tables present the cost or amortized cost, gross unrealized loss and number of securities for fixed maturity and equity securities, where the estimated fair value had declined and remained below cost or amortized cost by less than 20%, or 20% or more at: Less than 20% 20% or more Less than 20% 20% or more Less than 20% 20% or more Cost or Amortized Cost Gross Unrealized Loss Number of Securities December 31, 2007 (In millions, except number of securities) Less than six months . . . . . . . . . . . . . . . . . . . . . . . . . . . . $ 49,463 $1,943 $1,670 $555 6,339 644 Six months or greater but less than nine months . . . . . . . . . . 17,353 23 844 7 1,461 31 Nine months or greater but less than twelve months . . . . . . . . 9,410 7 568 2 791 1 Twelve months or greater. . . . . . . . . . . . . . . . . . . . . . . . . . 31,731 50 1,262 13 3,192 32 Total . . . . . . . . . . . . . . . . . . . . . . . . . . . . . . . . . . . . . $107,957 $2,023 $4,344 $577 Less than 20% 20% or more Less than 20% 20% or more Less than 20% 20% or more Cost or Amortized Cost Gross Unrealized Loss Number of Securities December 31, 2006 (In millions, except number of securities) Less than six months . . . . . . . . . . . . . . . . . . . . . . . . . . . . . $ 52,222 $35 $ 547 $12 9,093 81 Six months or greater but less than nine months . . . . . . . . . . . 2,682 3 42 1 415 2 Nine months or greater but less than twelve months . . . . . . . . . 12,049 14 204 4 937 1 Twelve months or greater . . . . . . . . . . . . . . . . . . . . . . . . . . 47,462 29 1,511 7 4,634 6 Total . . . . . . . . . . . . . . . . . . . . . . . . . . . . . . . . . . . . . . $114,415 $81 $2,304 $24 At December 31, 2007 and 2006, $4.3 billion and $2.3 billion, respectively, of unrealized losses related to securities with an unrealized loss position of less than 20% of cost or amortized cost, which represented 4% and 2%, respectively, of the cost or amortized cost of such securities. At December 31, 2007, $577 million of unrealized losses related to securities with an unrealized loss position of 20% or more of cost or amortized cost, which represented 29% of the cost or amortized cost of such securities. Of such unrealized losses of $577 million, $555 million related to securities that were in an unrealized loss position for a period of less than six months. At December 31, 2006, $24 million of unrealized losses related to securities with an unrealized loss position of 20% or more of cost or amortized cost, which represented 30% of the cost or amortized cost of such securities. Of such unrealized losses of $24 million, $12 million related to securities that were in an unrealized loss position for a period of less than six months. The Company held 30 fixed maturity and equity securities, each with a gross unrealized loss at December 31, 2007 of greater than $10 million. These securities represented 9%, or $459 million in the aggregate, of the gross unrealized loss on fixed maturity and equity securities. The Company held eight fixed maturity and equity securities, each with a gross unrealized loss at December 31, 2006 of greater than $10 million. These securities represented 7%, or $169 million in the aggregate, of the gross unrealized loss on fixed maturity and equity securities. F-27MetLife, Inc. MetLife, Inc. Notes to Consolidated Financial Statements — (Continued)
  • 124.
    At December 31,2007 and 2006, the Company had $4.9 billion and $2.3 billion, respectively, of gross unrealized losses related to its fixed maturity and equity securities. These securities are concentrated, calculated as a percentage of gross unrealized loss, as follows: 2007 2006 December 31, Sector: U.S. corporate securities . . . . . . . . . . . . . . . . . . . . . . . . . . . . . . . . . . . . . . . . . . . . . . . . . . . . . . . . . . 44% 42% Foreign corporate securities . . . . . . . . . . . . . . . . . . . . . . . . . . . . . . . . . . . . . . . . . . . . . . . . . . . . . . . . 16 16 Asset-backed securities . . . . . . . . . . . . . . . . . . . . . . . . . . . . . . . . . . . . . . . . . . . . . . . . . . . . . . . . . . 11 2 Residential mortgage-backed securities . . . . . . . . . . . . . . . . . . . . . . . . . . . . . . . . . . . . . . . . . . . . . . . . 8 14 Foreign government securities. . . . . . . . . . . . . . . . . . . . . . . . . . . . . . . . . . . . . . . . . . . . . . . . . . . . . . . 4 1 Commercial mortgage-backed securities . . . . . . . . . . . . . . . . . . . . . . . . . . . . . . . . . . . . . . . . . . . . . . . . 4 6 U.S. Treasury/agency securities . . . . . . . . . . . . . . . . . . . . . . . . . . . . . . . . . . . . . . . . . . . . . . . . . . . . . — 11 Other . . . . . . . . . . . . . . . . . . . . . . . . . . . . . . . . . . . . . . . . . . . . . . . . . . . . . . . . . . . . . . . . . . . . . . . 13 8 Total . . . . . . . . . . . . . . . . . . . . . . . . . . . . . . . . . . . . . . . . . . . . . . . . . . . . . . . . . . . . . . . . . . . . . . 100% 100% Industry: Finance . . . . . . . . . . . . . . . . . . . . . . . . . . . . . . . . . . . . . . . . . . . . . . . . . . . . . . . . . . . . . . . . . . . . . 34% 10% Industrial . . . . . . . . . . . . . . . . . . . . . . . . . . . . . . . . . . . . . . . . . . . . . . . . . . . . . . . . . . . . . . . . . . . . 18 23 Mortgage-backed . . . . . . . . . . . . . . . . . . . . . . . . . . . . . . . . . . . . . . . . . . . . . . . . . . . . . . . . . . . . . . . 12 20 Utility . . . . . . . . . . . . . . . . . . . . . . . . . . . . . . . . . . . . . . . . . . . . . . . . . . . . . . . . . . . . . . . . . . . . . . . 8 11 Government . . . . . . . . . . . . . . . . . . . . . . . . . . . . . . . . . . . . . . . . . . . . . . . . . . . . . . . . . . . . . . . . . . 4 12 Other . . . . . . . . . . . . . . . . . . . . . . . . . . . . . . . . . . . . . . . . . . . . . . . . . . . . . . . . . . . . . . . . . . . . . . . 24 24 Total . . . . . . . . . . . . . . . . . . . . . . . . . . . . . . . . . . . . . . . . . . . . . . . . . . . . . . . . . . . . . . . . . . . . . . 100% 100% As described more fully in Note 1, the Company performs a regular evaluation, on a security-by-security basis, of its investment holdings in accordance with its impairment policy in order to evaluate whether such securities are other-than-temporarily impaired. One of the criteria which the Company considers in its other-than-temporary impairment analysis is its intent and ability to hold securities for a period of time sufficient to allow for the recovery of their value to an amount equal to or greater than cost or amortized cost. The Company’s intent and ability to hold securities considers broad portfolio management objectives such as asset/liability duration management, issuer and industry segment exposures, interest rate views and the overall total return focus. In following these portfolio management objectives, changes in facts and circumstances that were present in past reporting periods may trigger a decision to sell securities that were held in prior reporting periods. Decisions to sell are based on current conditions or the Company’s need to shift the portfolio to maintain its portfolio management objectives including liquidity needs or duration targets on asset/liability managed portfolios. The Company attempts to anticipate these types of changes and if a sale decision has been made on an impaired security and that security is not expected to recover prior to the expected time of sale, the security will be deemed other-than-temporarily impaired in the period that the sale decision was made and an other-than-temporary impairment loss will be recognized. Based upon the Company’s current evaluation of the securities in accordance with its impairment policy, the cause of the decline being principally attributable to the general rise in interest rates during the holding period, and the Company’s current intent and ability to hold the fixed maturity and equity securities with unrealized losses for a period of time sufficient for them to recover, the Company has concluded that the aforementioned securities are not other-than-temporarily impaired. Securities Lending The Company participates in a securities lending program whereby blocks of securities, which are included in fixed maturity and equity securities, are loaned to third parties, primarily major brokerage firms. The Company requires a minimum of 102% of the fair value of the loaned securities to be separately maintained as collateral for the loans. Securities with a cost or amortized cost of $41.1 billion and $43.3 billion and an estimated fair value of $42.1 billion and $44.1 billion were on loan under the program at December 31, 2007 and 2006, respectively. Securities loaned under such transactions may be sold or repledged by the transferee. The Company was liable for cash collateral under its control of $43.3 billion and $45.4 billion at December 31, 2007 and 2006, respectively. Security collateral of $40 million and $100 million on deposit from customers in connection with the securities lending transactions at December 31, 2007 and 2006, respectively, may not be sold or repledged and is not reflected in the consolidated financial statements. Assets on Deposit and Held in Trust and Assets Pledged as Collateral The Company had investment assets on deposit with regulatory agencies with a fair market value of $1.8 billion and $1.3 billion at December 31, 2007 and 2006, respectively, consisting primarily of fixed maturity and equity securities. Company securities held in trust to satisfy collateral requirements had a cost or amortized cost of $7.1 billion and $3.0 billion at December 31, 2007 and 2006, respectively, consisting primarily of fixed maturity and equity securities. Certain of the Company’s fixed maturity securities are pledged as collateral for various derivative transactions as described in Note 4. Additionally, the Company has pledged certain of its fixed maturity securities in support of its debt and funding agreements as described in Notes 10 and 7, respectively. F-28 MetLife, Inc. MetLife, Inc. Notes to Consolidated Financial Statements — (Continued)
  • 125.
    Mortgage and ConsumerLoans Mortgage and consumer loans are categorized as follows: Amount Percent Amount Percent 2007 2006 December 31, (In millions) Commercial mortgage loans . . . . . . . . . . . . . . . . . . . . . . . . . . . . . . . . . . . . . . $35,669 76% $32,000 75% Agricultural mortgage loans . . . . . . . . . . . . . . . . . . . . . . . . . . . . . . . . . . . . . . 10,508 22 9,231 22 Consumer loans. . . . . . . . . . . . . . . . . . . . . . . . . . . . . . . . . . . . . . . . . . . . . . 1,051 2 1,190 3 Total . . . . . . . . . . . . . . . . . . . . . . . . . . . . . . . . . . . . . . . . . . . . . . . . . . . . 47,228 100% 42,421 100% Less: Valuation allowances . . . . . . . . . . . . . . . . . . . . . . . . . . . . . . . . . . . . . . . 198 182 Total mortgage and consumer loans . . . . . . . . . . . . . . . . . . . . . . . . . . . . . . . $47,030 $42,239 Mortgage loans are collateralized by properties primarily located in the United States. At December 31, 2007, 21%, 7% and 7% of the value of the Company’s mortgage and consumer loans were located in California, Florida and Texas, respectively. Generally, the Company, as the lender, only loans up to 75% of the purchase price of the underlying real estate. Certain of the Company’s real estate joint ventures have mortgage loans with the Company. The carrying values of such mortgages were $373 million and $372 million at December 31, 2007 and 2006, respectively. Information regarding loan valuation allowances for mortgage and consumer loans is as follows: 2007 2006 2005 Years Ended December 31, (In millions) Balance at January 1, . . . . . . . . . . . . . . . . . . . . . . . . . . . . . . . . . . . . . . . . . . . . . . . . . . . . . . $182 $172 $157 Additions . . . . . . . . . . . . . . . . . . . . . . . . . . . . . . . . . . . . . . . . . . . . . . . . . . . . . . . . . . . . . . 77 36 64 Deductions . . . . . . . . . . . . . . . . . . . . . . . . . . . . . . . . . . . . . . . . . . . . . . . . . . . . . . . . . . . . . (61) (26) (49) Balance at December 31, . . . . . . . . . . . . . . . . . . . . . . . . . . . . . . . . . . . . . . . . . . . . . . . . . . . $198 $182 $172 A portion of the Company’s mortgage and consumer loans was impaired and consisted of the following: 2007 2006 December 31, (In millions) Impaired loans with valuation allowances . . . . . . . . . . . . . . . . . . . . . . . . . . . . . . . . . . . . . . . . . . . . . . . $624 $374 Impaired loans without valuation allowances . . . . . . . . . . . . . . . . . . . . . . . . . . . . . . . . . . . . . . . . . . . . . 44 75 Subtotal . . . . . . . . . . . . . . . . . . . . . . . . . . . . . . . . . . . . . . . . . . . . . . . . . . . . . . . . . . . . . . . . . . . . 668 449 Less: Valuation allowances on impaired loans . . . . . . . . . . . . . . . . . . . . . . . . . . . . . . . . . . . . . . . . . . . . 73 21 Impaired loans . . . . . . . . . . . . . . . . . . . . . . . . . . . . . . . . . . . . . . . . . . . . . . . . . . . . . . . . . . . . . . . . $595 $428 The average investment on impaired loans was $453 million, $202 million and $187 million for the years ended December 31, 2007, 2006 and 2005, respectively. Interest income on impaired loans was $38 million, $2 million and $12 million for the years ended December 31, 2007, 2006 and 2005, respectively. The investment in restructured loans was $2 million and $9 million at December 31, 2007 and 2006, respectively. Interest income of less than $1 million, $1 million and $2 million was recognized on restructured loans for the years ended December 31, 2007, 2006 and 2005, respectively. Gross interest income that would have been recorded in accordance with the original terms of such loans amounted to less than $1 million, $1 million and $3 million for the years ended December 31, 2007, 2006 and 2005, respectively. Mortgage and consumer loans with scheduled payments of 90 days or more past due on which interest is still accruing, had an amortized cost of $4 million and $15 million at December 31, 2007 and 2006, respectively. Mortgage and consumer loans on which interest is no longer accrued had an amortized cost of $28 million and $36 million at December 31, 2007 and 2006, respectively. Mortgage and consumer loans in foreclosure had an amortized cost of $12 million and $35 million at December 31, 2007 and 2006, respectively. F-29MetLife, Inc. MetLife, Inc. Notes to Consolidated Financial Statements — (Continued)
  • 126.
    Real Estate Holdings Realestate holdings consisted of the following: 2007 2006 December 31, (In millions) Real estate . . . . . . . . . . . . . . . . . . . . . . . . . . . . . . . . . . . . . . . . . . . . . . . . . . . . . . . . . . . . . . . $ 4,914 $ 4,326 Accumulated depreciation . . . . . . . . . . . . . . . . . . . . . . . . . . . . . . . . . . . . . . . . . . . . . . . . . . . . . (1,088) (1,001) Net real estate. . . . . . . . . . . . . . . . . . . . . . . . . . . . . . . . . . . . . . . . . . . . . . . . . . . . . . . . . . . . . 3,826 3,325 Real estate joint ventures. . . . . . . . . . . . . . . . . . . . . . . . . . . . . . . . . . . . . . . . . . . . . . . . . . . . . . 2,771 1,477 Real estate and real estate joint ventures . . . . . . . . . . . . . . . . . . . . . . . . . . . . . . . . . . . . . . . . . . 6,597 4,802 Real estate held-for-sale . . . . . . . . . . . . . . . . . . . . . . . . . . . . . . . . . . . . . . . . . . . . . . . . . . . . . . 172 184 Total real estate holdings . . . . . . . . . . . . . . . . . . . . . . . . . . . . . . . . . . . . . . . . . . . . . . . . . . . . $ 6,769 $ 4,986 Related depreciation expense on real estate was $130 million, $131 million and $135 million for the years ended December 31, 2007, 2006 and 2005, respectively. These amounts include $13 million, $37 million and $62 million of depreciation expense related to discontinued operations for the years ended December 31, 2007, 2006 and 2005, respectively. There were no impairments recognized on real estate held-for-sale for the year ended December 31, 2007. Impairment losses recognized on real estate held-for-sale were $8 million and $5 million for the years ended December 31, 2006 and 2005, respectively. The carrying value of non-income producing real estate was $12 million and $8 million at December 31, 2007 and 2006, respectively. The Company owned real estate acquired in satisfaction of debt of $3 million at both December 31, 2007 and 2006. Real estate holdings were categorized as follows: Amount Percent Amount Percent 2007 2006 December 31, (In millions) Office . . . . . . . . . . . . . . . . . . . . . . . . . . . . . . . . . . . . . . . . . . . . . . . . . . . . . . $3,126 46% $2,709 55% Apartments . . . . . . . . . . . . . . . . . . . . . . . . . . . . . . . . . . . . . . . . . . . . . . . . . . 1,264 19 739 15 Development joint ventures . . . . . . . . . . . . . . . . . . . . . . . . . . . . . . . . . . . . . . . . 743 11 169 3 Retail . . . . . . . . . . . . . . . . . . . . . . . . . . . . . . . . . . . . . . . . . . . . . . . . . . . . . . 574 8 513 10 Real estate investment funds . . . . . . . . . . . . . . . . . . . . . . . . . . . . . . . . . . . . . . . 516 8 401 8 Industrial . . . . . . . . . . . . . . . . . . . . . . . . . . . . . . . . . . . . . . . . . . . . . . . . . . . . 283 4 291 6 Land . . . . . . . . . . . . . . . . . . . . . . . . . . . . . . . . . . . . . . . . . . . . . . . . . . . . . . . 174 3 71 1 Agriculture . . . . . . . . . . . . . . . . . . . . . . . . . . . . . . . . . . . . . . . . . . . . . . . . . . . 29 — 32 1 Other . . . . . . . . . . . . . . . . . . . . . . . . . . . . . . . . . . . . . . . . . . . . . . . . . . . . . . 60 1 61 1 Total real estate holdings . . . . . . . . . . . . . . . . . . . . . . . . . . . . . . . . . . . . . . . . $6,769 100% $4,986 100% The Company’s real estate holdings are primarily located in the United States. At December 31, 2007, 22%, 11%, 10% and 9% of the Company’s real estate holdings were located in California, New York, Florida and Texas, respectively. Leveraged Leases Investment in leveraged leases, included in other invested assets, consisted of the following: 2007 2006 December 31, (In millions) Rental receivables, net . . . . . . . . . . . . . . . . . . . . . . . . . . . . . . . . . . . . . . . . . . . . . . . . . . . . . . . . $ 1,491 $1,055 Estimated residual values . . . . . . . . . . . . . . . . . . . . . . . . . . . . . . . . . . . . . . . . . . . . . . . . . . . . . . 1,881 887 Subtotal . . . . . . . . . . . . . . . . . . . . . . . . . . . . . . . . . . . . . . . . . . . . . . . . . . . . . . . . . . . . . . . . 3,372 1,942 Unearned income . . . . . . . . . . . . . . . . . . . . . . . . . . . . . . . . . . . . . . . . . . . . . . . . . . . . . . . . . . . (1,313) (694) Investment in leveraged leases . . . . . . . . . . . . . . . . . . . . . . . . . . . . . . . . . . . . . . . . . . . . . . . . . $ 2,059 $1,248 The Company’s deferred income tax liability related to leveraged leases was $1.0 billion and $670 million at December 31, 2007 and 2006, respectively. The rental receivables set forth above are generally due in periodic installments. The payment periods range from one to 15 years, but in certain circumstances are as long as 30 years. The components of net income from investment in leveraged leases are as follows: 2007 2006 2005 Years Ended December 31, (In millions) Income from investment in leveraged leases (included in net investment income) . . . . . . . . . . . . . . . . . $ 67 $ 51 $ 54 Less: Income tax expense on leveraged leases . . . . . . . . . . . . . . . . . . . . . . . . . . . . . . . . . . . . . . . (24) (18) (19) Net income from investment in leveraged leases . . . . . . . . . . . . . . . . . . . . . . . . . . . . . . . . . . . . . . $ 43 $ 33 $ 35 F-30 MetLife, Inc. MetLife, Inc. Notes to Consolidated Financial Statements — (Continued)
  • 127.
    Other Limited PartnershipInterests The carrying value of other limited partnership interests (which primarily represent ownership interests in pooled investment funds that make private equity investments in companies in the United States and overseas) was $6.2 billion and $4.8 billion at December 31, 2007 and 2006, respectively. Included within other limited partnership interests at December 31, 2007 and 2006 are $1.6 billion and $1.2 billion, respectively, of hedge funds. For the years ended December 31, 2007, 2006 and 2005, net investment income from other limited partnership interests included $89 million, $98 million and $24 million respectively, related to hedge funds. Funds Withheld at Interest Funds withheld at interest, included in other invested assets, were $4.5 billion and $4.0 billion at December 31, 2007 and 2006, respectively. Net Investment Income The components of net investment income are as follows: 2007 2006 2005 Years Ended December 31, (In millions) Fixed maturity securities . . . . . . . . . . . . . . . . . . . . . . . . . . . . . . . . . . . . . . . . . . . . . . $15,150 $14,049 $11,349 Equity securities . . . . . . . . . . . . . . . . . . . . . . . . . . . . . . . . . . . . . . . . . . . . . . . . . . . 279 122 79 Mortgage and consumer loans . . . . . . . . . . . . . . . . . . . . . . . . . . . . . . . . . . . . . . . . . . 2,863 2,534 2,302 Policy loans . . . . . . . . . . . . . . . . . . . . . . . . . . . . . . . . . . . . . . . . . . . . . . . . . . . . . . 637 603 572 Real estate and real estate joint ventures . . . . . . . . . . . . . . . . . . . . . . . . . . . . . . . . . . . 913 746 510 Other limited partnership interests . . . . . . . . . . . . . . . . . . . . . . . . . . . . . . . . . . . . . . . 1,309 945 709 Cash, cash equivalents and short-term investments . . . . . . . . . . . . . . . . . . . . . . . . . . . . 503 519 400 Other . . . . . . . . . . . . . . . . . . . . . . . . . . . . . . . . . . . . . . . . . . . . . . . . . . . . . . . . . . 631 530 472 Total investment income . . . . . . . . . . . . . . . . . . . . . . . . . . . . . . . . . . . . . . . . . . . . 22,285 20,048 16,393 Less: Investment expenses . . . . . . . . . . . . . . . . . . . . . . . . . . . . . . . . . . . . . . . . . . . . 3,279 2,966 1,637 Net investment income . . . . . . . . . . . . . . . . . . . . . . . . . . . . . . . . . . . . . . . . . . . . . $19,006 $17,082 $14,756 Net Investment Gains (Losses) The components of net investment gains (losses) are as follows: 2007 2006 2005 Years Ended December 31, (In millions) Fixed maturity securities . . . . . . . . . . . . . . . . . . . . . . . . . . . . . . . . . . . . . . . . . . . . . . . . . . $(622) $(1,119) $(868) Equity securities . . . . . . . . . . . . . . . . . . . . . . . . . . . . . . . . . . . . . . . . . . . . . . . . . . . . . . . 164 84 117 Mortgage and consumer loans . . . . . . . . . . . . . . . . . . . . . . . . . . . . . . . . . . . . . . . . . . . . . . 2 (8) 17 Real estate and real estate joint ventures . . . . . . . . . . . . . . . . . . . . . . . . . . . . . . . . . . . . . . . 44 102 14 Other limited partnership interests . . . . . . . . . . . . . . . . . . . . . . . . . . . . . . . . . . . . . . . . . . . 16 1 42 Sales of businesses . . . . . . . . . . . . . . . . . . . . . . . . . . . . . . . . . . . . . . . . . . . . . . . . . . . . — — 8 Derivatives. . . . . . . . . . . . . . . . . . . . . . . . . . . . . . . . . . . . . . . . . . . . . . . . . . . . . . . . . . . (414) (201) 391 Other . . . . . . . . . . . . . . . . . . . . . . . . . . . . . . . . . . . . . . . . . . . . . . . . . . . . . . . . . . . . . . 72 (241) 193 Net investment gains (losses) . . . . . . . . . . . . . . . . . . . . . . . . . . . . . . . . . . . . . . . . . . . . . $(738) $(1,382) $ (86) The Company periodically disposes of fixed maturity and equity securities at a loss. Generally, such losses are insignificant in amount or in relation to the cost basis of the investment, are attributable to declines in fair value occurring in the period of the disposition or are as a result of management’s decision to sell securities based on current conditions or the Company’s need to shift the portfolio to maintain its portfolio management objectives. Losses from fixed maturity and equity securities deemed other-than-temporarily impaired, included within net investment gains (losses), were $106 million, $82 million and $64 million for the years ended December 31, 2007, 2006 and 2005, respectively. F-31MetLife, Inc. MetLife, Inc. Notes to Consolidated Financial Statements — (Continued)
  • 128.
    Net Unrealized InvestmentGains (Losses) The components of net unrealized investment gains (losses), included in accumulated other comprehensive income, are as follows: 2007 2006 2005 Years Ended December 31, (In millions) Fixed maturity securities . . . . . . . . . . . . . . . . . . . . . . . . . . . . . . . . . . . . . . . . . . . . . . . $ 3,378 $ 5,075 $ 6,132 Equity securities . . . . . . . . . . . . . . . . . . . . . . . . . . . . . . . . . . . . . . . . . . . . . . . . . . . . 157 541 247 Derivatives . . . . . . . . . . . . . . . . . . . . . . . . . . . . . . . . . . . . . . . . . . . . . . . . . . . . . . . . (270) (208) (142) Minority interest . . . . . . . . . . . . . . . . . . . . . . . . . . . . . . . . . . . . . . . . . . . . . . . . . . . . . (150) (159) (171) Other . . . . . . . . . . . . . . . . . . . . . . . . . . . . . . . . . . . . . . . . . . . . . . . . . . . . . . . . . . . 3 9 (102) Subtotal . . . . . . . . . . . . . . . . . . . . . . . . . . . . . . . . . . . . . . . . . . . . . . . . . . . . . . . . 3,118 5,258 5,964 Amounts allocated from: Insurance liability loss recognition . . . . . . . . . . . . . . . . . . . . . . . . . . . . . . . . . . . . . . . . (608) (1,149) (1,410) DAC and VOBA . . . . . . . . . . . . . . . . . . . . . . . . . . . . . . . . . . . . . . . . . . . . . . . . . . . (327) (189) (79) Policyholder dividend obligation . . . . . . . . . . . . . . . . . . . . . . . . . . . . . . . . . . . . . . . . . (789) (1,062) (1,492) Subtotal . . . . . . . . . . . . . . . . . . . . . . . . . . . . . . . . . . . . . . . . . . . . . . . . . . . . . . . (1,724) (2,400) (2,981) Deferred income tax . . . . . . . . . . . . . . . . . . . . . . . . . . . . . . . . . . . . . . . . . . . . . . . . . . (423) (994) (1,041) Subtotal . . . . . . . . . . . . . . . . . . . . . . . . . . . . . . . . . . . . . . . . . . . . . . . . . . . . . . . . (2,147) (3,394) (4,022) Net unrealized investment gains (losses) . . . . . . . . . . . . . . . . . . . . . . . . . . . . . . . . . . . . . $ 971 $ 1,864 $ 1,942 The changes in net unrealized investment gains (losses) are as follows: 2007 2006 2005 Years Ended December 31, (In millions) Balance, January 1, . . . . . . . . . . . . . . . . . . . . . . . . . . . . . . . . . . . . . . . . . . . . . . . . . . $ 1,864 $1,942 $ 2,994 Unrealized investment gains (losses) during the year . . . . . . . . . . . . . . . . . . . . . . . . . . . . . (2,140) (706) (3,372) Unrealized investment gains of subsidiaries at the date of sale . . . . . . . . . . . . . . . . . . . . . . . — — 15 Unrealized investment gains (losses) relating to: Insurance liability gain (loss) recognition . . . . . . . . . . . . . . . . . . . . . . . . . . . . . . . . . . . . 541 261 581 DAC and VOBA . . . . . . . . . . . . . . . . . . . . . . . . . . . . . . . . . . . . . . . . . . . . . . . . . . . . (138) (110) 462 Policyholder dividend obligation . . . . . . . . . . . . . . . . . . . . . . . . . . . . . . . . . . . . . . . . . 273 430 627 Deferred income tax . . . . . . . . . . . . . . . . . . . . . . . . . . . . . . . . . . . . . . . . . . . . . . . . . 571 47 635 Balance, December 31, . . . . . . . . . . . . . . . . . . . . . . . . . . . . . . . . . . . . . . . . . . . . . . . . $ 971 $1,864 $ 1,942 Net change in unrealized investment gains (losses) . . . . . . . . . . . . . . . . . . . . . . . . . . . . . . $ (893) $ (78) $(1,052) Trading Securities The Company has a trading securities portfolio to support investment strategies that involve the active and frequent purchase and sale of securities, the execution of short sale agreements and asset and liability matching strategies for certain insurance products. Trading securities and short sale agreement liabilities are recorded at fair value with subsequent changes in fair value recognized in net investment income related to fixed maturity securities. At December 31, 2007 and 2006, trading securities were $779 million and $759 million, respectively, and liabilities associated with the short sale agreements in the trading securities portfolio, which were included in other liabilities, were $107 million and $387 million, respectively. The Company had pledged $407 million and $614 million of its assets, primarily consisting of trading securities, as collateral to secure the liabilities associated with the short sale agreements in the trading securities portfolio at December 31, 2007 and 2006, respectively. During the years ended December 31, 2007, 2006 and 2005, interest and dividends earned on trading securities in addition to the net realized and unrealized gains (losses) recognized on the trading securities and the related short sale agreement liabilities included within net investment income totaled $50 million, $71 million and $14 million, respectively. Included within unrealized gains (losses) on such trading securities and short sale agreement liabilities, are changes in fair value of ($4) million, $26 million and less than $1 million for the years ended December 31, 2007, 2006 and 2005, respectively. As part of the acquisition of Travelers on July 1, 2005, the Company acquired Travelers’ investment in Tribeca Citigroup Investments Ltd. (“Tribeca”). Tribeca was a feeder fund investment structure whereby the feeder fund invests substantially all of its assets in the master fund, Tribeca Global Convertible Instruments Ltd. The primary investment objective of the master fund is to achieve enhanced risk-adjusted return by investing in domestic and foreign equities and equity-related securities utilizing such strategies as convertible securities arbitrage. At December 31, 2005, MetLife was the majority owner of the feeder fund and consolidated the fund within its consolidated financial statements. Net investment income related to the trading activities of Tribeca, which included interest and dividends earned on trading securities in addition to the net realized and unrealized gains (losses), was $12 million and $6 million for the six months ended June 30, 2006 and the year ended December 31, 2005, respectively. F-32 MetLife, Inc. MetLife, Inc. Notes to Consolidated Financial Statements — (Continued)
  • 129.
    During the secondquarter of 2006, MetLife’s ownership interests in Tribeca declined to a position whereby Tribeca is no longer consolidated and, as of June 30, 2006, was accounted for under the equity method of accounting. The equity method investment at December 31, 2006 of $82 million was included in other limited partnership interests. Net investment income related to the Company’s equity method investment in Tribeca was $9 million for the six months ended December 31, 2006. Variable Interest Entities The following table presents the total assets of and maximum exposure to loss relating to VIEs for which the Company has concluded that: (i) it is the primary beneficiary and which are consolidated in the Company’s consolidated financial statements at December 31, 2007; and (ii) it holds significant variable interests but it is not the primary beneficiary and which have not been consolidated: Total Assets(1) Maximum Exposure to Loss(2) Total Assets(1) Maximum Exposure to Loss(2) Primary Beneficiary Not Primary Beneficiary December 31, 2007 (In millions) Asset-backed securitizations and collateralized debt obligations . . . . . . . . . . $1,167 $1,167 $ 1,591 $ 184 Real estate joint ventures(3) . . . . . . . . . . . . . . . . . . . . . . . . . . . . . . . . . 48 26 276 42 Other limited partnership interests(4) . . . . . . . . . . . . . . . . . . . . . . . . . . . . 2 1 42,141 2,080 Trust preferred securities(5) . . . . . . . . . . . . . . . . . . . . . . . . . . . . . . . . . . 105 105 48,232 3,369 Other investments(6) . . . . . . . . . . . . . . . . . . . . . . . . . . . . . . . . . . . . . . 1,119 1,119 3,258 260 Total . . . . . . . . . . . . . . . . . . . . . . . . . . . . . . . . . . . . . . . . . . . . . . . $2,441 $2,418 $95,498 $5,935 (1) The assets of the asset-backed securitizations and collateralized debt obligations are reflected at fair value. The assets of the real estate joint ventures, other limited partnership interests, trust preferred securities and other investments are reflected at the carrying amounts at which such assets would have been reflected on the Company’s consolidated balance sheet had the Company consolidated the VIE from the date of its initial investment in the entity. (2) The maximum exposure to loss relating to the asset-backed securitizations and collateralized debt obligations is equal to the carrying amounts of retained interests. In addition, the Company provides collateral management services for certain of these structures for which it collects a management fee. The maximum exposure to loss relating to real estate joint ventures, other limited partnership interests, trust preferred securities and other investments is equal to the carrying amounts plus any unfunded commitments, reduced by amounts guaranteed by other partners. Such a maximum loss would be expected to occur only upon bankruptcy of the issuer or investee. (3) Real estate joint ventures include partnerships and other ventures which engage in the acquisition, development, management and disposal of real estate investments. (4) Other limited partnership interests include partnerships established for the purpose of investing in public and private debt and equity securities. (5) Trust preferred securities are complex, uniquely structured investments which contain features of both equity and debt, may have an extended or no stated maturity, and may be callable at the issuer’s option after a defined period of time. (6) Other investments include securities that are not trust preferred securities, asset-backed securitizations or collateralized debt obligations and the assets supporting the financing arrangement described in Note 11. 4. Derivative Financial Instruments Types of Derivative Financial Instruments The following table presents the notional amount and current market or fair value of derivative financial instruments held at: Notional Amount Assets Liabilities Notional Amount Assets Liabilities Current Market or Fair Value Current Market or Fair Value December 31, 2007 December 31, 2006 (In millions) Interest rate swaps . . . . . . . . . . . . . . . . . . . . . . . . . . $ 62,519 $ 785 $ 768 $ 27,148 $ 639 $ 150 Interest rate floors . . . . . . . . . . . . . . . . . . . . . . . . . . . 48,937 621 — 37,437 279 — Interest rate caps . . . . . . . . . . . . . . . . . . . . . . . . . . . 45,498 50 — 26,468 125 — Financial futures . . . . . . . . . . . . . . . . . . . . . . . . . . . . 10,817 89 57 8,432 64 39 Foreign currency swaps . . . . . . . . . . . . . . . . . . . . . . . 21,399 1,480 1,724 19,627 986 1,174 Foreign currency forwards . . . . . . . . . . . . . . . . . . . . . . 4,185 76 16 2,934 31 27 Options . . . . . . . . . . . . . . . . . . . . . . . . . . . . . . . . . . 2,043 713 1 587 306 8 Financial forwards . . . . . . . . . . . . . . . . . . . . . . . . . . . 4,600 122 2 3,800 12 40 Credit default swaps . . . . . . . . . . . . . . . . . . . . . . . . . 6,850 58 35 6,357 5 21 Synthetic GICs . . . . . . . . . . . . . . . . . . . . . . . . . . . . . 3,670 — — 3,739 — — Other . . . . . . . . . . . . . . . . . . . . . . . . . . . . . . . . . . . 250 43 — 250 56 — Total . . . . . . . . . . . . . . . . . . . . . . . . . . . . . . . . . . $210,768 $4,037 $2,603 $136,779 $2,503 $1,459 The above table does not include notional amounts for equity futures, equity variance swaps and equity options. At December 31, 2007 and 2006, the Company owned 4,658 and 2,749 equity futures, respectively. Fair values of equity futures are included in financial futures F-33MetLife, Inc. MetLife, Inc. Notes to Consolidated Financial Statements — (Continued)
  • 130.
    in the precedingtable. At December 31, 2007 and 2006, the Company owned 695,485 and 225,000 equity variance swaps, respectively. Fair values of equity variance swaps are included in financial forwards in the preceding table. At December 31, 2007 and 2006, the Company owned 77,374,937 and 74,864,483 equity options, respectively. Fair values of equity options are included in options in the preceding table. The following table presents the notional amount of derivative financial instruments by maturity at December 31, 2007: One Year or Less After One Year Through Five Years After Five Years Through Ten Years After Ten Years Total Remaining Life (In millions) Interest rate swaps . . . . . . . . . . . . . . . . . . . . . . . . . . $14,844 $30,113 $ 9,918 $ 7,644 $ 62,519 Interest rate floors . . . . . . . . . . . . . . . . . . . . . . . . . . — 15,619 33,318 — 48,937 Interest rate caps . . . . . . . . . . . . . . . . . . . . . . . . . . . 29,905 15,593 — — 45,498 Financial futures . . . . . . . . . . . . . . . . . . . . . . . . . . . 10,730 — — 87 10,817 Foreign currency swaps . . . . . . . . . . . . . . . . . . . . . . 1,632 9,068 7,434 3,265 21,399 Foreign currency forwards . . . . . . . . . . . . . . . . . . . . . 4,175 — — 10 4,185 Options . . . . . . . . . . . . . . . . . . . . . . . . . . . . . . . . . — 620 1,250 173 2,043 Financial forwards . . . . . . . . . . . . . . . . . . . . . . . . . . — — — 4,600 4,600 Credit default swaps . . . . . . . . . . . . . . . . . . . . . . . . . 509 4,582 1,510 249 6,850 Synthetic GICs . . . . . . . . . . . . . . . . . . . . . . . . . . . . 3,670 — — — 3,670 Other . . . . . . . . . . . . . . . . . . . . . . . . . . . . . . . . . . . — — — 250 250 Total . . . . . . . . . . . . . . . . . . . . . . . . . . . . . . . . . . $65,465 $75,595 $53,430 $16,278 $210,768 Interest rate swaps are used by the Company primarily to reduce market risks from changes in interest rates and to alter interest rate exposure arising from mismatches between assets and liabilities (duration mismatches). In an interest rate swap, the Company agrees with another party to exchange, at specified intervals, the difference between fixed rate and floating rate interest amounts as calculated by reference to an agreed notional principal amount. These transactions are entered into pursuant to master agreements that provide for a single net payment to be made by the counterparty at each due date. The Company also enters into basis swaps to better match the cash flows from assets and related liabilities. In a basis swap, both legs of the swap are floating with each based on a different index. Generally, no cash is exchanged at the outset of the contract and no principal payments are made by either party. A single net payment is usually made by one counterparty at each due date. Basis swaps are included in interest rate swaps in the preceding table. Interest rate caps and floors are used by the Company primarily to protect its floating rate liabilities against rises in interest rates above a specified level, and against interest rate exposure arising from mismatches between assets and liabilities (duration mismatches), as well as to protect its minimum rate guarantee liabilities against declines in interest rates below a specified level, respectively. In exchange-traded interest rate (Treasury and swap) and equity futures transactions, the Company agrees to purchase or sell a specified number of contracts, the value of which is determined by the different classes of interest rate and equity securities, and to post variation margin on a daily basis in an amount equal to the difference in the daily market values of those contracts. The Company enters into exchange-traded futures with regulated futures commission merchants that are members of the exchange. Exchange-traded interest rate (Treasury and swap) futures are used primarily to hedge mismatches between the duration of assets in a portfolio and the duration of liabilities supported by those assets, to hedge against changes in value of securities the Company owns or anticipates acquiring, and to hedge against changes in interest rates on anticipated liability issuances by replicating Treasury or swap curve performance. The value of interest rate futures is substantially impacted by changes in interest rates and they can be used to modify or hedge existing interest rate risk. Exchange-traded equity futures are used primarily to hedge liabilities embedded in certain variable annuity products offered by the Company. Foreign currency derivatives, including foreign currency swaps, foreign currency forwards and currency option contracts, are used by the Company to reduce the risk from fluctuations in foreign currency exchange rates associated with its assets and liabilities denominated in foreign currencies. The Company also uses foreign currency forwards and swaps to hedge the foreign currency risk associated with certain of its net investments in foreign operations. In a foreign currency swap transaction, the Company agrees with another party to exchange, at specified intervals, the difference between one currency and another at a forward exchange rate calculated by reference to an agreed upon principal amount. The principal amount of each currency is exchanged at the inception and termination of the currency swap by each party. In a foreign currency forward transaction, the Company agrees with another party to deliver a specified amount of an identified currency at a specified future date. The price is agreed upon at the time of the contract and payment for such a contract is made in a different currency at the specified future date. The Company enters into currency option contracts that give it the right, but not the obligation, to sell the foreign currency amount in exchange for a functional currency amount within a limited time at a contracted price. The contracts may also be net settled in cash, based on differentials in the foreign exchange rate and the strike price. Currency option contracts are included in options in the preceding table. Swaptions are used by the Company to hedge interest rate risk associated with the Company’s long-term liabilities, as well as to sell, or monetize, embedded call options in its fixed rate liabilities. A swaption is an option to enter into a swap with an effective date equal to the exercise date of the embedded call and a maturity date equal to the maturity date of the underlying liability. The Company receives a premium for entering into the swaption. Swaptions are included in options in the preceding table. F-34 MetLife, Inc. MetLife, Inc. Notes to Consolidated Financial Statements — (Continued)
  • 131.
    Equity index optionsare used by the Company primarily to hedge minimum guarantees embedded in certain variable annuity products offered by the Company. To hedge against adverse changes in equity indices, the Company enters into contracts to sell the equity index within a limited time at a contracted price. The contracts will be net settled in cash based on differentials in the indices at the time of exercise and the strike price. Equity index options are included in options in the preceding table. The Company enters into financial forwards to buy and sell securities. The price is agreed upon at the time of the contract and payment for such a contract is made at a specified future date. Equity variance swaps are used by the Company primarily to hedge minimum guarantees embedded in certain variable annuity products offered by the Company. In an equity variance swap, the Company agrees with another party to exchange amounts in the future, based on changes in equity volatility over a defined period. Equity variance swaps are included in financial forwards in the preceding table. Swap spread locks are used by the Company to hedge invested assets on an economic basis against the risk of changes in credit spreads. Swap spread locks are forward starting swaps where the Company agrees to pay a coupon based on a predetermined reference swap spread in exchange for receiving a coupon based on a floating rate. The Company has the option to cash settle with the counterparty in lieu of maintaining the swap after the effective date. Swap spread locks are included in financial forwards in the preceding table. Certain credit default swaps are used by the Company to hedge against credit-related changes in the value of its investments and to diversify its credit risk exposure in certain portfolios. In a credit default swap transaction, the Company agrees with another party, at specified intervals, to pay a premium to insure credit risk. If a credit event, as defined by the contract, occurs, generally the contract will require the swap to be settled gross by the delivery of par quantities of the referenced investment equal to the specified swap notional in exchange for the payment of cash amounts by the counterparty equal to the par value of the investment surrendered. Credit default swaps are also used to synthetically create investments that are either more expensive to acquire or otherwise unavailable in the cash markets. These transactions are a combination of a derivative and a cash instrument such as a U.S. Treasury or Agency security. The Company also enters into certain credit default swaps held in relation to trading portfolios. A synthetic guaranteed interest contract (“GIC”) is a contract that simulates the performance of a traditional GIC through the use of financial instruments. Under a synthetic GIC, the policyholder owns the underlying assets. The Company guarantees a rate return on those assets for a premium. Total rate of return swaps (“TRRs”) are swaps whereby the Company agrees with another party to exchange, at specified intervals, the difference between the economic risk and reward of an asset or a market index and LIBOR, calculated by reference to an agreed notional principal amount. No cash is exchanged at the outset of the contract. Cash is paid and received over the life of the contract based on the terms of the swap. These transactions are entered into pursuant to master agreements that provide for a single net payment to be made by the counterparty at each due date. TRRs can be used as hedges or to synthetically create investments and are included in the other classification in the preceding table. Hedging The following table presents the notional amount and fair value of derivatives by type of hedge designation at: Notional Amount Assets Liabilities Notional Amount Assets Liabilities Fair Value Fair Value December 31, 2007 December 31, 2006 (In millions) Fair value. . . . . . . . . . . . . . . . . . . . . . . . . . . . . . . . . $ 10,006 $ 650 $ 99 $ 7,978 $ 290 $ 85 Cash flow . . . . . . . . . . . . . . . . . . . . . . . . . . . . . . . . 4,717 161 321 4,366 149 151 Foreign operations. . . . . . . . . . . . . . . . . . . . . . . . . . . 1,872 11 119 1,232 1 50 Non-qualifying . . . . . . . . . . . . . . . . . . . . . . . . . . . . . 194,173 3,215 2,064 123,203 2,063 1,173 Total . . . . . . . . . . . . . . . . . . . . . . . . . . . . . . . . . . $210,768 $4,037 $2,603 $136,779 $2,503 $1,459 The following table presents the settlement payments recorded in income for the: 2007 2006 2005 Years Ended December 31, (In millions) Qualifying hedges: Net investment income . . . . . . . . . . . . . . . . . . . . . . . . . . . . . . . . . . . . . . . . . . . . . . . . . . . . $ 29 $ 49 $ 42 Interest credited to policyholder account balances . . . . . . . . . . . . . . . . . . . . . . . . . . . . . . . . . . (34) (35) 17 Other expenses . . . . . . . . . . . . . . . . . . . . . . . . . . . . . . . . . . . . . . . . . . . . . . . . . . . . . . . . 1 3 (8) Non-qualifying hedges: Net investment income . . . . . . . . . . . . . . . . . . . . . . . . . . . . . . . . . . . . . . . . . . . . . . . . . . . . (5) — — Net investment gains (losses). . . . . . . . . . . . . . . . . . . . . . . . . . . . . . . . . . . . . . . . . . . . . . . . 279 296 86 Total . . . . . . . . . . . . . . . . . . . . . . . . . . . . . . . . . . . . . . . . . . . . . . . . . . . . . . . . . . . . . . $270 $313 $137 Fair Value Hedges The Company designates and accounts for the following as fair value hedges when they have met the requirements of SFAS 133: (i) interest rate swaps to convert fixed rate investments to floating rate investments; and (ii) foreign currency swaps to hedge the foreign currency fair value exposure of foreign currency denominated investments and liabilities. F-35MetLife, Inc. MetLife, Inc. Notes to Consolidated Financial Statements — (Continued)
  • 132.
    The Company recognizednet investment gains (losses) representing the ineffective portion of all fair value hedges as follows: 2007 2006 2005 Years Ended December 31, (In millions) Changes in the fair value of derivatives . . . . . . . . . . . . . . . . . . . . . . . . . . . . . . . . . . . . . . . . . . $ 334 $ 276 $(118) Changes in the fair value of the items hedged . . . . . . . . . . . . . . . . . . . . . . . . . . . . . . . . . . . . . (326) (276) 115 Net ineffectiveness of fair value hedging activities . . . . . . . . . . . . . . . . . . . . . . . . . . . . . . . . . . . $ 8 $ — $ (3) All components of each derivative’s gain or loss were included in the assessment of hedge effectiveness. There were no instances in which the Company discontinued fair value hedge accounting due to a hedged firm commitment no longer qualifying as a fair value hedge. Cash Flow Hedges The Company designates and accounts for the following as cash flow hedges when they have met the requirements of SFAS 133: (i) interest rate swaps to convert floating rate investments to fixed rate investments; (ii) interest rate swaps to convert floating rate liabilities to fixed rate liabilities; (iii) foreign currency swaps to hedge the foreign currency cash flow exposure of foreign currency denominated investments and liabilities; and (iv) financial forwards to buy and sell securities. For the years ended December 31, 2007 and 2006, the Company did not recognize any net investment gains (losses) which represented the ineffective portion of all cash flow hedges. For the year ended December 31, 2005, the Company recognized net investment gains (losses) of ($25) million which represented the ineffective portion of all cash flow hedges. All components of each derivative’s gain or loss were included in the assessment of hedge effectiveness. In certain instances, the Company discontinued cash flow hedge accounting because the forecasted transactions did not occur on the anticipated date or in the additional time period permitted by SFAS 133. The net amounts reclassified into net investment losses for the years ended December 31, 2007, 2006 and 2005 related to such discontinued cash flow hedges were $3 million, $3 million and $42 million, respectively. There were no hedged forecasted transactions, other than the receipt or payment of variable interest payments for the years ended December 31, 2007, 2006 and 2005. The following table presents the components of other comprehensive income (loss), before income tax, related to cash flow hedges: 2007 2006 2005 Years Ended December 31, (In millions) Other comprehensive income (loss) balance at January 1, . . . . . . . . . . . . . . . . . . . . . . . . . . . . . $(208) $(142) $(456) Gains (losses) deferred in other comprehensive income (loss) on the effective portion of cash flow hedges . . . . . . . . . . . . . . . . . . . . . . . . . . . . . . . . . . . . . . . . . . . . . . . . . . . . . . . . . . . . . (168) 80 127 Amounts reclassified to net investment gains (losses) . . . . . . . . . . . . . . . . . . . . . . . . . . . . . . . . 96 (158) 187 Amounts reclassified to net investment income . . . . . . . . . . . . . . . . . . . . . . . . . . . . . . . . . . . . 13 15 2 Amortization of transition adjustment . . . . . . . . . . . . . . . . . . . . . . . . . . . . . . . . . . . . . . . . . . . (1) (1) (2) Amounts reclassified to other expenses . . . . . . . . . . . . . . . . . . . . . . . . . . . . . . . . . . . . . . . . . (2) (2) — Other comprehensive income (loss) balance at December 31, . . . . . . . . . . . . . . . . . . . . . . . . . . . $(270) $(208) $(142) At December 31, 2007, $23 million of the deferred net loss on derivatives accumulated in other comprehensive income (loss) is expected to be reclassified to earnings during the year ending December 31, 2008. Hedges of Net Investments in Foreign Operations The Company uses forward exchange contracts, foreign currency swaps, options and non-derivative financial instruments to hedge portions of its net investments in foreign operations against adverse movements in exchange rates. The Company measures ineffec- tiveness on the forward exchange contracts based upon the change in forward rates. There was no ineffectiveness recorded for the years ended December 31, 2007, 2006 and 2005. The Company’s consolidated statements of stockholders’ equity for the years ended December 31, 2007, 2006 and 2005 include gains (losses) of ($180) million, ($17) million and ($115) million, respectively, related to foreign currency contracts and non-derivative financial instruments used to hedge its net investments in foreign operations. At December 31, 2007 and 2006, the cumulative foreign currency translation loss recorded in accumulated other comprehensive income related to these hedges was $369 million and $189 million, respectively. When net investments in foreign operations are sold or substantially liquidated, the amounts in accumulated other com- prehensive income are reclassified to the consolidated statements of income, while a pro rata portion will be reclassified upon partial sale of the net investments in foreign operations. Non-qualifying Derivatives and Derivatives for Purposes Other Than Hedging The Company enters into the following derivatives that do not qualify for hedge accounting under SFAS 133 or for purposes other than hedging: (i) interest rate swaps, purchased caps and floors, and interest rate futures to economically hedge its exposure to interest rate volatility; (ii) foreign currency forwards, swaps and option contracts to economically hedge its exposure to adverse movements in exchange rates; (iii) swaptions to sell embedded call options in fixed rate liabilities; (iv) credit default swaps to economically hedge exposure to adverse movements in credit; (v) equity futures, equity index options, interest rate futures and equity variance swaps to economically hedge liabilities embedded in certain variable annuity products; (vi) swap spread locks to economically hedge invested assets against the risk of changes in credit spreads; (vii) financial forwards to buy and sell securities; (viii) synthetic guaranteed interest contracts; (ix) credit default swaps and TRRs to synthetically create investments; (x) basis swaps to better match the cash flows of assets and related liabilities; (xi) credit default swaps held in relation to trading portfolios; and (xii) swaptions to hedge interest rate risk. F-36 MetLife, Inc. MetLife, Inc. Notes to Consolidated Financial Statements — (Continued)
  • 133.
    The following tablepresents changes in fair value related to derivatives that do not qualify for hedge accounting: 2007 2006 2005 Years Ended December 31, (In millions) Net investment gains (losses), excluding embedded derivatives . . . . . . . . . . . . . . . . . . . . . . . . . . $(232) $(685) $299 Policyholder benefits and claims . . . . . . . . . . . . . . . . . . . . . . . . . . . . . . . . . . . . . . . . . . . . . . $ 7 $ (33) $ 2 Net investment income(1) . . . . . . . . . . . . . . . . . . . . . . . . . . . . . . . . . . . . . . . . . . . . . . . . . . . $ 31 $ (40) $ (38) (1) Changes in fair value related to economic hedges of equity method investment in joint ventures that do not qualify for hedge accounting and changes in fair value related to derivatives held in relation to trading portfolios. Embedded Derivatives The Company has certain embedded derivatives that are required to be separated from their host contracts and accounted for as derivatives. These host contracts include guaranteed minimum withdrawal contracts, guaranteed minimum accumulation contracts and modified coinsurance contracts. The following table presents the fair value of the Company’s embedded derivatives at: 2007 2006 December 31, (In millions) Embedded derivative assets . . . . . . . . . . . . . . . . . . . . . . . . . . . . . . . . . . . . . . . . . . . . . . . . . . . . . . . $ 72 $180 Embedded derivative liabilities . . . . . . . . . . . . . . . . . . . . . . . . . . . . . . . . . . . . . . . . . . . . . . . . . . . . . . $980 $169 The following table presents changes in fair value related to embedded derivatives: 2007 2006 2005 Years Ended December 31, (In millions) Net investment gains (losses) . . . . . . . . . . . . . . . . . . . . . . . . . . . . . . . . . . . . . . . . . . . . $(471) $209 $ 69 Interest credited to policyholder account balances . . . . . . . . . . . . . . . . . . . . . . . . . . . . . . $ (66) $ (80) $(45) Credit Risk The Company may be exposed to credit-related losses in the event of nonperformance by counterparties to derivative financial instruments. Generally, the current credit exposure of the Company’s derivative contracts is limited to the fair value at the reporting date. The credit exposure of the Company’s derivative transactions is represented by the fair value of contracts with a net positive fair value at the reporting date. The Company manages its credit risk related to over-the-counter derivatives by entering into transactions with creditworthy counter- parties, maintaining collateral arrangements and through the use of master agreements that provide for a single net payment to be made by one counterparty to another at each due date and upon termination. Because exchange traded futures are effected through regulated exchanges, and positions are marked to market on a daily basis, the Company has minimal exposure to credit-related losses in the event of nonperformance by counterparties to such derivative instruments. The Company enters into various collateral arrangements, which require both the pledging and accepting of collateral in connection with its derivative instruments. As of December 31, 2007 and 2006, the Company was obligated to return cash collateral under its control of $833 million and $428 million, respectively. This unrestricted cash collateral is included in cash and cash equivalents and the obligation to return it is included in payables for collateral under securities loaned and other transactions in the consolidated balance sheets. As of December 31, 2007 and 2006, the Company had also accepted collateral consisting of various securities with a fair market value of $678 million and $453 million, respectively, which are held in separate custodial accounts. The Company is permitted by contract to sell or repledge this collateral, but as of December 31, 2007 and 2006, none of the collateral had been sold or repledged. As of December 31, 2007 and 2006, the Company provided collateral of $162 million and $80 million, respectively, which is included in fixed maturity securities in the consolidated balance sheets. In addition, the Company has exchange traded futures, which require the pledging of collateral. As of December 31, 2007 and 2006, the Company pledged collateral of $167 million and $105 million, respectively, which is included in fixed maturity securities. The counterparties are permitted by contract to sell or repledge this collateral. F-37MetLife, Inc. MetLife, Inc. Notes to Consolidated Financial Statements — (Continued)
  • 134.
    5. Deferred PolicyAcquisition Costs and Value of Business Acquired Information regarding DAC and VOBA is as follows: DAC VOBA Total (In millions) Balance at January 1, 2005 . . . . . . . . . . . . . . . . . . . . . . . . . . . . . . . . . . . . . . . . . . . . $12,743 $1,584 $14,327 Capitalizations . . . . . . . . . . . . . . . . . . . . . . . . . . . . . . . . . . . . . . . . . . . . . . . . . . . . 3,604 — 3,604 Acquisitions . . . . . . . . . . . . . . . . . . . . . . . . . . . . . . . . . . . . . . . . . . . . . . . . . . . . . — 3,780 3,780 Subtotal . . . . . . . . . . . . . . . . . . . . . . . . . . . . . . . . . . . . . . . . . . . . . . . . . . . . . 16,347 5,364 21,711 Less: Amortization related to: Net investment gains (losses) . . . . . . . . . . . . . . . . . . . . . . . . . . . . . . . . . . . . . . . . 12 (25) (13) Unrealized investment gains (losses) . . . . . . . . . . . . . . . . . . . . . . . . . . . . . . . . . . . . (323) (139) (462) Other expenses . . . . . . . . . . . . . . . . . . . . . . . . . . . . . . . . . . . . . . . . . . . . . . . . . 2,128 335 2,463 Total amortization . . . . . . . . . . . . . . . . . . . . . . . . . . . . . . . . . . . . . . . . . . . . . . . 1,817 171 1,988 Less: Dispositions and other . . . . . . . . . . . . . . . . . . . . . . . . . . . . . . . . . . . . . . . . . . 106 (12) 94 Balance at December 31, 2005 . . . . . . . . . . . . . . . . . . . . . . . . . . . . . . . . . . . . . . . . . . 14,424 5,205 19,629 Capitalizations . . . . . . . . . . . . . . . . . . . . . . . . . . . . . . . . . . . . . . . . . . . . . . . . . . . . 3,589 — 3,589 Subtotal . . . . . . . . . . . . . . . . . . . . . . . . . . . . . . . . . . . . . . . . . . . . . . . . . . . . . 18,013 5,205 23,218 Less: Amortization related to: Net investment gains (losses) . . . . . . . . . . . . . . . . . . . . . . . . . . . . . . . . . . . . . . . . (158) (74) (232) Unrealized investment gains (losses) . . . . . . . . . . . . . . . . . . . . . . . . . . . . . . . . . . . . 79 31 110 Other expenses . . . . . . . . . . . . . . . . . . . . . . . . . . . . . . . . . . . . . . . . . . . . . . . . . 2,247 407 2,654 Total amortization . . . . . . . . . . . . . . . . . . . . . . . . . . . . . . . . . . . . . . . . . . . . . . . 2,168 364 2,532 Less: Dispositions and other . . . . . . . . . . . . . . . . . . . . . . . . . . . . . . . . . . . . . . . . . . (153) 1 (152) Balance at December 31, 2006 . . . . . . . . . . . . . . . . . . . . . . . . . . . . . . . . . . . . . . . . . . 15,998 4,840 20,838 Effect of SOP 05-1 adoption . . . . . . . . . . . . . . . . . . . . . . . . . . . . . . . . . . . . . . . . . . (205) (248) (453) Capitalizations . . . . . . . . . . . . . . . . . . . . . . . . . . . . . . . . . . . . . . . . . . . . . . . . . . . . 3,892 — 3,892 Acquisitions . . . . . . . . . . . . . . . . . . . . . . . . . . . . . . . . . . . . . . . . . . . . . . . . . . . . . — 48 48 Subtotal . . . . . . . . . . . . . . . . . . . . . . . . . . . . . . . . . . . . . . . . . . . . . . . . . . . . . 19,685 4,640 24,325 Less: Amortization related to: Net investment gains (losses) . . . . . . . . . . . . . . . . . . . . . . . . . . . . . . . . . . . . . . . . (225) (11) (236) Unrealized investment gains (losses) . . . . . . . . . . . . . . . . . . . . . . . . . . . . . . . . . . . . 75 63 138 Other expenses . . . . . . . . . . . . . . . . . . . . . . . . . . . . . . . . . . . . . . . . . . . . . . . . . 2,517 495 3,012 Total amortization . . . . . . . . . . . . . . . . . . . . . . . . . . . . . . . . . . . . . . . . . . . . . . . 2,367 547 2,914 Less: Dispositions and other . . . . . . . . . . . . . . . . . . . . . . . . . . . . . . . . . . . . . . . . . . (106) (4) (110) Balance at December 31, 2007 . . . . . . . . . . . . . . . . . . . . . . . . . . . . . . . . . . . . . . . . . . $17,424 $4,097 $21,521 The estimated future amortization expense allocated to other expenses for the next five years for VOBA is $477 million in 2008, $423 million in 2009, $379 million in 2010, $342 million in 2011, and $294 million in 2012. Amortization of VOBA and DAC is related to (i) investment gains and losses and the impact of such gains and losses on the amount of the amortization; (ii) unrealized investment gains and losses to provide information regarding the amount that would have been amortized if such gains and losses had been recognized; and (iii) other expenses to provide amounts related to the gross margins or profits originating from transactions other than investment gains and losses. 6. Goodwill Goodwill is the excess of cost over the fair value of net assets acquired. Information regarding goodwill is as follows: 2007 2006 2005 December 31, (In millions) Balance at January 1, . . . . . . . . . . . . . . . . . . . . . . . . . . . . . . . . . . . . . . . . . . . . . . . . . . $4,897 $4,797 $ 633 Acquisitions . . . . . . . . . . . . . . . . . . . . . . . . . . . . . . . . . . . . . . . . . . . . . . . . . . . . . . . . 2 93 4,180 Dispositions and other, net . . . . . . . . . . . . . . . . . . . . . . . . . . . . . . . . . . . . . . . . . . . . . . . 11 7 (16) Balance at December 31, . . . . . . . . . . . . . . . . . . . . . . . . . . . . . . . . . . . . . . . . . . . . . . . $4,910 $4,897 $4,797 See Note 2 for a description of acquisitions and dispositions. F-38 MetLife, Inc. MetLife, Inc. Notes to Consolidated Financial Statements — (Continued)
  • 135.
    7. Insurance Insurance Liabilities Insuranceliabilities are as follows: 2007 2006 2007 2006 2007 2006 Future Policy Benefits Policyholder Account Balances Other Policyholder Funds December 31, (In millions) Institutional Group life . . . . . . . . . . . . . . . . . . . . . . . . . . . . . $ 3,326 $ 3,252 $ 13,997 $ 13,567 $ 2,364 $2,259 Retirement & savings . . . . . . . . . . . . . . . . . . . . . 37,947 37,908 51,585 46,127 213 21 Non-medical health & other . . . . . . . . . . . . . . . . . 10,617 9,540 501 — 597 531 Individual Traditional life . . . . . . . . . . . . . . . . . . . . . . . . . . 52,493 51,715 1 1 1,479 1,429 Universal variable life . . . . . . . . . . . . . . . . . . . . . 985 894 14,898 14,544 1,572 1,367 Annuities . . . . . . . . . . . . . . . . . . . . . . . . . . . . . 3,063 3,186 37,807 40,251 76 43 Other . . . . . . . . . . . . . . . . . . . . . . . . . . . . . . . — — 2,410 2,412 1 1 Auto & Home . . . . . . . . . . . . . . . . . . . . . . . . . . . . 3,273 3,392 — — 51 61 International . . . . . . . . . . . . . . . . . . . . . . . . . . . . 9,826 8,123 4,961 4,198 1,296 1,223 Reinsurance . . . . . . . . . . . . . . . . . . . . . . . . . . . . 6,159 5,140 6,657 6,212 2,297 1,980 Corporate and Other . . . . . . . . . . . . . . . . . . . . . . . 4,573 4,339 4,532 4,636 230 224 Total . . . . . . . . . . . . . . . . . . . . . . . . . . . . . . . . $132,262 $127,489 $137,349 $131,948 $10,176 $9,139 Value of Distribution Agreements and Customer Relationships Acquired Information regarding the VODA and VOCRA, which are reported in other assets, is as follows: 2007 2006 2005 Years Ended December 31, (In millions) Balance at January 1, . . . . . . . . . . . . . . . . . . . . . . . . . . . . . . . . . . . . . . . . . . . . . . . . . . . . . . $708 $715 $ — Acquisitions . . . . . . . . . . . . . . . . . . . . . . . . . . . . . . . . . . . . . . . . . . . . . . . . . . . . . . . . . . . . 11 — 716 Amortization . . . . . . . . . . . . . . . . . . . . . . . . . . . . . . . . . . . . . . . . . . . . . . . . . . . . . . . . . . . . (16) (6) (1) Other . . . . . . . . . . . . . . . . . . . . . . . . . . . . . . . . . . . . . . . . . . . . . . . . . . . . . . . . . . . . . . . . . 3 (1) — Balance at December 31, . . . . . . . . . . . . . . . . . . . . . . . . . . . . . . . . . . . . . . . . . . . . . . . . . . . $706 $708 $715 The estimated future amortization expense allocated to other expenses for the next five years for VODA and VOCRA is $23 million in 2008, $28 million in 2009, $34 million in 2010, $37 million in 2011 and $42 million in 2012. See Note 2 for a description of acquisitions and dispositions. Sales Inducements Information regarding deferred sales inducements, which are reported in other assets, is as follows: 2007 2006 2005 Years Ended December 31, (In millions) Balance at January 1, . . . . . . . . . . . . . . . . . . . . . . . . . . . . . . . . . . . . . . . . . . . . . . . . . . . . . . $578 $414 $294 Capitalization . . . . . . . . . . . . . . . . . . . . . . . . . . . . . . . . . . . . . . . . . . . . . . . . . . . . . . . . . . . 181 194 140 Amortization . . . . . . . . . . . . . . . . . . . . . . . . . . . . . . . . . . . . . . . . . . . . . . . . . . . . . . . . . . . . (82) (30) (20) Balance at December 31, . . . . . . . . . . . . . . . . . . . . . . . . . . . . . . . . . . . . . . . . . . . . . . . . . . . $677 $578 $414 Separate Accounts Separate account assets and liabilities include two categories of account types: pass-through separate accounts totaling $141.8 billion and $127.9 billion at December 31, 2007 and 2006, respectively, for which the policyholder assumes all investment risk, and separate accounts with a minimum return or account value for which the Company contractually guarantees either a minimum return or account value to the policyholder which totaled $18.4 billion and $16.5 billion at December 31, 2007 and 2006, respectively. The latter category consisted primarily of Met Managed GICs and participating close-out contracts. The average interest rate credited on these contracts was 4.73% and 4.63% at December 31, 2007 and 2006, respectively. Fees charged to the separate accounts by the Company (including mortality charges, policy administration fees and surrender charges) are reflected in the Company’s revenues as universal life and investment-type product policy fees and totaled $2.8 billion, $2.4 billion and $1.7 billion for the years ended December 31, 2007, 2006 and 2005, respectively. F-39MetLife, Inc. MetLife, Inc. Notes to Consolidated Financial Statements — (Continued)
  • 136.
    The Company’s proportionalinterest in separate accounts is included in the consolidated balance sheets as follows: 2007 2006 December 31, (In millions) Fixed maturity securities . . . . . . . . . . . . . . . . . . . . . . . . . . . . . . . . . . . . . . . . . . . . . . . . . . . . . . $35 $30 Equity securities . . . . . . . . . . . . . . . . . . . . . . . . . . . . . . . . . . . . . . . . . . . . . . . . . . . . . . . . . . . $41 $36 Cash and cash equivalents . . . . . . . . . . . . . . . . . . . . . . . . . . . . . . . . . . . . . . . . . . . . . . . . . . . . $ 5 $ 5 For the years ended December 31, 2007, 2006 and 2005, there were no investment gains (losses) on transfers of assets from the general account to the separate accounts. Obligations Under Guaranteed Interest Contract Program The Company issues fixed and floating rate obligations under its GIC program which are denominated in either U.S. dollars or foreign currencies. During the years ended December 31, 2007, 2006 and 2005, the Company issued $5.2 billion, $5.2 billion and $4.0 billion, respectively, and repaid $4.3 billion, $2.6 billion and $1.1 billion, respectively, of GICs under this program. At December 31, 2007 and 2006, GICs outstanding, which are included in policyholder account balances, were $24.2 billion and $21.5 billion, respectively. During the years ended December 31, 2007, 2006 and 2005, interest credited on the contracts, which are included in interest credited to policyholder account balances, was $1.1 billion, $835 million and $464 million, respectively. Obligations Under Funding Agreements MetLife Insurance Company of Connecticut (“MICC”) is a member of the Federal Home Loan Bank of Boston (the “FHLB of Boston”) and holds $70 million of common stock of the FHLB of Boston at both December 31, 2007 and 2006, which is included in equity securities. MICC has also entered into funding agreements with the FHLB of Boston whereby MICC has issued such funding agreements in exchange for cash and for which the FHLB of Boston has been granted a blanket lien on certain MICC assets, including residential mortgage-backed securities, to collateralize MICC’s obligations under the funding agreements. MICC maintains control over these pledged assets, and may use, commingle, encumber or dispose of any portion of the collateral as long as there is no event of default and the remaining qualified collateral is sufficient to satisfy the collateral maintenance level. Upon any event of default by MICC, the FHLB of Boston’s recovery on the collateral is limited to the amount of MICC’s liability to the FHLB of Boston. The amount of the Company’s liability for funding agreements with the FHLB of Boston was $726 million and $926 million at December 31, 2007 and 2006, respectively, which is included in policyholder account balances. The advances on these funding agreements are collateralized by residential mortgage-backed securities with fair values of $901 million and $1.1 billion at December 31, 2007 and 2006, respectively. MLIC is a member of the Federal Home Loan Bank of New York (“FHLB of NY”) and holds $339 million and $136 million of common stock of the FHLB of NY at December 31, 2007 and 2006, respectively, which is included in equity securities. MLIC has also entered into funding agreements with the FHLB of NY whereby MLIC has issued such funding agreements in exchange for cash and for which the FHLB of NY has been granted a lien on certain MLIC assets, including residential mortgage-backed securities to collateralize MLIC’s obligations under the funding agreements. MLIC maintains control over these pledged assets, and may use, commingle, encumber or dispose of any portion of the collateral as long as there is no event of default and the remaining qualified collateral is sufficient to satisfy the collateral maintenance level. Upon any event of default by MLIC, the FHLB of NY’s recovery on the collateral is limited to the amount of MLIC’s liability to the FHLB of NY. The amount of the Company’s liability for funding agreements with the FHLB of NY was $4.6 billion at December 31, 2007, which is included in policyholder account balances. The advances on these agreements are collateralized by residential mortgage-backed securities with fair values of $4.8 billion at December 31, 2007. MLIC did not have any funding agreements with the FHLB of NY at December 31, 2006. MLIC has issued funding agreements to certain trusts that have issued securities guaranteed as to payment of interest and principal by the Federal Agricultural Mortgage Corporation, a federally chartered instrumentality of the United States. The obligations under these funding agreements are secured by a pledge of certain eligible agricultural real estate mortgage loans and may, under certain circum- stances, be secured by other qualified collateral. The amount of the Company’s liability for funding agreements issued to such trusts was $2.5 billion and $1.5 billion at December 31, 2007 and 2006, respectively, which is included in policyholder account balances. The obligations under these funding agreements are collateralized by designated agricultural real estate mortgage loans with fair values of $2.9 billion and $1.7 billion at December 31, 2007 and 2006, respectively. F-40 MetLife, Inc. MetLife, Inc. Notes to Consolidated Financial Statements — (Continued)
  • 137.
    Liabilities for UnpaidClaims and Claim Expenses Information regarding the liabilities for unpaid claims and claim expenses relating to property and casualty, group accident and non- medical health policies and contracts, which are reported in future policy benefits and other policyholder funds, is as follows: 2007 2006 2005 Years Ended December 31, (In millions) Balance at January 1, . . . . . . . . . . . . . . . . . . . . . . . . . . . . . . . . . . . . . . . . . . . . . . . . . $ 7,244 $ 6,977 $ 5,824 Less: Reinsurance recoverables . . . . . . . . . . . . . . . . . . . . . . . . . . . . . . . . . . . . . . . . . (937) (940) (486) Net balance at January 1, . . . . . . . . . . . . . . . . . . . . . . . . . . . . . . . . . . . . . . . . . . . . . . 6,307 6,037 5,338 Acquisitions, net . . . . . . . . . . . . . . . . . . . . . . . . . . . . . . . . . . . . . . . . . . . . . . . . . . . . — — 160 Incurred related to: Current year . . . . . . . . . . . . . . . . . . . . . . . . . . . . . . . . . . . . . . . . . . . . . . . . . . . . . . 5,796 5,064 4,940 Prior years . . . . . . . . . . . . . . . . . . . . . . . . . . . . . . . . . . . . . . . . . . . . . . . . . . . . . . . (325) (329) (180) 5,471 4,735 4,760 Paid related to: Current year . . . . . . . . . . . . . . . . . . . . . . . . . . . . . . . . . . . . . . . . . . . . . . . . . . . . . . (3,297) (2,975) (2,841) Prior years . . . . . . . . . . . . . . . . . . . . . . . . . . . . . . . . . . . . . . . . . . . . . . . . . . . . . . . (1,600) (1,490) (1,380) (4,897) (4,465) (4,221) Net balance at December 31, . . . . . . . . . . . . . . . . . . . . . . . . . . . . . . . . . . . . . . . . . . . . 6,881 6,307 6,037 Add: Reinsurance recoverables . . . . . . . . . . . . . . . . . . . . . . . . . . . . . . . . . . . . . . . . . 955 937 940 Balance at December 31, . . . . . . . . . . . . . . . . . . . . . . . . . . . . . . . . . . . . . . . . . . . . . . $ 7,836 $ 7,244 $ 6,977 During 2007 and 2006, as a result of changes in estimates of insured events in the respective prior year, claims and claim adjustment expenses associated with prior years decreased by $325 million and $329 million, respectively, due to a reduction in prior year automobile bodily injury and homeowners’ severity, reduced loss adjustment expenses, improved loss ratio for non-medical health claim liabilities and improved claim management. In 2005, the claims and claim adjustment expenses decreased by $180 million due to a reduction in prior year automobile bodily injury and homeowners’ severity as well as refinement in the estimation methodology for non-medical health long-term care claim liabilities. Guarantees The Company issues annuity contracts which may include contractual guarantees to the contractholder for: (i) return of no less than total deposits made to the contract less any partial withdrawals (“return of net deposits”); and (ii) the highest contract value on a specified anniversary date minus any withdrawals following the contract anniversary, or total deposits made to the contract less any partial withdrawals plus a minimum return (“anniversary contract value” or “minimum return”). The Company also issues annuity contracts that apply a lower rate of funds deposited if the contractholder elects to surrender the contract for cash and a higher rate if the contractholder elects to annuitize (“two tier annuities”). These guarantees include benefits that are payable in the event of death or at annuitization. The Company also issues universal and variable life contracts where the Company contractually guarantees to the contractholder a secondary guarantee or a guaranteed paid-up benefit. Information regarding the types of guarantees relating to annuity contracts and universal and variable life contracts is as follows: In the Event of Death At Annuitization In the Event of Death At Annuitization 2007 2006 December 31, (In millions) Annuity Contracts(1) Return of Net Deposits Separate account value . . . . . . . . . . . . . . . . . . . . . . . . . . . . . $ 18,573 N/A $ 13,809 N/A Net amount at risk(2). . . . . . . . . . . . . . . . . . . . . . . . . . . . . . . $ 52(3) N/A $ 1(3) N/A Average attained age of contractholders . . . . . . . . . . . . . . . . . . 61 years N/A 61 years N/A Anniversary Contract Value or Minimum Return Separate account value . . . . . . . . . . . . . . . . . . . . . . . . . . . . . $ 87,168 $ 29,603 $ 87,351 $ 24,647 Net amount at risk(2). . . . . . . . . . . . . . . . . . . . . . . . . . . . . . . $ 2,331(3) $ 441(4) $ 1,927(3) $ 65(4) Average attained age of contractholders . . . . . . . . . . . . . . . . . . 58 years 60 years 60 years 60 years Two Tier Annuities General account value . . . . . . . . . . . . . . . . . . . . . . . . . . . . . N/A $ 286 N/A $ 296 Net amount at risk(2). . . . . . . . . . . . . . . . . . . . . . . . . . . . . . . N/A $ 51(5) N/A $ 53(5) Average attained age of contractholders . . . . . . . . . . . . . . . . . . N/A 60 years N/A 58 years F-41MetLife, Inc. MetLife, Inc. Notes to Consolidated Financial Statements — (Continued)
  • 138.
    Secondary Guarantees Paid-Up Guarantees Secondary Guarantees Paid-Up Guarantees 2007 2006 December 31, (Inmillions) Universal and Variable Life Contracts(1) Account value (general and separate account) . . . . . . . . . . . . . . . . . . . . $ 9,347 $ 4,302 $ 8,357 $ 4,468 Net amount at risk(2) . . . . . . . . . . . . . . . . . . . . . . . . . . . . . . . . . . . . $141,840(3) $ 33,855(3) $131,808(3) $ 36,447(3) Average attained age of policyholders . . . . . . . . . . . . . . . . . . . . . . . . . 49 years 55 years 49 years 54 years (1) The Company’s annuity and life contracts with guarantees may offer more than one type of guarantee in each contract. Therefore, the amounts listed above may not be mutually exclusive. (2) The net amount at risk is based on the direct amount at risk (excluding reinsurance). (3) The net amount at risk for guarantees of amounts in the event of death is defined as the current guaranteed minimum death benefit in excess of the current account balance at the balance sheet date. (4) The net amount at risk for guarantees of amounts at annuitization is defined as the present value of the minimum guaranteed annuity payments available to the contractholder determined in accordance with the terms of the contract in excess of the current account balance. (5) The net amount at risk for two tier annuities is based on the excess of the upper tier, adjusted for a profit margin, less the lower tier. Information regarding the liabilities for guarantees (excluding base policy liabilities) relating to annuity and universal and variable life contracts is as follows: Guaranteed Death Benefits Guaranteed Annuitization Benefits Secondary Guarantees Paid Up Guarantees Total Annuity Contracts Universal and Variable Life Contracts (In millions) Balance at January 1, 2005 . . . . . . . . . . . . . . . . . . . . . . . . . $24 $19 $ 6 $29 $ 78 Incurred guaranteed benefits. . . . . . . . . . . . . . . . . . . . . . . . . 22 10 10 10 52 Paid guaranteed benefits . . . . . . . . . . . . . . . . . . . . . . . . . . . (5) — (1) — (6) Balance at December 31, 2005 . . . . . . . . . . . . . . . . . . . . . . . 41 29 15 39 124 Incurred guaranteed benefits. . . . . . . . . . . . . . . . . . . . . . . . . 17 7 29 1 54 Paid guaranteed benefits . . . . . . . . . . . . . . . . . . . . . . . . . . . (6) — — — (6) Balance at December 31, 2006 . . . . . . . . . . . . . . . . . . . . . . . 52 36 44 40 172 Incurred guaranteed benefits. . . . . . . . . . . . . . . . . . . . . . . . . 28 38 53 6 125 Paid guaranteed benefits . . . . . . . . . . . . . . . . . . . . . . . . . . . (8) — — — (8) Balance at December 31, 2007 . . . . . . . . . . . . . . . . . . . . . . . $72 $74 $97 $46 $289 Account balances of contracts with insurance guarantees are invested in separate account asset classes as follows: 2007 2006 December 31, (In millions) Mutual Fund Groupings Equity . . . . . . . . . . . . . . . . . . . . . . . . . . . . . . . . . . . . . . . . . . . . . . . . . . . . . . . . . . . . . . . . $69,477 $70,187 Bond . . . . . . . . . . . . . . . . . . . . . . . . . . . . . . . . . . . . . . . . . . . . . . . . . . . . . . . . . . . . . . . . 6,284 6,139 Balanced . . . . . . . . . . . . . . . . . . . . . . . . . . . . . . . . . . . . . . . . . . . . . . . . . . . . . . . . . . . . . . 15,977 4,403 Money Market. . . . . . . . . . . . . . . . . . . . . . . . . . . . . . . . . . . . . . . . . . . . . . . . . . . . . . . . . . . 1,775 1,302 Specialty . . . . . . . . . . . . . . . . . . . . . . . . . . . . . . . . . . . . . . . . . . . . . . . . . . . . . . . . . . . . . . 870 1,088 Total . . . . . . . . . . . . . . . . . . . . . . . . . . . . . . . . . . . . . . . . . . . . . . . . . . . . . . . . . . . . . . . $94,383 $83,119 8. Reinsurance The Company’s life insurance operations participate in reinsurance activities in order to limit losses, minimize exposure to large risks, and provide additional capacity for future growth. The Company has historically reinsured the mortality risk on new individual life insurance policies primarily on an excess of retention basis or a quota share basis. Until 2005, the Company reinsured up to 90% of the mortality risk for all new individual life insurance policies that it wrote through its various franchises. This practice was initiated by the different franchises for different products starting at various points in time between 1992 and 2000. During 2005, the Company changed its retention practices for certain individual life insurance. Amounts reinsured in prior years remain reinsured under the original reinsurance; however, under the new retention guidelines, the Company reinsures up to 90% of the mortality risk in excess of $1 million for most new individual life insurance policies that it writes through its various franchises and for certain individual life policies the retention limits remained unchanged. On a case by case basis, the Company may retain up to $20 million per life and reinsure 100% of amounts in excess of the Company’s retention limits. The Company evaluates its reinsurance programs routinely and may increase or decrease its retention at any time. In addition, the Company reinsures a significant portion of the mortality risk on its individual universal life policies issued since 1983. Placement of reinsurance is done primarily on an automatic basis and also on a facultative basis for risks with specific characteristics. F-42 MetLife, Inc. MetLife, Inc. Notes to Consolidated Financial Statements — (Continued)
  • 139.
    In addition toreinsuring mortality risk as described previously, the Company reinsures other risks, as well as specific coverages. The Company routinely reinsures certain classes of risks in order to limit its exposure to particular travel, avocation and lifestyle hazards. The Company has exposure to catastrophes, which could contribute to significant fluctuations in the Company’s results of operations. The Company uses excess of retention and quota share reinsurance arrangements to provide greater diversification of risk and minimize exposure to larger risks. The Company had also protected itself through the purchase of combination risk coverage. This reinsurance coverage pooled risks from several lines of business and included individual and group life claims in excess of $2 million per policy, as well as excess property and casualty losses, among others. This combination risk coverage was commuted during 2005. The Company reinsures its business through a diversified group of reinsurers. No single unaffiliated reinsurer has a material obligation to the Company nor is the Company’s business substantially dependent upon any reinsurance contracts. The Company is contingently liable with respect to ceded reinsurance should any reinsurer be unable to meet its obligations under these agreements. In the Reinsurance Segment, Reinsurance Group of America, Incorporated (“RGA”) retains a maximum of $6 million of coverage per individual life with respect to its assumed reinsurance business. The amounts in the consolidated statements of income are presented net of reinsurance ceded. Information regarding the effect of reinsurance is as follows: 2007 2006 2005 Years Ended December 31, (In millions) Direct premiums . . . . . . . . . . . . . . . . . . . . . . . . . . . . . . . . . . . . . . . . . . . . . . . . . . . $24,168 $23,324 $22,232 Reinsurance assumed . . . . . . . . . . . . . . . . . . . . . . . . . . . . . . . . . . . . . . . . . . . . . . . 6,181 5,294 4,646 Reinsurance ceded . . . . . . . . . . . . . . . . . . . . . . . . . . . . . . . . . . . . . . . . . . . . . . . . . (2,454) (2,206) (2,018) Net premiums. . . . . . . . . . . . . . . . . . . . . . . . . . . . . . . . . . . . . . . . . . . . . . . . . . . . . $27,895 $26,412 $24,860 Reinsurance recoverables netted against policyholder benefits and claims . . . . . . . . . . . . . $ 2,622 $ 2,313 $ 2,400 Reinsurance recoverables, included in premiums and other receivables, were $10.4 billion and $10.2 billion at December 31, 2007 and 2006, respectively, including $1.2 billion at both December 31, 2007 and 2006 relating to reinsurance of long-term GICs and structured settlement lump sum contracts accounted for as a financing transaction; $3.4 billion and $3.0 billion at December 31, 2007 and 2006, respectively, relating to reinsurance on the run-off of long-term care business written by Travelers; $1.2 billion and $1.3 billion at December 31, 2007 and 2006, respectively, relating to reinsurance on the run-off of workers compensation business written by Travelers; and $1.1 billion and $1.4 billion at December 31, 2007 and 2006, respectively, relating to the reinsurance of investment-type contracts held by small market defined benefit contribution plans. Reinsurance and ceded commissions payables, included in other liabilities, were $571 million and $275 million at December 31, 2007 and 2006, respectively. 9. Closed Block On April 7, 2000, (the “Demutualization Date”), MLIC converted from a mutual life insurance company to a stock life insurance company and became a wholly-owned subsidiary of MetLife, Inc. The conversion was pursuant to an order by the New York Superintendent of Insurance (the “Superintendent”) approving MLIC’s plan of reorganization, as amended (the “Plan”). On the Demutualization Date, MLIC established a closed block for the benefit of holders of certain individual life insurance policies of MLIC. Assets have been allocated to the closed block in an amount that has been determined to produce cash flows which, together with anticipated revenues from the policies included in the closed block, are reasonably expected to be sufficient to support obligations and liabilities relating to these policies, including, but not limited to, provisions for the payment of claims and certain expenses and taxes, and to provide for the continuation of policyholder dividend scales in effect for 1999, if the experience underlying such dividend scales continues, and for appropriate adjustments in such scales if the experience changes. At least annually, the Company compares actual and projected experience against the experience assumed in the then-current dividend scales. Dividend scales are adjusted periodically to give effect to changes in experience. The closed block assets, the cash flows generated by the closed block assets and the anticipated revenues from the policies in the closed block will benefit only the holders of the policies in the closed block. To the extent that, over time, cash flows from the assets allocated to the closed block and claims and other experience related to the closed block are, in the aggregate, more or less favorable than what was assumed when the closed block was established, total dividends paid to closed block policyholders in the future may be greater than or less than the total dividends that would have been paid to these policyholders if the policyholder dividend scales in effect for 1999 had been continued. Any cash flows in excess of amounts assumed will be available for distribution over time to closed block policyholders and will not be available to stockholders. If the closed block has insufficient funds to make guaranteed policy benefit payments, such payments will be made from assets outside of the closed block. The closed block will continue in effect as long as any policy in the closed block remains in-force. The expected life of the closed block is over 100 years. The Company uses the same accounting principles to account for the participating policies included in the closed block as it used prior to the Demutualization Date. However, the Company establishes a policyholder dividend obligation for earnings that will be paid to policyholders as additional dividends as described below. The excess of closed block liabilities over closed block assets at the effective date of the demutualization (adjusted to eliminate the impact of related amounts in accumulated other comprehensive income) represents the estimated maximum future earnings from the closed block expected to result from operations attributed to the closed block after income taxes. Earnings of the closed block are recognized in income over the period the policies and contracts in the closed block remain in-force. Management believes that over time the actual cumulative earnings of the closed block will approximately equal the expected cumulative earnings due to the effect of dividend changes. If, over the period the closed block remains in existence, the actual cumulative F-43MetLife, Inc. MetLife, Inc. Notes to Consolidated Financial Statements — (Continued)
  • 140.
    earnings of theclosed block is greater than the expected cumulative earnings of the closed block, the Company will pay the excess of the actual cumulative earnings of the closed block over the expected cumulative earnings to closed block policyholders as additional policyholder dividends unless offset by future unfavorable experience of the closed block and, accordingly, will recognize only the expected cumulative earnings in income with the excess recorded as a policyholder dividend obligation. If over such period, the actual cumulative earnings of the closed block is less than the expected cumulative earnings of the closed block, the Company will recognize only the actual earnings in income. However, the Company may change policyholder dividend scales in the future, which would be intended to increase future actual earnings until the actual cumulative earnings equal the expected cumulative earnings. Information regarding the closed block liabilities and assets designated to the closed block is as follows: 2007 2006 December 31, (In millions) Closed Block Liabilities Future policy benefits . . . . . . . . . . . . . . . . . . . . . . . . . . . . . . . . . . . . . . . . . . . . . . . . . . . . . . . . . . . . . $43,362 $43,089 Other policyholder funds . . . . . . . . . . . . . . . . . . . . . . . . . . . . . . . . . . . . . . . . . . . . . . . . . . . . . . . . . . . 323 282 Policyholder dividends payable . . . . . . . . . . . . . . . . . . . . . . . . . . . . . . . . . . . . . . . . . . . . . . . . . . . . . . . 709 701 Policyholder dividend obligation . . . . . . . . . . . . . . . . . . . . . . . . . . . . . . . . . . . . . . . . . . . . . . . . . . . . . . 789 1,063 Payables for collateral under securities loaned and other transactions . . . . . . . . . . . . . . . . . . . . . . . . . . . . . . 5,610 6,483 Other liabilities . . . . . . . . . . . . . . . . . . . . . . . . . . . . . . . . . . . . . . . . . . . . . . . . . . . . . . . . . . . . . . . . . 290 192 Total closed block liabilities . . . . . . . . . . . . . . . . . . . . . . . . . . . . . . . . . . . . . . . . . . . . . . . . . . . . . . . . 51,083 51,810 Assets Designated to the Closed Block Investments: Fixed maturity securities available-for-sale, at estimated fair value (amortized cost: $29,631 and $30,286, respectively) . . . . . . . . . . . . . . . . . . . . . . . . . . . . . . . . . . . . . . . . . . . . . . . . . . . . . . . . . . . . . . . . 30,481 31,255 Equity securities available-for-sale, at estimated fair value (cost: $1,555 and $1,184, respectively) . . . . . . . . . 1,875 1,484 Mortgage loans on real estate . . . . . . . . . . . . . . . . . . . . . . . . . . . . . . . . . . . . . . . . . . . . . . . . . . . . . . 7,472 7,848 Policy loans . . . . . . . . . . . . . . . . . . . . . . . . . . . . . . . . . . . . . . . . . . . . . . . . . . . . . . . . . . . . . . . . . . 4,290 4,212 Real estate and real estate joint ventures held-for-investment . . . . . . . . . . . . . . . . . . . . . . . . . . . . . . . . . . 297 242 Short-term investments . . . . . . . . . . . . . . . . . . . . . . . . . . . . . . . . . . . . . . . . . . . . . . . . . . . . . . . . . . 14 62 Other invested assets . . . . . . . . . . . . . . . . . . . . . . . . . . . . . . . . . . . . . . . . . . . . . . . . . . . . . . . . . . . 829 644 Total investments . . . . . . . . . . . . . . . . . . . . . . . . . . . . . . . . . . . . . . . . . . . . . . . . . . . . . . . . . . . . . 45,258 45,747 Cash and cash equivalents . . . . . . . . . . . . . . . . . . . . . . . . . . . . . . . . . . . . . . . . . . . . . . . . . . . . . . . . . 333 255 Accrued investment income . . . . . . . . . . . . . . . . . . . . . . . . . . . . . . . . . . . . . . . . . . . . . . . . . . . . . . . . . 485 517 Deferred income tax assets . . . . . . . . . . . . . . . . . . . . . . . . . . . . . . . . . . . . . . . . . . . . . . . . . . . . . . . . . 640 754 Premiums and other receivables . . . . . . . . . . . . . . . . . . . . . . . . . . . . . . . . . . . . . . . . . . . . . . . . . . . . . . 151 156 Total assets designated to the closed block . . . . . . . . . . . . . . . . . . . . . . . . . . . . . . . . . . . . . . . . . . . . . 46,867 47,429 Excess of closed block liabilities over assets designated to the closed block . . . . . . . . . . . . . . . . . . . . . . . . . 4,216 4,381 Amounts included in accumulated other comprehensive income (loss): Unrealized investment gains (losses), net of income tax of $424 and $457, respectively . . . . . . . . . . . . . . . . 751 812 Unrealized gains (losses) on derivative instruments, net of income tax of ($19) and ($18), respectively . . . . . . . (33) (32) Allocated to policyholder dividend obligation, net of income tax of ($284) and ($381), respectively . . . . . . . . . . (505) (681) Total amounts included in accumulated other comprehensive income (loss). . . . . . . . . . . . . . . . . . . . . . . . . 213 99 Maximum future earnings to be recognized from closed block assets and liabilities . . . . . . . . . . . . . . . . . . . . . $ 4,429 $ 4,480 Information regarding the closed block policyholder dividend obligation is as follows: 2007 2006 2005 Years Ended December 31, (In millions) Balance at January 1, . . . . . . . . . . . . . . . . . . . . . . . . . . . . . . . . . . . . . . . . . . . . . . . . . . $1,063 $1,607 $2,243 Impact on revenues, net of expenses and income tax . . . . . . . . . . . . . . . . . . . . . . . . . . . . . — (114) (9) Change in unrealized investment and derivative gains (losses) . . . . . . . . . . . . . . . . . . . . . . . . (274) (430) (627) Balance at December 31, . . . . . . . . . . . . . . . . . . . . . . . . . . . . . . . . . . . . . . . . . . . . . . . $ 789 $1,063 $1,607 F-44 MetLife, Inc. MetLife, Inc. Notes to Consolidated Financial Statements — (Continued)
  • 141.
    Information regarding theclosed block revenues and expenses is as follows: 2007 2006 2005 Years Ended December 31, (In millions) Revenues Premiums . . . . . . . . . . . . . . . . . . . . . . . . . . . . . . . . . . . . . . . . . . . . . . . . . . . . . . . . . . $2,870 $2,959 $3,062 Net investment income and other revenues . . . . . . . . . . . . . . . . . . . . . . . . . . . . . . . . . . . . 2,350 2,355 2,382 Net investment gains (losses) . . . . . . . . . . . . . . . . . . . . . . . . . . . . . . . . . . . . . . . . . . . . . 28 (130) 10 Total revenues . . . . . . . . . . . . . . . . . . . . . . . . . . . . . . . . . . . . . . . . . . . . . . . . . . . . . 5,248 5,184 5,454 Expenses Policyholder benefits and claims . . . . . . . . . . . . . . . . . . . . . . . . . . . . . . . . . . . . . . . . . . . 3,457 3,474 3,478 Policyholder dividends. . . . . . . . . . . . . . . . . . . . . . . . . . . . . . . . . . . . . . . . . . . . . . . . . . 1,492 1,479 1,465 Change in policyholder dividend obligation . . . . . . . . . . . . . . . . . . . . . . . . . . . . . . . . . . . . — (114) (9) Other expenses . . . . . . . . . . . . . . . . . . . . . . . . . . . . . . . . . . . . . . . . . . . . . . . . . . . . . . 231 247 263 Total expenses . . . . . . . . . . . . . . . . . . . . . . . . . . . . . . . . . . . . . . . . . . . . . . . . . . . . . 5,180 5,086 5,197 Revenues, net of expenses before income tax . . . . . . . . . . . . . . . . . . . . . . . . . . . . . . . . . . 68 98 257 Income tax . . . . . . . . . . . . . . . . . . . . . . . . . . . . . . . . . . . . . . . . . . . . . . . . . . . . . . . . . 21 34 90 Revenues, net of expenses and income tax from continuing operations . . . . . . . . . . . . . . . . . . 47 64 167 Revenues, net of expenses and income tax from discontinued operations . . . . . . . . . . . . . . . . — 1 — Revenues, net of expenses, income taxes and discontinued operations . . . . . . . . . . . . . . . . . . $ 47 $ 65 $ 167 The change in the maximum future earnings of the closed block is as follows: 2007 2006 2005 Years Ended December 31, (In millions) Balance at December 31, . . . . . . . . . . . . . . . . . . . . . . . . . . . . . . . . . . . . . . . . . . . . . . . $4,429 $4,480 $4,545 Less: Cumulative effect of a change in accounting principle, net of income tax . . . . . . . . . . . . . . . . (4) — — Balance at January 1, . . . . . . . . . . . . . . . . . . . . . . . . . . . . . . . . . . . . . . . . . . . . . . . . . . 4,480 4,545 4,712 Change during year . . . . . . . . . . . . . . . . . . . . . . . . . . . . . . . . . . . . . . . . . . . . . . . . . . . $ (47) $ (65) $ (167) MLIC charges the closed block with federal income taxes, state and local premium taxes, and other additive state or local taxes, as well as investment management expenses relating to the closed block as provided in the Plan. MLIC also charges the closed block for expenses of maintaining the policies included in the closed block. 10. Long-term and Short-term Debt Long-term and short-term debt outstanding is as follows: Range Weighted Average Maturity 2007 2006 December 31, Interest Rates (In millions) Senior notes . . . . . . . . . . . . . . . . . . . . . . . . . . . . . . . . . . . . . . . 5.00%-6.75% 5.60% 2011-2035 $ 7,515 $ 7,196 Repurchase agreements . . . . . . . . . . . . . . . . . . . . . . . . . . . . . . . 2.83%-5.65% 4.49% 2008-2013 1,213 998 Surplus notes . . . . . . . . . . . . . . . . . . . . . . . . . . . . . . . . . . . . . . 7.63%-7.88% 7.76% 2015-2025 697 697 Fixed rate notes . . . . . . . . . . . . . . . . . . . . . . . . . . . . . . . . . . . . 5.50%-7.25% 6.68% 2008 73 107 Other notes with varying interest rates . . . . . . . . . . . . . . . . . . . . . . 3.44%-6.10% 4.99% 2009-2012 75 68 Capital lease obligations . . . . . . . . . . . . . . . . . . . . . . . . . . . . . . . 55 63 Total long-term debt . . . . . . . . . . . . . . . . . . . . . . . . . . . . . . . . . . 9,628 9,129 Total short-term debt . . . . . . . . . . . . . . . . . . . . . . . . . . . . . . . . . 667 1,449 Total. . . . . . . . . . . . . . . . . . . . . . . . . . . . . . . . . . . . . . . . . . . $10,295 $10,578 The aggregate maturities of long-term debt as of December 31, 2007 for the next five years are $458 million in 2008, $536 million in 2009, $285 million in 2010, $966 million in 2011, $471 million in 2012 and $6,912 million thereafter. Repurchase agreements and capital lease obligations are collateralized and rank highest in priority, followed by unsecured senior debt which consists of senior notes, fixed rate notes and other notes with varying interest rates, followed by subordinated debt which consists of junior subordinated debentures. Payments of interest and principal on the Company’s surplus notes, which are subordinate to all other obligations at the operating company level and senior to obligations at the Holding Company, may be made only with the prior approval of the insurance department of the state of domicile. Collateral financing arrangements are supported by either surplus notes of subsidiaries or financing arrangements with the Holding Company and accordingly have priority consistent with other such obligations. F-45MetLife, Inc. MetLife, Inc. Notes to Consolidated Financial Statements — (Continued)
  • 142.
    Senior Notes In March2007, RGA issued $300 million of 10-year senior notes with a fixed rate of 5.625%, payable semiannually. RGA used $50 million of the net proceeds of the offering to repay existing debt during the year ended December 31, 2007. The Holding Company repaid a $500 million 5.25% senior note which matured in December 2006 and a $1,006 million 3.911% senior note which matured in May 2005. RGA repaid a $100 million 7.25% senior note which matured in April 2006. In connection with financing the acquisition of Travelers on July 1, 2005, which is described in Note 2, the Holding Company issued the following debt: In June 2005, the Holding Company issued $1,000 million aggregate principal amount of 5.00% senior notes due June 15, 2015 at a discount of $2.7 million ($997.3 million) and $1,000 million aggregate principal amount of 5.70% senior notes due June 15, 2035 at a discount of $2.4 million ($997.6 million). In connection with the offering, the Holding Company incurred $12.4 million of issuance costs which have been capitalized and included in other assets. These costs are being amortized using the effective interest method over the respective term of the related senior notes. In June 2005, the Holding Company issued 400 million pounds sterling ($729.2 million at issuance) aggregate principal amount of 5.25% senior notes due June 29, 2020 at a discount of 4.5 million pounds sterling ($8.1 million at issuance), for aggregate proceeds of 395.5 million pounds sterling ($721.1 million at issuance). The senior notes were initially offered and sold outside the United States in reliance upon Regulation S under the Securities Act of 1933, as amended (the “Securities Act”). In connection with the offering, the Holding Company incurred $3.7 million of issuance costs which have been capitalized and included in other assets. These costs are being amortized using the effective interest method over the term of the related senior notes. Repurchase Agreements with Federal Home Loan Bank MetLife Bank, National Association (“MetLife Bank”) is a member of the FHLB of NY and holds $64 million and $54 million of common stock of the FHLB of NY at December 31, 2007 and 2006, respectively, which is included in equity securities. MetLife Bank has also entered into repurchase agreements with the FHLB of NY whereby MetLife Bank has issued repurchase agreements in exchange for cash and for which the FHLB of NY has been granted a blanket lien on MetLife Bank’s residential mortgages and mortgage-backed securities to collateralize MetLife Bank’s obligations under the repurchase agreements. MetLife Bank maintains control over these pledged assets, and may use, commingle, encumber or dispose of any portion of the collateral as long as there is no event of default and the remaining qualified collateral is sufficient to satisfy the collateral maintenance level. The repurchase agreements and the related security agreement represented by this blanket lien provide that upon any event of default by MetLife Bank, the FHLB of NY’s recovery is limited to the amount of MetLife Bank’s liability under the outstanding repurchase agreements. During the years ended December 31, 2007, 2006 and 2005, MetLife Bank received advances totaling $390 million, $260 million and $775 million, respectively, from the FHLB of NY. MetLife Bank also made repayments of $175 million, $117 million and $25 million, respectively, for the years ended December 31, 2007, 2006 and 2005. The amount of the Company’s liability for repurchase agreements with the FHLB of NY was $1.2 billion and $998 million at December 31, 2007 and 2006, respectively, which is included in long-term debt. The advances on these repurchase agreements are collateralized by residential mortgage-backed securities and residential mortgage loans with fair values of $1.3 billion at both December 31, 2007 and 2006. Surplus Notes MLIC repaid a $250 million 7% surplus note which matured on November 1, 2005. Short-term Debt During the years ended December 31, 2007, 2006 and 2005, the Company’s short-term debt consisted of commercial paper with a weighted average interest rate of 5.0%, 5.2% and 3.4%, respectively. During the years ended December 31, 2007, 2006 and 2005, the commercial paper’s average daily balance was $1.6 billion, $1.9 billion and $1.0 billion, respectively, and was outstanding for an average of 30 days, 39 days and 53 days, respectively. Interest Expense Interest expense related to the Company’s indebtedness included in other expenses was $633 million, $664 million and $529 million for the years ended December 31, 2007, 2006 and 2005, respectively, and does not include interest expense on collateral financing arrangements, junior subordinated debt securities, common equity units or shares subject to mandatory redemption. See Notes 11, 12, 13 and 14. F-46 MetLife, Inc. MetLife, Inc. Notes to Consolidated Financial Statements — (Continued)
  • 143.
    Credit and CommittedFacilities and Letters of Credit Credit Facilities. The Company maintains committed and unsecured credit facilities aggregating $4.0 billion as of December 31, 2007. When drawn upon, these facilities bear interest at varying rates in accordance with the respective agreements. The facilities can be used for general corporate purposes and at December 31, 2007, $3.0 billion of the facilities also served as back-up lines of credit for the Company’s commercial paper programs. Information on these credit facilities as of December 31, 2007 is as follows: Borrower(s) Expiration Capacity Letter of Credit Issuances Drawdowns Unused Commitments (In millions) MetLife, Inc. and MetLife Funding, Inc. . . . . . . . . . . . . . . . . . . . . . . June 2012 (1) $3,000 $1,532 $— $1,468 MetLife Bank, N.A . . . . . . . . . . . . . . . . . . . . . . . . . . . . . . . . . . . . July 2008 (2) 200 — — 200 Reinsurance Group of America, Incorporated . . . . . . . . . . . . . . . . . . . May 2008 30 — 30 — Reinsurance Group of America, Incorporated . . . . . . . . . . . . . . . . . . . September 2012(3) 750 406 — 344 Reinsurance Group of America, Incorporated . . . . . . . . . . . . . . . . . . . March 2011 44 — — 44 Total . . . . . . . . . . . . . . . . . . . . . . . . . . . . . . . . . . . . . . . . . . . $4,024 $1,938 $30 $2,056 (1) In June 2007, the Holding Company and MetLife Funding, Inc. entered into a $3.0 billion credit agreement with various financial institutions, the proceeds of which are available to be used for general corporate purposes, to support their commercial paper programs and for the issuance of letters of credit. All borrowings under the credit agreement must be repaid by June 2012, except that letters of credit outstanding upon termination may remain outstanding until June 2013. The borrowers and the lenders under this facility may agree to extend the term of all or part of the facility to no later than June 2014, except that letters of credit outstanding upon termination may remain outstanding until June 2015. The $1.5 billion credit agreement, with an April 2009 expiration, and the $1.5 billion credit agreement, with an April 2010 expiration, were both terminated in June 2007 and replaced by the aforementioned facility. (2) In July 2007, the facility was extended for one year to July 2008. (3) In September 2007, RGA and certain of its subsidiaries entered into a credit agreement with various financial institutions. Under the credit agreement, RGA may borrow and obtain letters of credit for general corporate purposes for its own account or for the account of its subsidiaries with an overall credit facility amount of up to $750 million. The credit agreement replaced a former credit agreement in the amount of $600 million which was scheduled to expire on September 29, 2010. Committed Facilities. Information on committed facilities as of December 31, 2007 is as follows: Account Party/Borrower(s) Expiration Capacity Drawdowns Letter of Credit Issuances Unused Commitments Maturity (Years) (In millions) Exeter Reassurance Company Ltd., MetLife, Inc., & Missouri Re . . . . . . . . . . . . . . . . . . . . . . . . . June 2016 (1) $ 500 $ — $ 490 $ 10 8 Exeter Reassurance Company Ltd. . . . . . . . . . . . December 2027 (2) 650 — 410 240 20 Timberlake Financial L.L.C. . . . . . . . . . . . . . . . . June 2036 (3) 1,000 850 — 150 29 MetLife Reinsurance Company of South Carolina & MetLife, Inc. . . . . . . . . . . . . . . . . . . . . . . . . June 2037 (4) 3,500 2,382 — 1,118 30 MetLife Reinsurance Company of Vermont & MetLife, Inc. . . . . . . . . . . . . . . . . . . . . . . . . December 2037(2),(5) 2,896 — 1,235 1,661 30 Total . . . . . . . . . . . . . . . . . . . . . . . . . . . . . $8,546 $3,232 $2,135 $3,179 (1) Letters of credit and replacements or renewals thereof issued under this facility of $280 million, $10 million and $200 million are set to expire no later than December 2015, March 2016 and June 2016, respectively. (2) The Holding Company is a guarantor under this agreement. (3) As described in Note 11, RGA may, at its option, offer up to $150 million of additional notes under this facility in the future. (4) In May 2007, MetLife Reinsurance Company of South Carolina (“MRSC”), a wholly-owned subsidiary of the Company, terminated the $2.0 billion amended and restated five-year letter of credit and reimbursement agreement entered into among the Holding Company, MRSC and various financial institutions on April 25, 2005. In its place, the Company entered into a 30-year collateral financing arrangement as described in Note 11, which may be extended by agreement of the Company and the financial institution on each anniversary of the closing of the facility for an additional one-year period. As of December 31, 2007, $2.4 billion had been drawn upon under the collateral financing arrangement. (5) In December 2007, Exeter Reassurance Company Ltd. (“Exeter”) terminated four letters of credit, with expirations from March 2025 through December 2026, that were issued under a letter of credit facility with an unaffiliated financial institution in an aggregate amount of $1.7 billion. The letters of credit had served as collateral for Exeter’s obligations under a reinsurance agreement that was recaptured by MLI-USA in December 2007. MLI-USA immediately thereafter entered into a new reinsurance agreement with MetLife Reinsurance Company of Vermont (“MRV”). To collateralize its reinsurance obligations, MRV and the Holding Company entered into a 30-year, $2.9 billion letter of credit facility with an unaffiliated financial institution. Letters of Credit. At December 31, 2007, the Company had outstanding $4.2 billion in letters of credit, all of which are associated with the aforementioned credit facilities, from various financial institutions, of which $2.1 billion and $1.9 billion were part of committed and F-47MetLife, Inc. MetLife, Inc. Notes to Consolidated Financial Statements — (Continued)
  • 144.
    credit facilities, respectively.As commitments associated with letters of credit and financing arrangements may expire unused, these amounts do not necessarily reflect the Company’s actual future cash funding requirements. 11. Collateral Financing Arrangements Associated with the Closed Block In December 2007, MLIC reinsured a portion of its closed block liabilities to MetLife Reinsurance Company of Charleston (“MRC”), a wholly-owned subsidiary of the Company. In connection with this transaction, MRC issued, to investors placed by an unaffiliated financial institution, $2.5 billion of 35-year surplus notes to provide statutory reserve support for the assumed closed block liabilities. Interest on the surplus notes accrues at an annual rate of 3-month LIBOR plus 55 basis points, payable quarterly. The ability of MRC to make interest and principal payments on the surplus notes is contingent upon South Carolina regulatory approval. Simultaneous with issuing the surplus notes, the Holding Company entered into an agreement with the unaffiliated financial institution, under which the Holding Company is entitled to the interest paid by MRC on the surplus notes of 3-month LIBOR plus 55 basis points in exchange for the payment of 3-month LIBOR plus 112 basis points, payable quarterly. Under this agreement, the Holding Company may also be required to make payments to the unaffiliated financial institution related to any decline in the market value of the surplus notes and in connection with any early termination of this agreement. A majority of the proceeds from the offering of the surplus notes were placed in trust to support MRC’s statutory obligations associated with the assumed closed block liabilities. The trust is a VIE which is consolidated by the Company. At December 31, 2007, the Company held assets in trust of $1.9 billion associated with the transaction. The Company’s consolidated balance sheet includes these assets as fixed maturity securities. The Company’s consolidated statement of income includes the investment returns on the assets held as collateral as net investment income and the interest on the collateral financing arrangement is included as a component of other expenses. Total interest expense was $5 million for the year ended December 31, 2007. Associated with Secondary Guarantees In May 2007, the Holding Company and MRSC entered into a 30-year collateral financing arrangement with an unaffiliated financial institution that provides up to $3.5 billion of statutory reserve support for MRSC associated with reinsurance obligations under intercompany reinsurance agreements. Such statutory reserves are associated with universal life secondary guarantees and are required under U.S. Valuation of Life Policies Model Regulation (commonly referred to as Regulation A-XXX). At December 31, 2007, $2.4 billion had been drawn upon under the collateral financing arrangement. The collateral financing arrangement may be extended by agreement of the Holding Company and the unaffiliated financial institution on each anniversary of the closing. Proceeds from the collateral financing arrangement were placed in trust to support MRSC’s statutory obligations associated with the reinsurance of secondary guarantees. The trust is a VIE which is consolidated by the Company. The unaffiliated financial institution is entitled to the return on the investment portfolio held by the trust. Simultaneous with entering into the collateral financing arrangement, the Holding Company entered into an agreement with the same unaffiliated financial institution under which the Holding Company is entitled to the return on the investment portfolio held by the trust established in connection with this collateral financing arrangement in exchange for the payment of a stated rate of return to the unaffiliated financial institution of 3-month LIBOR plus 70 basis points, payable quarterly. The Holding Company may also be required to make payments to the unaffiliated financial institution, for deposit into the trust, related to any decline in the market value of the assets held by the trust, as well as amounts outstanding upon maturity or early termination of the collateral financing arrangement. At December 31, 2007, the Company held assets in trust of $2.3 billion associated with this transaction. The Company’s consolidated balance sheet includes these assets as fixed maturity securities. The Company’s consolidated statement of income includes the investment returns on the assets held as collateral as net investment income and the interest on the collateral financing arrangement is included as a component of other expenses. Transaction costs associated with the collateral financing arrangement of $5 million have been capitalized, are included in other assets, and are amortized using the effective interest method over the period from the issuance of the collateral financing arrangement to its expiration. Total interest expense was $84 million for the year ended December 31, 2007. Associated with RGA In June 2006, Timberlake Financial L.L.C., (“Timberlake Financial”), a subsidiary of RGA, completed an offering of $850 million of Series A Floating Rate Insured Notes due June 2036 in a private placement. Interest on the notes accrues at an annual rate of 1-month LIBOR plus 29 basis points payable monthly. The payment of interest and principal on the notes is insured through a financial guaranty insurance policy with a third party. The notes represent senior, secured indebtedness of Timberlake Financial with no recourse to RGA or its other subsidiaries. Up to $150 million of additional notes may be offered in the future. In order to make payments of principal and interest on the notes, Timberlake Financial will rely upon the receipt of interest and principal payments on surplus note and dividend payments from its wholly-owned subsidiary, Timberlake Reinsurance Company II (“Timberlake Re”), a South Carolina captive insurance company. The ability of Timberlake Re to make interest and principal payments on the surplus note and dividend payments to Timberlake Financial is contingent upon South Carolina regulatory approval and the performance of specified term life insurance policies with guaranteed level premiums retroceded by RGA’s subsidiary, RGA Reinsurance Company (“RGA Reinsurance”), to Timberlake Re. Proceeds from the offering of the notes, along with a $113 million direct investment by RGA, collateralize the notes and are not available to satisfy the general obligations of RGA or the Company. Most of these assets were placed in a trust and provide long-term collateral as support for statutory reserves required by U.S. Valuation of Life Policies Model Regulation (commonly referred to as Regulation XXX) on term life insurance policies with guaranteed level premium periods reinsured by RGA Reinsurance. The trust is consolidated by Timberlake Re which in-turn is consolidated by Timberlake Financial. Timberlake Financial is considered to be a VIE and RGA is considered to be the primary beneficiary. As such, the results of Timberlake Financial have been consolidated by RGA and ultimately by the Company. F-48 MetLife, Inc. MetLife, Inc. Notes to Consolidated Financial Statements — (Continued)
  • 145.
    At December 31,2007, the Company held assets in trust of $899 million associated with the transaction. In addition the Company held $50 million in custody as of December 31, 2007. The Company’s consolidated balance sheets include the assets of Timberlake Financial recorded as fixed maturity securities and other invested assets, which consists of the restricted cash and cash equivalents held in custody. The Company’s consolidated statements of income include the investment returns on the assets held as collateral as investment income and the interest on the notes is included as a component of other expenses. Issuance costs associated with the offering of the notes of $13 million have been capitalized, are included in other assets, and are amortized using the effective interest method over the estimated life of the notes. Total interest expense was $52 million and $26 million for the years ended December 31, 2007 and 2006, respectively. 12. Junior Subordinated Debentures Junior Subordinated Debentures Underlying Common Equity Units In connection with the acquisition of Travelers on July 1, 2005, the Holding Company issued on June 21, 2005 $1,067 million 4.82% Series A and $1,067 million 4.91% Series B junior subordinated debentures due no later than February 15, 2039 and February 15, 2040, respectively, for a total of $2,134 million in connection with the common equity units more fully described in Note 13. Interest expense related to the junior subordinated debentures underlying common equity units was $104 million, $104 million and $55 million for the years ended December 31, 2007, 2006 and 2005, respectively. Other Junior Subordinated Debentures Issued by the Holding Company In December 2006, the Holding Company issued junior subordinated debentures with a face amount of $1.25 billion. The debentures are scheduled for redemption on December 15, 2036; the final maturity of the debentures is December 15, 2066. The Holding Company may redeem the debentures (i) in whole or in part, at any time on or after December 15, 2031 at their principal amount plus accrued and unpaid interest to the date of redemption, or (ii) in certain circumstances, in whole or in part, prior to December 15, 2031 at their principal amount plus accrued and unpaid interest to the date of redemption or, if greater, a make-whole price. Interest is payable semi-annually at a fixed rate of 6.40% up to, but not including, December 15, 2036, the scheduled redemption date. In the event the debentures are not redeemed on or before the scheduled redemption date, interest will accrue at an annual rate of 3-month LIBOR plus a margin equal to 2.205%, payable quarterly in arrears. The Holding Company has the right to, and in certain circumstances the requirement to, defer interest payments on the debentures for a period up to ten years. Interest compounds during such periods of deferral. If interest is deferred for more than five consecutive years, the Holding Company may be required to use proceeds from the sale of its common stock or warrants on common stock to satisfy its obligation. In connection with the issuance of the debentures, the Holding Company entered into a replacement capital covenant (“RCC”). As part of the RCC, the Holding Company agreed that it will not repay, redeem, or purchase the debentures on or before December 15, 2056, unless, subject to certain limitations, it has received proceeds from the sale of specified capital securities. The RCC will terminate upon the occurrence of certain events, including an acceleration of the debentures due to the occurrence of an event of default. The RCC is not intended for the benefit of holders of the debentures and may not be enforced by them. The RCC is for the benefit of holders of one or more other designated series of its indebtedness (which will initially be its 5.70% senior notes due June 15, 2035). The Holding Company also entered into a replacement capital obligation which will commence in 2036 and under which the Holding Company must use reasonable commercial efforts to raise replacement capital through the issuance of certain qualifying capital securities. Issuance costs associated with the offering of the debentures of $13 million have been capitalized, are included in other assets, and are amortized using the effective interest method over the period from the issuance date of the debentures until their scheduled redemption. Interest expense on the debentures was $80 million and $2 million for the years ended December 31, 2007 and 2006, respectively. In December 2007, MetLife Capital Trust IV (“Trust IV”), a VIE consolidated by the Company, issued exchangeable surplus trust securities (the “Trust Securities”) with a face amount of $700 million and a discount of $6 million ($694 million). The Trust Securities will be exchanged into a like amount of Holding Company junior subordinated debentures on December 15, 2037, the scheduled redemption date; mandatorily under certain circumstances; and at any time upon the Holding Company exercising its option to redeem the securities. The Trust Securities will be exchanged for junior subordinated debentures prior to repayment. The final maturity of the debentures is December 15, 2067. The Holding Company may cause the redemption of the Trust Securities or debentures (i) in whole or in part, at any time on or after December 15, 2032 at their principal amount plus accrued and unpaid interest to the date of redemption, or (ii) in certain circumstances, in whole or in part, prior to December 15, 2032 at their principal amount plus accrued and unpaid interest to the date of redemption or, if greater, a make-whole price. Interest on the Trust Securities or debentures is payable semi-annually at a fixed rate of 7.875% up to, but not including, December 15, 2037, the scheduled redemption date. In the event the Trust Securities or debentures are not redeemed on or before the scheduled redemption date, interest will accrue at an annual rate of 3-month LIBOR plus a margin equal to 3.96%, payable quarterly in arrears. The Holding Company has the right to, and in certain circumstances the requirement to, defer interest payments on the Trust Securities or debentures for a period up to ten years. Interest compounds during such periods of deferral. If interest is deferred for more than five consecutive years, the Holding Company may be required to use proceeds from the sale of its common stock or warrants on common stock to satisfy its obligation. In connection with the issuance of the Trust Securities, the Holding Company entered into a RCC. As a part of the RCC, the Holding Company agreed that it will not repay, redeem, or purchase the debentures on or before December 15, 2057, unless, subject to certain limitations, it has received proceeds from the sale of specified capital securities. The RCC will terminate upon the occurrence of certain events, including an acceleration of the debentures due to the occurrence of an event of default. The RCC is not intended for the benefit of holders of the debentures and may not be enforced by them. The RCC is for the benefit of holders of one or more other designated series of its indebtedness (which will initially be its 5.70% senior notes due June 15, 2035). The Holding Company also entered into a replacement capital obligation which will commence in 2037 and under which the Holding Company must use reasonable commercial efforts to raise replacement capital through the issuance of certain qualifying capital securities. Issuance costs associated with the offering of the Trust Securities of $10 million have been capitalized, are included in other assets, and are F-49MetLife, Inc. MetLife, Inc. Notes to Consolidated Financial Statements — (Continued)
  • 146.
    amortized using theeffective interest method over the period from the issuance date of the Trust Securities until their scheduled redemption. Interest expense on the Trust Securities was $3 million for the year ended December 31, 2007. Junior Subordinated Debentures Issued by RGA In December 2005, RGA issued junior subordinated debentures with a face amount of $400 million. Interest is payable semi-annually at a fixed rate of 6.75% up to but not including the scheduled redemption date, December 15, 2015. The debentures may be redeemed (i) in whole or in part, at any time on or after December 15, 2015 at their principal amount plus accrued and unpaid interest to the date of redemption, or (ii) in whole or in part, prior to December 15, 2015 at their principal amount plus accrued and unpaid interest to the date of redemption or, if greater, a make-whole price. In the event the debentures are not redeemed on or before the scheduled redemption date of December 15, 2015, interest on these debentures will accrue at an annual rate of 3-month LIBOR plus a margin equal to 2.665%, payable quarterly in arrears. The final maturity of the debentures is December 15, 2065. RGA has the right to, and in certain circumstances the requirement to, defer interest payments on the debentures for a period up to ten years. Upon an optional or mandatory deferral of interest payments, RGA is generally not permitted to pay common stock dividends or make payments of interest or principal on securities which rank equal or junior to the subordinated debentures, until the accrued and unpaid interest on the subordinated debentures is paid. Interest compounds during periods of deferral. Issuance costs associated with the offering of the debentures of $6 million have been capitalized, are included in other assets, and are amortized using the effective interest method over the period from the issuance date of the debentures until their scheduled redemption. Interest expense on the debentures was $27 million, $27 million and $2 million for the years ended December 31, 2007, 2006 and 2005, respectively. 13. Common Equity Units In connection with financing the acquisition of Travelers on July 1, 2005, which is described in Note 2, the Holding Company distributed and sold 82.8 million 6.375% common equity units for $2,070 million in proceeds in a registered public offering on June 21, 2005. As described below, the common equity units consist of interests in trust preferred securities issued by MetLife Capital Trusts II and III, and stock purchase contracts issued by the Holding Company. The only assets of MetLife Capital Trusts II and III are junior subordinated debentures issued by the Holding Company. Common Equity Units Each common equity unit has an initial stated amount of $25 per unit and consists of: (i) a 1/80 or 1.25% ($12.50), undivided beneficial ownership interest in a series A trust preferred security of MetLife Capital Trust II (“Series A Trust”), with an initial liquidation amount of $1,000; (ii) a 1 ⁄80 or 1.25% ($12.50), undivided beneficial ownership interest in a series B trust preferred security of MetLife Capital Trust III (“Series B Trust” and, together with the Series A Trust, the “Capital Trusts”), with an initial liquidation amount of $1,000; (iii) a stock purchase contract under which the holder of the common equity unit will purchase and the Holding Company will sell, on each of the initial stock purchase date and the subsequent stock purchase date, a variable number of shares of the Holding Company’s common stock, par value $0.01 per share, for a purchase price of $12.50. Junior Subordinated Debentures Issued to Support Trust Common and Preferred Securities The Holding Company issued $1,067 million 4.82% Series A and $1,067 million 4.91% Series B junior subordinated debt securities due no later than February 15, 2039 and February 15, 2040, respectively, for a total of $2,134 million, in exchange for $2,070 million in aggregate proceeds from the sale of the trust preferred securities by the Capital Trusts and $64 million in trust common securities issued equally by the Capital Trusts. The common and preferred securities of the Capital Trusts, totaling $2,134 million, represent undivided beneficial ownership interests in the assets of the Capital Trusts, have no stated maturity and must be redeemed upon maturity of the corresponding series of junior subordinated debt securities — the sole assets of the respective Capital Trusts. The Series A Trust and Series B Trust will each make quarterly distributions on the common and preferred securities at an annual rate of 4.82% and 4.91%, respectively. The trust common securities, which are held by the Holding Company, represent a 3% interest in the Trusts and are reflected as fixed maturity securities in the consolidated balance sheet of MetLife, Inc. The Capital Trusts are VIEs in accordance with FIN 46(r), and the Company does not consolidate its interest in MetLife Capital Trusts II and III as it is not the primary beneficiary of either of the Capital Trusts. The Holding Company has directly guaranteed the repayment of the trust preferred securities to the holders thereof to the extent that there are funds available in the Capital Trusts. The guarantee will remain in place until the full redemption of the trust preferred securities. The trust preferred securities held by the common equity unit holders are pledged to the Holding Company to collateralize the obligation of the common equity unit holders under the related stock purchase contracts. The common equity unit holder may substitute certain zero coupon treasury securities in place of the trust preferred securities as collateral under the stock purchase contract. The trust preferred securities have remarketing dates which correspond with the initial and subsequent stock purchase dates to provide the holders of the common equity units with the proceeds to exercise the stock purchase contracts. The initial stock purchase date is expected to be August 15, 2008, but could be deferred for quarterly periods until February 15, 2009, and the subsequent stock purchase date is expected to be February 15, 2009, but could be deferred for quarterly periods until February 15, 2010. At the remarketing date, the remarketing agent will have the ability to reset the interest rate on the trust preferred securities to generate sufficient remarketing proceeds to satisfy the common equity unit holder’s obligation under the stock purchase contract, subject to a reset cap for each of the first two attempted remarketings of each series. The interest rate on the supporting junior subordinated debt securities issued by the Holding Company will be reset at a commensurate rate. If the initial remarketing is unsuccessful, the remarketing agent will attempt to remarket the trust preferred securities, as necessary, in subsequent quarters through February 15, 2009 for the Series A trust preferred securities and through February 15, 2010 for the Series B trust preferred securities. The final attempt at remarketing will not be subject to the reset cap. If all remarketing attempts are unsuccessful, the Holding Company has the right, as a secured party, to apply the liquidation amount on the trust preferred securities to the common equity unit holders obligation under the stock purchase contract and to deliver to the common F-50 MetLife, Inc. MetLife, Inc. Notes to Consolidated Financial Statements — (Continued)
  • 147.
    equity unit holdera junior subordinated debt security payable on August 15, 2010 at an annual rate of 4.82% and 4.91% on the Series A and Series B trust preferred securities, respectively, in payment of any accrued and unpaid distributions. Stock Purchase Contracts Each stock purchase contract requires the holder of the common equity unit to purchase, and the Holding Company to sell, for $12.50, on each of the initial stock purchase date and the subsequent stock purchase date, a number of newly issued or treasury shares of the Holding Company’s common stock, par value $0.01 per share, equal to the applicable settlement rate. The settlement rate at the respective stock purchase date will be calculated based on the closing price of the common stock during a specified 20-day period immediately preceding the applicable stock purchase date. If the market value of the Holding Company’s common stock is less than the threshold appreciation price of $53.10 but greater than $43.35, the reference price, the settlement rate will be a number of the Holding Company’s common stock equal to the stated amount of $12.50 divided by the market value. If the market value is less than or equal to the reference price, the settlement rate will be 0.28835 shares of the Holding Company’s common stock. If the market value is greater than or equal to the threshold appreciation price, the settlement rate will be 0.23540 shares of the Holding Company’s common stock as adjusted in accordance with the terms of the stock purchase contracts. Accordingly, upon settlement in the aggregate, the Holding Company will receive proceeds of $2,070 million and issue between 39.0 million and 47.8 million shares of its common stock. The stock purchase contract may be exercised at the option of the holder at any time prior to the settlement date. However, upon early settlement, the holder will receive the minimum settlement rate. The stock purchase contracts further require the Holding Company to pay the holder of the common equity unit quarterly contract payments on the stock purchase contracts at the annual rate of 1.510% on the stated amount of $25 per stock purchase contract until the initial stock purchase date and at the annual rate of 1.465% on the remaining stated amount of $12.50 per stock purchase contract thereafter. The quarterly distributions on the Series A and Series B trust preferred securities of 4.82% and 4.91%, respectively, combined with the contract payments on the stock purchase contract of 1.510%, (1.465% after the initial stock purchase date) result in the 6.375% yield on the common equity units. If the Holding Company defers any of the contract payments on the stock purchase contract, then it will accrue additional amounts on the deferred amounts at the annual rate of 6.375% until paid, to the extent permitted by law. The value of the stock purchase contracts at issuance, $96.6 million, were calculated as the present value of the future contract payments due under the stock purchase contract of 1.510% through the initial stock purchase date, and 1.465% up to the subsequent stock purchase date, discounted at the interest rate on the supporting junior subordinated debt securities issued by the Holding Company, 4.82% or 4.91% on the Series A and Series B trust preferred securities, respectively. The value of the stock purchase contracts was recorded in other liabilities with an offsetting decrease in additional paid-in capital. The other liability balance related to the stock purchase contracts will accrue interest at the discount rate of 4.82% or 4.91%, as applicable, with an offsetting increase to interest expense. When the contract payments are made under the stock purchase contracts they will reduce the other liability balance. During the years ended December 31, 2007, 2006 and 2005, the Holding Company increased the other liability balance for the accretion of the discount on the contract payment of $2 million, $3 million and $2 million and made contract payments of $31 million, $31 million and $13 million, respectively. Issuance Costs In connection with the offering of common equity units, the Holding Company incurred $55.3 million of issuance costs of which $5.8 million relate to the issuance of the junior subordinated debt securities underlying common equity units which fund the Series A and Series B trust preferred securities and $49.5 million relate to the expected issuance of the common stock under the stock purchase contracts. The $5.8 million in debt issuance costs have been capitalized, are included in other assets, and are being amortized using the effective interest method over the period from issuance date of the common equity units to the initial and subsequent stock purchase date. The remaining $49.5 million of costs relate to the common stock issuance under the stock purchase contracts and have been recorded as a reduction of additional paid-in capital. Earnings Per Common Share The stock purchase contracts are reflected in diluted earnings per common share using the treasury stock method, and are dilutive when the average closing price of the Company’s common stock for each of the 20 trading days before the close of the accounting period is greater than or equal to the threshold appreciation price of $53.10. During the years ended December 31, 2007 and 2006, the average closing price for each of the 20 trading days before December 31 was greater than the threshold appreciation price. Accordingly, the stock purchase contracts were included in diluted earnings per common share for the years ended December 31, 2007 and 2006. During the period from the date of issuance through December 31, 2005, the average closing price for each of the 20 trading days before December 31 was less than the threshold appreciate price. Accordingly, the stock purchase contracts were excluded in diluted earnings per common share for the year ended December 31, 2005. See Note 20. 14. Shares Subject to Mandatory Redemption and Company-Obligated Mandatorily Redeemable Securities of Subsidiary Trusts GenAmerica Capital I. In June 1997, GenAmerica Corporation (“GenAmerica”) issued $125 million of 8.525% capital securities through a wholly-owned subsidiary trust, GenAmerica Capital I. In October 2007, GenAmerica redeemed these securities which were due to mature on June 30, 2027. As a result of this redemption, the Company recognized additional interest expense of $10 million. Capital securities outstanding were $119 million, net of unamortized discounts of $6 million at December 31, 2006. Interest expense on these instruments is included in other expenses and was $20 million, $11 million and $11 million for the years ended December 31, 2007, 2006 and 2005, respectively. F-51MetLife, Inc. MetLife, Inc. Notes to Consolidated Financial Statements — (Continued)
  • 148.
    RGA Capital TrustI. In December 2001, RGA, through its wholly-owned trust, RGA Capital Trust I (the “RGA Trust”), issued 4,500,000 Preferred Income Equity Redeemable Securities (“PIERS”) Units. Each PIERS unit consists of: (i) a preferred security issued by the RGA Trust, having a stated liquidation amount of $50 per unit, representing an undivided beneficial ownership interest in the assets of the RGA Trust, which consist solely of junior subordinated debentures issued by RGA which have a principal amount at maturity of $50 and a stated maturity of March 18, 2051; and (ii) a warrant to purchase, at any time prior to December 15, 2050, 1.2508 shares of RGA stock at an exercise price of $50. The fair market value of the warrant on the issuance date was $14.87 and is detachable from the preferred security. RGA fully and unconditionally guarantees, on a subordinated basis, the obligations of the Trust under the preferred securities. The preferred securities and subordinated debentures were issued at a discount (original issue discount) to the face or liquidation value of $14.87 per security. The securities will accrete to their $50 face/liquidation value over the life of the security on a level yield basis. The weighted average effective interest rate on the preferred securities and the subordinated debentures is 8.25% per annum. Capital securities outstanding were $159 million, net of unamortized discounts of $66 million at both December 31, 2007 and 2006. Interest expense on these instruments is included in other expenses and was $13 million for each of the years ended December 31, 2007, 2006 and 2005. 15. Income Taxes The provision for income tax from continuing operations is as follows: 2007 2006 2005 Years Ended December 31, (In millions) Current: Federal . . . . . . . . . . . . . . . . . . . . . . . . . . . . . . . . . . . . . . . . . . . . . . . . . . . . . . . . . . $ 435 $ 618 $ 553 State and local . . . . . . . . . . . . . . . . . . . . . . . . . . . . . . . . . . . . . . . . . . . . . . . . . . . . . 15 39 63 Foreign . . . . . . . . . . . . . . . . . . . . . . . . . . . . . . . . . . . . . . . . . . . . . . . . . . . . . . . . . . 210 156 111 Subtotal . . . . . . . . . . . . . . . . . . . . . . . . . . . . . . . . . . . . . . . . . . . . . . . . . . . . . . . . . 660 813 727 Deferred: Federal . . . . . . . . . . . . . . . . . . . . . . . . . . . . . . . . . . . . . . . . . . . . . . . . . . . . . . . . . . $1,082 $ 220 $ 470 State and local . . . . . . . . . . . . . . . . . . . . . . . . . . . . . . . . . . . . . . . . . . . . . . . . . . . . . 31 2 14 Foreign . . . . . . . . . . . . . . . . . . . . . . . . . . . . . . . . . . . . . . . . . . . . . . . . . . . . . . . . . . (14) 62 11 Subtotal . . . . . . . . . . . . . . . . . . . . . . . . . . . . . . . . . . . . . . . . . . . . . . . . . . . . . . . . . 1,099 284 495 Provision for income tax . . . . . . . . . . . . . . . . . . . . . . . . . . . . . . . . . . . . . . . . . . . . . . . . $1,759 $1,097 $1,222 The reconciliation of the income tax provision at the U.S. statutory rate to the provision for income tax as reported for continuing operations is as follows: 2007 2006 2005 Years Ended December 31, (In millions) Tax provision at U.S. statutory rate . . . . . . . . . . . . . . . . . . . . . . . . . . . . . . . . . . . . . . . . . $2,114 $1,459 $1,503 Tax effect of: Tax-exempt investment income . . . . . . . . . . . . . . . . . . . . . . . . . . . . . . . . . . . . . . . . . . (295) (296) (169) State and local income tax . . . . . . . . . . . . . . . . . . . . . . . . . . . . . . . . . . . . . . . . . . . . . 39 23 35 Prior year tax . . . . . . . . . . . . . . . . . . . . . . . . . . . . . . . . . . . . . . . . . . . . . . . . . . . . . 70 (10) (31) Foreign tax rate differential and change in valuation allowance . . . . . . . . . . . . . . . . . . . . . . (116) (57) (44) Foreign operations repatriation . . . . . . . . . . . . . . . . . . . . . . . . . . . . . . . . . . . . . . . . . . — — (27) Other, net. . . . . . . . . . . . . . . . . . . . . . . . . . . . . . . . . . . . . . . . . . . . . . . . . . . . . . . . (53) (22) (45) Provision for income tax . . . . . . . . . . . . . . . . . . . . . . . . . . . . . . . . . . . . . . . . . . . . . . . . $1,759 $1,097 $1,222 Included in the 2005 total tax provision was a $27 million tax benefit related to the repatriation of foreign earnings pursuant to Internal Revenue Code Section 965 for which a U.S. deferred tax position had previously been recorded. F-52 MetLife, Inc. MetLife, Inc. Notes to Consolidated Financial Statements — (Continued)
  • 149.
    Deferred income taxrepresents the tax effect of the differences between the book and tax basis of assets and liabilities. Net deferred income tax assets and liabilities consisted of the following: 2007 2006 December 31, (In millions) Deferred income tax assets: Policyholder liabilities and receivables . . . . . . . . . . . . . . . . . . . . . . . . . . . . . . . . . . . . . . . . . . . . $ 4,026 $ 4,078 Net operating loss carryforwards . . . . . . . . . . . . . . . . . . . . . . . . . . . . . . . . . . . . . . . . . . . . . . . 920 1,368 Employee benefits . . . . . . . . . . . . . . . . . . . . . . . . . . . . . . . . . . . . . . . . . . . . . . . . . . . . . . . . . 176 472 Capital loss carryforwards . . . . . . . . . . . . . . . . . . . . . . . . . . . . . . . . . . . . . . . . . . . . . . . . . . . . 162 156 Tax credit carryforwards . . . . . . . . . . . . . . . . . . . . . . . . . . . . . . . . . . . . . . . . . . . . . . . . . . . . . 24 — Intangibles . . . . . . . . . . . . . . . . . . . . . . . . . . . . . . . . . . . . . . . . . . . . . . . . . . . . . . . . . . . . . . — 22 Litigation-related and government mandated . . . . . . . . . . . . . . . . . . . . . . . . . . . . . . . . . . . . . . . . 113 65 Other . . . . . . . . . . . . . . . . . . . . . . . . . . . . . . . . . . . . . . . . . . . . . . . . . . . . . . . . . . . . . . . . . 247 198 5,668 6,359 Less: Valuation allowance . . . . . . . . . . . . . . . . . . . . . . . . . . . . . . . . . . . . . . . . . . . . . . . . . . . . 135 239 5,533 6,120 Deferred income tax liabilities: Investments . . . . . . . . . . . . . . . . . . . . . . . . . . . . . . . . . . . . . . . . . . . . . . . . . . . . . . . . . . . . . 2,266 1,839 Intangibles . . . . . . . . . . . . . . . . . . . . . . . . . . . . . . . . . . . . . . . . . . . . . . . . . . . . . . . . . . . . . . 32 — DAC . . . . . . . . . . . . . . . . . . . . . . . . . . . . . . . . . . . . . . . . . . . . . . . . . . . . . . . . . . . . . . . . . . 5,153 5,433 Net unrealized investment gains . . . . . . . . . . . . . . . . . . . . . . . . . . . . . . . . . . . . . . . . . . . . . . . . 423 994 Other . . . . . . . . . . . . . . . . . . . . . . . . . . . . . . . . . . . . . . . . . . . . . . . . . . . . . . . . . . . . . . . . . 116 132 7,990 8,398 Net deferred income tax liability . . . . . . . . . . . . . . . . . . . . . . . . . . . . . . . . . . . . . . . . . . . . . . . . . . $(2,457) $(2,278) Domestic net operating loss carryforwards amount to $2,057 million at December 31, 2007 and will expire beginning in 2019. Foreign net operating loss carryforwards amount to $725 million at December 31, 2007 and were generated in various foreign countries with expiration periods of five years to indefinite expiration. Capital loss carryforwards amount to $463 million at December 31, 2007 and will expire beginning in 2010. Tax credit carryforwards amount to $24 million at December 31, 2007. The Company has recorded a valuation allowance related to tax benefits of certain foreign net operating loss carryforwards. The valuation allowance reflects management’s assessment, based on available information, that it is more likely than not that the deferred income tax asset for certain foreign net operating loss carryforwards will not be realized. The tax benefit will be recognized when management believes that it is more likely than not that these deferred income tax assets are realizable. In 2007, the Company recorded a reduction of $104 million to the deferred income tax valuation allowance related to certain foreign net operating loss carryforwards and other deferred tax assets. The Company files income tax returns with the U.S. federal government and various state and local jurisdictions, as well as foreign jurisdictions. The Company is under continuous examination by the Internal Revenue Service (“IRS”) and other tax authorities in jurisdictions in which the Company has significant business operations. The income tax years under examination vary by jurisdiction. With a few exceptions, the Company is no longer subject to U.S. federal, state and local, or foreign income tax examinations by tax authorities for years prior to 2000. In the first quarter of 2005, the IRS commenced an examination of the Company’s U.S. income tax returns for 2000 through 2002 that is anticipated to be completed in 2008. As a result of the implementation of FIN 48 on January 1, 2007, the Company recognized a $52 million increase in the liability for unrecognized tax benefits, a $4 million decrease in the interest liability for unrecognized tax benefits, and a corresponding reduction to the January 1, 2007 balance of retained earnings of $37 million, net of $11 million of minority interest. The Company’s total amount of unrecognized tax benefits upon adoption of FIN 48 was $1,128 million. The Company reclassified, at adoption, $611 million of current income tax payables to the liability for unrecognized tax benefits included within other liabilities. The Company also reclassified, at adoption, $465 million of deferred income tax liabilities, for which the ultimate deductibility is highly certain but for which there is uncertainty about the timing of such deductibility, to the liability for unrecognized tax benefits. Because of the impact of deferred tax accounting, other than interest and penalties, the disallowance of the shorter deductibility period would not affect the annual effective tax rate but would accelerate the payment of cash to the taxing authority to an earlier period. The total amount of unrecognized tax benefits as of January 1, 2007 that would affect the effective tax rate, if recognized, was $680 million. The Company also had $240 million of accrued interest, included within other liabilities, as of January 1, 2007. The Company classifies interest accrued related to unrecognized tax benefits in interest expense, while penalties are included within income tax expense. As of December 31, 2007, the Company’s total amount of unrecognized tax benefits is $1,038 million and the total amount of unrecognized tax benefits that would affect the effective tax rate, if recognized, is $593 million. The total amount of unrecognized tax benefits decreased by $90 million from the date of adoption primarily due to settlements reached with the IRS with respect to certain significant issues involving demutualization, post-sale purchase price adjustments, and reinsurance offset by additions for tax positions of the current year. As a result of the settlements, items within the liability for unrecognized tax benefits, in the amount of $177 million, were reclassified to current and deferred income taxes, as applicable, and a payment of $156 million was made in December of 2007 with the remaining $21 million to be paid in future years. In addition, the Company’s liability for unrecognized tax benefits may change significantly in F-53MetLife, Inc. MetLife, Inc. Notes to Consolidated Financial Statements — (Continued)
  • 150.
    the next 12months pending the outcome of remaining issues associated with the current IRS audit including demutualization, leasing, tax- exempt income, transfer pricing and tax credits. Management is working to resolve the remaining audit items directly with IRS auditors as well as through available accelerated IRS resolution programs and may protest any unresolved issues through the IRS appeals process and, possibly, litigation, the timing and extent of which is uncertain. Therefore, a reasonable estimate of the range of a payment or change in the liability cannot be made at this time; however, the Company continues to believe that the ultimate resolution of the issues will not result in a material effect on its consolidated financial statements, although the resolution of income tax matters could impact the Company’s effective tax rate for a particular future period. A reconciliation of the beginning and ending amount of unrecognized tax benefits for the year ended December 31, 2007, is as follows: Total Unrecognized Tax Benefits (In millions) Balance at January 1, 2007 (date of adoption) . . . . . . . . . . . . . . . . . . . . . . . . . . . . . . . . . . . . . . . . . $1,128 Additions for tax positions of prior years . . . . . . . . . . . . . . . . . . . . . . . . . . . . . . . . . . . . . . . . . . . . . 73 Reductions for tax positions of prior years . . . . . . . . . . . . . . . . . . . . . . . . . . . . . . . . . . . . . . . . . . . . (59) Additions for tax positions of current year . . . . . . . . . . . . . . . . . . . . . . . . . . . . . . . . . . . . . . . . . . . . 85 Reductions for tax positions of current year . . . . . . . . . . . . . . . . . . . . . . . . . . . . . . . . . . . . . . . . . . . (8) Settlements with tax authorities . . . . . . . . . . . . . . . . . . . . . . . . . . . . . . . . . . . . . . . . . . . . . . . . . . . (177) Lapses of statutes of limitations. . . . . . . . . . . . . . . . . . . . . . . . . . . . . . . . . . . . . . . . . . . . . . . . . . . (4) Balance at December 31, 2007 . . . . . . . . . . . . . . . . . . . . . . . . . . . . . . . . . . . . . . . . . . . . . . . . . . . $1,038 During the year ended December 31, 2007, the Company recognized $98 million in interest expense associated with the liability for unrecognized tax benefits. As of December 31, 2007, the Company had $252 million of accrued interest associated with the liability for unrecognized tax benefits. The $12 million increase, from the date of adoption, in accrued interest associated with the liability for unrecognized tax benefits resulted from an increase of $98 million of interest expense and an $86 million decrease primarily resulting from the aforementioned IRS settlements. During 2007, $73 million of the $86 million, resulting from IRS settlements, has been reclassified to current income tax payable and the remaining $13 million reduced interest expense. On September 25, 2007, the IRS issued Revenue Ruling 2007-61, which announced its intention to issue regulations with respect to certain computational aspects of the Dividends Received Deduction (“DRD”) on separate account assets held in connection with variable annuity contracts. Revenue Ruling 2007-61 suspended a revenue ruling issued in August 2007 that would have changed accepted industry and IRS interpretations of the statutes governing these computational questions. Any regulations that the IRS ultimately proposes for issuance in this area will be subject to public notice and comment, at which time insurance companies and other interested parties will have the opportunity to raise legal and practical questions about the content, scope and application of such regulations. As a result, the ultimate timing and substance of any such regulations are unknown at this time. For the year ended December 31, 2007, the Company recognized an income tax benefit of $188 million related to the separate account DRD. 16. Contingencies, Commitments and Guarantees Contingencies Litigation The Company is a defendant in a large number of litigation matters. In some of the matters, very large and/or indeterminate amounts, including punitive and treble damages, are sought. Modern pleading practice in the United States permits considerable variation in the assertion of monetary damages or other relief. Jurisdictions may permit claimants not to specify the monetary damages sought or may permit claimants to state only that the amount sought is sufficient to invoke the jurisdiction of the trial court. In addition, jurisdictions may permit plaintiffs to allege monetary damages in amounts well exceeding reasonably possible verdicts in the jurisdiction for similar matters. This variability in pleadings, together with the actual experience of the Company in litigating or resolving through settlement numerous claims over an extended period of time, demonstrate to management that the monetary relief which may be specified in a lawsuit or claim bears little relevance to its merits or disposition value. Thus, unless stated below, the specific monetary relief sought is not noted. Due to the vagaries of litigation, the outcome of a litigation matter and the amount or range of potential loss at particular points in time may normally be inherently impossible to ascertain with any degree of certainty. Inherent uncertainties can include how fact finders will view individually and in their totality documentary evidence, the credibility and effectiveness of witnesses’ testimony, and how trial and appellate courts will apply the law in the context of the pleadings or evidence presented, whether by motion practice, or at trial or on appeal. Disposition valuations are also subject to the uncertainty of how opposing parties and their counsel will themselves view the relevant evidence and applicable law. On a quarterly and annual basis, the Company reviews relevant information with respect to litigation and contingencies to be reflected in the Company’s consolidated financial statements. The review includes senior legal and financial personnel. In 2007, the Company received $39 million upon the resolution of an indemnification claim associated with the 2000 acquisition of General American Life Insurance Company (“GALIC”), and the Company reduced legal liabilities by $38 million after the settlement of certain cases. Unless stated below, estimates of possible losses or ranges of loss for particular matters cannot in the ordinary course be made with a reasonable degree of certainty. Liabilities are established when it is probable that a loss has been incurred and the amount of the loss can be reasonably estimated. Liabilities have been established for a number of the matters noted below; in 2007 the Company increased legal liabilities for pending sales practices, employment, property and casualty and intellectual property litigation matters against the Company. It is possible that some of the matters could require the Company to pay damages or make other expenditures or establish accruals in amounts that could not be estimated as of December 31, 2007. F-54 MetLife, Inc. MetLife, Inc. Notes to Consolidated Financial Statements — (Continued)
  • 151.
    Demutualization Actions Several lawsuitswere brought in 2000 challenging the fairness of the Plan and the adequacy and accuracy of MLIC’s disclosure to policyholders regarding the Plan. The actions discussed below name as defendants some or all of MLIC, the Holding Company, and individual directors. MLIC, the Holding Company, and the individual directors believe they have meritorious defenses to the plaintiffs’ claims and are contesting vigorously all of the plaintiffs’ claims in these actions. Fiala, et al. v. Metropolitan Life Ins. Co., et al. (Sup. Ct., N.Y. County, filed March 17, 2000). The plaintiffs in the consolidated state court class actions seek compensatory relief and punitive damages against MLIC, the Holding Company, and individual directors. On January 30, 2007, the trial court signed an order certifying a litigation class of present and former policyholders on plaintiffs’ claim that defendants violated section 7312 of the New York Insurance Law, but denying plaintiffs’ motion to certify a litigation class with respect to a common law fraud claim. Plaintiffs and defendants have filed notices of appeal from this order. The court has directed various forms of class notice. In re MetLife Demutualization Litig. (E.D.N.Y., filed April 18, 2000). In this class action against MLIC and the Holding Company, plaintiffs served a second consolidated amended complaint in 2004. Plaintiffs assert violations of the Securities Act and the Securities Exchange Act of 1934, as amended (the “Exchange Act”), in connection with the Plan, claiming that the Policyholder Information Booklets failed to disclose certain material facts and contained certain material misstatements. They seek rescission and compensatory damages. By orders dated July 19, 2005 and August 29, 2006, the federal trial court certified a litigation class of present and former policyholders. The court has not yet directed the manner and form of class notice. Asbestos-Related Claims MLIC is and has been a defendant in a large number of asbestos-related suits filed primarily in state courts. These suits principally allege that the plaintiff or plaintiffs suffered personal injury resulting from exposure to asbestos and seek both actual and punitive damages. MLIC has never engaged in the business of manufacturing, producing, distributing or selling asbestos or asbestos-containing products nor has MLIC issued liability or workers’ compensation insurance to companies in the business of manufacturing, producing, distributing or selling asbestos or asbestos-containing products. The lawsuits principally have focused on allegations with respect to certain research, publication and other activities of one or more of MLIC’s employees during the period from the 1920’s through approximately the 1950’s and allege that MLIC learned or should have learned of certain health risks posed by asbestos and, among other things, improperly publicized or failed to disclose those health risks. MLIC believes that it should not have legal liability in these cases. The outcome of most asbestos litigation matters, however, is uncertain and can be impacted by numerous variables, including differences in legal rulings in various jurisdictions, the nature of the alleged injury, and factors unrelated to the ultimate legal merit of the claims asserted against MLIC. MLIC employs a number of resolution strategies to manage its asbestos loss exposure, including seeking resolution of pending litigation by judicial rulings and settling litigation under appropriate circumstances. Claims asserted against MLIC have included negligence, intentional tort and conspiracy concerning the health risks associated with asbestos. MLIC’s defenses (beyond denial of certain factual allegations) include that: (i) MLIC owed no duty to the plaintiffs — it had no special relationship with the plaintiffs and did not manufacture, produce, distribute or sell the asbestos products that allegedly injured plaintiffs; (ii) plaintiffs did not rely on any actions of MLIC; (iii) MLIC’s conduct was not the cause of the plaintiffs’ injuries; (iv) plaintiffs’ exposure occurred after the dangers of asbestos were known; and (v) the applicable time with respect to filing suit has expired. During the course of the litigation, certain trial courts have granted motions dismissing claims against MLIC, while other trial courts have denied MLIC’s motions to dismiss. There can be no assurance that MLIC will receive favorable decisions on motions in the future. While most cases brought to date have settled, MLIC intends to continue to defend aggressively against claims based on asbestos exposure, including defending claims at trials. The approximate total number of asbestos personal injury claims pending against MLIC as of the dates indicated, the approximate number of new claims during the years ended on those dates and the approximate total settlement payments made to resolve asbestos personal injury claims at or during those years are set forth in the following table: 2007 2006 2005 December 31, (In millions, except number of claims) Asbestos personal injury claims at year end . . . . . . . . . . . . . . . . . . . . . . . . . . . . 79,717 87,070 100,250 Number of new claims during the year . . . . . . . . . . . . . . . . . . . . . . . . . . . . . . . 7,161 7,870 18,500 Settlement payments during the year (1) . . . . . . . . . . . . . . . . . . . . . . . . . . . . . . $ 28.2 $ 35.5 $ 74.3 (1) Settlement payments represent payments made by MLIC during the year in connection with settlements made in that year and in prior years. Amounts do not include MLIC’s attorneys’ fees and expenses and do not reflect amounts received from insurance carriers. In 2004, MLIC received approximately 23,900 new claims, ending the year with a total of approximately 108,000 claims, and paid approximately $85.5 million for settlements reached in 2004 and prior years. In 2003, MLIC received approximately 58,750 new claims, ending the year with a total of approximately 111,700 claims, and paid approximately $84.2 million for settlements reached in 2003 and prior years. The number of asbestos cases that may be brought or the aggregate amount of any liability that MLIC may ultimately incur is uncertain. The Company believes adequate provision has been made in its consolidated financial statements for all probable and reasonably estimable losses for asbestos-related claims. MLIC’s recorded asbestos liability is based on its estimation of the following elements, as informed by the facts presently known to it, its understanding of current law, and its past experiences: (i) the reasonably probable and estimable liability for asbestos claims already asserted against MLIC, including claims settled but not yet paid; (ii) the reasonably probable and estimable liability for asbestos claims not yet asserted against MLIC, but which MLIC believes are reasonably probable of assertion; F-55MetLife, Inc. MetLife, Inc. Notes to Consolidated Financial Statements — (Continued)
  • 152.
    and (iii) thelegal defense costs associated with the foregoing claims. Significant assumptions underlying MLIC’s analysis of the adequacy of its recorded liability with respect to asbestos litigation include: (i) the number of future claims; (ii) the cost to resolve claims; and (iii) the cost to defend claims. MLIC reevaluates on a quarterly and annual basis its exposure from asbestos litigation, including studying its claims experience, reviewing external literature regarding asbestos claims experience in the United States, assessing relevant trends impacting asbestos liability and considering numerous variables that can affect its asbestos liability exposure on an overall or per claim basis. These variables include bankruptcies of other companies involved in asbestos litigation, legislative and judicial developments, the number of pending claims involving serious disease, the number of new claims filed against it and other defendants, and the jurisdictions in which claims are pending. As previously disclosed, in 2002 MLIC increased its recorded liability for asbestos-related claims by $402 million from approximately $820 million to $1,225 million. MLIC regularly reevaluates its exposure from asbestos litigation and has updated its liability analysis for asbestos-related claims through December 31, 2007. The ability of MLIC to estimate its ultimate asbestos exposure is subject to considerable uncertainty, and the conditions impacting its liability can be dynamic and subject to change. The availability of reliable data is limited and it is difficult to predict with any certainty the numerous variables that can affect liability estimates, including the number of future claims, the cost to resolve claims, the disease mix and severity of disease in pending and future claims, the impact of the number of new claims filed in a particular jurisdiction and variations in the law in the jurisdictions in which claims are filed, the possible impact of tort reform efforts, the willingness of courts to allow plaintiffs to pursue claims against MLIC when exposure to asbestos took place after the dangers of asbestos exposure were well known, and the impact of any possible future adverse verdicts and their amounts. The ability to make estimates regarding ultimate asbestos exposure declines significantly as the estimates relate to years further in the future. In the Company’s judgment, there is a future point after which losses cease to be probable and reasonably estimable. It is reasonably possible that the Company’s total exposure to asbestos claims may be materially greater than the asbestos liability currently accrued and that future charges to income may be necessary. While the potential future charges could be material in the particular quarterly or annual periods in which they are recorded, based on information currently known by management, management does not believe any such charges are likely to have a material adverse effect on the Company’s financial position. During 1998, MLIC paid $878 million in premiums for excess insurance policies for asbestos-related claims. The excess insurance policies for asbestos-related claims provide for recovery of losses up to $1.5 billion, which is in excess of a $400 million self-insured retention. The Company’s initial option to commute the excess insurance policies for asbestos-related claims arises at the end of 2008. Thereafter, the Company will have a commutation right every five years. The excess insurance policies for asbestos-related claims are also subject to annual and per claim sublimits. Amounts exceeding the sublimits during 2007, 2006 and 2005 were approximately $16 million, $8 million and $0, respectively. The Company continues to study per claim averages, and there can be no assurance as to the number and cost of claims resolved in the future, including related defense costs, and the applicability of the sublimits to these costs. Amounts are recoverable under the policies annually with respect to claims paid during the prior calendar year. Although amounts paid by MLIC in any given year that may be recoverable in the next calendar year under the policies will be reflected as a reduction in the Company’s operating cash flows for the year in which they are paid, management believes that the payments will not have a material adverse effect on the Company’s liquidity. Each asbestos-related policy contains an experience fund and a reference fund that provide for payments to MLIC at the commutation date if the reference fund is greater than zero at commutation or pro rata reductions from time to time in the loss reimbursements to MLIC if the cumulative return on the reference fund is less than the return specified in the experience fund. The return in the reference fund is tied to performance of the Standard & Poor’s (“S&P”) 500 Index and the Lehman Brothers Aggregate Bond Index. A claim with respect to the prior year was made under the excess insurance policies in each year from 2003 through 2007 for the amounts paid with respect to asbestos litigation in excess of the retention. As the performance of the indices impacts the return in the reference fund, it is possible that loss reimbursements to the Company and the recoverable amount with respect to later periods may be less than the amount of the recorded losses. Foregone loss reimbursements may be recovered upon commutation depending upon future performance of the reference fund. If at some point in the future, the Company believes the liability for probable and reasonably estimable losses for asbestos- related claims should be increased, an expense would be recorded and the insurance recoverable would be adjusted subject to the terms, conditions and limits of the excess insurance policies. Portions of the change in the insurance recoverable would be recorded as a deferred gain and amortized into income over the estimated remaining settlement period of the insurance policies. The foregone loss reimbursements were approximately $56.1 million with respect to claims for the period of 2002 through 2006 and are estimated, as of December 31, 2007, to be approximately $69.1 million in the aggregate, including future years. Sales Practices Claims Over the past several years, MLIC; New England Mutual Life Insurance Company, New England Life Insurance Company and New England Securities Corporation (collectively “New England”); GALIC; Walnut Street Securities, Inc. (“Walnut Street Securities”) and MetLife Securities, Inc. (“MSI”) have faced numerous claims, including class action lawsuits, alleging improper marketing or sales of individual life insurance policies, annuities, mutual funds or other products. As of December 31, 2007, there were approximately 130 sales practices litigation matters pending against the Company. The Company continues to vigorously defend against the claims in these matters. Some sales practices claims have been resolved through settlement. Other sales practices claims have been won by dispositive motions or have gone to trial. Most of the current cases seek substantial damages, including in some cases punitive and treble damages and attorneys’ fees. Additional litigation relating to the Company’s marketing and sales of individual life insurance, mutual funds or other products may be commenced in the future. Two putative class action lawsuits involving sales practices claims are pending against MLIC in Canada. In Jacynthe Evoy-Larouche v. Metropolitan Life Ins. Co. (Que. Super. Ct., filed March 1998), plaintiff alleges misrepresentations regarding dividends and future payments for life insurance policies and seeks unspecified damages. In Ace Quan v. Metropolitan Life Ins. Co. (Ont. Gen. Div., filed April 1997), F-56 MetLife, Inc. MetLife, Inc. Notes to Consolidated Financial Statements — (Continued)
  • 153.
    plaintiff alleges breachof contract and negligent misrepresentations relating to, among other things, life insurance premium payments and seeks damages, including punitive damages. Regulatory authorities in a small number of states have had investigations or inquiries relating to MLIC’s, New England’s, GALIC’s, MSI’s or Walnut Street Securities’ sales of individual life insurance policies or annuities or other products. Over the past several years, these and a number of investigations by other regulatory authorities were resolved for monetary payments and certain other relief. The Company may continue to resolve investigations in a similar manner. The Company believes adequate provision has been made in its consolidated financial statements for all probable and reasonably estimable losses for sales practices claims against MLIC, New England, GALIC, MSI and Walnut Street Securities. Property and Casualty Actions Katrina-Related Litigation. There are a number of lawsuits, including a few putative class actions and “mass” actions, pending in Louisiana and Mississippi against Metropolitan Property and Casualty Insurance Company relating to Hurricane Katrina. The lawsuits include claims by policyholders for coverage for damages stemming from Hurricane Katrina, including for damages resulting from flooding or storm surge. The deadline for filing actions in Louisiana has expired. It is reasonably possible that additional actions will be filed in other states. The Company intends to continue to defend vigorously against these matters, although appropriate matters may be resolved as part of the ordinary claims adjustment process. Shipley v. St. Paul Fire and Marine Ins. Co. and Metropolitan Property and Casualty Ins. Co. (Ill. Cir. Ct., Madison County, filed February 26 and July 2, 2003). Two putative nationwide class actions have been filed against Metropolitan Property and Casualty Insurance Company in Illinois. One suit claims breach of contract and fraud due to the alleged underpayment of medical claims arising from the use of a purportedly biased provider fee pricing system. A motion for class certification has been filed and briefed. The second suit currently alleges breach of contract arising from the alleged use of preferred provider organizations to reduce medical provider fees covered by the medical claims portion of the insurance policy. A motion for class certification has been filed and briefed. A third putative nationwide class action relating to the payment of medical providers, Innovative Physical Therapy, Inc. v. MetLife Auto & Home, et ano (D. N.J., filed November 12, 2007) has been filed against Metropolitan Property and Casualty Insurance Company in federal court in New Jersey. The Company is vigorously defending against the claims in these matters. Regulatory Matters The Company receives and responds to subpoenas or other inquiries from state regulators, including state insurance commissioners; state attorneys general or other state governmental authorities; federal regulators, including the SEC; federal governmental authorities, including congressional committees; and the Financial Industry Regulatory Authority seeking a broad range of information. The issues involved in information requests and regulatory matters vary widely. Certain regulators have requested information and documents regarding contingent commission payments to brokers, the Company’s awareness of any “sham” bids for business, bids and quotes that the Company submitted to potential customers, incentive agreements entered into with brokers, or compensation paid to intermediaries. Regulators also have requested information relating to market timing and late trading of mutual funds and variable insurance products and, generally, the marketing of products. The Company has received a subpoena from the Office of the U.S. Attorney for the Southern District of California asking for documents regarding the insurance broker Universal Life Resources. The Company has been cooperating fully with these inquiries. In 2005, MSI received a notice from the Illinois Department of Securities asserting possible violations of the Illinois Securities Act in connection with sales of a former affiliate’s mutual funds. A response has been submitted and in January 2008, MSI received notice of the commencement of an administrative action by the Illinois Department of Securities. MSI intends to vigorously defend against the claims in this matter. Other Litigation In Re Ins. Brokerage Antitrust Litig. (D. N.J., filed February 24, 2005). In this multi-district proceeding, plaintiffs filed a class action complaint consolidating claims from several separate actions that had been filed in or transferred to the District of New Jersey in 2004 and 2005. The consolidated complaint alleged that the Holding Company, MLIC, several non-affiliated insurance companies and several insurance brokers violated the Racketeer Influenced and Corrupt Organizations Act (“RICO”), the Employee Retirement Income Security Act of 1974 (“ERISA”), and antitrust laws and committed other misconduct in the context of providing insurance to employee benefit plans and to persons who participate in such employee benefit plans. In August and September 2007, the court issued orders granting defendants’ motions to dismiss with prejudice the federal antitrust and the RICO claims. In January 2008, the court issued an order granting defendants’ summary judgment motion on the ERISA claims, and in February 2008, the court dismissed the remaining state law claims on jurisdictional grounds. Plaintiffs have filed a notice of appeal of the court’s decisions. A putative class action alleging that the Holding Company and other non-affiliated defendants violated state laws was transferred to the District of New Jersey but was not consolidated with other related actions. Plaintiffs’ motion to remand this action to state court in Florida is pending. The American Dental Association, et al. v. MetLife Inc., et al. (S.D. Fla., filed May 19, 2003). The American Dental Association and three individual providers have sued the Holding Company, MLIC and other non-affiliated insurance companies in a putative class action lawsuit. The plaintiffs purport to represent a nationwide class of in-network providers who allege that their claims are being wrongfully reduced by downcoding, bundling, and the improper use and programming of software. The complaint alleges federal racketeering and various state law theories of liability. The district court has granted in part and denied in part the Company’s motion to dismiss. The plaintiffs filed an amended complaint, and the Company filed another motion to dismiss. The court has issued a tag-along order, related to a medical managed care trial, which has stayed the lawsuit. F-57MetLife, Inc. MetLife, Inc. Notes to Consolidated Financial Statements — (Continued)
  • 154.
    Thomas, et al.v. Metropolitan Life Ins. Co., et al. (W.D. Okla., filed January 31, 2007). A putative class action complaint was filed against MLIC and MSI. Plaintiffs assert legal theories of violations of the federal securities laws and violations of state laws with respect to the sale of certain proprietary products by the Company’s agency distribution group. Plaintiffs seek rescission, compensatory damages, interest, punitive damages and attorneys’ fees and expenses. The Company is vigorously defending against the claims in this matter. MLIC also has been named as a defendant in a number of welding and mixed dust lawsuits filed in various state and federal courts. The Company is continuing to vigorously defend against these claims. Summary Putative or certified class action litigation and other litigation and claims and assessments against the Company, in addition to those discussed previously and those otherwise provided for in the Company’s consolidated financial statements, have arisen in the course of the Company’s business, including, but not limited to, in connection with its activities as an insurer, employer, investor, investment advisor and taxpayer. Further, state insurance regulatory authorities and other federal and state authorities regularly make inquiries and conduct investigations concerning the Company’s compliance with applicable insurance and other laws and regulations. It is not possible to predict the ultimate outcome of all pending investigations and legal proceedings or provide reasonable ranges of potential losses, except as noted previously in connection with specific matters. In some of the matters referred to previously, very large and/or indeterminate amounts, including punitive and treble damages, are sought. Although in light of these considerations it is possible that an adverse outcome in certain cases could have a material adverse effect upon the Company’s financial position, based on information currently known by the Company’s management, in its opinion, the outcomes of such pending investigations and legal proceedings are not likely to have such an effect. However, given the large and/or indeterminate amounts sought in certain of these matters and the inherent unpredictability of litigation, it is possible that an adverse outcome in certain matters could, from time to time, have a material adverse effect on the Company’s consolidated net income or cash flows in particular quarterly or annual periods. Insolvency Assessments Most of the jurisdictions in which the Company is admitted to transact business require insurers doing business within the jurisdiction to participate in guaranty associations, which are organized to pay contractual benefits owed pursuant to insurance policies issued by impaired, insolvent or failed insurers. These associations levy assessments, up to prescribed limits, on all member insurers in a particular state on the basis of the proportionate share of the premiums written by member insurers in the lines of business in which the impaired, insolvent or failed insurer engaged. Some states permit member insurers to recover assessments paid through full or partial premium tax offsets. Assets and liabilities held for insolvency assessments are as follows: 2007 2006 December 31, (In millions) Other Assets: Premium tax offset for future undiscounted assessments . . . . . . . . . . . . . . . . . . . . . . . . . . . . . . . . . . . . $40 $45 Premium tax offsets currently available for paid assessments . . . . . . . . . . . . . . . . . . . . . . . . . . . . . . . . . 6 7 Receivable for reimbursement of paid assessments (1) . . . . . . . . . . . . . . . . . . . . . . . . . . . . . . . . . . . . . 7 10 $53 $62 Liability: Insolvency assessments . . . . . . . . . . . . . . . . . . . . . . . . . . . . . . . . . . . . . . . . . . . . . . . . . . . . . . . . . $74 $90 (1) The Company holds a receivable from the seller of a prior acquisition in accordance with the purchase agreement. Assessments levied against the Company were ($1) million, $2 million and $4 million for the years ended December 31, 2007, 2006 and 2005, respectively. Impact of Hurricanes On August 29, 2005, Hurricane Katrina made landfall in the states of Louisiana, Mississippi and Alabama, causing catastrophic damage to these coastal regions. MetLife’s cumulative gross losses from Hurricane Katrina were $314 million, $333 million and $335 million at December 31, 2007, 2006 and 2005, respectively, primarily arising from the Company’s homeowners business. During the years ended December 31, 2007, 2006 and 2005, the Company recognized net losses, net of income tax and reinsurance recoverables and including reinstatement premiums and other reinsurance-related premium adjustments related to the catastrophe, of ($13) million, ($2) million and $134 million, respectively. On October 24, 2005, Hurricane Wilma made landfall across the state of Florida. MetLife’s cumulative gross losses from Hurricane Wilma were $66 million, $64 million and $57 million at December 31, 2007, 2006 and 2005, respectively, primarily arising from the Company’s homeowners and automobile businesses. During the years ended December 31, 2006 and 2005, the Company’s Auto & Home segment recognized net losses, net of income tax and reinsurance recoverables, of ($3) million and $32 million, respectively, related to Hurricane Wilma. The Company did not recognize any loss during the year ended December 31, 2007, related to Hurricane Wilma. Additional hurricane-related losses may be recorded in future periods as claims are received from insureds and claims to reinsurers are processed. Reinsurance recoveries are dependent upon the continued creditworthiness of the reinsurers, which may be affected by their other reinsured losses in connection with Hurricanes Katrina and Wilma and otherwise. In addition, lawsuits, including purported class actions, have been filed in Louisiana and Mississippi challenging denial of claims for damages caused to property during Hurricane Katrina. Metropolitan Property and Casualty Insurance Company is a named party in some of these lawsuits. In addition, rulings in cases in which Metropolitan Property and Casualty Insurance Company is not a party may affect interpretation of its policies. Metropolitan Property and F-58 MetLife, Inc. MetLife, Inc. Notes to Consolidated Financial Statements — (Continued)
  • 155.
    Casualty Insurance Companyintends to vigorously defend these matters. However, any adverse rulings could result in an increase in the Company’s hurricane-related claim exposure and losses. Based on information known by management, it does not believe that additional claim losses resulting from Hurricane Katrina will have a material adverse impact on the Company’s consolidated financial statements. Argentina The Argentinean economic, regulatory and legal environment, including interpretations of laws and regulations by regulators and courts, is uncertain. Potential legal or governmental actions related to pension reform, fiduciary responsibilities, performance guarantees and tax rulings could adversely affect the results of the Company. Upon acquisition of Citigroup’s insurance operations in Argentina, the Company established insurance liabilities, most significantly death and disability policy liabilities, based upon its interpretation of Argentinean law at the time and the Company’s best estimate of its obligations under such law. In 2006, a decree was issued by the Argentine Government regarding the taxability of pesification-related gains resulting in the reduction of certain tax liabilities. In 2007, pension reform legislation in Argentina was enacted which changed the Company’s obligations and resulted in the elimination of the death and disability liabilities and the establishment of a liability for servicing obligations. Commitments Leases In accordance with industry practice, certain of the Company’s income from lease agreements with retail tenants are contingent upon the level of the tenants’ sales revenues. Additionally, the Company, as lessee, has entered into various lease and sublease agreements for office space, data processing and other equipment. Future minimum rental and sublease income, and minimum gross rental payments relating to these lease agreements are as follows: Rental Income Sublease Income Gross Rental Payments (In millions) 2008 . . . . . . . . . . . . . . . . . . . . . . . . . . . . . . . . . . . . . . . . . . . . . . . . . . . . . . . . . . $455 $21 $ 254 2009 . . . . . . . . . . . . . . . . . . . . . . . . . . . . . . . . . . . . . . . . . . . . . . . . . . . . . . . . . . $421 $13 $ 234 2010 . . . . . . . . . . . . . . . . . . . . . . . . . . . . . . . . . . . . . . . . . . . . . . . . . . . . . . . . . . $368 $ 8 $ 208 2011 . . . . . . . . . . . . . . . . . . . . . . . . . . . . . . . . . . . . . . . . . . . . . . . . . . . . . . . . . . $292 $ 8 $ 177 2012 . . . . . . . . . . . . . . . . . . . . . . . . . . . . . . . . . . . . . . . . . . . . . . . . . . . . . . . . . . $217 $ 7 $ 139 Thereafter . . . . . . . . . . . . . . . . . . . . . . . . . . . . . . . . . . . . . . . . . . . . . . . . . . . . . . . $766 $ 7 $1,155 Commitments to Fund Partnership Investments The Company makes commitments to fund partnership investments in the normal course of business. The amounts of these unfunded commitments were $5.3 billion and $3.0 billion at December 31, 2007 and 2006, respectively. The Company anticipates that these amounts will be invested in partnerships over the next five years. Mortgage Loan Commitments The Company commits to lend funds under mortgage loan commitments. The amounts of these mortgage loan commitments were $4.0 billion at both December 31, 2007 and 2006. Commitments to Fund Bank Credit Facilities, Bridge Loans and Private Corporate Bond Investments The Company commits to lend funds under bank credit facilities, bridge loans and private corporate bond investments. The amounts of these unfunded commitments were $1.2 billion and $1.9 billion at December 31, 2007 and 2006, respectively. Other Commitments In December 2005, RGA repurchased 1.6 million shares of its outstanding common stock at an aggregate price of $76 million under an accelerated share repurchase agreement with a major bank. The bank borrowed the stock sold to RGA from third parties and purchased the shares in the open market over the subsequent few months to return to the lenders. RGA would either pay or receive an amount based on the actual amount paid by the bank to purchase the shares. These repurchases resulted in an increase in the Company’s ownership percentage of RGA to approximately 53% at December 31, 2005 from approximately 52% at December 31, 2004. In February 2006, the final purchase price was determined, resulting in a cash settlement substantially equal to the aggregate cost. RGA recorded the initial repurchase of shares as treasury stock and recorded the amount received as an adjustment to the cost of the treasury stock. At December 31, 2007, the Company’s ownership was approximately 52% of RGA. Guarantees In the normal course of its business, the Company has provided certain indemnities, guarantees and commitments to third parties pursuant to which it may be required to make payments now or in the future. In the context of acquisition, disposition, investment and other transactions, the Company has provided indemnities and guarantees, including those related to tax, environmental and other specific liabilities, and other indemnities and guarantees that are triggered by, among other things, breaches of representations, warranties or covenants provided by the Company. In addition, in the normal course of business, the Company provides indemnifications to counter- parties in contracts with triggers similar to the foregoing, as well as for certain other liabilities, such as third party lawsuits. These obligations are often subject to time limitations that vary in duration, including contractual limitations and those that arise by operation of law, such as applicable statutes of limitation. In some cases, the maximum potential obligation under the indemnities and guarantees is subject to a contractual limitation ranging from less than $1 million to $800 million, with a cumulative maximum of $2.3 billion, while in other cases such limitations are not specified or applicable. Since certain of these obligations are not subject to limitations, the Company does not believe that it is possible to determine the maximum potential amount that could become due under these guarantees in the future. F-59MetLife, Inc. MetLife, Inc. Notes to Consolidated Financial Statements — (Continued)
  • 156.
    In addition, theCompany indemnifies its directors and officers as provided in its charters and by-laws. Also, the Company indemnifies its agents for liabilities incurred as a result of their representation of the Company’s interests. Since these indemnities are generally not subject to limitation with respect to duration or amount, the Company does not believe that it is possible to determine the maximum potential amount that could become due under these indemnities in the future. The Company has also guaranteed minimum investment returns on certain international retirement funds in accordance with local laws. Since these guarantees are not subject to limitation with respect to duration or amount, the Company does not believe that it is possible to determine the maximum potential amount that could become due under these guarantees in the future. During the year ended December 31, 2007, the Company recorded a $1 million liability with respect to a guarantee previously provided to MLII, a former subsidiary. The Company’s recorded liabilities at December 31, 2007 and 2006 for indemnities, guarantees and commitments were $6 million and $5 million, respectively. In connection with synthetically created investment transactions, the Company writes credit default swap obligations that generally require payment of principal outstanding due in exchange for the referenced credit obligation. If a credit event, as defined by the contract, occurs the Company’s maximum amount at risk, assuming the value of the referenced credits becomes worthless, was $1.7 billion at December 31, 2007. The credit default swaps expire at various times during the next ten years. 17. Employee Benefit Plans Pension and Other Postretirement Benefit Plans The Subsidiaries sponsor and/or administer various qualified and non-qualified defined benefit pension plans and other postretirement employee benefit plans covering employees and sales representatives who meet specified eligibility requirements. Pension benefits are provided utilizing either a traditional formula or cash balance formula. The traditional formula provides benefits based upon years of credited service and either final average or career average earnings. The cash balance formula utilizes hypothetical or notional accounts which credit participants with benefits equal to a percentage of eligible pay as well as earnings credits, determined annually based upon the average annual rate of interest on 30-year U.S. Treasury securities, for each account balance. As of December 31, 2007, virtually all of the Subsidiaries’ obligations have been calculated using the traditional formula. The non-qualified pension plans provide supplemental benefits, in excess of amounts permitted by governmental agencies, to certain executive level employees. The Subsidiaries also provide certain postemployment benefits and certain postretirement medical and life insurance benefits for retired employees. Employees of the Subsidiaries who were hired prior to 2003 (or, in certain cases, rehired during or after 2003) and meet age and service criteria while working for one of the Subsidiaries, may become eligible for these other postretirement benefits, at various levels, in accordance with the applicable plans. Virtually all retirees, or their beneficiaries, contribute a portion of the total cost of postretirement medical benefits. Employees hired after 2003 are not eligible for any employer subsidy for postretirement medical benefits. In connection with the acquisition of Travelers, the employees of Travelers and any other Citigroup affiliate in the United States who became employees of certain Subsidiaries in connection with that acquisition (including those who remained employees of companies acquired in that acquisition) will be credited with service recognized by Citigroup for purposes of determining eligibility and vesting under the Plan with respect to benefits earned under the Plan subsequent to the closing date of the acquisition. Neither the Holding Company nor its subsidiaries assumed an obligation for benefits earned under defined benefit plans of Citigroup or Travelers prior to the acquisition. As described more fully in Note 1, effective December 31, 2006, the Company adopted SFAS 158. The adoption of SFAS 158 required the recognition of the funded status of defined benefit pension and other postretirement plans and eliminated the additional minimum pension liability provision of SFAS 87. The Company’s additional minimum pension liability was $78 million, and the intangible asset was $12 million, at December 31, 2005. The excess of the additional minimum pension liability over the intangible asset of $66 million, $41 million net of income tax, was recorded as a reduction of accumulated other comprehensive income. At December 31, 2006, immediately prior to adopting SFAS 158, the Company’s additional minimum pension liability was $92 million. The additional minimum pension liability of $59 million, net of income tax of $33 million, was recorded as a reduction of accumulated other comprehensive income. The change in the additional minimum pension liability of $18 million, net of income tax, was reflected as a component of comprehensive income for the year ended December 31, 2006. Upon adoption of SFAS 158, the Company eliminated the additional minimum pension liability and recognized as an adjustment to accumulated other comprehensive income, net of income tax, those amounts of actuarial gains and losses, prior service costs and credits, and the remaining net transition asset or obligation that had not yet been included in net periodic benefit cost at the date of adoption. F-60 MetLife, Inc. MetLife, Inc. Notes to Consolidated Financial Statements — (Continued)
  • 157.
    The following tablesummarizes the adjustments to the December 31, 2006 consolidated balance sheet as a result of recognizing the funded status of the defined benefit plans: Balance Sheet Caption Pre SFAS 158 Adjustments Additional Minimum Pension Liability Adjustment Adoption of SFAS 158 Adjustment Post SFAS 158 Adjustments December 31, 2006 (In millions) Other assets: Prepaid pension benefit cost . . . . . . . . . . . . . . . . . . . . . . . $1,937 $ — $ (993) $ 944 Other assets: Intangible asset . . . . . . . . . . . . . . . . . . . . . . . . . . . . . . . $ 12 $(12) $ — $ — Other liabilities: Accrued pension benefit cost . . . . . . . . . . . . . . . . . . . . . $ (505) $(14) $ (79) $ (598) Other liabilities: Accrued other postretirement benefit cost . . . . . . . . . . . . . $ (802) $ — $ (99) $ (901) Accumulated other comprehensive income, before income tax: Defined benefit plans . . . . . . . . . . . . . . . . . . . . . . . . . . . . . . . . . . . . $ (66) $(26) $(1,171) $(1,263) Minority interest . . . . . . . . . . . . . . . . . . . . . . . . . . . . . . . . . . . . . . . . . $ — $ 8 Deferred income tax . . . . . . . . . . . . . . . . . . . . . . . . . . . . . . . . . . . . . . $ 8 $ 419 Accumulated other comprehensive income, net of income tax: Defined benefit plans . . . . . . . . . . . . . . . . . . . . . . . . . . . . . . . . . . . . $ (41) $(18) $ (744) $ (803) A December 31 measurement date is used for all of the Subsidiaries’ defined benefit pension and other postretirement benefit plans. Obligations, Funded Status and Net Periodic Benefit Costs 2007 2006 2007 2006 Pension Benefits Other Postretirement Benefits December 31, (In millions) Change in benefit obligation: Benefit obligation at beginning of year . . . . . . . . . . . . . . . . . . . . . . . . . . . . . . . . . $5,959 $5,766 $2,073 $2,176 Service cost . . . . . . . . . . . . . . . . . . . . . . . . . . . . . . . . . . . . . . . . . . . . . . . . 166 163 27 35 Interest cost . . . . . . . . . . . . . . . . . . . . . . . . . . . . . . . . . . . . . . . . . . . . . . . . 354 335 104 117 Plan participants’ contributions . . . . . . . . . . . . . . . . . . . . . . . . . . . . . . . . . . . . — — 31 29 Divestitures . . . . . . . . . . . . . . . . . . . . . . . . . . . . . . . . . . . . . . . . . . . . . . . . — (4) — — Net actuarial (gains) losses . . . . . . . . . . . . . . . . . . . . . . . . . . . . . . . . . . . . . . (390) 27 (464) 1 Change in benefits . . . . . . . . . . . . . . . . . . . . . . . . . . . . . . . . . . . . . . . . . . . . 39 (6) — (143) Prescription drug subsidy . . . . . . . . . . . . . . . . . . . . . . . . . . . . . . . . . . . . . . . — — 13 10 Benefits paid. . . . . . . . . . . . . . . . . . . . . . . . . . . . . . . . . . . . . . . . . . . . . . . . (353) (322) (174) (152) Benefit obligation at end of year . . . . . . . . . . . . . . . . . . . . . . . . . . . . . . . . . . . . . 5,775 5,959 1,610 2,073 Change in plan assets: Fair value of plan assets at beginning of year . . . . . . . . . . . . . . . . . . . . . . . . . . . . 6,305 5,518 1,172 1,093 Actual return on plan assets . . . . . . . . . . . . . . . . . . . . . . . . . . . . . . . . . . . . . . 548 725 58 104 Divestitures . . . . . . . . . . . . . . . . . . . . . . . . . . . . . . . . . . . . . . . . . . . . . . . . — (4) — — Employer contribution . . . . . . . . . . . . . . . . . . . . . . . . . . . . . . . . . . . . . . . . . . 50 388 1 2 Benefits paid. . . . . . . . . . . . . . . . . . . . . . . . . . . . . . . . . . . . . . . . . . . . . . . . (353) (322) (48) (27) Fair value of plan assets at end of year . . . . . . . . . . . . . . . . . . . . . . . . . . . . . . . 6,550 6,305 1,183 1,172 Funded status at end of year . . . . . . . . . . . . . . . . . . . . . . . . . . . . . . . . . . . . . $ 775 $ 346 $ (427) $ (901) Amounts recognized in the consolidated balance sheet consist of: Other assets . . . . . . . . . . . . . . . . . . . . . . . . . . . . . . . . . . . . . . . . . . . . . . . . $1,393 $ 944 $ — $ — Other liabilities . . . . . . . . . . . . . . . . . . . . . . . . . . . . . . . . . . . . . . . . . . . . . . (618) (598) (427) (901) Net amount recognized . . . . . . . . . . . . . . . . . . . . . . . . . . . . . . . . . . . . . . . . . $ 775 $ 346 $ (427) $ (901) Accumulated other comprehensive (income) loss: Net actuarial (gains) losses . . . . . . . . . . . . . . . . . . . . . . . . . . . . . . . . . . . . . . $ 623 $1,123 $ (112) $ 328 Prior service cost (credit) . . . . . . . . . . . . . . . . . . . . . . . . . . . . . . . . . . . . . . . . 64 41 (193) (230) Net asset at transition . . . . . . . . . . . . . . . . . . . . . . . . . . . . . . . . . . . . . . . . . . — — — 1 687 1,164 (305) 99 Deferred income tax and minority interest . . . . . . . . . . . . . . . . . . . . . . . . . . . . . (251) (423) 109 (37) $ 436 $ 741 $ (196) $ 62 F-61MetLife, Inc. MetLife, Inc. Notes to Consolidated Financial Statements — (Continued)
  • 158.
    The aggregate projectedbenefit obligation and aggregate fair value of plan assets for the pension plans were as follows: 2007 2006 2007 2006 2007 2006 Qualified Plans Non-Qualified Plans Total December 31, (In millions) Aggregate fair value of plan assets (principally Company contracts) . . $6,550 $6,305 $ — $ — $6,550 $6,305 Aggregate projected benefit obligation . . . . . . . . . . . . . . . . . . . . . 5,174 5,381 601 578 5,775 5,959 Over (under) funded . . . . . . . . . . . . . . . . . . . . . . . . . . . . . . . . . $1,376 $ 924 $(601) $(578) $ 775 $ 346 The accumulated benefit obligation for all defined benefit pension plans was $5,348 million and $5,505 million at December 31, 2007 and 2006, respectively. Information for pension plans with an accumulated benefit obligation in excess of plan assets is as follows: 2007 2006 December 31, (In millions) Projected benefit obligation . . . . . . . . . . . . . . . . . . . . . . . . . . . . . . . . . . . . . . . . . . . . . . . . . . . . . . . . $616 $594 Accumulated benefit obligation . . . . . . . . . . . . . . . . . . . . . . . . . . . . . . . . . . . . . . . . . . . . . . . . . . . . . $533 $501 Fair value of plan assets . . . . . . . . . . . . . . . . . . . . . . . . . . . . . . . . . . . . . . . . . . . . . . . . . . . . . . . . . . $ — $ — Information for pension and other postretirement plans with a projected benefit obligation in excess of plan assets is as follows: 2007 2006 2007 2006 Pension Benefits Other Postretirement Benefits December 31, (In millions) Projected benefit obligation . . . . . . . . . . . . . . . . . . . . . . . . . . . . . . . . . . . . . . . . . . $646 $623 $1,610 $2,073 Fair value of plan assets . . . . . . . . . . . . . . . . . . . . . . . . . . . . . . . . . . . . . . . . . . . . $ 28 $ 25 $1,183 $1,172 The components of net periodic benefit cost and other changes in plan assets and benefit obligations recognized in other compre- hensive income were as follows: 2007 2006 2005 2007 2006 2005 Pension Benefits Other Postretirement Benefits Years Ended December 31, (In millions) Net Periodic Benefit Cost Service cost . . . . . . . . . . . . . . . . . . . . . . . . . . . . . . . . . . . . . . . . . $ 166 $ 163 $ 142 $ 27 $ 35 $ 37 Interest cost . . . . . . . . . . . . . . . . . . . . . . . . . . . . . . . . . . . . . . . . . 354 335 318 104 117 121 Expected return on plan assets . . . . . . . . . . . . . . . . . . . . . . . . . . . . (507) (454) (446) (86) (79) (79) Amortization of net actuarial (gains) losses . . . . . . . . . . . . . . . . . . . . . 68 125 116 — 23 15 Amortization of prior service cost (credit) . . . . . . . . . . . . . . . . . . . . . . 17 11 16 (36) (36) (17) Net periodic benefit cost . . . . . . . . . . . . . . . . . . . . . . . . . . . . . . . 98 $ 180 $ 146 9 $ 60 $ 77 Other Changes in Plan Assets and Benefit Obligations Recognized in Other Comprehensive Income Net actuarial (gains) losses . . . . . . . . . . . . . . . . . . . . . . . . . . . . . . . (432) (440) Prior service cost (credit). . . . . . . . . . . . . . . . . . . . . . . . . . . . . . . . . 40 — Amortization of net actuarial (gains) losses . . . . . . . . . . . . . . . . . . . . . (68) — Amortization of prior service cost (credit) . . . . . . . . . . . . . . . . . . . . . . (17) 36 Total recognized in other comprehensive income . . . . . . . . . . . . . . . . (477) (404) Total recognized in net periodic benefit cost and other comprehensive income . . . . . . . . . . . . . . . . . . . . . . . . . . . . . . . . . . . . . . . . . $(379) $(395) Included within other comprehensive income are other changes in plan assets and benefit obligations associated with pension benefits of ($477) million and other postretirement benefits of ($404) million for an aggregate reduction in other comprehensive income of ($881) million before income tax and $563 million, net of income tax and minority interest. The estimated net actuarial losses and prior service cost for the pension plans that will be amortized from accumulated other comprehensive income into net periodic benefit cost over the next year are both $14 million. The estimated net actuarial gains and prior service credit for the defined benefit other postretirement plans that will be amortized from accumulated other comprehensive income into net periodic benefit cost over the next year are less than $1 million and $37 million, respectively. F-62 MetLife, Inc. MetLife, Inc. Notes to Consolidated Financial Statements — (Continued)
  • 159.
    In 2004, theCompany adopted the guidance in FSP 106-2, Accounting and Disclosure Requirements Related to the Medicare Prescription Drug, Improvement and Modernization Act of 2003 (“FSP 106-2”), to account for future subsidies to be received under the Prescription Drug Act. The Company began receiving these subsidies during 2006. A summary of the reduction to the APBO and related reduction to the components of net periodic other postretirement benefit cost is as follows: 2007 2006 2005 December 31, (In millions) Cumulative reduction in benefit obligation: Beginning of year . . . . . . . . . . . . . . . . . . . . . . . . . . . . . . . . . . . . . . . . . . . . . . . . . . . . . . . $328 $298 $230 Service cost . . . . . . . . . . . . . . . . . . . . . . . . . . . . . . . . . . . . . . . . . . . . . . . . . . . . . . . . . . . 7 6 6 Interest cost . . . . . . . . . . . . . . . . . . . . . . . . . . . . . . . . . . . . . . . . . . . . . . . . . . . . . . . . . . . 19 19 16 Net actuarial gains (losses) . . . . . . . . . . . . . . . . . . . . . . . . . . . . . . . . . . . . . . . . . . . . . . . . . (42) 15 46 Prescription drug subsidy . . . . . . . . . . . . . . . . . . . . . . . . . . . . . . . . . . . . . . . . . . . . . . . . . . (13) (10) — End of year . . . . . . . . . . . . . . . . . . . . . . . . . . . . . . . . . . . . . . . . . . . . . . . . . . . . . . . . . . $299 $328 $298 2007 2006 2005 Years Ended December 31, (In millions) Reduction in net periodic benefit cost: Service cost . . . . . . . . . . . . . . . . . . . . . . . . . . . . . . . . . . . . . . . . . . . . . . . . . . . . . . . . . . . . . $ 7 $ 6 $ 6 Interest cost . . . . . . . . . . . . . . . . . . . . . . . . . . . . . . . . . . . . . . . . . . . . . . . . . . . . . . . . . . . . . 19 19 16 Amortization of net actuarial gains (losses) . . . . . . . . . . . . . . . . . . . . . . . . . . . . . . . . . . . . . . . . . 5 30 23 Total reduction in net periodic benefit cost . . . . . . . . . . . . . . . . . . . . . . . . . . . . . . . . . . . . . . . . $31 $55 $45 The Company received subsidies of $10 million and $8 million for the years ended December 31, 2007 and 2006, respectively. Assumptions Assumptions used in determining benefit obligations were as follows: 2007 2006 2007 2006 Pension Benefits Other Postretirement Benefits December 31, Weighted average discount rate . . . . . . . . . . . . . . . . . . . . . . . . . . . . . . . . . . . . 6.65% 6.00% 6.65% 6.00% Rate of compensation increase . . . . . . . . . . . . . . . . . . . . . . . . . . . . . . . . . . . . . 3.5%-8% 3%-8% N/A N/A Assumptions used in determining net periodic benefit cost were as follows: 2007 2006 2005 2007 2006 2005 Pension Benefits Other Postretirement Benefits December 31, Weighted average discount rate . . . . . . . . . . . . . . . . . . . . . . . 6.00% 5.82% 5.83% 6.00% 5.82% 5.98% Weighted average expected rate of return on plan assets . . . . . . . 8.25% 8.25% 8.50% 7.47% 7.42% 7.51% Rate of compensation increase . . . . . . . . . . . . . . . . . . . . . . . . 3.5%-8% 3%-8% 3%-8% N/A N/A N/A The discount rate is determined annually based on the yield, measured on a yield to worst basis, of a hypothetical portfolio constructed of high quality debt instruments available on the valuation date, which would provide the necessary future cash flows to pay the aggregate projected benefit obligation when due. The expected rate of return on plan assets is based on anticipated performance of the various asset sectors in which the plan invests, weighted by target allocation percentages. Anticipated future performance is based on long-term historical returns of the plan assets by sector, adjusted for the Subsidiaries’ long-term expectations on the performance of the markets. While the precise expected return derived using this approach will fluctuate from year to year, the Subsidiaries’ policy is to hold this long-term assumption constant as long as it remains within reasonable tolerance from the derived rate. The weighted average expected return on plan assets for use in that plan’s valuation in 2008 is currently anticipated to be 8.25% for pension benefits and postretirement medical benefits and 6.25% for postretirement life benefits. The assumed healthcare cost trend rates used in measuring the APBO and net periodic benefit cost were as follows: 2007 2006 December 31, Pre-Medicare eligible claims . . . . . . . . . . . . . . . . . . . . . . . . . . 8.5% down to 5% in 2014 9.0% down to 5% in 2014 Medicare eligible claims . . . . . . . . . . . . . . . . . . . . . . . . . . . . . 10.5% down to 5% in 2018 11.0% down to 5% in 2018 F-63MetLife, Inc. MetLife, Inc. Notes to Consolidated Financial Statements — (Continued)
  • 160.
    Assumed healthcare costtrend rates may have a significant effect on the amounts reported for healthcare plans. A one-percentage point change in assumed healthcare cost trend rates would have the following effects: One Percent Increase One Percent Decrease (In millions) Effect on total of service and interest cost components . . . . . . . . . . . . . . . . . . . . . . . . . . . . . . $ 7 $ (6) Effect of accumulated postretirement benefit obligation . . . . . . . . . . . . . . . . . . . . . . . . . . . . . . $63 $(62) Plan Assets The Subsidiaries have issued group annuity and life insurance contracts supporting approximately 98% of all pension and other postretirement benefit plans assets. The account values of the group annuity and life insurance contracts issued by the Subsidiaries and held as assets of the pension and other postretirement benefit plans were $7,565 million and $7,321 million as of December 31, 2007 and 2006, respectively. The majority of such account values are held in separate accounts established by the Subsidiaries. Total revenue from these contracts recognized in the consolidated statements of income was $28 million, $29 million and $28 million for the years ended December 31, 2007, 2006 and 2005, respectively, and includes policy charges, net investment income from investments backing the contracts and administrative fees. Total investment income, including realized and unrealized gains and losses, credited to the account balances were $603 million, $818 million and $460 million for the years ended December 31, 2007, 2006 and 2005, respectively. The terms of these contracts are consistent in all material respects with those the Subsidiaries offer to unaffiliated parties that are similarly situated. The weighted-average allocations of pension plan and other postretirement benefit plan assets were as follows: 2007 2006 2007 2006 Pension Benefits Other Postretirement Benefits December 31, Asset Category Equity securities . . . . . . . . . . . . . . . . . . . . . . . . . . . . . . . . . . . . . . . . . . . . . . . . . . . 38% 42% 37% 37% Fixed maturity securities . . . . . . . . . . . . . . . . . . . . . . . . . . . . . . . . . . . . . . . . . . . . . . 44% 42% 58% 57% Other (Real Estate and Alternative Investments) . . . . . . . . . . . . . . . . . . . . . . . . . . . . . . . 18% 16% 5% 6% Total . . . . . . . . . . . . . . . . . . . . . . . . . . . . . . . . . . . . . . . . . . . . . . . . . . . . . . . 100% 100% 100% 100% The weighted-average target allocations of pension plan and other postretirement benefit plan assets for 2008 are as follows: Pension Other Asset Category Equity securities . . . . . . . . . . . . . . . . . . . . . . . . . . . . . . . . . . . . . . . . . . . . . . . . . . . . . . . . . 30%-55% 30%-45% Fixed maturity securities . . . . . . . . . . . . . . . . . . . . . . . . . . . . . . . . . . . . . . . . . . . . . . . . . . . . 30%-65% 45%-70% Other (Real Estate and Alternative Investments) . . . . . . . . . . . . . . . . . . . . . . . . . . . . . . . . . . . . . 10%-25% 0%-10% Target allocations of assets are determined with the objective of maximizing returns and minimizing volatility of net assets through adequate asset diversification. Adjustments are made to target allocations based on an assessment of the impact of economic factors and market conditions. Cash Flows It is the Subsidiaries’ practice to make contributions to the qualified pension plans to comply with minimum funding requirements of the Employee Retirement Income Security Act of 1974, as amended. In accordance with such practice, no contributions were required for the years ended December 31, 2007 or 2006. No contributions will be required for 2008. The Subsidiaries did not make discretionary contributions to the qualified pension plans during the year ended December 31, 2007 and made contributions of $350 million during the year ended December 31, 2006. The Subsidiaries expect to make additional discretionary contributions of $150 million in 2008. Benefit payments due under the non-qualified pension plans are funded from the Subsidiaries’ general assets as they become due under the provision of the plans. These payments totaled $50 million and $38 million for the years ended December 31, 2007 and 2006, respectively. These payments are expected to be at approximately the same level in 2008. Other postretirement benefits represent a non-vested, non-guaranteed obligation of the Subsidiaries and current regulations do not require specific funding levels for these benefits. While the Subsidiaries have partially funded such plans in advance, it has been the Subsidiaries’ practice to primarily use their general assets, net of participant’s contributions, to pay postretirement medical claims as they come due in lieu of utilizing plan assets. Total payments equaled $174 million and $152 million for the years ended December 31, 2007 and 2006, respectively. The Subsidiaries’ expect to make contributions of $116 million, net of participant’s contributions, towards the other postretirement plan obligations in 2008. As noted previously, the Subsidiaries expect to receive subsidies under the Prescription Drug Act to partially offset such payments. F-64 MetLife, Inc. MetLife, Inc. Notes to Consolidated Financial Statements — (Continued)
  • 161.
    Gross benefit paymentsfor the next ten years, which reflect expected future service where appropriate, and gross subsidies to be received under the Prescription Drug Act are expected to be as follows: Pension Benefits Gross Prescription Drug Subsidies Net Other Postretirement Benefits (In millions) 2008 . . . . . . . . . . . . . . . . . . . . . . . . . . . . . . . . . . . . . . . . . . . . . . . . . . . . . $ 360 $116 $ (14) $102 2009 . . . . . . . . . . . . . . . . . . . . . . . . . . . . . . . . . . . . . . . . . . . . . . . . . . . . . $ 373 $120 $ (15) $105 2010 . . . . . . . . . . . . . . . . . . . . . . . . . . . . . . . . . . . . . . . . . . . . . . . . . . . . . $ 383 $124 $ (16) $109 2011 . . . . . . . . . . . . . . . . . . . . . . . . . . . . . . . . . . . . . . . . . . . . . . . . . . . . . $ 397 $129 $ (16) $113 2012 . . . . . . . . . . . . . . . . . . . . . . . . . . . . . . . . . . . . . . . . . . . . . . . . . . . . . $ 413 $132 $ (17) $115 2013-2017 . . . . . . . . . . . . . . . . . . . . . . . . . . . . . . . . . . . . . . . . . . . . . . . . . $2,288 $713 $(100) $613 Savings and Investment Plans The Subsidiaries sponsor savings and investment plans for substantially all employees under which a portion of employee contributions are matched. The Subsidiaries contributed $79 million, $82 million and $78 million for the years ended December 31, 2007, 2006 and 2005, respectively. 18. Equity Preferred Stock Issuances In September 1999, the Holding Company adopted a stockholder rights plan (the “rights plan”) under which each outstanding share of common stock issued between April 4, 2000 and the distribution date (as defined in the rights plan) will be coupled with a stockholder right. Each right will entitle the holder to purchase one one-hundredth of a share of Series A Junior Participating Preferred Stock. Each one one- hundredth of a share of Series A Junior Participating Preferred Stock will have economic and voting terms equivalent to one share of common stock. Until it is exercised, the right itself will not entitle the holder thereof to any rights as a stockholder, including the right to receive dividends or to vote at stockholder meetings. Stockholder rights are not exercisable until the distribution date, and will expire at the close of business on April 4, 2010, unless earlier redeemed or exchanged by the Holding Company. The rights plan is designed to protect stockholders in the event of unsolicited offers to acquire the Holding Company and other coercive takeover tactics. In connection with financing the acquisition of Travelers on July 1, 2005, which is described in Note 2, the Holding Company issued preferred shares as follows: In June 2005, the Holding Company issued 24 million shares of Floating Rate Non-Cumulative Preferred Stock, Series A (the “Series A preferred shares”) with a $0.01 par value per share, and a liquidation preference of $25 per share, for aggregate proceeds of $600 million. In June 2005, the Holding Company issued 60 million shares of 6.50% Non-Cumulative Preferred Stock, Series B (the “Series B preferred shares”), with a $0.01 par value per share, and a liquidation preference of $25 per share, for aggregate proceeds of $1.5 billion. The Series A and Series B preferred shares (the “Preferred Shares”) rank senior to the common stock with respect to dividends and liquidation rights. Dividends on the Preferred Shares are not cumulative. Holders of the Preferred Shares will be entitled to receive dividend payments only when, as and if declared by the Holding Company’s Board of Directors or a duly authorized committee of the board. If dividends are declared on the Series A preferred shares, they will be payable quarterly, in arrears, at an annual rate of the greater of: (i) 1.00% above 3-month LIBOR on the related LIBOR determination date; or (ii) 4.00%. Any dividends declared on the Series B preferred shares will be payable quarterly, in arrears, at an annual fixed rate of 6.50%. Accordingly, in the event that dividends are not declared on the Preferred Shares for payment on any dividend payment date, then those dividends will cease to accrue and be payable. If a dividend is not declared before the dividend payment date, the Holding Company has no obligation to pay dividends accrued for that dividend period whether or not dividends are declared and paid in future periods. No dividends may, however, be paid or declared on the Holding Company’s common stock — or any other securities ranking junior to the Preferred Shares — unless the full dividends for the latest completed dividend period on all Preferred Shares, and any parity stock, have been declared and paid or provided for. The Holding Company is prohibited from declaring dividends on the Preferred Shares if it fails to meet specified capital adequacy, net income and shareholders’ equity levels. In addition, under Federal Reserve Board policy, the Holding Company may not be able to pay dividends if it does not earn sufficient operating income. The Preferred Shares do not have voting rights except in certain circumstances where the dividends have not been paid for an equivalent of six or more dividend payment periods whether or not those periods are consecutive. Under such circumstances, the holders of the Preferred Shares have certain voting rights with respect to members of the Board of Directors of the Holding Company. The Preferred Shares are not subject to any mandatory redemption, sinking fund, retirement fund, purchase fund or similar provisions. The Preferred Shares are redeemable, but not prior to September 15, 2010. On and after that date, subject to regulatory approval, the Preferred Shares will be redeemable at the Holding Company’s option in whole or in part, at a redemption price of $25 per Preferred Share, plus declared and unpaid dividends. In connection with the offering of the Preferred Shares, the Holding Company incurred $56.8 million of issuance costs which have been recorded as a reduction of additional paid-in capital. F-65MetLife, Inc. MetLife, Inc. Notes to Consolidated Financial Statements — (Continued)
  • 162.
    Dividends Information on thedeclaration, record and payment dates, as well as per share and aggregate dividend amounts, for the Preferred Shares is as follows: Declaration Date Record Date Payment Date Series A Per Share Series A Aggregate Series B Per Share Series B Aggregate Dividend (In millions, except per share data) November 15, 2007 . . . . . . . . . . November 30, 2007 December 17, 2007 $0.4230476 $11 $0.4062500 $24 August 15, 2007 . . . . . . . . . . . . August 31, 2007 September 17, 2007 $0.4063333 $10 $0.4062500 $24 May 15, 2007 . . . . . . . . . . . . . . May 31, 2007 June 15, 2007 $0.4060062 $10 $0.4062500 $24 March 5, 2007 . . . . . . . . . . . . . February 28, 2007 March 15, 2007 $0.3975000 $10 $0.4062500 $24 $41 $96 November 15, 2006 . . . . . . . . . . November 30, 2006 December 15, 2006 $0.4038125 $10 $0.4062500 $24 August 15, 2006 . . . . . . . . . . . . August 31, 2006 September 15, 2006 $0.4043771 $10 $0.4062500 $24 May 16, 2006 . . . . . . . . . . . . . . May 31, 2006 June 15, 2006 $0.3775833 $ 9 $0.4062500 $24 March 6, 2006 . . . . . . . . . . . . . February 28, 2006 March 15, 2006 $0.3432031 $ 9 $0.4062500 $24 $38 $96 November 15, 2005 . . . . . . . . . . November 30, 2005 December 15, 2005 $0.3077569 $ 8 $0.4062500 $24 August 22, 2005 . . . . . . . . . . . . August 31, 2005 September 15, 2005 $0.2865690 $ 7 $0.4017361 $24 $15 $48 See Note 25 for further information. Common Stock Repurchases In October 2004, the Company’s Board of Directors authorized a $1 billion common stock repurchase program. In February 2007, the Company’s Board of Directors authorized an additional $1 billion common stock repurchase program. In September 2007, the Company’s Board of Directors authorized an additional $1 billion common stock repurchase program which began after the completion of the $1 billion common stock repurchase program authorized in February 2007. In January 2008, the Company’s Board of Directors authorized an additional $1 billion common stock repurchase program, which began after the completion of the September 2007 program. (See Note 25). Under these authorizations, the Company may purchase its common stock from the MetLife Policyholder Trust, in the open market (including pursuant to the terms of a pre-set trading plan meeting the requirements of Rule 10b5-1 under the Exchange Act) and in privately negotiated transactions. The Company has entered into the following accelerated common stock repurchase agreements: • In December 2004, the Company repurchased 7.3 million shares of its outstanding common stock at an aggregate cost of $300 million under an accelerated common stock repurchase agreement with a major bank. The bank borrowed the stock sold to the Company from third parties and purchased the common stock in the open market to return to such third parties. In April 2005, the Company received a cash adjustment of $7 million based on the actual amount paid by the bank to purchase the common stock, for a final purchase price of $293 million. The Company recorded the shares initially repurchased as treasury stock and recorded the amount received as an adjustment to the cost of the treasury stock. • In December 2006, the Company repurchased 4.0 million shares of its outstanding common stock at an aggregate cost of $232 million under an accelerated common stock repurchase agreement with a major bank. The bank borrowed the common stock sold to the Company from third parties and purchased the common stock in the open market to return to such third parties. In February 2007, the Company paid a cash adjustment of $8 million for a final purchase price of $240 million. The Company recorded the shares initially repurchased as treasury stock and recorded the amount paid as an adjustment to the cost of the treasury stock. • In March 2007, the Company repurchased 11.9 million shares of its outstanding common stock at an aggregate cost of $750 million under an accelerated common stock repurchase agreement with a major bank. The bank borrowed the common stock sold to the Company from third parties and purchased common stock in the open market to return to such third parties. In June 2007, the Company paid a cash adjustment of $17 million for a final purchase price of $767 million. The Company recorded the shares initially repurchased as treasury stock and recorded the amount paid as an adjustment to the cost of the treasury stock. • In November 2007, the Company repurchased 11.6 million shares of its outstanding common stock at an initial cost of $750 million under an accelerated common stock repurchase agreement with a major bank. The bank borrowed the stock sold to the Company from third parties and purchased the common stock in the open market to return to such third parties. Also, in November 2007, the Company received a cash adjustment of $19 million based on the trading price of the common stock during the repurchase period, for a final purchase price of $731 million. The Company recorded the shares initially repurchased as treasury stock and recorded the amount received as an adjustment to the cost of the treasury stock. • In December 2007, the Company entered into an accelerated common stock repurchase agreement with a major bank. Under the terms of the agreement, the Company paid the bank $450 million in cash in January 2008 in exchange for 6.6 million shares of the Company’s outstanding common stock that the bank borrowed from third parties. Also, in January 2008, the bank delivered 1.1 million additional shares of the Company’s common stock to the Company resulting in a total of 7.7 million shares being repurchased under the agreement. At December 31, 2007, the Company recorded the obligation to pay $450 million to the bank as a F-66 MetLife, Inc. MetLife, Inc. Notes to Consolidated Financial Statements — (Continued)
  • 163.
    reduction of additionalpaid-in capital. Upon settlement with the bank, the Company increased additional paid-in capital and reduced treasury stock. • See Note 25 for further information with respect to an accelerated common stock repurchase agreement executed subsequent to December 31, 2007. The Company also repurchased 3.1 million and 4.6 million shares through open market purchases for $200 million and $268 million, respectively, during the years ended December 31, 2007 and 2006, respectively. Cumulatively, the Company repurchased 26.6 million and 8.6 million shares of its common stock for $1.7 billion and $500 million during the years ended December 31, 2007 and 2006, respectively. The Company did not repurchase any shares of its common stock during the year ended December 31, 2005. During the years ended December 31, 2007, 2006 and 2005, 3.9 million, 3.1 million and 25.0 million shares of common stock were issued from treasury stock for $172 million, $102 million and $819 million, respectively, of which 22.4 million shares with a market value of $1 billion were issued in connection with the acquisition of Travelers on July 1, 2005. See Note 2. At December 31, 2006 the Company had $216 million remaining on the October 2004 common stock repurchase program which was subsequently reduced by $8 million to $208 million after the February 2007 cash adjustment to the December 2006 accelerated common stock repurchase agreement. The February 2007 stock repurchase program authorization was fully utilized during 2007. At December 31, 2007, $511 million remained on the Company’s September 2007 common stock repurchase program. The $511 million remaining on the September 2007 common stock repurchase program was reduced by $450 million to $61 million upon settlement of the accelerated stock repurchase agreement executed during December 2007 but for which no settlement occurred until January 2008. Subsequent to the January 2008 authorization, the amount remaining under these repurchase programs was $1,061 million. After execution of the accelerated stock repurchase agreement in February 2008 and certain open market purchases as more fully described in Note 25, the Company’s remaining authorization is $261 million. Future common stock repurchases will be dependent upon several factors, including the Company’s capital position, its financial strength and credit ratings, general market conditions and the price of the Company’s common stock. Stock Purchase Contracts See Note 13 regarding stock purchase contracts issued by the Company on June 21, 2005 in connection with the issuance of the common equity units. Dividends The table below presents declaration, record and payment dates, as well as per share and aggregate dividend amounts, for the common stock: Declaration Date Record Date Payment Date Per Share Aggregate Dividend (In millions, except per share data) October 23, 2007 . . . . . . . . . . November 6, 2007 December 14, 2007 $0.74 $541 October 24, 2006 . . . . . . . . . . November 6, 2006 December 15, 2006 $0.59 $450 October 25, 2005 . . . . . . . . . . November 7, 2005 December 15, 2005 $0.52 $394 Stock-Based Compensation Plans Overview As described more fully in Note 1, effective January 1, 2006, the Company adopted SFAS 123(r), using the modified prospective transition method. The adoption of SFAS 123(r) did not have a significant impact on the Company’s financial position or results of operations. Description of Plans The MetLife, Inc. 2000 Stock Incentive Plan, as amended (the “Stock Incentive Plan”), authorized the granting of awards in the form of options to buy shares of the Company’s common stock (“Stock Options”) that either qualify as incentive Stock Options under Section 422A of the Internal Revenue Code or are non-qualified. The MetLife, Inc. 2000 Directors Stock Plan, as amended (the “Directors Stock Plan”), authorized the granting of awards in the form of the Company’s common stock, non-qualified Stock Options, or a combination of the foregoing to outside Directors of the Company. Under the MetLife, Inc. 2005 Stock and Incentive Compensation Plan, as amended (the “2005 Stock Plan”), awards granted may be in the form of Stock Options, Stock Appreciation Rights, Restricted Stock or Restricted Stock Units, Performance Shares or Performance Share Units, Cash-Based Awards, and Stock-Based Awards (each as defined in the 2005 Stock Plan). Under the MetLife, Inc. 2005 Non-Management Director Stock Compensation Plan (the “2005 Directors Stock Plan”), awards granted may be in the form of non-qualified Stock Options, Stock Appreciation Rights, Restricted Stock or Restricted Stock Units, or Stock-Based Awards (each as defined in the 2005 Directors Stock Plan). The Stock Incentive Plan, Directors Stock Plan, 2005 Stock Plan, the 2005 Directors Stock Plan and the LTPCP, as described below, are hereinafter collectively referred to as the “Incentive Plans.” The aggregate number of shares reserved for issuance under the 2005 Stock Plan and the LTPCP is 68,000,000, plus those shares available but not utilized under the Stock Incentive Plan and those shares utilized under the Stock Incentive Plan that are recovered due to forfeiture of Stock Options. Additional shares carried forward from the Stock Incentive Plan and available for issuance under the 2005 Stock Plan were 12,506,003 as of December 31, 2007. There were no shares carried forward from the Directors Stock Plan. Each share issued under the 2005 Stock Plan in connection with a Stock Option or Stock Appreciation Right reduces the number of shares remaining for issuance under that plan by one, and each share issued under the 2005 Stock Plan in connection with awards other than Stock Options or Stock Appreciation Rights reduces the number of shares remaining for issuance under that plan by 1.179 shares. The number of shares F-67MetLife, Inc. MetLife, Inc. Notes to Consolidated Financial Statements — (Continued)
  • 164.
    reserved for issuanceunder the 2005 Directors Stock Plan are 2,000,000. As of December 31, 2007, the aggregate number of shares remaining available for issuance pursuant to the 2005 Stock Plan and the 2005 Directors Stock Plan were 60,862,366 and 1,918,170, respectively. Stock Option exercises and other stock-based awards to employees settled in shares are satisfied through the issuance of shares held in treasury by the Company. Under the current authorized share repurchase program, as described previously, sufficient treasury shares exist to satisfy foreseeable obligations under the Incentive Plans. Compensation expense related to awards under the Incentive Plans is recognized based on the number of awards expected to vest, which represents the awards granted less expected forfeitures over the life of the award, as estimated at the date of grant. Unless a material deviation from the assumed rate is observed during the term in which the awards are expensed, any adjustment necessary to reflect differences in actual experience is recognized in the period the award becomes payable or exercisable. Compensation expense of $145 million, $144 million and $120 million, and income tax benefits of $51 million, $50 million and $42 million, related to the Incentive Plans was recognized for the years ended December 31, 2007, 2006 and 2005, respectively. Compensation expense is principally related to the issuance of Stock Options, Performance Shares and LTPCP arrangements. As described in Note 1, the Company changed its policy prospectively for recognizing expense for stock-based awards to retirement eligible employees. Had the Company continued to recognize expense over the stated requisite service period, compensation expense related to the Incentive Plans would have been $118 million, $116 million and $120 million, rather than $145 million, $144 million and $120 million, for the years ended December 31, 2007, 2006 and 2005, respectively. Had the Company applied the policy of recognizing expense related to stock-based compensation over the shorter of the requisite service period or the period to attainment of retirement eligibility for awards granted prior to January 1, 2006, pro forma compensation expense would have been $118 million, $120 million and $122 million for the years ended December 31, 2007, 2006 and 2005, respectively. Stock Options All Stock Options granted had an exercise price equal to the closing price of the Company’s common stock as reported on the New York Stock Exchange on the date of grant, and have a maximum term of ten years. Certain Stock Options granted under the Stock Incentive Plan and the 2005 Stock Plan have or will become exercisable over a three year period commencing with the date of grant, while other Stock Options have or will become exercisable three years after the date of grant. Stock Options issued under the Directors Stock Plan were exercisable immediately. The date at which any Stock Option issued under the 2005 Directors Stock Plan becomes exercisable would be determined at the time such Stock Option is granted. A summary of the activity related to Stock Options for the year ended December 31, 2007 is presented below. The aggregate intrinsic value was computed using the closing share price on December 31, 2007 of $61.62 and December 29, 2006 of $59.01, as applicable. Shares Under Option Weighted Average Exercise Price Weighted Average Remaining Contractual Term Aggregate Intrinsic Value (Years) (In millions) Outstanding at January 1, 2007 . . . . . . . . . . . . . . . . . . . . . . . . 24,891,651 $34.68 6.58 $606 Granted . . . . . . . . . . . . . . . . . . . . . . . . . . . . . . . . . . . . . . . . 3,297,875 $62.86 Exercised . . . . . . . . . . . . . . . . . . . . . . . . . . . . . . . . . . . . . . . (3,518,083) $31.33 Cancelled/Expired . . . . . . . . . . . . . . . . . . . . . . . . . . . . . . . . . (68,314) $30.57 Forfeited. . . . . . . . . . . . . . . . . . . . . . . . . . . . . . . . . . . . . . . . (172,582) $55.13 Outstanding at December 31, 2007 . . . . . . . . . . . . . . . . . . . . . . 24,430,547 $38.83 6.17 $557 Aggregate number of stock options expected to vest at December 31, 2007 . . . . . . . . . . . . . . . . . . . . . . . . . . . . . . . 23,845,241 $38.49 6.12 $551 Exercisable at December 31, 2007 . . . . . . . . . . . . . . . . . . . . . . 17,460,955 $32.83 5.28 $503 Prior to January 1, 2005, the Black-Scholes model was used to determine the fair value of Stock Options granted and recognized in the financial statements or as reported in the pro forma disclosure which follows. The fair value of Stock Options issued on or after January 1, 2005 was estimated on the date of grant using a binomial lattice model. The Company made this change because lattice models produce more accurate option values due to the ability to incorporate assumptions about grantee exercise behavior resulting from changes in the price of the underlying shares. In addition, lattice models allow for changes in critical assumptions over the life of the option in comparison to closed-form models like Black-Scholes, which require single-value assumptions at the time of grant. The Company used daily historical volatility since the inception of trading when calculating Stock Option values using the Black-Scholes model. In conjunction with the change to the binomial lattice model, the Company began estimating expected future volatility based upon an analysis of historical prices of the Holding Company’s common stock and call options on that common stock traded on the open market. The Company uses a weighted-average of the implied volatility for publicly traded call options with the longest remaining maturity nearest to the money as of each valuation date and the historical volatility, calculated using monthly closing prices of the Holding Company’s common stock. The Company chose a monthly measurement interval for historical volatility as it believes this better depicts the nature of employee option exercise decisions being based on longer-term trends in the price of the underlying shares rather than on daily price movements. The risk-free rate is based on observed interest rates for instruments with maturities similar to the expected term of the Stock Options. Whereas the Black-Scholes model requires a single spot rate for instruments with a term matching the expected life of the option at the valuation date, the binomial lattice model allows for the use of different rates for each year over the contractual term of the option. The table F-68 MetLife, Inc. MetLife, Inc. Notes to Consolidated Financial Statements — (Continued)
  • 165.
    below presents thefull range of imputed forward rates for U.S. Treasury Strips that was used in the binomial lattice model over the contractual term of all Stock Options granted in the period. Dividend yield is determined based on historical dividend distributions compared to the price of the underlying common stock as of the valuation date and held constant over the life of the Stock Option. Use of the Black-Scholes model requires an input of the expected life of the Stock Options, or the average number of years before Stock Options will be exercised or expired. The Company estimated expected life using the historical average years to exercise or cancellation and average remaining years outstanding for vested Stock Options. Alternatively, the binomial model used by the Company incorporates the contractual term of the Stock Options and then considers expected exercise behavior and a post-vesting termination rate, or the rate at which vested options are exercised or expire prematurely due to termination of employment, to derive an expected life. The post-vesting termination rate is determined from actual historical exercise and expiration activity under the Incentive Plans. Exercise behavior in the binomial lattice model used by the Company is expressed using an exercise multiple, which reflects the ratio of exercise price to the strike price of Stock Options granted at which holders of the Stock Options are expected to exercise. The exercise multiple is derived from actual historical exercise activity. The following weighted average assumptions, with the exception of risk-free rate, which is expressed as a range, were used to determine the fair value of Stock Options issued during the: 2007 2006 2005 Years Ended December 31, Dividend yield . . . . . . . . . . . . . . . . . . . . . . . . . . . . . . . . . . . . . . . 0.94% 1.04% 1.19% Risk-free rate of return . . . . . . . . . . . . . . . . . . . . . . . . . . . . . . . . . . 4.30%-5.32% 4.17%-4.96% 3.34%-5.41% Expected volatility . . . . . . . . . . . . . . . . . . . . . . . . . . . . . . . . . . . . . 19.54% 22.00% 23.24% Exercise multiple . . . . . . . . . . . . . . . . . . . . . . . . . . . . . . . . . . . . . 1.66 1.52 1.48 Post-vesting termination rate . . . . . . . . . . . . . . . . . . . . . . . . . . . . . . 3.66% 4.09% 5.19% Contractual term (years) . . . . . . . . . . . . . . . . . . . . . . . . . . . . . . . . . 10 10 10 Expected life (years) . . . . . . . . . . . . . . . . . . . . . . . . . . . . . . . . . . . 6 6 6 Weighted average exercise price of stock options granted. . . . . . . . . . . $62.86 $50.21 $38.70 Weighted average fair value of stock options granted . . . . . . . . . . . . . . $17.76 $13.84 $10.09 Compensation expense related to Stock Option awards expected to vest and granted prior to January 1, 2006 is recognized ratably over the requisite service period, which equals the vesting term. Compensation expense related to Stock Option awards expected to vest and granted on or after January 1, 2006 is recognized ratably over the requisite service period or the period to retirement eligibility, if shorter. Compensation expense of $55 million, $56 million and $50 million related to Stock Options was recognized for the years ended December 31, 2007, 2006 and 2005, respectively. Had compensation expense for grants awarded prior to January 1, 2003 been determined based on the fair value at the date of grant rather than the intrinsic value method, the Company’s earnings and earnings per common share amounts would have been reduced to the following pro forma amounts for the following: Year Ended December 31, 2005 (In millions, except per share data) Net income available to common shareholders . . . . . . . . . . . . . . . . . . . . . . . . . . . . . . . . . . . . . . . . . . . . $4,651 Add: Stock option-based employee compensation expense included in reported net income, net of income tax . . $ 33 Deduct: Total stock option-based employee compensation determined under fair value based method for all awards, net of income tax . . . . . . . . . . . . . . . . . . . . . . . . . . . . . . . . . . . . . . . . . . . . . . . . . . . . . . . . $ (35) Pro forma net income available to common shareholders. . . . . . . . . . . . . . . . . . . . . . . . . . . . . . . . . . . . . . $4,649 Basic earnings per common share As reported . . . . . . . . . . . . . . . . . . . . . . . . . . . . . . . . . . . . . . . . . . . . . . . . . . . . . . . . . . . . . . . . . . . $ 6.21 Pro forma . . . . . . . . . . . . . . . . . . . . . . . . . . . . . . . . . . . . . . . . . . . . . . . . . . . . . . . . . . . . . . . . . . . . $ 6.21 Diluted earnings per common share As reported . . . . . . . . . . . . . . . . . . . . . . . . . . . . . . . . . . . . . . . . . . . . . . . . . . . . . . . . . . . . . . . . . . . $ 6.16 Pro forma . . . . . . . . . . . . . . . . . . . . . . . . . . . . . . . . . . . . . . . . . . . . . . . . . . . . . . . . . . . . . . . . . . . . $ 6.15 As of December 31, 2007, there were $41 million of total unrecognized compensation costs related to Stock Options. It is expected that these costs will be recognized over a weighted average period of 1.70 years. F-69MetLife, Inc. MetLife, Inc. Notes to Consolidated Financial Statements — (Continued)
  • 166.
    The following isa summary of Stock Option exercise activity for the: 2007 2006 2005 Years Ended December 31, (In millions) Total intrinsic value of stock options exercised . . . . . . . . . . . . . . . . . . . . . . . . . . . . . . . . . . . . . . . $122 $65 $39 Cash received from exercise of stock options . . . . . . . . . . . . . . . . . . . . . . . . . . . . . . . . . . . . . . . . $110 $83 $72 Tax benefit realized from stock options exercised . . . . . . . . . . . . . . . . . . . . . . . . . . . . . . . . . . . . . . $ 43 $23 $13 Performance Shares Beginning in 2005, certain members of management were awarded Performance Shares under (and as defined in) the 2005 Stock Plan. Participants are awarded an initial target number of Performance Shares with the final number of Performance Shares payable being determined by the product of the initial target multiplied by a factor of 0.0 to 2.0. The factor applied is based on measurements of the Company’s performance with respect to: (i) the change in annual net operating earnings per share, as defined; and (ii) the proportionate total shareholder return, as defined, with reference to the three-year performance period relative to other companies in the S&P Insurance Index with reference to the same three-year period. Performance Share awards will normally vest in their entirety at the end of the three- year performance period (subject to certain contingencies) and will be payable entirely in shares of the Company’s common stock. The following is a summary of Performance Share activity for the year ended December 31, 2007: Performance Shares Weighted Average Grant Date Fair Value Outstanding at January 1, 2007 . . . . . . . . . . . . . . . . . . . . . . . . . . . . . . . . . . . . . . . . . . 1,849,575 $42.24 Granted . . . . . . . . . . . . . . . . . . . . . . . . . . . . . . . . . . . . . . . . . . . . . . . . . . . . . . . . 916,075 $60.86 Forfeited . . . . . . . . . . . . . . . . . . . . . . . . . . . . . . . . . . . . . . . . . . . . . . . . . . . . . . . (75,525) $49.20 Outstanding at December 31, 2007 . . . . . . . . . . . . . . . . . . . . . . . . . . . . . . . . . . . . . . . 2,690,125 $48.39 Performance Shares expected to vest at December 31, 2007 . . . . . . . . . . . . . . . . . . . . . . 2,641,669 $48.20 Performance Share amounts above represent aggregate initial target awards and do not reflect potential increases or decreases resulting from the final performance factor to be determined at the end of the respective performance period. As of December 31, 2007, the three year performance period for the 2005 Performance Share grants was completed. Included in the immediately preceding table are 965,525 outstanding Performance Shares to which the final performance factor will be applied. The calculation of the performance factor is expected to be finalized during the second quarter of 2008 after all data necessary to perform the calculation is publicly available. Performance Share awards are accounted for as equity awards but are not credited with dividend-equivalents for actual dividends paid on the Holding Company’s common stock during the performance period. Accordingly, the fair value of Performance Shares is based upon the closing price of the Holding Company’s common stock on the date of grant, reduced by the present value of estimated dividends to be paid on that stock during the performance period. Compensation expense related to initial Performance Shares granted prior to January 1, 2006 and expected to vest is recognized ratably during the performance period. Compensation expense related to initial Performance Shares granted on or after January 1, 2006 and expected to vest is recognized ratably over the performance period or the period to retirement eligibility, if shorter. Performance Shares expected to vest and the related compensation expenses may be further adjusted by the performance factor most likely to be achieved, as estimated by management, at the end of the performance period. Compensation expense of $90 million, $74 million and $24 million, related to Performance Shares was recognized for the years ended December 31, 2007, 2006 and 2005, respectively. As of December 31, 2007, there were $57 million of total unrecognized compensation costs related to Performance Share awards. It is expected that these costs will be recognized over a weighted average period of 1.72 years. Long-Term Performance Compensation Plan Prior to January 1, 2005, the Company granted stock-based compensation to certain members of management under the LTPCP. Each participant was assigned a target compensation amount (an “Opportunity Award”) at the inception of the performance period with the final compensation amount determined based on the total shareholder return on the Company’s common stock over the three-year perfor- mance period, subject to limited further adjustment approved by the Company’s Board of Directors. Payments on the Opportunity Awards were normally payable in their entirety (subject to certain contingencies) at the end of the three-year performance period, and were paid in whole or in part with shares of the Company’s common stock, as approved by the Company’s Board of Directors. There were no new grants under the LTPCP during the years ended December 31, 2007, 2006 and 2005. A portion of each Opportunity Award under the LTPCP was settled in shares of the Holding Company’s common stock while the remainder was settled in cash. The portion of the Opportunity Award settled in shares of the Holding Company’s common stock was accounted for as an equity award with the fair value of the award determined based upon the closing price of the Holding Company’s common stock on the date of grant. The compensation expense associated with the equity award, based upon the grant date fair value, was recognized into expense ratably over the respective three-year performance period. The portion of the Opportunity Award settled in cash was accounted for as a liability and was remeasured using the closing price of the Holding Company’s common stock on the final day of each subsequent reporting period during the three-year performance period. The final LTPCP performance period concluded during the six months ended June 30, 2007. Final Opportunity Awards in the amount of 618,375 shares of the Company’s common stock and $16 million in cash were paid on April 18, 2007. No significant compensation F-70 MetLife, Inc. MetLife, Inc. Notes to Consolidated Financial Statements — (Continued)
  • 167.
    expense related toLTPCP was recognized during the year ended December 31, 2007. Compensation expense of $14 million and $46 million, related to LTPCP Opportunity Awards was recognized for the years ended December 31, 2006 and 2005, respectively. Statutory Equity and Income Each insurance company’s state of domicile imposes minimum risk-based capital (“RBC”) requirements that were developed by the National Association of Insurance Commissioners (“NAIC”). The formulas for determining the amount of RBC specify various weighting factors that are applied to financial balances or various levels of activity based on the perceived degree of risk. Regulatory compliance is determined by a ratio of total adjusted capital, as defined by the NAIC, to authorized control level RBC, as defined by the NAIC. Companies below specific trigger points or ratios are classified within certain levels, each of which requires specified corrective action. Each of the Holding Company’s U.S. insurance subsidiaries exceeded the minimum RBC requirements for all periods presented herein. The NAIC adopted the Codification of Statutory Accounting Principles (“Codification”) in 2001. Codification was intended to standardize regulatory accounting and reporting to state insurance departments. However, statutory accounting principles continue to be established by individual state laws and permitted practices. Modifications by the various state insurance departments may impact the effect of Codification on the statutory capital and surplus of MLIC and the Holding Company’s other insurance subsidiaries. Statutory accounting principles differ from GAAP primarily by charging policy acquisition costs to expense as incurred, establishing future policy benefit liabilities using different actuarial assumptions, reporting surplus notes as surplus instead of debt and valuing securities on a different basis. In addition, certain assets are not admitted under statutory accounting principles and are charged directly to surplus. The most significant assets not admitted by the Company are net deferred income tax assets resulting from temporary differences between statutory accounting principles basis and tax basis not expected to reverse and become recoverable within a year. Further, statutory accounting principles do not give recognition to purchase accounting adjustments. Statutory net income of MLIC, a New York domiciled insurer, was $2.1 billion, $1.0 billion and $2.2 billion for the years ended December 31, 2007, 2006 and 2005, respectively. Statutory capital and surplus, as filed with the Department, was $13.0 billion and $9.2 billion at December 31, 2007 and 2006, respectively. Statutory net income of MICC, a Connecticut domiciled insurer, was $1.1 billion and $856 million for the years ended December 31, 2007 and 2006, respectively, and $470 million from the date of purchase, for the six month period ended December 31, 2005. Statutory capital and surplus, as filed with the Connecticut Insurance Department, was $4.2 billion and $4.1 billion at December 31, 2007 and 2006, respectively. Due to the merger of MetLife Life and Annuity Company of Connecticut with MICC, the 2006 statutory net income balance was adjusted. Statutory net income of MPC, a Rhode Island domiciled insurer, was $400 million, $385 million and $289 million for the years ended December 31, 2007, 2006 and 2005, respectively. Statutory capital and surplus, as filed with the Insurance Department of Rhode Island, was $1.8 billion and $1.9 billion at December 31, 2007 and 2006, respectively. Statutory net income of MTL, a Delaware domiciled insurer, was $103 million, $2.8 billion and $353 million for the years ended December 31, 2007, 2006 and 2005, respectively. Statutory capital and surplus, as filed with the Delaware Insurance Department was $1.1 billion and $1.0 billion as of December 31, 2007 and 2006, respectively. Dividend Restrictions The table below sets forth the dividends permitted to be paid by the respective insurance subsidiary without insurance regulatory approval and the respective dividends paid: Company Permitted w/o Approval(1) Paid(2) Permitted w/o Approval(3) Paid(2) Permitted w/o Approval(3) 2008 2007 2006 (In millions) Metropolitan Life Insurance Company . . . . . . . . . . . . . . . . . . . . . . $1,299 $500 $919 $ 863 $863 MetLife Insurance Company of Connecticut . . . . . . . . . . . . . . . . . . $1,026 $690(5) $690 $ 917(4) $ — Metropolitan Tower Life Insurance Company . . . . . . . . . . . . . . . . . $ 113 $ — $104 $2,300 $ 85 Metropolitan Property and Casualty Insurance Company . . . . . . . . . . . . . . . $ — $400 $ 16 $ 300 $178 (1) Reflects dividend amounts that may be paid during 2008 without prior regulatory approval. However, if paid before a specified date during 2008, some or all of such dividends may require regulatory approval. (2) Includes amounts paid including those requiring regulatory approval. (3) Reflects dividend amounts that could have been paid during the relevant year without prior regulatory approval. (4) Includes a return of capital of $259 million. (5) Includes a return of capital of $404 million as approved by the applicable insurance department, of which $350 million was paid to the Holding Company. Under New York State Insurance Law, MLIC is permitted, without prior insurance regulatory clearance, to pay stockholder dividends to the Holding Company as long as the aggregate amount of all such dividends in any calendar year does not exceed the lesser of: (i) 10% of its surplus to policyholders as of the end of the immediately preceding calendar year; or (ii) its statutory net gain from operations for the immediately preceding calendar year (excluding realized capital gains). MLIC will be permitted to pay a cash dividend to the Holding Company in excess of the lesser of such two amounts only if it files notice of its intention to declare such a dividend and the amount thereof with the Superintendent and the Superintendent does not disapprove the distribution within 30 days of its filing. Under New York State Insurance Law, the Superintendent has broad discretion in determining whether the financial condition of a stock life insurance company would support the payment of such dividends to its shareholders. The New York State Department of Insurance (the “Department”) has F-71MetLife, Inc. MetLife, Inc. Notes to Consolidated Financial Statements — (Continued)
  • 168.
    established informal guidelinesfor such determinations. The guidelines, among other things, focus on the insurer’s overall financial condition and profitability under statutory accounting practices. Under Connecticut State Insurance Law, MICC is permitted, without prior insurance regulatory clearance, to pay shareholder dividends to its parent as long as the amount of such dividends, when aggregated with all other dividends in the preceding 12 months, does not exceed the greater of: (i) 10% of its surplus to policyholders as of the end of the immediately preceding calendar year; or (ii) its statutory net gain from operations for the immediately preceding calendar year. MICC will be permitted to pay a cash dividend in excess of the greater of such two amounts only if it files notice of its declaration of such a dividend and the amount thereof with the Connecticut Commissioner of Insurance (“Commissioner”) and the Commissioner does not disapprove the payment within 30 days after notice. In addition, any dividend that exceeds earned surplus (unassigned funds, reduced by 25% of unrealized appreciation in value or revaluation of assets or unrealized profits on investments) as of the last filed annual statutory statement requires insurance regulatory approval. Under Connecticut State Insurance Law, the Commissioner has broad discretion in determining whether the financial condition of a stock life insurance company would support the payment of such dividends to its shareholders. The Connecticut State Insurance Law requires prior approval for any dividends for a period of two years following a change in control. As a result of the acquisition of MICC by the Holding Company on July 1, 2005, under Connecticut State Insurance Law, all dividend payments by MICC through June 30, 2007 required prior approval of the Commissioner. Under Delaware State Insurance Law, Metropolitan Tower Life Insurance Company (“MTL”) is permitted, without prior insurance regulatory clearance, to pay a stockholder dividend to the Holding Company as long as the amount of the dividend when aggregated with all other dividends in the preceding 12 months does not exceed the greater of: (i) 10% of its surplus to policyholders as of the end of the immediately preceding calendar year; or (ii) its statutory net gain from operations for the immediately preceding calendar year (excluding realized capital gains). MTL will be permitted to pay a cash dividend to the Holding Company in excess of the greater of such two amounts only if it files notice of the declaration of such a dividend and the amount thereof with the Delaware Commissioner of Insurance (the “Delaware Commissioner”) and the Delaware Commissioner does not disapprove the distribution within 30 days of its filing. In addition, any dividend that exceeds earned surplus (defined as unassigned funds) as of the last filed annual statutory statement requires insurance regulatory approval. Under Delaware State Insurance Law, the Delaware Commissioner has broad discretion in determining whether the financial condition of a stock life insurance company would support the payment of such dividends to its shareholders. Under Rhode Island State Insurance Law, MPC is permitted, without prior insurance regulatory clearance, to pay a stockholder dividend to the Holding Company as long as the aggregate amount of all such dividends in any twelve-month period does not exceed the lesser of: (i) 10% of its surplus to policyholders as of the end of the immediately preceding calendar year; or (ii) net income, not including realized capital gains, for the immediately preceding calendar year. MPC will be permitted to pay a cash dividend to the Holding Company in excess of the lesser of such two amounts only if it files notice of its intention to declare such a dividend and the amount thereof with the Rhode Island Commissioner of Insurance (the “Rhode Island Commissioner”) and the Rhode Island Commissioner does not disapprove the distribution within 30 days of its filing. Under Rhode Island State Insurance Code, the Rhode Island Commissioner has broad discretion in determining whether the financial condition of a stock property and casualty insurance company would support the payment of such dividends to its shareholders. Because MPC’s net income for the year ended December 31, 2007 excluding net realized capital gains and dividends paid, was negative, MPC cannot pay any dividends in 2008 without regulatory approval. Other Comprehensive Income (Loss) The following table sets forth the reclassification adjustments required for the years ended December 31, 2007, 2006 and 2005 in other comprehensive income (loss) that are included as part of net income for the current year that have been reported as a part of other comprehensive income (loss) in the current or prior year: 2007 2006 2005 Years Ended December 31, (In millions) Holding gains (losses) on investments arising during the year . . . . . . . . . . . . . . . . . . . . . . . $(1,485) $(1,022) $(3,697) Income tax effect of holding gains (losses) . . . . . . . . . . . . . . . . . . . . . . . . . . . . . . . . . . . 581 379 1,391 Reclassification adjustments: Recognized holding (gains) losses included in current year income . . . . . . . . . . . . . . . . . . 176 916 524 Amortization of premiums and accretion of discounts associated with investments . . . . . . . . (831) (600) (199) Income tax effect . . . . . . . . . . . . . . . . . . . . . . . . . . . . . . . . . . . . . . . . . . . . . . . . . . . . 254 (117) (122) Allocation of holding losses on investments relating to other policyholder amounts. . . . . . . . . . 676 581 1,670 Income tax effect of allocation of holding losses to other policyholder amounts . . . . . . . . . . . . (264) (215) (629) Unrealized investment gains of subsidiary at date of sale . . . . . . . . . . . . . . . . . . . . . . . . . . — — 15 Deferred income tax on unrealized investment gains of subsidiary at date of sale. . . . . . . . . . . — — (5) Net unrealized investment gains (losses) . . . . . . . . . . . . . . . . . . . . . . . . . . . . . . . . . . . . . (893) (78) (1,052) Foreign currency translation adjustments . . . . . . . . . . . . . . . . . . . . . . . . . . . . . . . . . . . . 290 46 (86) Foreign currency translation adjustments of subsidiary at date of sale . . . . . . . . . . . . . . . . . . — — 5 Foreign currency translation adjustment . . . . . . . . . . . . . . . . . . . . . . . . . . . . . . . . . . . . . 290 46 (81) Minimum pension liability adjustment . . . . . . . . . . . . . . . . . . . . . . . . . . . . . . . . . . . . . . . — (18) 89 Deferred benefit plan adjustment . . . . . . . . . . . . . . . . . . . . . . . . . . . . . . . . . . . . . . . . . . 563 — — Other comprehensive income (loss) . . . . . . . . . . . . . . . . . . . . . . . . . . . . . . . . . . . . . . . . $ (40) $ (50) $(1,044) F-72 MetLife, Inc. MetLife, Inc. Notes to Consolidated Financial Statements — (Continued)
  • 169.
    19. Other Expenses Informationon other expenses is as follows: 2007 2006 2005 Years Ended December 31, (In millions) Compensation . . . . . . . . . . . . . . . . . . . . . . . . . . . . . . . . . . . . . . . . . . . . . . . . . . . . . $ 3,556 $ 3,426 $ 3,217 Commissions . . . . . . . . . . . . . . . . . . . . . . . . . . . . . . . . . . . . . . . . . . . . . . . . . . . . . 4,114 3,801 3,510 Interest and debt issue costs . . . . . . . . . . . . . . . . . . . . . . . . . . . . . . . . . . . . . . . . . . . 1,116 900 659 Amortization of DAC and VOBA . . . . . . . . . . . . . . . . . . . . . . . . . . . . . . . . . . . . . . . . . . 2,776 2,422 2,450 Capitalization of DAC . . . . . . . . . . . . . . . . . . . . . . . . . . . . . . . . . . . . . . . . . . . . . . . . (3,892) (3,589) (3,604) Rent, net of sublease income . . . . . . . . . . . . . . . . . . . . . . . . . . . . . . . . . . . . . . . . . . . 309 287 296 Minority interest . . . . . . . . . . . . . . . . . . . . . . . . . . . . . . . . . . . . . . . . . . . . . . . . . . . . 240 234 154 Insurance tax . . . . . . . . . . . . . . . . . . . . . . . . . . . . . . . . . . . . . . . . . . . . . . . . . . . . . 760 712 530 Other. . . . . . . . . . . . . . . . . . . . . . . . . . . . . . . . . . . . . . . . . . . . . . . . . . . . . . . . . . . 2,694 2,590 2,052 Total other expenses . . . . . . . . . . . . . . . . . . . . . . . . . . . . . . . . . . . . . . . . . . . . . . . $11,673 $10,783 $ 9,264 20. Earnings Per Common Share The following table presents the weighted average shares used in calculating basic earnings per common share and those used in calculating diluted earnings per common share for each income category presented below: 2007 2006 2005 Years Ended December 31, (In millions, except share and per share data) Weighted average common stock outstanding for basic earnings per common share . . . . . . . . . . . . . . . . . . . . . . . . . . . . . . . . . . . . . . . 744,153,514 761,105,024 749,022,816 Incremental common shares from assumed: Stock purchase contracts underlying common equity units(1) . . . . . . . . . 7,138,900 1,416,134 — Exercise or issuance of stock-based awards. . . . . . . . . . . . . . . . . . . . 10,971,585 8,182,938 6,313,540 Weighted average common stock outstanding for diluted earnings per common share . . . . . . . . . . . . . . . . . . . . . . . . . . . . . . . . . . . . . . . 762,263,999 770,704,096 755,336,356 Earnings per common share before preferred stock dividends: Income from continuing operations . . . . . . . . . . . . . . . . . . . . . . $ 4,280 $ 3,071 $ 3,071 Basic . . . . . . . . . . . . . . . . . . . . . . . . . . . . . . . . . . . . . . . . . . . . $ 5.75 $ 4.03 $ 4.10 Diluted . . . . . . . . . . . . . . . . . . . . . . . . . . . . . . . . . . . . . . . . . . . $ 5.62 $ 3.99 $ 4.06 Income from discontinued operations, net of income tax . . . . . . . $ 37 $ 3,222 $ 1,643 Basic . . . . . . . . . . . . . . . . . . . . . . . . . . . . . . . . . . . . . . . . . . . . $ 0.05 $ 4.24 $ 2.19 Diluted . . . . . . . . . . . . . . . . . . . . . . . . . . . . . . . . . . . . . . . . . . . $ 0.04 $ 4.18 $ 2.18 Net income . . . . . . . . . . . . . . . . . . . . . . . . . . . . . . . . . . . . . . . . $ 4,317 $ 6,293 $ 4,714 Basic . . . . . . . . . . . . . . . . . . . . . . . . . . . . . . . . . . . . . . . . . . . . $ 5.80 $ 8.27 $ 6.29 Diluted . . . . . . . . . . . . . . . . . . . . . . . . . . . . . . . . . . . . . . . . . . . $ 5.66 $ 8.17 $ 6.24 Earnings per common share after preferred stock dividends: Income from continuing operations . . . . . . . . . . . . . . . . . . . . . . $ 4,280 $ 3,071 $ 3,071 Preferred stock dividends . . . . . . . . . . . . . . . . . . . . . . . . . . . . . . . . 137 134 63 Income from continuing operations available to common shareholders . . . . . . . . . . . . . . . . . . . . . . . . . . . . . . . . . . . . . $ 4,143 $ 2,937 $ 3,008 Basic . . . . . . . . . . . . . . . . . . . . . . . . . . . . . . . . . . . . . . . . . . . . $ 5.57 $ 3.85 $ 4.02 Diluted . . . . . . . . . . . . . . . . . . . . . . . . . . . . . . . . . . . . . . . . . . . $ 5.44 $ 3.81 $ 3.98 Net income . . . . . . . . . . . . . . . . . . . . . . . . . . . . . . . . . . . . . . . . $ 4,317 $ 6,293 $ 4,714 Preferred stock dividends . . . . . . . . . . . . . . . . . . . . . . . . . . . . . . . . 137 134 63 Net income available to common shareholders . . . . . . . . . . . . . . . . . . $ 4,180 $ 6,159 $ 4,651 Basic . . . . . . . . . . . . . . . . . . . . . . . . . . . . . . . . . . . . . . . . . . . . $ 5.62 $ 8.09 $ 6.21 Diluted . . . . . . . . . . . . . . . . . . . . . . . . . . . . . . . . . . . . . . . . . . . $ 5.48 $ 7.99 $ 6.16 (1) See Note 13 for a description of the Company’s common equity units. F-73MetLife, Inc. MetLife, Inc. Notes to Consolidated Financial Statements — (Continued)
  • 170.
    21. Quarterly Resultsof Operations (Unaudited) The unaudited quarterly results of operations for 2007 and 2006 are summarized in the table below: March 31, June 30, September 30, December 31, Three Months Ended (In millions, except per share data) 2007 Total revenues . . . . . . . . . . . . . . . . . . . . . . . . . . . . . . . . . . . . . . . . . . . . . $12,908 $13,216 $13,053 $13,830 Total expenses . . . . . . . . . . . . . . . . . . . . . . . . . . . . . . . . . . . . . . . . . . . . . $11,469 $11,586 $11,668 $12,245 Income from continuing operations . . . . . . . . . . . . . . . . . . . . . . . . . . . . . . . . $ 1,024 $ 1,154 $ 984 $ 1,118 Income (loss) from discontinued operations, net of income tax . . . . . . . . . . . . . . $ (7) $ 9 $ 35 $ — Net income . . . . . . . . . . . . . . . . . . . . . . . . . . . . . . . . . . . . . . . . . . . . . . . $ 1,017 $ 1,163 $ 1,019 $ 1,118 Net income available to common shareholders . . . . . . . . . . . . . . . . . . . . . . . . $ 983 $ 1,129 $ 985 $ 1,083 Basic earnings per share: Income from continuing operations available to common shareholders . . . . . . . . $ 1.32 $ 1.50 $ 1.28 $ 1.47 Income from discontinued operations, net of income tax, per common share . . . $ (0.01) $ 0.01 $ 0.05 $ — Net income . . . . . . . . . . . . . . . . . . . . . . . . . . . . . . . . . . . . . . . . . . . . . . $ 1.35 $ 1.56 $ 1.37 $ 1.52 Net income available to common shareholders, per common share . . . . . . . . . . $ 1.31 $ 1.52 $ 1.32 $ 1.47 Diluted earnings per share: Income from continuing operations available to common shareholders . . . . . . . . $ 1.29 $ 1.47 $ 1.25 $ 1.44 Income from discontinued operations, net of income tax, per common share . . . $ (0.01) $ 0.01 $ 0.05 $ — Net income . . . . . . . . . . . . . . . . . . . . . . . . . . . . . . . . . . . . . . . . . . . . . . $ 1.32 $ 1.52 $ 1.34 $ 1.48 Net income available to common shareholders, per common share . . . . . . . . . . $ 1.28 $ 1.48 $ 1.29 $ 1.44 2006 Total revenues . . . . . . . . . . . . . . . . . . . . . . . . . . . . . . . . . . . . . . . . . . . . . $11,528 $11,350 $12,525 $12,851 Total expenses . . . . . . . . . . . . . . . . . . . . . . . . . . . . . . . . . . . . . . . . . . . . . $10,518 $10,553 $11,212 $11,803 Income from continuing operations . . . . . . . . . . . . . . . . . . . . . . . . . . . . . . . . $ 727 $ 592 $ 958 $ 794 Income from discontinued operations, net of income tax . . . . . . . . . . . . . . . . . . $ 20 $ 58 $ 75 $ 3,069 Net income . . . . . . . . . . . . . . . . . . . . . . . . . . . . . . . . . . . . . . . . . . . . . . . $ 747 $ 650 $ 1,033 $ 3,863 Net income available to common shareholders . . . . . . . . . . . . . . . . . . . . . . . . $ 714 $ 617 $ 999 $ 3,829 Basic earnings per share: Income from continuing operations available to common shareholders . . . . . . . . $ 0.91 $ 0.73 $ 1.21 $ 1.00 Income from discontinued operations, net of income tax, per common share . . . $ 0.03 $ 0.08 $ 0.10 $ 4.03 Net income . . . . . . . . . . . . . . . . . . . . . . . . . . . . . . . . . . . . . . . . . . . . . . $ 0.98 $ 0.85 $ 1.35 $ 5.09 Net income available to common shareholders, per common share . . . . . . . . . . $ 0.94 $ 0.81 $ 1.31 $ 5.04 Diluted earnings per share: Income from continuing operations available to common shareholders . . . . . . . . $ 0.90 $ 0.73 $ 1.19 $ 0.99 Income from discontinued operations, net of income tax, per common share . . . $ 0.03 $ 0.08 $ 0.10 $ 3.98 Net income . . . . . . . . . . . . . . . . . . . . . . . . . . . . . . . . . . . . . . . . . . . . . . $ 0.97 $ 0.84 $ 1.34 $ 5.00 Net income available to common shareholders, per common share . . . . . . . . . . $ 0.93 $ 0.80 $ 1.29 $ 4.95 22. Business Segment Information The Company is a leading provider of insurance and other financial services with operations throughout the United States and the regions of Latin America, Europe, and Asia Pacific. The Company’s business is divided into five operating segments: Institutional, Individual, Auto & Home, International and Reinsurance, as well as Corporate & Other. These segments are managed separately because they either provide different products and services, require different strategies or have different technology requirements. Institutional offers a broad range of group insurance and retirement & savings products and services, including group life insurance, non-medical health insurance, such as short and long-term disability, long-term care, and dental insurance, and other insurance products and services. Individual offers a wide variety of protection and asset accumulation products, including life insurance, annuities and mutual funds. Auto & Home provides personal lines property and casualty insurance, including private passenger automobile, homeowners and personal excess liability insurance. International provides life insurance, accident and health insurance, annuities and retirement & savings products to both individuals and groups. Through the Company’s majority-owned subsidiary, RGA, the Reinsurance segment provides reinsurance of life and annuity policies in North America and various international markets. Additionally, reinsurance of critical illness policies is provided in select international markets. F-74 MetLife, Inc. MetLife, Inc. Notes to Consolidated Financial Statements — (Continued)
  • 171.
    Corporate & Othercontains the excess capital not allocated to the business segments, various start-up entities, MetLife Bank and run- off entities, as well as interest expense related to the majority of the Company’s outstanding debt and expenses associated with certain legal proceedings and income tax audit issues. Corporate & Other also includes the elimination of all intersegment amounts, which generally relate to intersegment loans, which bear interest rates commensurate with related borrowings, as well as intersegment transactions. Additionally, the Company’s asset management business, including amounts reported as discontinued operations, is included in the results of operations for Corporate & Other. See Note 23 for disclosures regarding discontinued operations, including real estate. Economic capital is an internally developed risk capital model, the purpose of which is to measure the risk in the business and to provide a basis upon which capital is deployed. The economic capital model accounts for the unique and specific nature of the risks inherent in MetLife’s businesses. As a part of the economic capital process, a portion of net investment income is credited to the segments based on the level of allocated equity. Set forth in the tables below is certain financial information with respect to the Company’s segments, as well as Corporate & Other, for the years ended December 31, 2007, 2006 and 2005. The accounting policies of the segments are the same as those of the Company, except for the method of capital allocation and the accounting for gains (losses) from intercompany sales, which are eliminated in consolidation. The Company allocates equity to each segment based upon the economic capital model that allows the Company to effectively manage its capital. The Company evaluates the performance of each segment based upon net income excluding net investment gains (losses), net of income tax, adjustments related to net investment gains (losses), net of income tax, the impact from the cumulative effect of changes in accounting, net of income tax and discontinued operations, other than discontinued real estate, net of income tax, less preferred stock dividends. The Company allocates certain non-recurring items, such as expenses associated with certain legal proceedings, to Corporate & Other. For the Year Ended December 31, 2007 Institutional Individual Auto & Home International Reinsurance Corporate & Other Total (In millions) Statement of Income: Premiums . . . . . . . . . . . . . . . . . . . . . . . $ 12,392 $ 4,496 $2,966 $ 3,096 $ 4,910 $ 35 $ 27,895 Universal life and investment- type product policy fees . . . . . . . . . . . . . . . . . . . . . 803 3,513 — 995 — — 5,311 Net investment income . . . . . . . . . . . . . . . 8,179 7,052 196 1,248 871 1,460 19,006 Other revenues . . . . . . . . . . . . . . . . . . . . 726 599 45 23 77 63 1,533 Net investment gains (losses) . . . . . . . . . . . (580) (99) 16 55 (177) 47 (738) Policyholder benefits and claims . . . . . . . . . 13,806 5,721 1,807 2,458 3,989 47 27,828 Interest credited to policyholder account balances . . . . . . . . . . . . . . . . . 3,094 2,030 — 355 262 — 5,741 Policyholder dividends . . . . . . . . . . . . . . . — 1,718 4 4 — — 1,726 Other expenses. . . . . . . . . . . . . . . . . . . . 2,438 4,031 830 1,748 1,226 1,400 11,673 Income from continuing operations before provision (benefit) for income tax . . . . . . . . . . . . . . . . 2,182 2,061 582 852 204 158 6,039 Provision (benefit) for income tax. . . . . . . . . 743 705 146 208 71 (114) 1,759 Income from continuing operations . . . . . . . 1,439 1,356 436 644 133 272 4,280 Income (loss) from discontinued operations, net of income tax . . . . . . . . . . . . . . . . . 10 1 — (9) — 35 37 Net income . . . . . . . . . . . . . . . . . . . . . . $ 1,449 $ 1,357 $ 436 $ 635 $ 133 $ 307 $ 4,317 Balance Sheet: Total assets . . . . . . . . . . . . . . . . . . . . . . $204,005 $250,691 $5,672 $26,357 $21,331 $50,506 $558,562 DAC and VOBA . . . . . . . . . . . . . . . . . . . . $ 923 $ 14,236 $ 193 $ 2,648 $ 3,513 $ 8 $ 21,521 Goodwill . . . . . . . . . . . . . . . . . . . . . . . . $ 978 $ 2,957 $ 157 $ 313 $ 96 $ 409 $ 4,910 Separate account assets . . . . . . . . . . . . . . $ 52,046 $102,918 $ — $ 5,195 $ 17 $ (17) $160,159 Policyholder liabilities . . . . . . . . . . . . . . . . $121,147 $116,568 $3,324 $16,083 $15,113 $ 9,335 $281,570 Separate account liabilities . . . . . . . . . . . . $ 52,046 $102,918 $ — $ 5,195 $ 17 $ (17) $160,159 F-75MetLife, Inc. MetLife, Inc. Notes to Consolidated Financial Statements — (Continued)
  • 172.
    For the YearEnded December 31, 2006 Institutional Individual Auto & Home International Reinsurance Corporate & Other Total (In millions) Statement of Income: Premiums . . . . . . . . . . . . . . . . . . . . . . . $ 11,867 $ 4,516 $2,924 $ 2,722 $ 4,348 $ 35 $ 26,412 Universal life and investment- type product policy fees . . . . . . . . . . . . . . . . . . . . . 775 3,201 — 804 — — 4,780 Net investment income . . . . . . . . . . . . . . . 7,265 6,912 177 950 732 1,046 17,082 Other revenues . . . . . . . . . . . . . . . . . . . . 685 527 22 28 66 34 1,362 Net investment gains (losses) . . . . . . . . . . . (631) (598) 4 (10) 7 (154) (1,382) Policyholder benefits and claims . . . . . . . . . 13,367 5,409 1,717 2,411 3,490 37 26,431 Interest credited to policyholder account balances . . . . . . . . . . . . . . . . . 2,593 2,035 — 289 254 — 5,171 Policyholder dividends . . . . . . . . . . . . . . . — 1,697 6 (2) — — 1,701 Other expenses. . . . . . . . . . . . . . . . . . . . 2,314 3,519 845 1,529 1,227 1,349 10,783 Income (loss) from continuing operations before provision (benefit) for income tax . . . . . . . . . . 1,687 1,898 559 267 182 (425) 4,168 Provision (benefit) for income tax. . . . . . . . . 562 652 143 95 64 (419) 1,097 Income (loss) from continuing operations . . . 1,125 1,246 416 172 118 (6) 3,071 Income from discontinued operations, net of income tax . . . . . . . . . . . . . . . . . . . . . 42 18 — 28 — 3,134 3,222 Net income . . . . . . . . . . . . . . . . . . . . . . $ 1,167 $ 1,264 $ 416 $ 200 $ 118 $ 3,128 $ 6,293 Balance Sheet: Total assets . . . . . . . . . . . . . . . . . . . . . . $190,963 $243,604 $5,467 $22,724 $18,818 $46,139 $527,715 DAC and VOBA . . . . . . . . . . . . . . . . . . . . $ 1,370 $ 13,996 $ 190 $ 2,117 $ 3,152 $ 13 $ 20,838 Goodwill . . . . . . . . . . . . . . . . . . . . . . . . $ 977 $ 2,957 $ 157 $ 301 $ 96 $ 409 $ 4,897 Separate account assets . . . . . . . . . . . . . . $ 47,047 $ 94,124 $ — $ 3,178 $ 16 $ — $144,365 Policyholder liabilities . . . . . . . . . . . . . . . . $113,205 $117,866 $3,453 $13,544 $13,332 $ 9,199 $270,599 Separate account liabilities . . . . . . . . . . . . $ 47,047 $ 94,124 $ — $ 3,178 $ 16 $ — $144,365 For the Year Ended December 31, 2005 Institutional Individual Auto & Home International Reinsurance Corporate & Other Total (In millions) Statement of Income: Premiums . . . . . . . . . . . . . . . . . . . . . . . . . $11,387 $4,485 $2,911 $2,186 $3,869 $ 22 $24,860 Universal life and investment- type product policy fees . . . . . . . . . . . . . . . . . . . . . . . 772 2,476 — 579 — 1 3,828 Net investment income . . . . . . . . . . . . . . . . . 5,942 6,534 181 794 606 699 14,756 Other revenues. . . . . . . . . . . . . . . . . . . . . . 653 477 33 20 58 30 1,271 Net investment gains (losses) . . . . . . . . . . . . (10) (50) (12) 12 22 (48) (86) Policyholder benefits and claims . . . . . . . . . . 12,776 5,417 1,994 2,128 3,206 (15) 25,506 Interest credited to policyholder account balances. . . . . . . . . . . . . . . . . . . 1,652 1,775 — 240 220 — 3,887 Policyholder dividends . . . . . . . . . . . . . . . . . 1 1,670 3 5 — — 1,679 Other expenses . . . . . . . . . . . . . . . . . . . . . 2,229 3,264 828 997 991 955 9,264 Income (loss) from continuing operations before provision (benefit) for income tax . . . . . . . . . . . . 2,086 1,796 288 221 138 (236) 4,293 Provision (benefit) for income tax . . . . . . . . . . 698 594 64 35 46 (215) 1,222 Income (loss) from continuing operations . . . . . 1,388 1,202 224 186 92 (21) 3,071 Income from discontinued operations, net of income tax . . . . . . . . . . . . . . . . . . . . . . . 174 296 — 6 — 1,167 1,643 Net income . . . . . . . . . . . . . . . . . . . . . . . . $ 1,562 $1,498 $ 224 $ 192 $ 92 $1,146 $ 4,714 Net investment income and net investment gains (losses) are based upon the actual results of each segment’s specifically identifiable asset portfolio adjusted for allocated equity. Other costs are allocated to each of the segments based upon: (i) a review of the nature of such costs; (ii) time studies analyzing the amount of employee compensation costs incurred by each segment; and (iii) cost estimates included in the Company’s product pricing. Revenues derived from any customer did not exceed 10% of consolidated revenues for the years ended December 31, 2007, 2006 and 2005. Revenues from U.S. operations were $45.4 billion, $41.9 billion and $39.5 billion for the years ended December 31, 2007, 2006 and 2005, respectively, which represented 86%, 87% and 89%, respectively, of consolidated revenues. F-76 MetLife, Inc. MetLife, Inc. Notes to Consolidated Financial Statements — (Continued)
  • 173.
    23. Discontinued Operations RealEstate The Company actively manages its real estate portfolio with the objective of maximizing earnings through selective acquisitions and dispositions. Income related to real estate classified as held-for-sale or sold is presented in discontinued operations. These assets are carried at the lower of depreciated cost or fair value less expected disposition costs. The following information presents the components of income from discontinued real estate operations: 2007 2006 2005 Years Ended December 31, (In millions) Investment income . . . . . . . . . . . . . . . . . . . . . . . . . . . . . . . . . . . . . . . . . . . . . . . . . . . . . . $ 59 $ 276 $ 435 Investment expense . . . . . . . . . . . . . . . . . . . . . . . . . . . . . . . . . . . . . . . . . . . . . . . . . . . . . (43) (182) (273) Net investment gains . . . . . . . . . . . . . . . . . . . . . . . . . . . . . . . . . . . . . . . . . . . . . . . . . . . . 13 4,795 2,125 Total revenues . . . . . . . . . . . . . . . . . . . . . . . . . . . . . . . . . . . . . . . . . . . . . . . . . . . . . . . 29 4,889 2,287 Provision for income tax . . . . . . . . . . . . . . . . . . . . . . . . . . . . . . . . . . . . . . . . . . . . . . . . . . 11 1,727 813 Income from discontinued operations, net of income tax . . . . . . . . . . . . . . . . . . . . . . . . . . . . . $ 18 $3,162 $1,474 The carrying value of real estate related to discontinued operations was $172 million and $184 million at December 31, 2007 and 2006, respectively. The following table presents the discontinued real estate operations by segment: 2007 2006 2005 Years Ended December 31, (In millions) Net investment income Institutional . . . . . . . . . . . . . . . . . . . . . . . . . . . . . . . . . . . . . . . . . . . . . . . . . . . . . . . . . $ 4 $ 8 $ 29 Individual . . . . . . . . . . . . . . . . . . . . . . . . . . . . . . . . . . . . . . . . . . . . . . . . . . . . . . . . . . . 1 4 20 Corporate & Other . . . . . . . . . . . . . . . . . . . . . . . . . . . . . . . . . . . . . . . . . . . . . . . . . . . . . 11 82 113 Total net investment income . . . . . . . . . . . . . . . . . . . . . . . . . . . . . . . . . . . . . . . . . . . . . $16 $ 94 $ 162 Net investment gains (losses) Institutional . . . . . . . . . . . . . . . . . . . . . . . . . . . . . . . . . . . . . . . . . . . . . . . . . . . . . . . . . $12 $ 58 $ 242 Individual . . . . . . . . . . . . . . . . . . . . . . . . . . . . . . . . . . . . . . . . . . . . . . . . . . . . . . . . . . . — 23 443 Corporate & Other . . . . . . . . . . . . . . . . . . . . . . . . . . . . . . . . . . . . . . . . . . . . . . . . . . . . . 1 4,714 1,440 Total net investment gains (losses) . . . . . . . . . . . . . . . . . . . . . . . . . . . . . . . . . . . . . . . . . $13 $4,795 $2,125 In the fourth quarter of 2006, the Company sold its Peter Cooper Village and Stuyvesant Town properties located in Manhattan, New York for $5.4 billion. The Peter Cooper Village and Stuyvesant Town properties together make up the largest apartment complex in Manhattan, New York totaling over 11,000 units, spread over 80 contiguous acres. The properties were owned by the Company’s subsidiary, MTL. Net investment income on these properties was $73 million and $72 million for the years ended December 31, 2006 and 2005, respectively. The sale resulted in a gain of $3 billion, net of income tax. In the second quarter of 2005, the Company sold its One Madison Avenue and 200 Park Avenue properties in Manhattan, New York for $918 million and $1.72 billion, respectively, resulting in gains, net of income tax, of $431 million and $762 million, respectively. Net investment income on One Madison Avenue and 200 Park Avenue was $13 million and $44 million, for the year ended December 31, 2005, respectively. In connection with the sale of the 200 Park Avenue property, the Company has retained rights to existing signage and is leasing space for associates in the property for 20 years with optional renewal periods through 2205. Operations On August 31, 2007, MetLife Australia completed the sale of its annuities and pension businesses to a third party for $25 million in cash consideration resulting in a gain upon disposal of $41 million, net of income tax, which was adjusted in the fourth quarter of 2007 for additional transaction costs. The Company reclassified the assets and liabilities of the annuities and pension businesses within MetLife Australia, which is reported in the International segment, to assets and liabilities of subsidiaries held-for-sale and the operations of the business to discontinued operations for all periods presented. Included within the assets to be sold were certain fixed maturity securities in a loss position for which the Company recognized a net investment loss on a consolidated basis of $59 million, net of income tax, for the year ended December 31, 2007, because the Company no longer had the intent to hold such securities. F-77MetLife, Inc. MetLife, Inc. Notes to Consolidated Financial Statements — (Continued)
  • 174.
    The following tablespresent the amounts related to the operations and financial position of MetLife Australia’s annuities and pension businesses: 2007 2006 2005 Years Ended December 31, (In millions) Revenues . . . . . . . . . . . . . . . . . . . . . . . . . . . . . . . . . . . . . . . . . . . . . . . . . . . . . . . . . . . . . . . $71 $100 $50 Expenses . . . . . . . . . . . . . . . . . . . . . . . . . . . . . . . . . . . . . . . . . . . . . . . . . . . . . . . . . . . . . . . 58 89 41 Income before provision for income tax . . . . . . . . . . . . . . . . . . . . . . . . . . . . . . . . . . . . . . . . . . . . 13 11 9 Provision for income tax . . . . . . . . . . . . . . . . . . . . . . . . . . . . . . . . . . . . . . . . . . . . . . . . . . . . . . 4 3 3 Net investment gain (loss), net of income tax . . . . . . . . . . . . . . . . . . . . . . . . . . . . . . . . . . . . . . . . (4) 20 (5) Income from discontinued operations, net of income tax . . . . . . . . . . . . . . . . . . . . . . . . . . . . . . . . $ 5 $ 28 $ 1 December 31, 2006 (In millions) Fixed maturity securities . . . . . . . . . . . . . . . . . . . . . . . . . . . . . . . . . . . . . . . . . . . . . . . . . . . . . . . . $1,500 Equity securities . . . . . . . . . . . . . . . . . . . . . . . . . . . . . . . . . . . . . . . . . . . . . . . . . . . . . . . . . . . . . 37 Deferred policy acquisition costs . . . . . . . . . . . . . . . . . . . . . . . . . . . . . . . . . . . . . . . . . . . . . . . . . . 13 Other assets . . . . . . . . . . . . . . . . . . . . . . . . . . . . . . . . . . . . . . . . . . . . . . . . . . . . . . . . . . . . . . . 13 Total assets held-for-sale . . . . . . . . . . . . . . . . . . . . . . . . . . . . . . . . . . . . . . . . . . . . . . . . . . . . . . $1,563 Policyholder account balances . . . . . . . . . . . . . . . . . . . . . . . . . . . . . . . . . . . . . . . . . . . . . . . . . . . $1,595 Total liabilities held-for-sale . . . . . . . . . . . . . . . . . . . . . . . . . . . . . . . . . . . . . . . . . . . . . . . . . . . . $1,595 On September 29, 2005, the Company completed the sale of MetLife Indonesia to a third party, resulting in a gain upon disposal of $10 million, net of income tax. As a result of this sale, the Company recognized income from discontinued operations of $5 million, net of income tax, for the year ended December 31, 2005. The Company reclassified the operations of MetLife Indonesia into discontinued operations for all years presented. The following table presents the amounts related to the operations of MetLife Indonesia that have been combined with the discontinued real estate operations in the consolidated statements of income: Year Ended December 31, 2005 (In millions) Revenues . . . . . . . . . . . . . . . . . . . . . . . . . . . . . . . . . . . . . . . . . . . . . . . . . . . . . . . . . . . . . . . . . . . . $ 5 Expenses . . . . . . . . . . . . . . . . . . . . . . . . . . . . . . . . . . . . . . . . . . . . . . . . . . . . . . . . . . . . . . . . . . . . 10 Income from discontinued operations before provision for income tax . . . . . . . . . . . . . . . . . . . . . . . . . . . . . (5) Provision for income tax . . . . . . . . . . . . . . . . . . . . . . . . . . . . . . . . . . . . . . . . . . . . . . . . . . . . . . . . . . . — Net investment gain, net of income tax . . . . . . . . . . . . . . . . . . . . . . . . . . . . . . . . . . . . . . . . . . . . . . . . . 10 Income from discontinued operations, net of income tax . . . . . . . . . . . . . . . . . . . . . . . . . . . . . . . . . . . . $ 5 On January 31, 2005, the Company completed the sale of SSRM to a third party for $328 million in cash and stock. The Company reported the operations of SSRM in discontinued operations. As a result of the sale of SSRM, the Company recognized income from discontinued operations of $157 million, net of income tax, comprised of a realized gain of $165 million, net of income tax, and an operating expense related to a lease abandonment of $8 million, net of income tax. The Company’s discontinued operations for the year ended December 31, 2005 included expenses of $6 million, net of income tax, related to the sale of SSRM. Under the terms of the sale agreement, MetLife will have an opportunity to receive additional payments based on, among other things, certain revenue retention and growth measures. The purchase price is also subject to reduction over five years, depending on retention of certain MetLife-related business. In the fourth quarter of 2007, the Company accrued a liability for $2 million, net of income tax, related to the termination of certain MetLife-related business. Also under the terms of such agreement, MetLife had the opportunity to receive additional consideration for the retention of certain customers for a specific period in 2005. Upon finalization of the computation, the Company received payments of $30 million, net of income tax, in the second quarter of 2006 and $12 million, net of income tax, in the fourth quarter of 2005 due to the retention of these specific customer accounts. In the first quarter of 2007, the Company received a payment of $16 million, net of income tax, as a result of the revenue retention and growth measure provision in the sales agreement. In the fourth quarter of 2006, the Company eliminated $4 million of a liability that was previously recorded with respect to the indemnities provided in connection with the sale of SSRM, resulting in a benefit to the Company of $2 million, net of income tax. The Company believes that future payments relating to these indemnities are not probable. The operations of SSRM include affiliated revenues of $5 million for the year ended December 31, 2005, related to asset management services provided by SSRM to the Company that have not been eliminated from discontinued operations as these transactions continued F-78 MetLife, Inc. MetLife, Inc. Notes to Consolidated Financial Statements — (Continued)
  • 175.
    after the saleof SSRM. The following table presents the amounts related to operations of SSRM that have been combined with the discontinued real estate operations in the consolidated statements of income: 2007 2006 2005 Years Ended December 31, (In millions) Revenues . . . . . . . . . . . . . . . . . . . . . . . . . . . . . . . . . . . . . . . . . . . . . . . . . . . . . . . . . . . . . . . $— $— $ 19 Expenses . . . . . . . . . . . . . . . . . . . . . . . . . . . . . . . . . . . . . . . . . . . . . . . . . . . . . . . . . . . . . . . — — 38 Income from discontinued operations before provision for income tax. . . . . . . . . . . . . . . . . . . . . . . . . — — (19) Provision for income tax . . . . . . . . . . . . . . . . . . . . . . . . . . . . . . . . . . . . . . . . . . . . . . . . . . . . . . — — (5) Net investment gain, net of income tax . . . . . . . . . . . . . . . . . . . . . . . . . . . . . . . . . . . . . . . . . . . . 14 32 177 Income from discontinued operations, net of income tax . . . . . . . . . . . . . . . . . . . . . . . . . . . . . . . . $14 $32 $163 24. Fair Value Information The estimated fair value of financial instruments have been determined by using available market information and the valuation methodologies described below. Considerable judgment is often required in interpreting market data to develop estimates of fair value. Accordingly, the estimates presented herein may not necessarily be indicative of amounts that could be realized in a current market exchange. The use of different assumptions or valuation methodologies may have a material effect on the estimated fair value amounts. The implementation of SFAS 157 may impact the fair value assumptions and methodologies associated with the valuation of assets and liabilities. See also Note 1 regarding the adoption of SFAS 157. Amounts related to the Company’s financial instruments are as follows: December 31, 2007 Notional Amount Carrying Value Estimated Fair Value (In millions) Assets: Fixed maturity securities . . . . . . . . . . . . . . . . . . . . . . . . . . . . . . . . . . . . . . . . . . . $242,242 $242,242 Trading securities . . . . . . . . . . . . . . . . . . . . . . . . . . . . . . . . . . . . . . . . . . . . . . . . $ 779 $ 779 Equity securities. . . . . . . . . . . . . . . . . . . . . . . . . . . . . . . . . . . . . . . . . . . . . . . . . $ 6,050 $ 6,050 Mortgage and consumer loans . . . . . . . . . . . . . . . . . . . . . . . . . . . . . . . . . . . . . . . $ 47,030 $ 47,599 Policy loans . . . . . . . . . . . . . . . . . . . . . . . . . . . . . . . . . . . . . . . . . . . . . . . . . . . $ 10,419 $ 10,419 Short-term investments . . . . . . . . . . . . . . . . . . . . . . . . . . . . . . . . . . . . . . . . . . . . $ 2,648 $ 2,648 Cash and cash equivalents . . . . . . . . . . . . . . . . . . . . . . . . . . . . . . . . . . . . . . . . . $ 10,368 $ 10,368 Accrued investment income . . . . . . . . . . . . . . . . . . . . . . . . . . . . . . . . . . . . . . . . . $ 3,630 $ 3,630 Mortgage loan commitments. . . . . . . . . . . . . . . . . . . . . . . . . . . . . . . . . . . . . . . . . $4,035 $ — $ (43) Commitments to fund bank credit facilities, bridge loans and private corporate bond investments . . . . . . . . . . . . . . . . . . . . . . . . . . . . . . . . . . . . . . . . . . . . . . . . . . $1,196 $ — $ (59) Liabilities: Policyholder account balances . . . . . . . . . . . . . . . . . . . . . . . . . . . . . . . . . . . . . . . $115,385 $114,466 Short-term debt . . . . . . . . . . . . . . . . . . . . . . . . . . . . . . . . . . . . . . . . . . . . . . . . . $ 667 $ 667 Long-term debt . . . . . . . . . . . . . . . . . . . . . . . . . . . . . . . . . . . . . . . . . . . . . . . . . $ 9,628 $ 9,532 Collateral financing arrangements . . . . . . . . . . . . . . . . . . . . . . . . . . . . . . . . . . . . . $ 5,732 $ 5,365 Junior subordinated debt securities . . . . . . . . . . . . . . . . . . . . . . . . . . . . . . . . . . . . $ 4,474 $ 4,338 Shares subject to mandatory redemption. . . . . . . . . . . . . . . . . . . . . . . . . . . . . . . . . $ 159 $ 178 Payables for collateral under securities loaned and other transactions . . . . . . . . . . . . . . . . . . . $ 44,136 $ 44,136 F-79MetLife, Inc. MetLife, Inc. Notes to Consolidated Financial Statements — (Continued)
  • 176.
    December 31, 2006 Notional Amount Carrying Value Estimated FairValue (In millions) Assets: Fixed maturity securities . . . . . . . . . . . . . . . . . . . . . . . . . . . . . . . . . . . . . . . . . . . $241,928 $241,928 Trading securities . . . . . . . . . . . . . . . . . . . . . . . . . . . . . . . . . . . . . . . . . . . . . . . . $ 759 $ 759 Equity securities. . . . . . . . . . . . . . . . . . . . . . . . . . . . . . . . . . . . . . . . . . . . . . . . . $ 5,094 $ 5,094 Mortgage and consumer loans . . . . . . . . . . . . . . . . . . . . . . . . . . . . . . . . . . . . . . . $ 42,239 $ 42,451 Policy loans . . . . . . . . . . . . . . . . . . . . . . . . . . . . . . . . . . . . . . . . . . . . . . . . . . . $ 10,228 $ 10,228 Short-term investments . . . . . . . . . . . . . . . . . . . . . . . . . . . . . . . . . . . . . . . . . . . . $ 2,709 $ 2,709 Cash and cash equivalents . . . . . . . . . . . . . . . . . . . . . . . . . . . . . . . . . . . . . . . . . $ 7,107 $ 7,107 Accrued investment income . . . . . . . . . . . . . . . . . . . . . . . . . . . . . . . . . . . . . . . . . $ 3,347 $ 3,347 Mortgage loan commitments. . . . . . . . . . . . . . . . . . . . . . . . . . . . . . . . . . . . . . . . . $4,022 $ — $ 4 Commitments to fund bank credit facilities, bridge loans and private corporate bond investments . . . . . . . . . . . . . . . . . . . . . . . . . . . . . . . . . . . . . . . . . . . . . . . . . . $1,908 $ — $ — Liabilities: Policyholder account balances . . . . . . . . . . . . . . . . . . . . . . . . . . . . . . . . . . . . . . . $112,438 $108,318 Short-term debt . . . . . . . . . . . . . . . . . . . . . . . . . . . . . . . . . . . . . . . . . . . . . . . . . $ 1,449 $ 1,449 Long-term debt . . . . . . . . . . . . . . . . . . . . . . . . . . . . . . . . . . . . . . . . . . . . . . . . . $ 9,129 $ 9,299 Collateral financing arrangements . . . . . . . . . . . . . . . . . . . . . . . . . . . . . . . . . . . . . $ 850 $ 850 Junior subordinated debt securities . . . . . . . . . . . . . . . .