This document provides an overview of Caterpillar Inc.'s financial information for 2006 including:
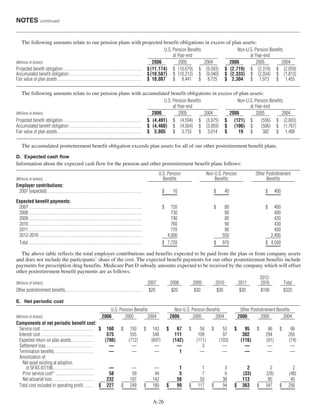
- Sales increased to $41.5 billion in 2006 from $36.3 billion in 2005 driven by higher machinery and engine sales.
- Net income increased to $3.5 billion in 2006 from $2.8 billion in 2005.
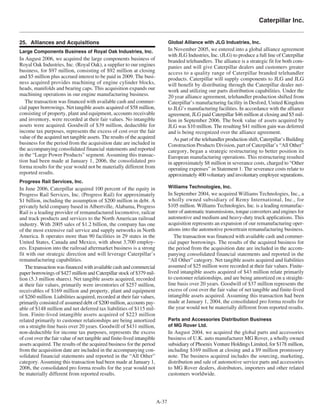
- Total assets were $50.9 billion at the end of 2006, up from $47.1 billion in 2005, with inventory and property, plant and equipment being the largest assets.


![dollar, New Zealand dollar, or Swiss franc forward or option
contracts that meet the requirements for hedge accounting.
Designation is performed on a specific exposure basis to sup-
port hedge accounting. The remainder of Machinery and Engines
foreign currency contracts are undesignated. We designate as
fair value hedges specific euro forward contracts used to hedge
firm commitments.
As of December 31, 2006, $24 million of deferred net gains
(net of tax) included in equity (“Accumulated other compre-
hensive income” in Statement 2), are expected to be reclassified
to current earnings (“Other income (expense)” in Statement 1)
over the next twelve months when earnings are affected by the
hedged transactions. The actual amount recorded in “Other
income (expense)” will vary based on exchange rates at the time
the hedged transactions impact earnings.
In managing foreign currency risk for our Financial Products
operations, our objective is to minimize earnings volatility resulting
from conversion and the remeasurement of net foreign currency
balance sheet positions. Our policy allows the use of foreign
currency forward and option contracts to offset the risk of cur-
rency mismatch between our receivables and debt. All such for-
eign currency forward and option contracts are undesignated.
Gains (losses) included in current earnings [Other income (expense)]
on undesignated contracts:
(Millions of dollars) 2006 2005 2004_____ _____ _____
Machinery and Engines:
On undesignated contracts ....................... $ 23 $ 25 $ (9)
Financial Products:
On undesignated contracts ....................... (19) 58 (46)_____ ____ ____
$ 4 $ 83 $ (55)_____ ____ _________ ____ ____
Gains and losses on the Financial Products contracts above are
substantially offset by balance sheet translation gains and losses.
B. Interest rate risk
Interest rate movements create a degree of risk by affecting the
amount of our interest payments and the value of our fixed rate
debt. Our practice is to use interest rate swap agreements to man-
age our exposure to interest rate changes and, in some cases,
lower the cost of borrowed funds.
Machinery and Engines operations generally use fixed rate debt
as a source of funding. Our objective is to minimize the cost of
borrowed funds. Our policy allows us to enter into fixed-to-floating
interest rate swaps and forward rate agreements to meet that objec-
tive with the intent to designate as fair value hedges at inception
of the contract all fixed-to-floating interest rate swaps. Designation
as a hedge of the fair value of our fixed rate debt is performed to
support hedge accounting. In conjunction with our bond issuance
in 2006 (See Note 16), we entered into $200 million of interest
rate swaps designated as fair value hedges of our fixed-rate debt.
During 2001, our Machinery and Engines operations liquidated all
existing fixed-to-floating interest rate swaps. The gain ($7 million
as of December 31, 2006) is being amortized to earnings ratably
over the remaining life of the hedged debt.
Financial Products operations have a match funding policy
that addresses interest rate risk by aligning the interest rate profile
(fixed or floating rate) of their debt portfolio with the interest rate
profile of their receivables portfolio within predetermined ranges
on an on-going basis. In connection with that policy, we use
interest rate derivative instruments to modify the debt structure
to match assets within the receivables portfolio. This match fund-
ing reduces the volatility of margins between interest-bearing
assets and interest-bearing liabilities, regardless of which direc-
tion interest rates move.
Our policy allows us to use floating-to-fixed, fixed-to-floating
and floating-to-floating interest rate swaps to meet the match
funding objective. To support hedge accounting, we designate
fixed-to-floating interest rate swaps as fair value hedges of the
fair value of our fixed rate debt at the inception of the contract.
Financial Products’ practice is to designate most floating-to-fixed
interest rate swaps as cash flow hedges of the variability of future
cash flows at the inception of the swap contract. Designation as
a hedge of the variability of cash flow is performed to support
hedge accounting. Financial Products liquidated fixed-to-float-
ing interest rate swaps during 2006, 2005 and 2004. The gains
($7 million remaining as of December 31, 2006) are being amortized
to earnings ratably over the remaining life of the hedged debt.
Gains (losses) included in current earnings [Other income (expense)]:
(Millions of dollars) 2006 2005 2004_____ _____ _____
Fixed-to-floating interest rate swaps
Machinery and Engines:
Gain (loss) on designated interest
rate derivatives................................ $ 2 $ — $ —
Gain (loss) on hedged debt .................... (1) — —
Gain (loss) amortization on liquidated
swaps — included in interest expense...... 3 5 5
Financial Products:
Gain (loss) on designated interest
rate derivatives................................ (44) (71) (28)
Gain (loss) on hedged debt .................... 44 71 28
Gain (loss) amortization on liquidated
swaps — included in interest expense...... 6 5 2______ _____ _____
$ 10 $ 10 $ 7______ _____ ___________ _____ _____
As of December 31, 2006, $12 million of deferred net gains
included in equity (“Accumulated other comprehensive income”
in Statement 2), related to Financial Products floating-to-fixed
interest rate swaps, are expected to be reclassified to current earn-
ings (“Interest expense of Financial Products” in Statement 1)
over the next twelve months.
C. Commodity price risk
Commodity price movements create a degree of risk by affect-
ing the price we must pay for certain raw material. Our policy is
to use commodity forward and option contracts to manage the
commodity risk and reduce the cost of purchased materials.
Our Machinery and Engines operations purchase aluminum,
copper and nickel embedded in the components we purchase from
suppliers. Our suppliers pass on to us price changes in the commod-
ity portion of the component cost. In addition, we are also subjected
to price changes on natural gas purchased for operational use.
Our objective is to minimize volatility in the price of these com-
modities. Our policy allows us to enter into commodity forward
and option contracts to lock in the purchase price of a portion of
these commodities within a four-year horizon. All such com-
modity forward and option contracts are undesignated. Gains on
the undesignated contracts of $1 million, $7 million and $15 mil-
lion were recorded in current earnings (“Other income (expense)”
in Statement 1) in 2006, 2005 and 2004, respectively.
NOTES continued
A-16](https://image.slidesharecdn.com/1036431/85/2006-General-and-Financial-Information-Proxy-Appendix-16-320.jpg)