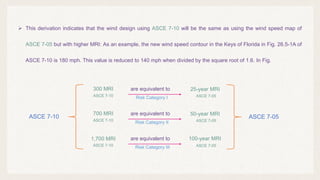
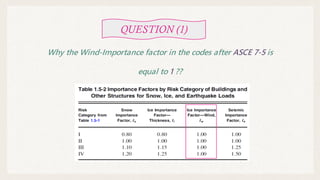
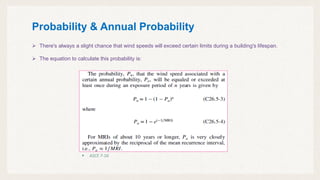
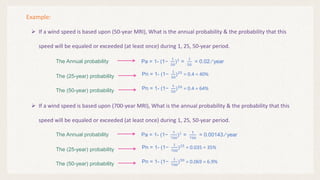
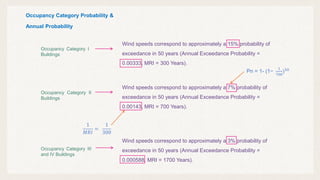
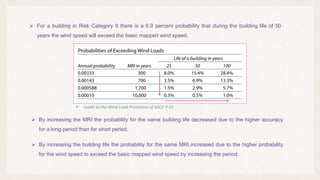
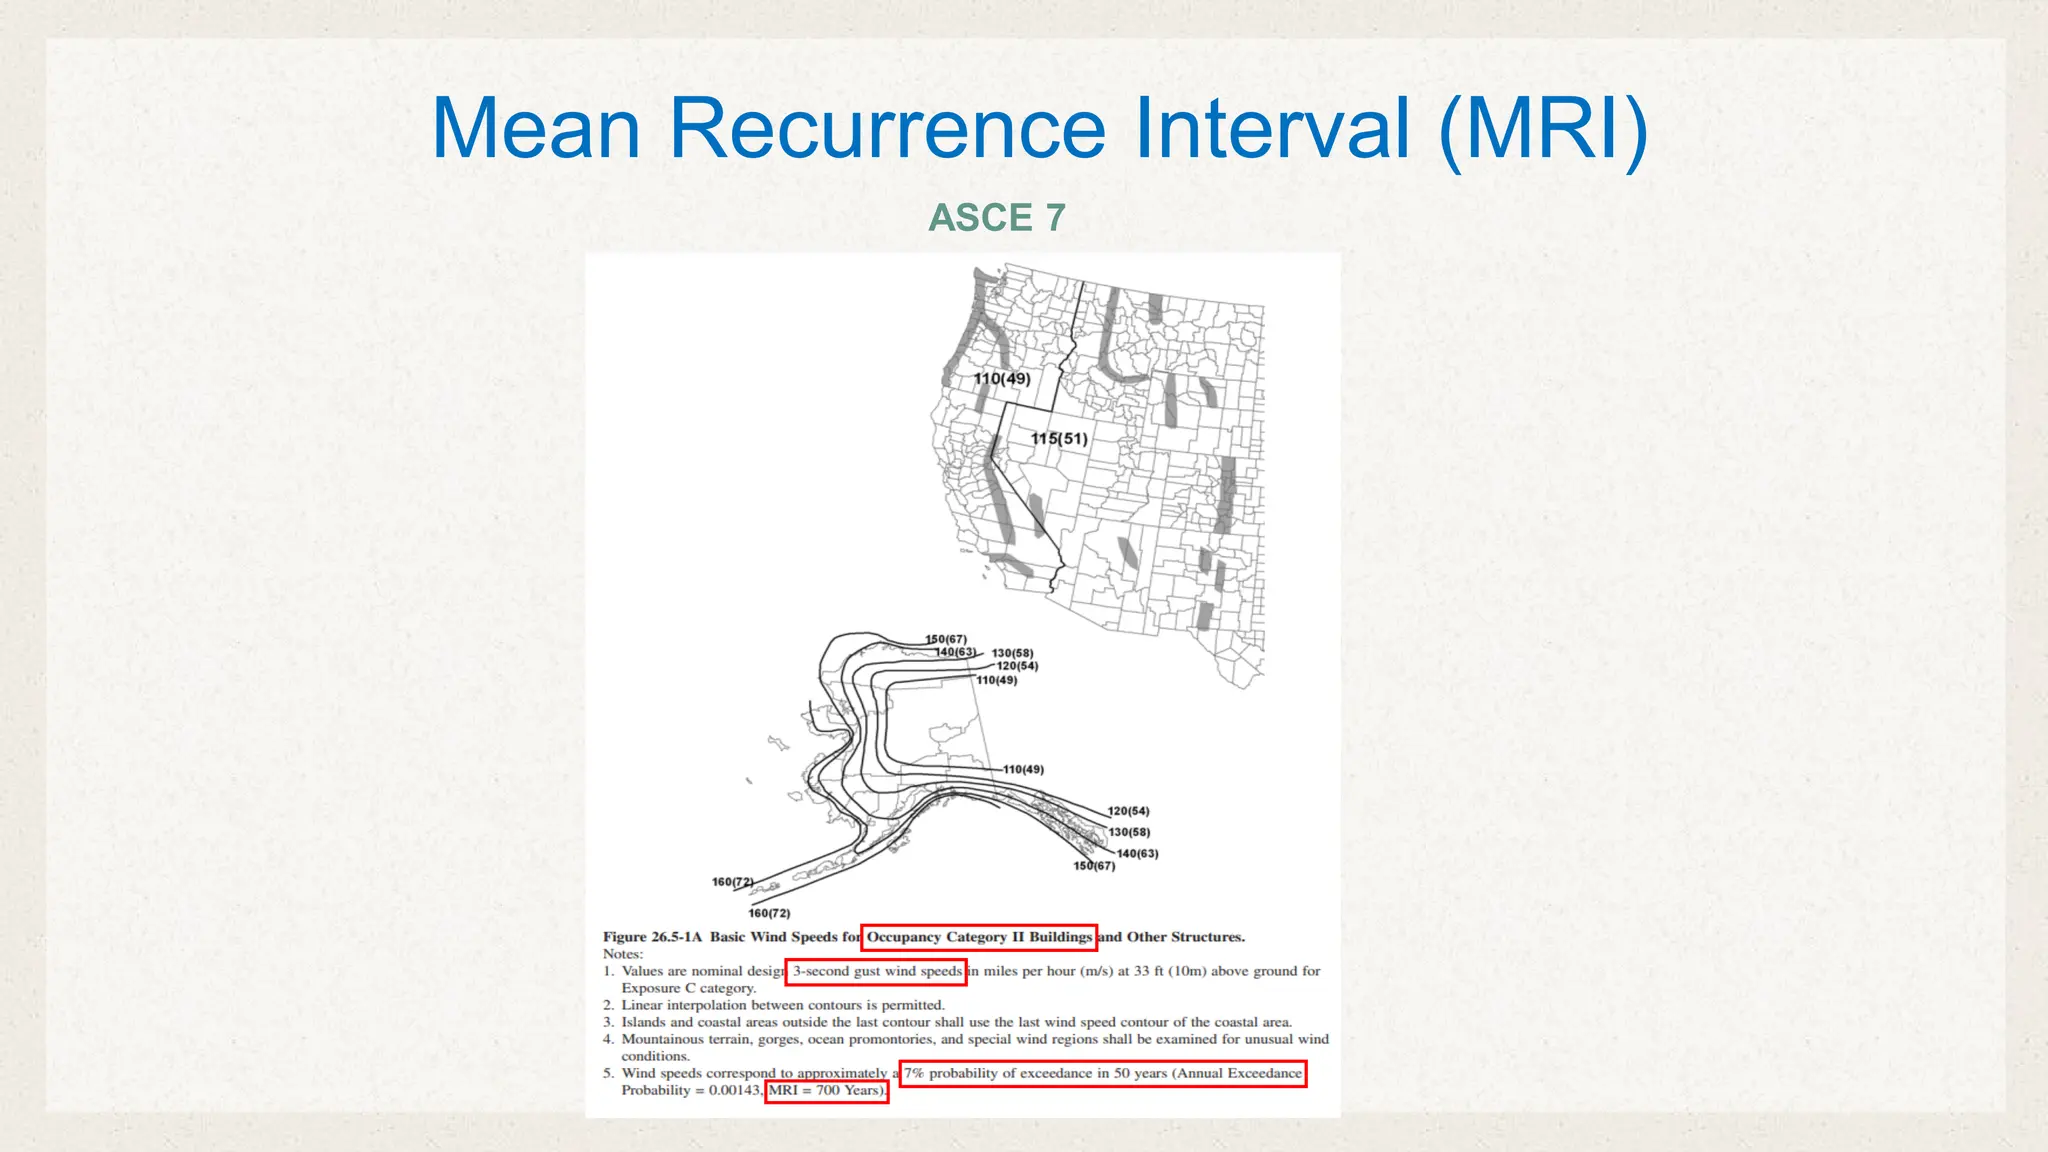
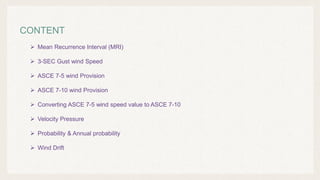
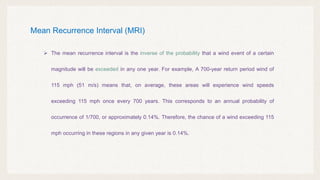
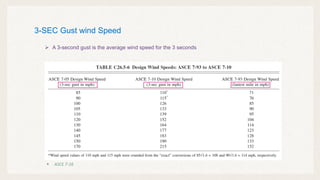
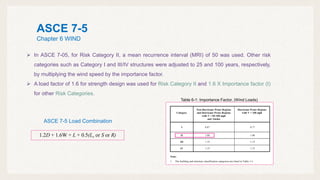
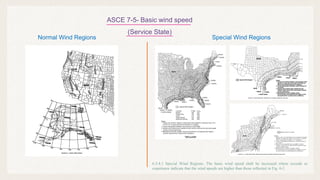
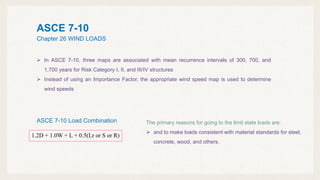
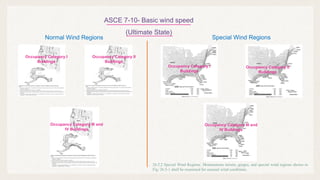
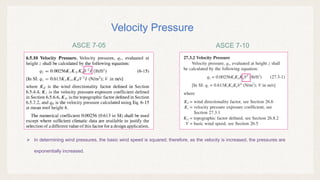
The document provides an overview of the Mean Recurrence Interval (MRI) for wind events according to ASCE 7 standards, discussing how wind speeds and their probabilities of exceedance are determined for different risk categories. It highlights the conversion of wind speed values from ASCE 7-05 to ASCE 7-10 standards, emphasizing the implications of different MRIs for structural design and safety. Additionally, it includes mathematical equations for calculating annual probabilities of wind events exceeding specified thresholds over various time periods.

![1.6 x (V50)2 = (Vu)2
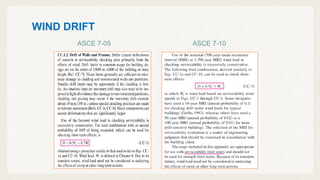
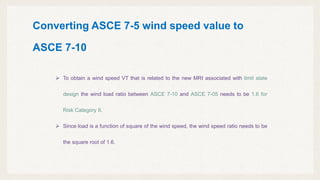
To convert wind velocity of Risk Category II from ASCE 7-5 to ASCE 7-10 :
(𝑉𝑉
𝑢𝑢)
2
𝑉𝑉50
2
= 1.6
(𝑉𝑉
𝑢𝑢)
𝑉𝑉50
= 1.6
To convert wind velocity of Risk Category I from ASCE 7-5 to ASCE 7-10 :
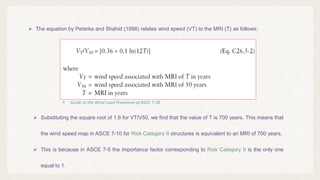
𝑉𝑉𝑡𝑡 / 𝑉𝑉50= [0.36 + 0.1 ln(12 T)]
By substituting in this equation
1.6 = [0.36 + 0.1 ln(12 T)] T = 700
1.6 x .87 x (V50)2 = (Vu)2
(𝑉𝑉
𝑢𝑢)
2
𝑉𝑉50
2
= 1.6x .87
(𝑉𝑉
𝑢𝑢)
𝑉𝑉50
= 1.6x .87
𝑉𝑉𝑡𝑡 / 𝑉𝑉50= [0.36 + 0.1 ln(12 T)]
By substituting in this equation
1.6 𝑥𝑥 .87 = [0.36 + 0.1 ln(12 T)] T = 300](https://image.slidesharecdn.com/meanrecurrenceintervalmri1717582543-240623132415-caae5a4a/85/Mean_Recurrence_Interval_MRI__1717582543-pdf-12-320.jpg)