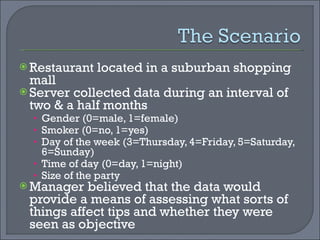
Topic: Restaurant Tipping Presented by: Miranda Lazar & Kristyn Kelly
2003 sales at restaurants totaled $151 Billion Assuming 15% tipping, waiters and waitresses earned $22.7 billion in tip income
Research shows that tip percentages are weakly related to customers’ rating of service quality Tips may be influence by many factors Size of the party Table location in the restaurant Gender Smokers vs. non smokers Time of the day (Lunch vs. Dinner)
Restaurant located in a suburban shopping mall Server collected data during an interval of two & a half months Gender (0=male, 1=female) Smoker (0=no, 1=yes) Day of the week (3=Thursday, 4=Friday, 5=Saturday, 6=Sunday) Time of day (0=day, 1=night) Size of the party Manager believed that the data would provide a means of assessing what sorts of things affect tips and whether they were seen as objective
Total bills range from $3.07 to $50.81 Mean of Total bills = $19.79 $50.81 $3.07
Men
May be skewed do to more men were apart of the research than women 157 men vs. 87 women
SAMPLE HYPOTHESIS TESTS hyp value sample mean stdev sample size for the mean REF  =average() =stdev() =(n) NULL :  Null statement   ALTERNATIVE:  Alternative statement test statistic (obs) =standardize(sample mean, ref value, std error(stdev/sqrt(n))  critical measure =normsinv(1-signif level/#tails) one-tailed or two-tailed? 1 |OBS| > CRIT? p-value =(#tails)*(normsidst(abs(obs)))  -level 0.050  p-value <   -level?
HYPOTHESIS TESTS hypothesized value sample mean stdev sample size for the mean 3.00  3.09  1.49  157 NULL :  Men are better tippers than women   ALTERNATIVE:  Men are not better tippers than women test statistic (obs) .7540843 critical measure 1.6448535  one-tailed or two-tailed? 1 |OBS| > CRIT? no p-value 0.225   -level 0.050  p-value <   -level? no ACCEPT THE NULL
Men are better tippers than women!
 
HYPOTHESIS TESTS hypothesized value sample mean stdev sample size for the mean 3.00  3.10  1.44  176 NULL :  people tip more than the average tip at dinner time ALTERNATIVE:  people tip less than the average tip at dinner time   test statistic (obs) 0.94836  critical measure 1.64485  one-tailed or two-tailed? 1 |OBS| > CRIT? no p-value 0.171   -level 0.050  p-value <   -level? no ACCEPT THE NULL
People tip more than average at dinner time!


Gender of patron has an influence over the amount of tip Men tip an average of $3.09 Women tip an average of $2.83 Time of day has an influence over the amount of tip Lunch tip average $2.72 Dinner tip average $3.10
Little or no influence over tip amount Day of Week Sat & Sun tend to have larger total bill=larger tips Average Total Bill Sat & Sun larger total bill Smoker vs. Non-Smoker Very little difference  $2.99 avg. vs. $3.00 avg. Size of Party
Have servers alternate from lunch and dinner shifts so there is more opportunity for equal tip earnings. Because average total bills tend to be larger on weekends equaling larger tips, also alternate days of week that servers work for opportunity to earn equal tips. Add gratuity to the bottom line or explain that gratuity is not included.

MBA 512 Tips

  • 1.
    Topic: Restaurant TippingPresented by: Miranda Lazar & Kristyn Kelly
  • 2.
    2003 sales atrestaurants totaled $151 Billion Assuming 15% tipping, waiters and waitresses earned $22.7 billion in tip income
  • 3.
    Research shows thattip percentages are weakly related to customers’ rating of service quality Tips may be influence by many factors Size of the party Table location in the restaurant Gender Smokers vs. non smokers Time of the day (Lunch vs. Dinner)
  • 4.
    Restaurant located ina suburban shopping mall Server collected data during an interval of two & a half months Gender (0=male, 1=female) Smoker (0=no, 1=yes) Day of the week (3=Thursday, 4=Friday, 5=Saturday, 6=Sunday) Time of day (0=day, 1=night) Size of the party Manager believed that the data would provide a means of assessing what sorts of things affect tips and whether they were seen as objective
  • 5.
    Total bills rangefrom $3.07 to $50.81 Mean of Total bills = $19.79 $50.81 $3.07
  • 6.
  • 7.
    May be skeweddo to more men were apart of the research than women 157 men vs. 87 women
  • 8.
    SAMPLE HYPOTHESIS TESTShyp value sample mean stdev sample size for the mean REF =average() =stdev() =(n) NULL :  Null statement   ALTERNATIVE:  Alternative statement test statistic (obs) =standardize(sample mean, ref value, std error(stdev/sqrt(n)) critical measure =normsinv(1-signif level/#tails) one-tailed or two-tailed? 1 |OBS| > CRIT? p-value =(#tails)*(normsidst(abs(obs)))  -level 0.050 p-value <  -level?
  • 9.
    HYPOTHESIS TESTS hypothesizedvalue sample mean stdev sample size for the mean 3.00 3.09 1.49 157 NULL :  Men are better tippers than women   ALTERNATIVE:  Men are not better tippers than women test statistic (obs) .7540843 critical measure 1.6448535 one-tailed or two-tailed? 1 |OBS| > CRIT? no p-value 0.225  -level 0.050 p-value <  -level? no ACCEPT THE NULL
  • 10.
    Men are bettertippers than women!
  • 11.
  • 12.
    HYPOTHESIS TESTS hypothesizedvalue sample mean stdev sample size for the mean 3.00 3.10 1.44 176 NULL :  people tip more than the average tip at dinner time ALTERNATIVE:  people tip less than the average tip at dinner time   test statistic (obs) 0.94836 critical measure 1.64485 one-tailed or two-tailed? 1 |OBS| > CRIT? no p-value 0.171  -level 0.050 p-value <  -level? no ACCEPT THE NULL
  • 13.
    People tip morethan average at dinner time!
  • 14.
  • 15.
  • 16.
  • 17.
  • 18.
    Gender of patronhas an influence over the amount of tip Men tip an average of $3.09 Women tip an average of $2.83 Time of day has an influence over the amount of tip Lunch tip average $2.72 Dinner tip average $3.10
  • 19.
    Little or noinfluence over tip amount Day of Week Sat & Sun tend to have larger total bill=larger tips Average Total Bill Sat & Sun larger total bill Smoker vs. Non-Smoker Very little difference $2.99 avg. vs. $3.00 avg. Size of Party
  • 20.
    Have servers alternatefrom lunch and dinner shifts so there is more opportunity for equal tip earnings. Because average total bills tend to be larger on weekends equaling larger tips, also alternate days of week that servers work for opportunity to earn equal tips. Add gratuity to the bottom line or explain that gratuity is not included.