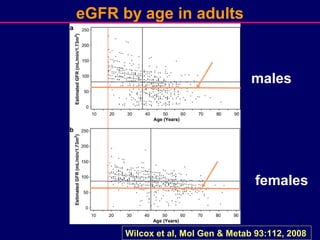
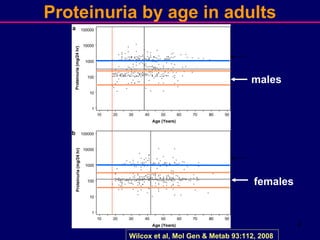
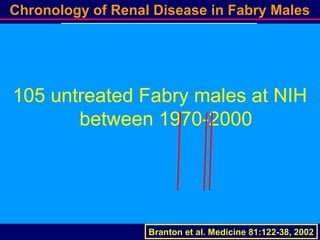
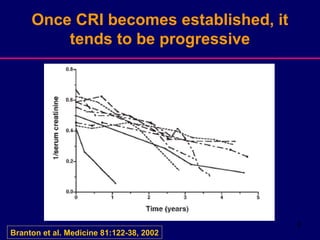
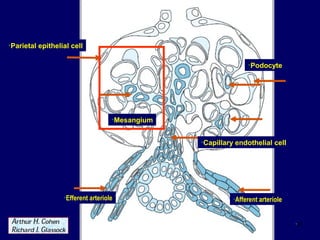
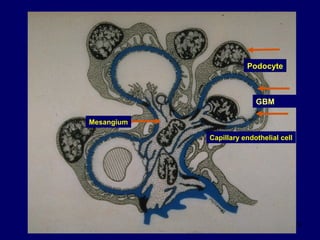
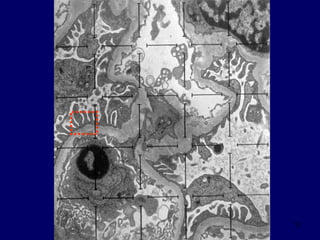
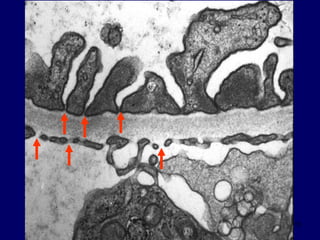
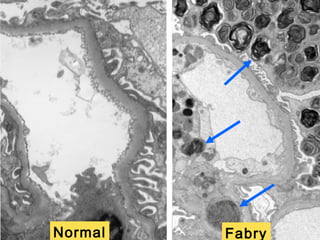
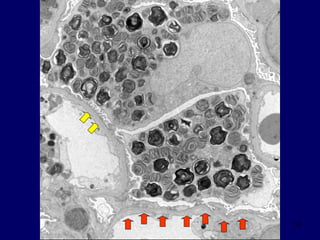
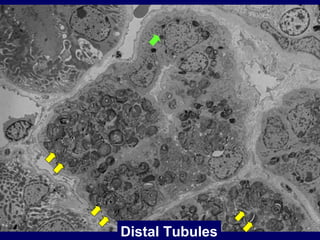
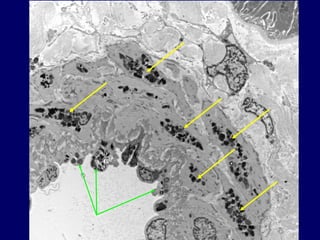
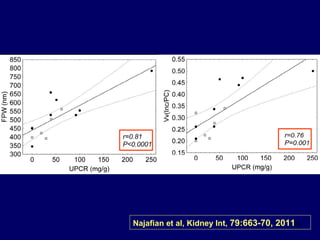
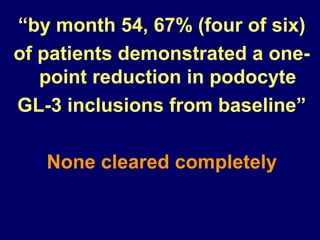
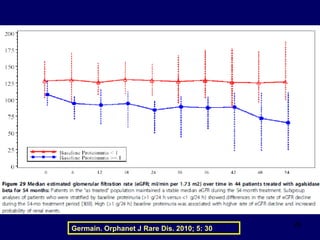
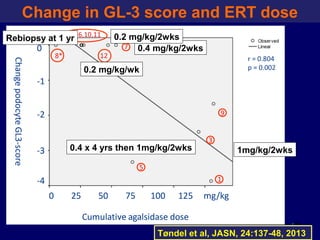
1
FSIG Expert Fabry Conference,
San Diego 2014:
Kidney Progression
Michael Mauer
Professor of Pediatrics
University of Minnesota
2
Main Topics
 Natural history of Fabry kidney disease
 Brief review of normal kidney structure
 Fabry kidney pathology
 Progressive podocyte and other kidney
cellular injury in children
 ERT and GL-3 renal clearance
3
eGFR by age in adults
Wilcox et al, Mol Gen & Metab 93:112, 2008
males
females
CKD3
CKD3
4
Proteinuria by age in adults
Wilcox et al, Mol Gen & Metab 93:112, 2008
males
females
5
Branton et al. Medicine 81:122-38, 2002
Chronology of Renal Disease in Fabry Males
105 untreated Fabry males at NIH
between 1970-2000
6
Once CRI becomes established, it
tends to be progressive
Branton et al. Medicine 81:122-38, 2002
7
Brief review of normal
kidney structure
•8
•Afferent arteriole
•Capillary endothelial cell
•Podocyte
•Efferent arteriole
•Mesangium
•Parietal epithelial cell
9
Capillary endothelial cell
Mesangium
Podocyte
GBM
10
11
12
13
14
Fabry renal pathology
15
Specific Changes:
Distribution of GL-3 inclusions
Podocytes (abundant)
Mesangial cells
Parietal epithelial cells
Endothelial cells (all)
Smooth muscle cells (arterial walls)
Interstitial cells
16
Non-specific late changes reflecting
chronic injury:
GBM and TBM changes, mesangial
expansion,
segmental and global glomerular
sclerosis (scarring)
tubular atrophy and interstitial fibrosis
(scarring)
Non-specific Changes:
Distribution of GL-3 inclusions
17
Normal Fabry
18
19
Distal Tubules
20
21
Tubule
Distal Tubule
PTC - Endo
TBM
TBM
22
Progressive podocyte and other
cellular injury in children and adults
with Fabry disease
23
Stereologic Methods: All images are obtained using systematic
unbiased sampling methods. Fractional volume of inclusions
per each cell type (endothelial, tubular, podocytes, etc.)
are measured using point counting methods on EM images
24
Progressive podcyte injury and GL-3 accumulation
in young patients with Fabry disease (8M/6F)
Najafian, Mauer, et al, Kidney Int, Feb 2011
25
Najafian et al, Kidney Int, 79:663-70, 2011
FM
26Najafian et al, Kidney Int, 79:663-70, 2011
27
ERT and GL-3 renal clearance
28
“by month 54, 67% (four of six)
of patients demonstrated a one-
point reduction in podocyte
GL-3 inclusions from baseline”
None cleared completely
29
Germain. Orphanet J Rare Dis. 2010; 5: 30
•30
Structural outcomes of lower vs.
higher doses of ERT in Fabry
disease
•31
Tøndel et al, JASN, 24:137-48, 2013
Change in GL-3 score and ERT dose
1mg/kg/2wks0.4 x 4 yrs then 1mg/kg/2wks
0.4 mg/kg/2wks
0.2 mg/kg/wk
0.2 mg/kg/2wksRebiopsy at 1 yr
•32
Tøndel et al, JASN, 24:137-48, 2013
Change in ACR vs. Change in podocyte GL-3 score
33
DURING THE FABRAZYME
SHORTAGE PATIENTS ON
PLACED ON LOWER DOSE ERT
HAD GREATER RENAL FUNCTION
LOSS THAN THOSE MAINTAINED
ON 1MG/KG/2WEEKS
Weidemann, et al, JASN in press, 2014
34
•DOSE MATTERS
•EARLY TREATMENT HAS
POTENTIAL LONG-TERM BENEFITS
TAKE HOME MESSAGES?
35
Thank You

Fabry Disease Kidney Progression - 14 February 2014