Download to read offline

![MATLAB ASHOK(191890)
Introduction:
a) Making variables :----------------------
a = 2; it's a number
a = '2'; it's a string
a = [1 2 3 4 5]: it's a vector(array) (in JAVA: int array[] = new int[5])
a = [ 1 2; 3 4] it's a matrix (in JAVA: int array[][] = new int[2][2])
a = {'a',2;'b',3} it's a cell (in JAVA structure)](https://image.slidesharecdn.com/matlabpractical-1-230126105127-18dabb66/85/Matlab-practical-1-pdf-5-320.jpg)


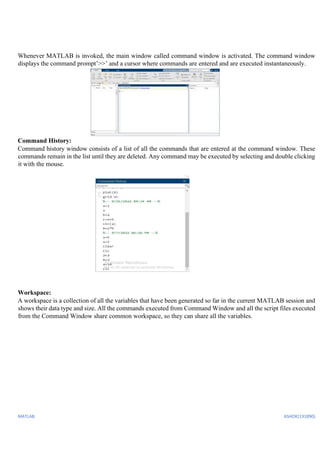
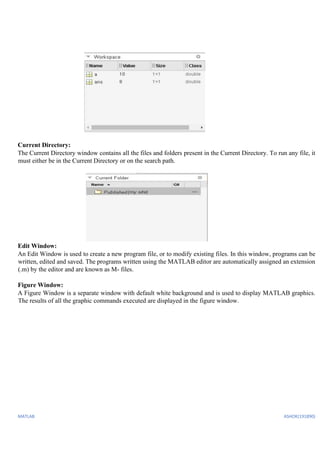
MATLAB is a programming language used for numerical computation, visualization, and programming. It allows matrix manipulations, plotting functions and data, implementing algorithms, and creating models. MATLAB contains built-in commands for mathematical calculations, generating plots, and performing numerical methods. It is widely used in fields like signal processing, image processing, control systems, and computational biology. The MATLAB environment includes a command window, command history, workspace, current directory, edit window, and figure window.