This document analyzes data on the winning heights in men's high jump in Olympic games from 1896 to 2008. It uses a quintic polynomial function to model the data from 1932 to 1980, finding the best fit equation algebraically and through a computer. The model predicts heights in 1940 and 1944 reasonably but cannot extrapolate accurately past 1980. A logistic curve may better capture the overall leveling off trend in winning heights.
i have created my own ppt on the topic name Isometric Projection.its a topic which is in engg. graphics book.
plzz download and give reviews abt that ppt.
i have created my own ppt on the topic name Isometric Projection.its a topic which is in engg. graphics book.
plzz download and give reviews abt that ppt.
introduction of engineering graphics ,projection of points,lines,planes,solids,section of solids,development of surfaces,isometric projection,perspective projection
20ME12P
1. Drawing equipments, instruments
and materials.
2. Equipments-types, specifications,
method to use them, applications.
3. Instruments-types, specifications,
methods to use those and
applications.
4. Pencils-grades, applications,
Different types of lines.
5. Scaling technique used in
drawing.
6. Dimensioning methods.- Aligned
method. Unilateral with chain,
parallel dimensioning.
7. Constructions of geometrical figures
This I.A was an investigation into a manufacturing company HEXAGON CHEMICALS in South Trinidad.
This I.A should be able to help student who are now going into this subject for Advanced levels (CAPE) because this subject was recently released in 2015 so I hope my SBA helps anyone who needs it.
CAPE Communication Studies IA
Please note that the example of Language/Dialectal Variation used in the Expository piece is "Jamaican Creole" and may not be a suitable example for other countries. Thank you.
JMeter webinar - integration with InfluxDB and GrafanaRTTS
Watch this recorded webinar about real-time monitoring of application performance. See how to integrate Apache JMeter, the open-source leader in performance testing, with InfluxDB, the open-source time-series database, and Grafana, the open-source analytics and visualization application.
In this webinar, we will review the benefits of leveraging InfluxDB and Grafana when executing load tests and demonstrate how these tools are used to visualize performance metrics.
Length: 30 minutes
Session Overview
-------------------------------------------
During this webinar, we will cover the following topics while demonstrating the integrations of JMeter, InfluxDB and Grafana:
- What out-of-the-box solutions are available for real-time monitoring JMeter tests?
- What are the benefits of integrating InfluxDB and Grafana into the load testing stack?
- Which features are provided by Grafana?
- Demonstration of InfluxDB and Grafana using a practice web application
To view the webinar recording, go to:
https://www.rttsweb.com/jmeter-integration-webinar
Transcript: Selling digital books in 2024: Insights from industry leaders - T...BookNet Canada
The publishing industry has been selling digital audiobooks and ebooks for over a decade and has found its groove. What’s changed? What has stayed the same? Where do we go from here? Join a group of leading sales peers from across the industry for a conversation about the lessons learned since the popularization of digital books, best practices, digital book supply chain management, and more.
Link to video recording: https://bnctechforum.ca/sessions/selling-digital-books-in-2024-insights-from-industry-leaders/
Presented by BookNet Canada on May 28, 2024, with support from the Department of Canadian Heritage.
Dev Dives: Train smarter, not harder – active learning and UiPath LLMs for do...UiPathCommunity
💥 Speed, accuracy, and scaling – discover the superpowers of GenAI in action with UiPath Document Understanding and Communications Mining™:
See how to accelerate model training and optimize model performance with active learning
Learn about the latest enhancements to out-of-the-box document processing – with little to no training required
Get an exclusive demo of the new family of UiPath LLMs – GenAI models specialized for processing different types of documents and messages
This is a hands-on session specifically designed for automation developers and AI enthusiasts seeking to enhance their knowledge in leveraging the latest intelligent document processing capabilities offered by UiPath.
Speakers:
👨🏫 Andras Palfi, Senior Product Manager, UiPath
👩🏫 Lenka Dulovicova, Product Program Manager, UiPath
State of ICS and IoT Cyber Threat Landscape Report 2024 previewPrayukth K V
The IoT and OT threat landscape report has been prepared by the Threat Research Team at Sectrio using data from Sectrio, cyber threat intelligence farming facilities spread across over 85 cities around the world. In addition, Sectrio also runs AI-based advanced threat and payload engagement facilities that serve as sinks to attract and engage sophisticated threat actors, and newer malware including new variants and latent threats that are at an earlier stage of development.
The latest edition of the OT/ICS and IoT security Threat Landscape Report 2024 also covers:
State of global ICS asset and network exposure
Sectoral targets and attacks as well as the cost of ransom
Global APT activity, AI usage, actor and tactic profiles, and implications
Rise in volumes of AI-powered cyberattacks
Major cyber events in 2024
Malware and malicious payload trends
Cyberattack types and targets
Vulnerability exploit attempts on CVEs
Attacks on counties – USA
Expansion of bot farms – how, where, and why
In-depth analysis of the cyber threat landscape across North America, South America, Europe, APAC, and the Middle East
Why are attacks on smart factories rising?
Cyber risk predictions
Axis of attacks – Europe
Systemic attacks in the Middle East
Download the full report from here:
https://sectrio.com/resources/ot-threat-landscape-reports/sectrio-releases-ot-ics-and-iot-security-threat-landscape-report-2024/
PHP Frameworks: I want to break free (IPC Berlin 2024)Ralf Eggert
In this presentation, we examine the challenges and limitations of relying too heavily on PHP frameworks in web development. We discuss the history of PHP and its frameworks to understand how this dependence has evolved. The focus will be on providing concrete tips and strategies to reduce reliance on these frameworks, based on real-world examples and practical considerations. The goal is to equip developers with the skills and knowledge to create more flexible and future-proof web applications. We'll explore the importance of maintaining autonomy in a rapidly changing tech landscape and how to make informed decisions in PHP development.
This talk is aimed at encouraging a more independent approach to using PHP frameworks, moving towards a more flexible and future-proof approach to PHP development.
Connector Corner: Automate dynamic content and events by pushing a buttonDianaGray10
Here is something new! In our next Connector Corner webinar, we will demonstrate how you can use a single workflow to:
Create a campaign using Mailchimp with merge tags/fields
Send an interactive Slack channel message (using buttons)
Have the message received by managers and peers along with a test email for review
But there’s more:
In a second workflow supporting the same use case, you’ll see:
Your campaign sent to target colleagues for approval
If the “Approve” button is clicked, a Jira/Zendesk ticket is created for the marketing design team
But—if the “Reject” button is pushed, colleagues will be alerted via Slack message
Join us to learn more about this new, human-in-the-loop capability, brought to you by Integration Service connectors.
And...
Speakers:
Akshay Agnihotri, Product Manager
Charlie Greenberg, Host
"Impact of front-end architecture on development cost", Viktor TurskyiFwdays
I have heard many times that architecture is not important for the front-end. Also, many times I have seen how developers implement features on the front-end just following the standard rules for a framework and think that this is enough to successfully launch the project, and then the project fails. How to prevent this and what approach to choose? I have launched dozens of complex projects and during the talk we will analyze which approaches have worked for me and which have not.
Smart TV Buyer Insights Survey 2024 by 91mobiles.pdf91mobiles
91mobiles recently conducted a Smart TV Buyer Insights Survey in which we asked over 3,000 respondents about the TV they own, aspects they look at on a new TV, and their TV buying preferences.
Accelerate your Kubernetes clusters with Varnish CachingThijs Feryn
A presentation about the usage and availability of Varnish on Kubernetes. This talk explores the capabilities of Varnish caching and shows how to use the Varnish Helm chart to deploy it to Kubernetes.
This presentation was delivered at K8SUG Singapore. See https://feryn.eu/presentations/accelerate-your-kubernetes-clusters-with-varnish-caching-k8sug-singapore-28-2024 for more details.
Let's dive deeper into the world of ODC! Ricardo Alves (OutSystems) will join us to tell all about the new Data Fabric. After that, Sezen de Bruijn (OutSystems) will get into the details on how to best design a sturdy architecture within ODC.
UiPath Test Automation using UiPath Test Suite series, part 4DianaGray10
Welcome to UiPath Test Automation using UiPath Test Suite series part 4. In this session, we will cover Test Manager overview along with SAP heatmap.
The UiPath Test Manager overview with SAP heatmap webinar offers a concise yet comprehensive exploration of the role of a Test Manager within SAP environments, coupled with the utilization of heatmaps for effective testing strategies.
Participants will gain insights into the responsibilities, challenges, and best practices associated with test management in SAP projects. Additionally, the webinar delves into the significance of heatmaps as a visual aid for identifying testing priorities, areas of risk, and resource allocation within SAP landscapes. Through this session, attendees can expect to enhance their understanding of test management principles while learning practical approaches to optimize testing processes in SAP environments using heatmap visualization techniques
What will you get from this session?
1. Insights into SAP testing best practices
2. Heatmap utilization for testing
3. Optimization of testing processes
4. Demo
Topics covered:
Execution from the test manager
Orchestrator execution result
Defect reporting
SAP heatmap example with demo
Speaker:
Deepak Rai, Automation Practice Lead, Boundaryless Group and UiPath MVP
Software Delivery At the Speed of AI: Inflectra Invests In AI-Powered QualityInflectra
In this insightful webinar, Inflectra explores how artificial intelligence (AI) is transforming software development and testing. Discover how AI-powered tools are revolutionizing every stage of the software development lifecycle (SDLC), from design and prototyping to testing, deployment, and monitoring.
Learn about:
• The Future of Testing: How AI is shifting testing towards verification, analysis, and higher-level skills, while reducing repetitive tasks.
• Test Automation: How AI-powered test case generation, optimization, and self-healing tests are making testing more efficient and effective.
• Visual Testing: Explore the emerging capabilities of AI in visual testing and how it's set to revolutionize UI verification.
• Inflectra's AI Solutions: See demonstrations of Inflectra's cutting-edge AI tools like the ChatGPT plugin and Azure Open AI platform, designed to streamline your testing process.
Whether you're a developer, tester, or QA professional, this webinar will give you valuable insights into how AI is shaping the future of software delivery.
Kubernetes & AI - Beauty and the Beast !?! @KCD Istanbul 2024Tobias Schneck
As AI technology is pushing into IT I was wondering myself, as an “infrastructure container kubernetes guy”, how get this fancy AI technology get managed from an infrastructure operational view? Is it possible to apply our lovely cloud native principals as well? What benefit’s both technologies could bring to each other?
Let me take this questions and provide you a short journey through existing deployment models and use cases for AI software. On practical examples, we discuss what cloud/on-premise strategy we may need for applying it to our own infrastructure to get it to work from an enterprise perspective. I want to give an overview about infrastructure requirements and technologies, what could be beneficial or limiting your AI use cases in an enterprise environment. An interactive Demo will give you some insides, what approaches I got already working for real.
Builder.ai Founder Sachin Dev Duggal's Strategic Approach to Create an Innova...Ramesh Iyer
In today's fast-changing business world, Companies that adapt and embrace new ideas often need help to keep up with the competition. However, fostering a culture of innovation takes much work. It takes vision, leadership and willingness to take risks in the right proportion. Sachin Dev Duggal, co-founder of Builder.ai, has perfected the art of this balance, creating a company culture where creativity and growth are nurtured at each stage.
Designing Great Products: The Power of Design and Leadership by Chief Designe...
Math IA
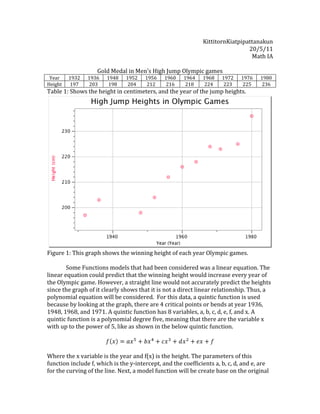
1. KittitornKiatpipattanakun
20/5/11
Math IA
Gold Medal in Men’s High Jump Olympic games
Year 1932 1936 1948 1952 1956 1960 1964 1968 1972 1976 1980
Height 197 203 198 204 212 216 218 224 223 225 236
Table 1: Shows the height in centimeters, and the year of the jump heights.
Figure 1: This graph shows the winning height of each year Olympic games.
Some Functions models that had been considered was a linear equation. The
linear equation could predict that the winning height would increase every year of
the Olympic game. However, a straight line would not accurately predict the heights
since the graph of it clearly shows that it is not a direct linear relationship. Thus, a
polynomial equation will be considered. For this data, a quintic function is used
because by looking at the graph, there are 4 critical points or bends at year 1936,
1948, 1968, and 1971. A quintic function has 8 variables, a, b, c, d, e, f, and x. A
quintic function is a polynomial degree five, meaning that there are the variable x
with up to the power of 5, like as shown in the below quintic function.
Where the x variable is the year and f(x) is the height. The parameters of this
function include f, which is the y-intercept, and the coefficients a, b, c, d, and e, are
for the curving of the line. Next, a model function will be create base on the original
2. graph algebraically.Firstly, the year must be manipulated to have a y-intercept
shown where x=0. This is because to satisfy the range between 1632 and 1980 years
so that the y-intercept is at 197 cm of the year 1932 as the starting point. If the value
x would not be manipulated, then this would occur as shown below with a computer
generated quintic equation.
Figure 2: This graph shows the un-manipulated x-axis, where the y-intercept is at
approximately 460-million height cm, which shows an undesirable function.
If this model is used, then it would be harder to predict other values, so the year
number is manipulated as shown in the table below. Where every 4 years in the un-
manipulated data is equal to 1 year in the manipulated data.
Un-manipulated year Manipulated year Height (cm)
1932 0 197
1936 1 203
1940 (not played) - (2) -
1944 (not played) - (3) -
1948 4 198
1952 5 204
1956 6 212
1960 7 216
1964 8 218
1968 9 224
1972 10 223
1976 11 225
1980 12 236
3. Table 2: Notice that the year jump from 1 to 4 of the year 1936 and 1948 is because
2 years are left out 1940 and 1944. Which is the year 2 and 3 that are left out.
Secondly, to find the function model, at least 5 data points must be use to
make the model. In the following algebra work, the manipulated years 0, 4, 7, 9, 11,
and 12 will be use to generate the model.
The first thing we can get is the y-intercept, where the x or (manipulated year) is
equal to zero. Which is the height 197 cm. Thus the other 5 data points will be use to
find the model.
Manipulated Quintic Function after pluggin in the manipulated year as ‘x’
Year
4
7
9
11
12
Table 3: Shows the manipulated years and the equation with the plugged in y
(height), x (manipulated year), and f (y-intercept) of 197.
Manipulated Year Simplified Quintic Function
4
7
9
11
12
Table 4: Shows the manipulated years and the simplified quintic Function of Table 3.
Thus, from these equation, matrix is use to solve the unknown coefficient.
After using a calculator to solve the matrix, the a, b, c, d, e value is found.
Thus, a function model is found:
4. In the next step, a manipulated year data is shown, which is proportionality the
same as the original. And another graph will be shown with the original
manipulated year with the acquired quintic function model.
Figure 3: This shows the Original graph manipulated years.
Figure 4: This shows the added equation acquired earlier by the use of matrices.
5. The function model does seems to be accurate at following the data points, only 5
points that are not on the fit line does seem to be very near the line. There are
limitations however because after the last data point, the model seems to go up
infinitively, so this can only be use of the range from year 1932 to 1980, and can
predict the heights only in these years.
Figure 5: This shows a computer generated quintic function of the manipulated
years.
To compare these two functions:
Algebraically: RMSE: 2.71 cm
Using technology: RMSE: 1.848 cm
By comparing the two functions, the technology-generated function has RMSE of
1.848 cm, which has higher precision than the algebraically acquired function at
2.71 cm. However these two functions is very similar and is off by just a small
portion.
To estimate the winning heights in 1940 and 1944, plugging in the year 2 and 3 into
the computer generated formula will held a more accurate result.
6. These answer can be justified because according to the computer generated graph,
the value must be between 203 and 198 cm, since the height 203 cm is the year
1936 then the graph decreases to 198 cm in year 1948. The two values must then be
decreasing in the range of 203 and 198 cm.
Next, the computer-generated model will predict the winning height in 1984 and
2016. Where the manipulated years of these two will be 13 and 21 respectively.
From these two predicted results, it is impossible for a human being to physically
jump unassisted as high as 4790 cm. The current world record is 2.45 meters by
Javier Sotomayer in 1993. However 266 cm is still very high for human to jump.
Year 1896 1904 1908 1912 1920 1928 1984 1988 1992 1996 2000 2004 2008
Height 190 180 191 193 193 194 235 238 234 239 235 236 236
Table 5: This shows the additional data
The acquired quintic function model doesn’t seem to fit this additional data as seen
below. The line after and before each end seems to go on upwards or downwards
infinitely, leaving out the data points.
7. Figure 6: This shows the manipulated years of 1896 to be the starting point at x=0.
The line fit is only between the year 1932 and 1980 or at 8 to 20.
The overall trend from 1896 to 2008 can be described as like a logistic curve. From
the starting year to 1928, it seems to level out, except for year 1904. Then the from
year 1932 to 1980, it seems to increase steadily from height 197 cm to 236 cm. Later
on after this year, it seems to reach the human limit with around 235 cm. The
overall trend after 1980 is like a leveled line.
Some modifications that may need for the model to fit the data is to let the
computer generate again all the data point as a quintic function as shown below.
Figure 7: This shows the full generated quintic function of all the additional data.
However this function still cannot predict future years. To overcome this, a logistic
curve should be considered, since a logistic curve has a straight line incoming, an
increase in the middle, then a leveled out straight line at the end, which seems to
match the overall trend in the gold medal heights.