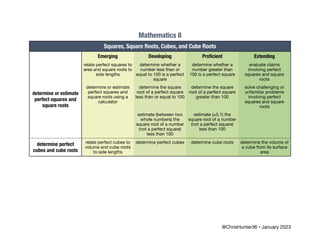
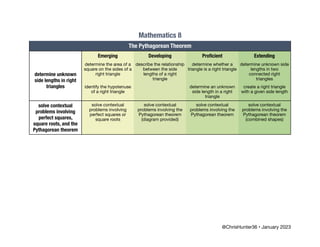
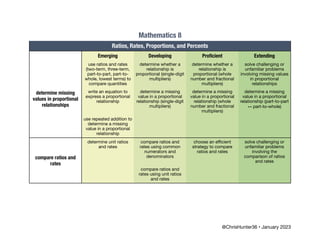
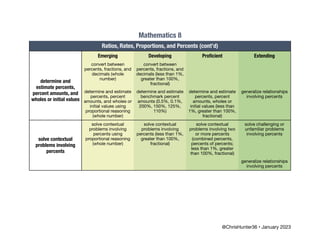
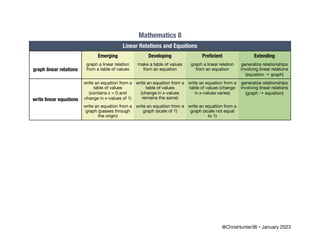
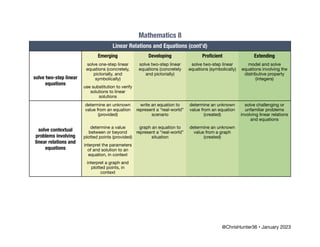
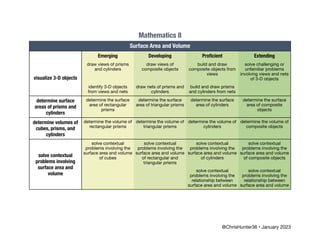
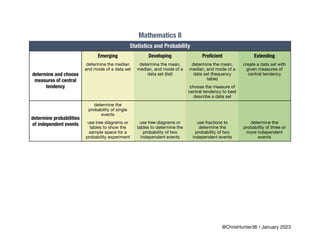
This document outlines mathematics skills and concepts for grade 8. It covers topics such as squares, square roots, cubes and cube roots; the Pythagorean theorem; operations with fractions; ratios, rates, proportions and percents; linear relations and equations; surface area and volume; and statistics and probability. For each topic, it lists specific skills from emerging to extending levels of understanding.
- Definisi sistem koordinat polar (kutub);
- Mengubah koordinat polar ke koordinat kartesius dan sebaliknya;
- Kurva polar;
- Gradien garis singgung kurva polar;
- Luas area yang dilingkupi kurva polar;
- Panjang busur kurva polar;
- Luas permukaan dari kurva polar yang diputar terhadap sumbu tertentu.
Penggunaan Kasus Ekstrem dan GeneralisasiAgung Anggoro
Tulisan yang kami susun ini terdiri atas pembahasan mengenai teori pendidikan yang mendukung pada proses pemecahan masalah pada topik pemanfaatan kesimetrian dan pemecahan masalah terkait dengan kasus ekstrem dan generalisasi. Adapun pemecahan masalah terkait dengan pemanfaatan kesimetrian terdiri atas pembahasan masalah yang terdapat pada buku Problem-Solving through Problems dan pembahasan masalah pada soal-soal Sekolah Dasar dan Menengah.
Pendekatan Terbuka dan Pembelajaran KontekstualIip Muzdalipah
Pendekatan Terbuka (Open-Ended Approach)
Menurut Shimada (1997: 1), pendekatan open ended adalah suatu pendekatan pembelajaran yang dimulai dari mengenalkan atau menghadapkan siswa pada masalah terbuka.
Menurut Seherman dkk., (2003), pendekatan pembelajaran yang menyajikan suatu permasalahan yang memiliki metode atau penyelesaian yang benar lebih dari satu.
Pendekatan Kontekstual (Contextual Teaching and learning)
Pembelajaran kontekstual (CTL) merupakan suatu proses pendidikan yang holistik dan bertujuan membantu siswa untuk memahami makna materi pelajaran yang dipelajarinya dengan mengkaitkan materi tersebut dengan konteks kehidupan mereka sehari-hari (konteks pribadi, sosial dan kultural). Sehingga siswa memiliki pengetahuan/keterampilan yang secara fleksibel dapat diterapkan (ditransfer) dari satu permasalahan/konteks ke permasalahan/-konteks lainnya.
PHStat Notes Using the PHStat Stack Data and .docxShiraPrater50
PHStat Notes
Using the PHStat Stack Data and Unstack Data Tools p. 28
One‐ and Two‐Way Tables and Charts p. 63
Normal Probability Tools p. 97
Generating Probabilities in PHStat p. 98
Confi dence Intervals for the Mean p. 136
Confi dence Intervals for Proportions p. 136
Confi dence Intervals for the Population Variance p. 137
Determining Sample Size p. 137
One‐Sample Test for the Mean, Sigma Unknown p. 169
One‐Sample Test for Proportions p. 169
Using Two‐Sample t ‐Test Tools p. 169
Testing for Equality of Variances p. 170
Chi‐Square Test for Independence p. 171
Using Regression Tools p. 209
Stepwise Regression p. 211
Best-Subsets Regression p. 212
Creating x ‐ and R ‐Charts p. 267
Creating p ‐Charts p. 268
Using the Expected Monetary Value Tool p. 375
Excel Notes
Creating Charts in Excel 2010 p. 29
Creating a Frequency Distribution and Histogram p. 61
Using the Descriptive Statistics Tool p. 61
Using the Correlation Tool p. 62
Creating Box Plots p. 63
Creating PivotTables p. 63
Excel‐Based Random Sampling Tools p. 134
Using the VLOOKUP Function p. 135
Sampling from Probability Distributions p. 135
Single‐Factor Analysis of Variance p. 171
Using the Trendline Option p. 209
Using Regression Tools p. 209
Using the Correlation Tool p. 211
Forecasting with Moving Averages p. 243
Forecasting with Exponential Smoothing p. 243
Using CB Predictor p. 244
Creating Data Tables p. 298
Data Table Dialog p. 298
Using the Scenario Manager p. 298
Using Goal Seek p. 299
Net Present Value and the NPV Function p. 299
Using the IRR Function p. 375
Crystal Ball Notes
Customizing Defi ne Assumption p. 338
Sensitivity Charts p. 339
Distribution Fitting with Crystal Ball p. 339
Correlation Matrix Tool p. 341
Tornado Charts p. 341
Bootstrap Tool p. 342
TreePlan Note
Constructing Decision Trees in Excel p. 376
This page intentionally left blank
Useful Statistical Functions in Excel 2010 Description
AVERAGE( data range ) Computes the average value (arithmetic mean) of a set of data.
BINOM.DIST( number_s, trials, probability_s, cumulative ) Returns the individual term binomial distribution.
BINOM.INV( trials, probability_s, alpha)
CHISQ.DIST( x, deg_freedom, cumulative )
CHISQ.DIST.RT( x, deg_freedom, cumulative )
CHISQ.TEST( actual_range, expected_range )
Returns the smallest value for which the cumulative binomial
distribution is greater than or equal to a criterion value.
Returns the left-tailed probability of the chi-square distribution.
Returns the right-tailed probability of the chi-square
distribution.
Returns the test for independence; the value of the chi-square
distribution and the appropriate degrees of freedom.
CONFIDENCE.NORM( alpha, standard_dev, size ) Retu ...
Special webinar on tips for perfect score in sat mathCareerGOD
Math is the language of logic and is therefore tested in all the major examinations where SAT is no exception.
Scoring well in Math can do wonders to your career and college candidature. Conversely, any complacency in Math affect your score and thus prove dangerous.
In this webinar, “Tips for perfect Math score in SAT and SAT- Math subject test” from the 5-day webinar series ‘Experts’ Speak: Demystifying US Admissions’, seasoned math trainers and subject experts with decades of experience in the industry share important insights on maximising your Math scores and minimising mistakes to lose out on Math scores.
Visit www.careergod.com for more info.
1 Lab 4 The Central Limit Theorem and A Monte Carlo Si.docxjeremylockett77
1
Lab 4 The Central Limit Theorem and A Monte Carlo Simulation
Experiment 1. The Central Limit Theorem
The Central Limit Theorem says that the sampling distribution of means, of samples of size n
from a population with a mean of and a standard deviation of , is approximately a normal
distribution with mean X and standard deviation
n
X
, if sample size 30n .
Please start R, then open a new script file File → New script and save it as Lab4_tutorial by
going to File → Save As and saving it to your M or One Drive.
Note: You will need all the graphs from this tutorial for the Lab Assignment at the end. Please
make sure you save them as you go.
We consider a population that has an exponential distribution with parameter 1.0
(therefore, 10 and 10 ). This distribution is very much skewed to the right. In this
experiment, we will demonstrate the Central Limit Theorem by showing that the sampling
distribution of sample means, of samples from this exponential population, approaches a
normal distribution with mean of 10X and standard deviation of
nn
X
10
, as
sample size n gets sufficiently large.
1. Generate samples from the population with an Exponential Distribution (= 0.1)
Simulate 100 random values from the Exponential Distribution (= 0.1) for each of 60
columns as follows:
#Start by defining a matrix of all zeros and specify the number of rows
#with nrow and number of columns with ncol.
#Label the columns using the dimnames function which takes a list
#list(rownames, columnnames)
samples<-matrix(0,nrow=100,ncol=60,
dimnames=list(NULL, paste("Sample", 1:60, sep=" ")))
#use a for loop to fill each of the columns of the matrix with a random
#sample of 100 values from a Exp(0.1) distn
for (i in 1:60){
samples[,i]<-rexp(100,0.1)
}
2
2. Explore the population distribution by examining the distribution of a random sample:
We can examine a distribution of data set by displaying its mean and standard deviation.
The following is a mean and standard deviation of a random sample of size 100 (Sample 1)
from the population with Exponential distribution ( = 0.1).
#Subset the first column from the matrix and call it sample1
sample1<-samples[,1]
#Find the mean and std dev of Sample 1 (column 1)
mean(sample1)
[1] 9.452421
sd(sample1)
[1] 9.369801
Notice that the sample mean and standard deviation are 9.452421 and 9.369801, while the
population mean and SD are 10.
To examine the shape of the distribution of a sample, please make a histogram of sample1
(or any one of the 60 samples of size 100). Change the title to “Histogram of Exp(0.1)
Sample 1”, and add a footnote “By Your Name”.
This histogram is very much right skewed. It resembles the exponential population distribution.
3
3. Examine the sampling distribution of sample means of samples of size 5:
The five numbers in the ...
Electronic Keno Project 3 Overview and Rationale.docxShiraPrater50
Electronic Keno
Project 3
Overview and Rationale
This assignment is designed to provide you with hands-on experience in using discrete and
continuous probability distributions. In this assignment you will use technology to
generate random samples and explore the samples’ relationship with the underlying
population. Finally, you will have an opportunity to apply the Central Limit Theorem to
inferential statistics.
Course Outcomes
This assignment is directly linked to the following key learning outcomes from the course
syllabus:
CO2: Create distributions and graphical representation based on given data and identify
which distribution models best fit the data
CO3: Apply the theory of probability to calculate events’ likelihoods, understanding the
differences between experimental and theoretical probabilities (the Law of Large
Numbers), and calculate posterior probabilities by using the Bayes’ Law with emphasis on
applications
CO7: Interpret meaningful relationships and patterns in the data in relation to a given
business question
Assignment Summary
Read the scenario below and follow the instructions in the project description below (Parts
1 and 2) to analyze the data presented in the Excel workbook (Module 3
Project_Keno_v1.xlsx). Complete all parts in the designated Excel workbook. Submit both
the report and the Excel workbook. The Excel workbook contains all statistical work. The
report should include all your findings along with important analysis.
Project Description
The game of Keno: keno is an ancient Chinese game that has become popular in recent
years. In one electronic version of this game, a player selects 20 numbers from the set of
numbers 1 through 100. The computer then randomly draws another set of 20 numbers
from the set 1 through 100, and the player is rewarded according to how many of his
selected numbers have been matched by the 20 numbers drawn by the computer.
Part 1
Let X be the number of matches between a player’s 20 selected numbers and the 20
numbers drawn by the computer. Then X may range from 0 (no match) to 20 (all match)
and follows a hyper-geometric probability distribution.
Complete all of the following steps (a – j) in worksheet Part 1 of the Excel workbook
provided. All cells should contain formulas.
a. Construct a tabular probability distribution for X in column E of the worksheet.
b. Construct a tabular cumulative probability distribution for X in column F of the
worksheet.
c. Create a graphical probability distribution for X.
d. Create a graphical cumulative probability distribution for X.
e. Calculate the theoretical expected value (mean), the theoretical variance, and the
theoretical standard deviation of X in the spaces provided for those quantities. Interpret
those values in your Word report
f. In column M of the worksheet, use the Excel function “=RAND()” to generate 1000
random values according to the standard uniform ...
Making and Justifying Mathematical Decisions.pdfChris Hunter
In BC’s nearly-decade-old “new” curriculum, the curricular competencies describe the processes that students are expected to develop in areas of learning such as mathematics. They reflect the “Do” in the “Know-Do-Understand” model. Under the “Communicating” header falls the curricular competency “Explain and justify mathematical ideas and decisions.” Note that it contains two processes: “Explain mathematical ideas” and “Justify mathematical decisions.” I have broken it down into its separate parts in order to understand--or reveal--its meaning.
The first part is commonplace in classrooms. By now, BC math teachers—and students—understand that “Explain mathematical ideas” means more than “Show your work.” Teachers consistently ask “What did you do?” and “How do you know?” This process is about retelling, not just of steps but of thinking.
The second part happens less frequently. Think back to the last time that you observed a student make—a necessary precursor to justify—a mathematical decision. “Justify” is about defending. Like “explain,” it involves reasoning; unlike “explain,” it also involves opinion and debate.
In order to reinterpret the curricular competency “Explain and justify mathematical ideas and decisions,” I will continue to take apart its constituent part “Justify mathematical decisions” and carefully examine the term “mathematical decisions.” What, exactly, is a “mathematical decision”? Below, I will categorize answers to this question. These categories, and the provided examples, may help to suggest new opportunities for students to justify.
Multiplication -- More Than Repeated Addition and Times Tables.pdfChris Hunter
Multiplication is repeated addition... but it also means so much more than that! In this workshop, you will explore several fundamental meanings of this operation (e.g., equal groups, arrays and areas, how a quantity is “stretched,” etc.) through rich tasks that address each of these meanings. Also, you will explore and discuss relationships between the “basic facts.” More importantly, you will learn how to help your students see that these relationships extend to other types of numbers that they come across in BC’s intermediate and middle years mathematics curriculum (e.g., two-digit whole numbers, fractions, decimals, integers, etc.).
Embracing GenAI - A Strategic ImperativePeter Windle
Artificial Intelligence (AI) technologies such as Generative AI, Image Generators and Large Language Models have had a dramatic impact on teaching, learning and assessment over the past 18 months. The most immediate threat AI posed was to Academic Integrity with Higher Education Institutes (HEIs) focusing their efforts on combating the use of GenAI in assessment. Guidelines were developed for staff and students, policies put in place too. Innovative educators have forged paths in the use of Generative AI for teaching, learning and assessments leading to pockets of transformation springing up across HEIs, often with little or no top-down guidance, support or direction.
This Gasta posits a strategic approach to integrating AI into HEIs to prepare staff, students and the curriculum for an evolving world and workplace. We will highlight the advantages of working with these technologies beyond the realm of teaching, learning and assessment by considering prompt engineering skills, industry impact, curriculum changes, and the need for staff upskilling. In contrast, not engaging strategically with Generative AI poses risks, including falling behind peers, missed opportunities and failing to ensure our graduates remain employable. The rapid evolution of AI technologies necessitates a proactive and strategic approach if we are to remain relevant.
Introduction to AI for Nonprofits with Tapp NetworkTechSoup
Dive into the world of AI! Experts Jon Hill and Tareq Monaur will guide you through AI's role in enhancing nonprofit websites and basic marketing strategies, making it easy to understand and apply.
Honest Reviews of Tim Han LMA Course Program.pptxtimhan337
Personal development courses are widely available today, with each one promising life-changing outcomes. Tim Han’s Life Mastery Achievers (LMA) Course has drawn a lot of interest. In addition to offering my frank assessment of Success Insider’s LMA Course, this piece examines the course’s effects via a variety of Tim Han LMA course reviews and Success Insider comments.
2024.06.01 Introducing a competency framework for languag learning materials ...Sandy Millin
http://sandymillin.wordpress.com/iateflwebinar2024
Published classroom materials form the basis of syllabuses, drive teacher professional development, and have a potentially huge influence on learners, teachers and education systems. All teachers also create their own materials, whether a few sentences on a blackboard, a highly-structured fully-realised online course, or anything in between. Despite this, the knowledge and skills needed to create effective language learning materials are rarely part of teacher training, and are mostly learnt by trial and error.
Knowledge and skills frameworks, generally called competency frameworks, for ELT teachers, trainers and managers have existed for a few years now. However, until I created one for my MA dissertation, there wasn’t one drawing together what we need to know and do to be able to effectively produce language learning materials.
This webinar will introduce you to my framework, highlighting the key competencies I identified from my research. It will also show how anybody involved in language teaching (any language, not just English!), teacher training, managing schools or developing language learning materials can benefit from using the framework.
Palestine last event orientationfvgnh .pptxRaedMohamed3
An EFL lesson about the current events in Palestine. It is intended to be for intermediate students who wish to increase their listening skills through a short lesson in power point.
The Roman Empire A Historical Colossus.pdfkaushalkr1407
The Roman Empire, a vast and enduring power, stands as one of history's most remarkable civilizations, leaving an indelible imprint on the world. It emerged from the Roman Republic, transitioning into an imperial powerhouse under the leadership of Augustus Caesar in 27 BCE. This transformation marked the beginning of an era defined by unprecedented territorial expansion, architectural marvels, and profound cultural influence.
The empire's roots lie in the city of Rome, founded, according to legend, by Romulus in 753 BCE. Over centuries, Rome evolved from a small settlement to a formidable republic, characterized by a complex political system with elected officials and checks on power. However, internal strife, class conflicts, and military ambitions paved the way for the end of the Republic. Julius Caesar’s dictatorship and subsequent assassination in 44 BCE created a power vacuum, leading to a civil war. Octavian, later Augustus, emerged victorious, heralding the Roman Empire’s birth.
Under Augustus, the empire experienced the Pax Romana, a 200-year period of relative peace and stability. Augustus reformed the military, established efficient administrative systems, and initiated grand construction projects. The empire's borders expanded, encompassing territories from Britain to Egypt and from Spain to the Euphrates. Roman legions, renowned for their discipline and engineering prowess, secured and maintained these vast territories, building roads, fortifications, and cities that facilitated control and integration.
The Roman Empire’s society was hierarchical, with a rigid class system. At the top were the patricians, wealthy elites who held significant political power. Below them were the plebeians, free citizens with limited political influence, and the vast numbers of slaves who formed the backbone of the economy. The family unit was central, governed by the paterfamilias, the male head who held absolute authority.
Culturally, the Romans were eclectic, absorbing and adapting elements from the civilizations they encountered, particularly the Greeks. Roman art, literature, and philosophy reflected this synthesis, creating a rich cultural tapestry. Latin, the Roman language, became the lingua franca of the Western world, influencing numerous modern languages.
Roman architecture and engineering achievements were monumental. They perfected the arch, vault, and dome, constructing enduring structures like the Colosseum, Pantheon, and aqueducts. These engineering marvels not only showcased Roman ingenuity but also served practical purposes, from public entertainment to water supply.
A Strategic Approach: GenAI in EducationPeter Windle
Artificial Intelligence (AI) technologies such as Generative AI, Image Generators and Large Language Models have had a dramatic impact on teaching, learning and assessment over the past 18 months. The most immediate threat AI posed was to Academic Integrity with Higher Education Institutes (HEIs) focusing their efforts on combating the use of GenAI in assessment. Guidelines were developed for staff and students, policies put in place too. Innovative educators have forged paths in the use of Generative AI for teaching, learning and assessments leading to pockets of transformation springing up across HEIs, often with little or no top-down guidance, support or direction.
This Gasta posits a strategic approach to integrating AI into HEIs to prepare staff, students and the curriculum for an evolving world and workplace. We will highlight the advantages of working with these technologies beyond the realm of teaching, learning and assessment by considering prompt engineering skills, industry impact, curriculum changes, and the need for staff upskilling. In contrast, not engaging strategically with Generative AI poses risks, including falling behind peers, missed opportunities and failing to ensure our graduates remain employable. The rapid evolution of AI technologies necessitates a proactive and strategic approach if we are to remain relevant.
1. Mathematics 8
Squares, Square Roots, Cubes, and Cube Roots
Emerging Developing Pro
fi
cient Extending
determine or estimate
perfect squares and
square roots
relate perfect squares to
area and square roots to
side lengths
determine whether a
number less than or
equal to 100 is a perfect
square
determine whether a
number greater than
100 is a perfect square
evaluate claims
involving perfect
squares and square
roots
determine or estimate
perfect squares and
square roots using a
calculator
determine the square
root of a perfect square
less than or equal to 100
determine the square
root of a perfect square
greater than 100
solve challenging or
unfamiliar problems
involving perfect
squares and square
roots
estimate (between two
whole numbers) the
square root of a number
(not a perfect square)
less than 100
estimate (±0.1) the
square root of a number
(not a perfect square)
less than 100
determine perfect
cubes and cube roots
relate perfect cubes to
volume and cube roots
to side lengths
determine perfect cubes determine cube roots determine the volume of
a cube from its surface
area
@ChrisHunter36 • January 2023
2. Mathematics 8
The Pythagorean Theorem
Emerging Developing Pro
fi
cient Extending
determine unknown
side lengths in right
triangles
determine the area of a
square on the sides of a
right triangle
describe the relationship
between the side
lengths of a right
triangle
determine whether a
triangle is a right triangle
determine unknown side
lengths in two
connected right
triangles
identify the hypotenuse
of a right triangle
determine an unknown
side length in a right
triangle
create a right triangle
with a given side length
solve contextual
problems involving
perfect squares,
square roots, and the
Pythagorean theorem
solve contextual
problems involving
perfect squares or
square roots
solve contextual
problems involving the
Pythagorean theorem
(diagram provided)
solve contextual
problems involving the
Pythagorean theorem
solve contextual
problems involving the
Pythagorean theorem
(combined shapes)
@ChrisHunter36 • January 2023
3. Mathematics 8
Operations with Fractions
Emerging Developing Pro
fi
cient Extending
add and subtract
fractions
add and subtract
fractions with like
denominators
add and subtract
fractions with unlike
denominators
add and subtract mixed
numbers with unlike
denominators
write an expression that
evaluates to a given
sum or di
ff
erence
add and subtract mixed
numbers with like
denominators
multiply and divide
fractions
multiply fractions and
whole numbers
multiply and divide
fractions
multiply and divide
mixed numbers
write an expression that
evaluates to a given
product or quotient
divide fractions by
whole numbers
evaluate expressions
with two or more
operations with
fractions
evaluate expressions
with two operations with
fractions (addition and
subtraction or
multiplication and
division)
evaluate expressions
with two operations with
fractions (addition or
subtraction and
multiplication or
division)
evaluate expressions
with more than two
operations with fractions
(addition or subtraction
and multiplication or
division)
write an expression that
evaluates to a given
value or characteristic
state the order in which
to perform two or more
operations with
fractions
group terms (i.e., use
brackets) so that the
expression evaluates to
a given value or
characteristic
solve contextual
problems involving
operations with
fractions
solve contextual
problems involving
operations with
fractions and whole
numbers
solve contextual
problems involving one
operation with fractions
solve contextual
problems involving two
or more operations with
fractions
solve challenging or
unfamiliar problems
involving operations
with fractions
Mathematics 8
@ChrisHunter36 • January 2023
4. Mathematics 8
Ratios, Rates, Proportions, and Percents
Emerging Developing Pro
fi
cient Extending
determine missing
values in proportional
relationships
use ratios and rates
(two-term, three-term,
part-to-part, part-to-
whole, lowest terms) to
compare quantities
determine whether a
relationship is
proportional (single-digit
multipliers)
determine whether a
relationship is
proportional (whole
number and fractional
multipliers)
solve challenging or
unfamiliar problems
involving missing values
in proportional
relationships
write an equation to
express a proportional
relationship
determine a missing
value in a proportional
relationship (single-digit
multipliers)
determine a missing
value in a proportional
relationship (whole
number and fractional
multipliers)
determine a missing
value in a proportional
relationship (part-to-part
part-to-whole)
use repeated addition to
determine a missing
value in a proportional
relationship
compare ratios and
rates
determine unit ratios
and rates
compare ratios and
rates using common
numerators and
denominators
choose an e
ffi
cient
strategy to compare
ratios and rates
solve challenging or
unfamiliar problems
involving the
comparison of ratios
and rates
compare ratios and
rates using unit ratios
and rates
@ChrisHunter36 • January 2023
5. Mathematics 8
Ratios, Rates, Proportions, and Percents (cont’d)
Emerging Developing Pro
fi
cient Extending
determine and
estimate percents,
percent amounts, and
wholes or initial values
convert between
percents, fractions, and
decimals (whole
number)
convert between
percents, fractions, and
decimals (less than 1%,
greater than 100%,
fractional)
determine and estimate
percents, percent
amounts, and wholes or
initial values using
proportional reasoning
(whole number)
determine and estimate
benchmark percent
amounts (0.5%, 0.1%,
200%, 150%, 125%,
110%)
determine and estimate
percents, percent
amounts, wholes or
initial values (less than
1%, greater than 100%,
fractional)
generalize relationships
involving percents
solve contextual
problems involving
percents
solve contextual
problems involving
percents using
proportional reasoning
(whole number)
solve contextual
problems involving
percents (less than 1%,
greater than 100%,
fractional)
solve contextual
problems involving two
or more percents
(combined percents,
percents of percents;
less than 1%, greater
than 100%, fractional)
solve challenging or
unfamiliar problems
involving percents
generalize relationships
involving percents
@ChrisHunter36 • January 2023
6. Mathematics 8
Linear Relations and Equations
Emerging Developing Pro
fi
cient Extending
graph linear relations
graph a linear relation
from a table of values
make a table of values
from an equation
graph a linear relation
from an equation
generalize relationships
involving linear relations
(equation → graph)
write linear equations
write an equation from a
table of values
(contains x = 0 and
change in x-values of 1)
write an equation from a
table of values
(change in x-values
remains the same)
write an equation from a
table of values (change
in x-values varies)
generalize relationships
involving linear relations
(graph → equation)
write an equation from a
graph (passes through
the origin)
write an equation from a
graph (scale of 1)
write an equation from a
graph (scale not equal
to 1)
@ChrisHunter36 • January 2023
7. Mathematics 8
Linear Relations and Equations (cont’d)
Emerging Developing Pro
fi
cient Extending
solve two-step linear
equations
solve one-step linear
equations (concretely,
pictorially, and
symbolically)
solve two-step linear
equations (concretely
and pictorially)
solve two-step linear
equations (symbolically)
model and solve
equations involving the
distributive property
(integers)
use substitution to verify
solutions to linear
solutions
solve contextual
problems involving
linear relations and
equations
determine an unknown
value from an equation
(provided)
write an equation to
represent a “real-world”
scenario
determine an unknown
value from an equation
(created)
solve challenging or
unfamiliar problems
involving linear relations
and equations
determine a value
between or beyond
plotted points (provided)
graph an equation to
represent a “real-world”
situation
determine an unknown
value from a graph
(created)
interpret the parameters
of and solution to an
equation, in context
interpret a graph and
plotted points, in
context
@ChrisHunter36 • January 2023
8. Mathematics 8
Surface Area and Volume
Emerging Developing Pro
fi
cient Extending
visualize 3-D objects
draw views of prisms
and cylinders
draw views of
composite objects
build and draw
composite objects from
views
solve challenging or
unfamiliar problems
involving views and nets
of 3-D objects
identify 3-D objects
from views and nets
draw nets of prisms and
cylinders
build and draw prisms
and cylinders from nets
determine surface
areas of prisms and
cylinders
determine the surface
area of rectangular
prisms
determine the surface
area of triangular prisms
determine the surface
area of cylinders
determine the surface
area of composite
objects
determine volumes of
cubes, prisms, and
cylinders
determine the volume of
rectangular prisms
determine the volume of
triangular prisms
determine the volume of
cylinders
determine the volume of
composite objects
solve contextual
problems involving
surface area and
volume
solve contextual
problems involving the
surface area and volume
of cubes
solve contextual
problems involving the
surface area and volume
of rectangular and
triangular prisms
solve contextual
problems involving the
surface area and volume
of cylinders
solve contextual
problems involving the
surface area and volume
of composite objects
solve contextual
problems involving the
relationship between
surface area and volume
solve contextual
problems involving the
relationship between
surface area and volume
@ChrisHunter36 • January 2023
9. Mathematics 8
Statistics and Probability
Emerging Developing Pro
fi
cient Extending
determine and choose
measures of central
tendency
determine the median
and mode of a data set
determine the mean,
median, and mode of a
data set (list)
determine the mean,
median, and mode of a
data set (frequency
table)
create a data set with
given measures of
central tendency
choose the measure of
central tendency to best
describe a data set
determine probabilities
of independent events
determine the
probability of single
events
use tree diagrams or
tables to show the
sample space for a
probability experiment
use tree diagrams or
tables to determine the
probability of two
independent events
use fractions to
determine the
probability of two
independent events
determine the
probability of three or
more independent
events
@ChrisHunter36 • January 2023