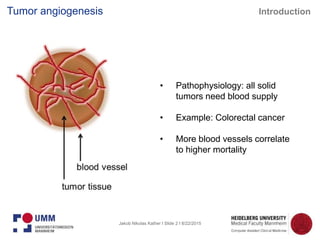
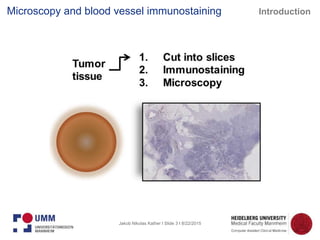
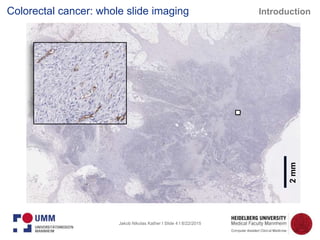
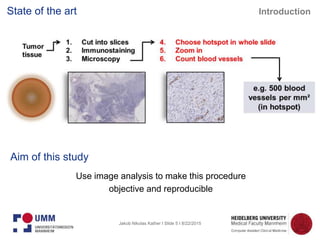
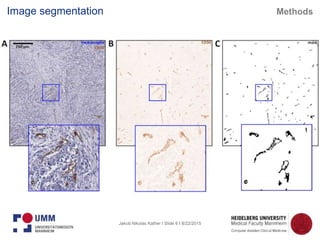
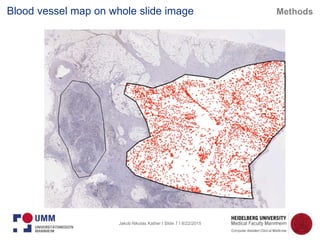
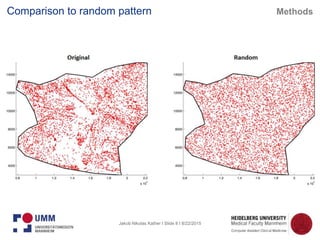
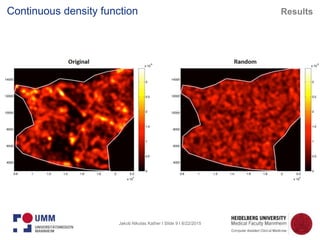
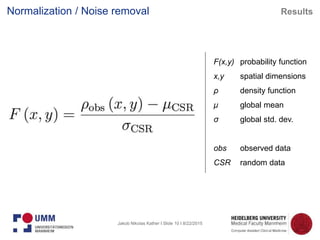
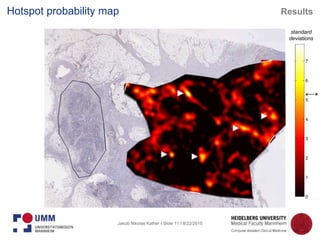
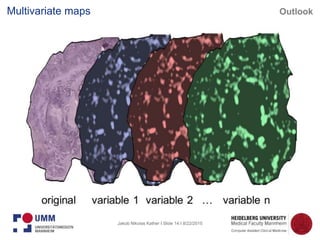
Automatic analysis of angiogenic hotspots
in histological whole slide images
Master thesis in Medical Physics
by Jakob Nikolas Kather
supervised by: PD Dr. Frank Zöllner, Dr. Cleo-Aron Weis
Jakob Nikolas Kather I Slide 2 I 8/22/2015
• Pathophysiology: all solid
tumors need blood supply
• Example: Colorectal cancer
• More blood vessels correlate
to higher mortality
Tumor angiogenesis Introduction
Jakob Nikolas Kather I Slide 3 I 8/22/2015
Microscopy and blood vessel immunostaining Introduction
Jakob Nikolas Kather I Slide 4 I 8/22/2015
Colorectal cancer: whole slide imaging
2mm
Introduction
Jakob Nikolas Kather I Slide 5 I 8/22/2015
Aim of this study
Use image analysis to make this procedure
objective and reproducible
State of the art Introduction
Jakob Nikolas Kather I Slide 6 I 8/22/2015
Image segmentation Methods
Jakob Nikolas Kather I Slide 7 I 8/22/2015
Blood vessel map on whole slide image Methods
Jakob Nikolas Kather I Slide 8 I 8/22/2015
Comparison to random pattern Methods
Jakob Nikolas Kather I Slide 9 I 8/22/2015
Continuous density function Results
Jakob Nikolas Kather I Slide 10 I 8/22/2015
F(x,y)
x,y
ρ
μ
σ
obs
CSR
probability function
spatial dimensions
density function
global mean
global std. dev.
observed data
random data
Normalization / Noise removal Results
Jakob Nikolas Kather I Slide 11 I 8/22/2015
standard
deviations
Hotspot probability map Results
Jakob Nikolas Kather I Slide 12 I 8/22/2015
Black contours = hotspots selected by blinded observer (# primary hotspot)
Color bar refers to hotspot probability function overlay (* level of significance)
Comparison to human observer Results
Jakob Nikolas Kather I Slide 13 I 8/22/2015
Optimized workflow Conclusion
Jakob Nikolas Kather I Slide 14 I 8/22/2015
Multivariate maps Outlook
Jakob Nikolas Kather I Slide 15 I 8/22/2015
Thank you!
PD Dr. Frank Zöllner
Dr. Cleo-Aron Weis, MSc
Prof. Dr. Lothar Schad
Prof. Dr. Alexander Marx
Jakob Nikolas Kather I Slide 16 I 8/22/2015
Des Guetz G, Uzzan B, Nicolas P, Cucherat M, Morere JF, Benamouzig R, et al. Microvessel
density and VEGF expression are prognostic factors in colorectal cancer. Meta-analysis of
the literature. Br J Cancer 2006;94(12):1823-32.
Baddeley, A., & Turner, R. (2005). Spatstat: an R package for analyzing spatial point
patterns. J Stat Softw, 12(6), 1–42.
Gelfand, A. E., Diggle, P., Guttorp, P., & Fuentes, M. (2010). Handbook of spatial statistics.
Boca Raton, FL, USA: CRC press.
Kather, J. N., Marx, A., Reyes-Aldasoro, C. C., Schad, L. R., Zöllner, F. G., & Weis, C.-A.
(2015). Continuous representation of tumor microvessel density and detection of
angiogenic hotspots in histological whole-slide images. Oncotarget. Epub ahead of print
2015 Jun 8.
References

Master Thesis Presentation, Medical Physics, 2015

  • 1.
    Automatic analysis ofangiogenic hotspots in histological whole slide images Master thesis in Medical Physics by Jakob Nikolas Kather supervised by: PD Dr. Frank Zöllner, Dr. Cleo-Aron Weis
  • 2.
    Jakob Nikolas KatherI Slide 2 I 8/22/2015 • Pathophysiology: all solid tumors need blood supply • Example: Colorectal cancer • More blood vessels correlate to higher mortality Tumor angiogenesis Introduction
  • 3.
    Jakob Nikolas KatherI Slide 3 I 8/22/2015 Microscopy and blood vessel immunostaining Introduction
  • 4.
    Jakob Nikolas KatherI Slide 4 I 8/22/2015 Colorectal cancer: whole slide imaging 2mm Introduction
  • 5.
    Jakob Nikolas KatherI Slide 5 I 8/22/2015 Aim of this study Use image analysis to make this procedure objective and reproducible State of the art Introduction
  • 6.
    Jakob Nikolas KatherI Slide 6 I 8/22/2015 Image segmentation Methods
  • 7.
    Jakob Nikolas KatherI Slide 7 I 8/22/2015 Blood vessel map on whole slide image Methods
  • 8.
    Jakob Nikolas KatherI Slide 8 I 8/22/2015 Comparison to random pattern Methods
  • 9.
    Jakob Nikolas KatherI Slide 9 I 8/22/2015 Continuous density function Results
  • 10.
    Jakob Nikolas KatherI Slide 10 I 8/22/2015 F(x,y) x,y ρ μ σ obs CSR probability function spatial dimensions density function global mean global std. dev. observed data random data Normalization / Noise removal Results
  • 11.
    Jakob Nikolas KatherI Slide 11 I 8/22/2015 standard deviations Hotspot probability map Results
  • 12.
    Jakob Nikolas KatherI Slide 12 I 8/22/2015 Black contours = hotspots selected by blinded observer (# primary hotspot) Color bar refers to hotspot probability function overlay (* level of significance) Comparison to human observer Results
  • 13.
    Jakob Nikolas KatherI Slide 13 I 8/22/2015 Optimized workflow Conclusion
  • 14.
    Jakob Nikolas KatherI Slide 14 I 8/22/2015 Multivariate maps Outlook
  • 15.
    Jakob Nikolas KatherI Slide 15 I 8/22/2015 Thank you! PD Dr. Frank Zöllner Dr. Cleo-Aron Weis, MSc Prof. Dr. Lothar Schad Prof. Dr. Alexander Marx
  • 16.
    Jakob Nikolas KatherI Slide 16 I 8/22/2015 Des Guetz G, Uzzan B, Nicolas P, Cucherat M, Morere JF, Benamouzig R, et al. Microvessel density and VEGF expression are prognostic factors in colorectal cancer. Meta-analysis of the literature. Br J Cancer 2006;94(12):1823-32. Baddeley, A., & Turner, R. (2005). Spatstat: an R package for analyzing spatial point patterns. J Stat Softw, 12(6), 1–42. Gelfand, A. E., Diggle, P., Guttorp, P., & Fuentes, M. (2010). Handbook of spatial statistics. Boca Raton, FL, USA: CRC press. Kather, J. N., Marx, A., Reyes-Aldasoro, C. C., Schad, L. R., Zöllner, F. G., & Weis, C.-A. (2015). Continuous representation of tumor microvessel density and detection of angiogenic hotspots in histological whole-slide images. Oncotarget. Epub ahead of print 2015 Jun 8. References