
![19WENDY’S MARKET RESEARCH CASE
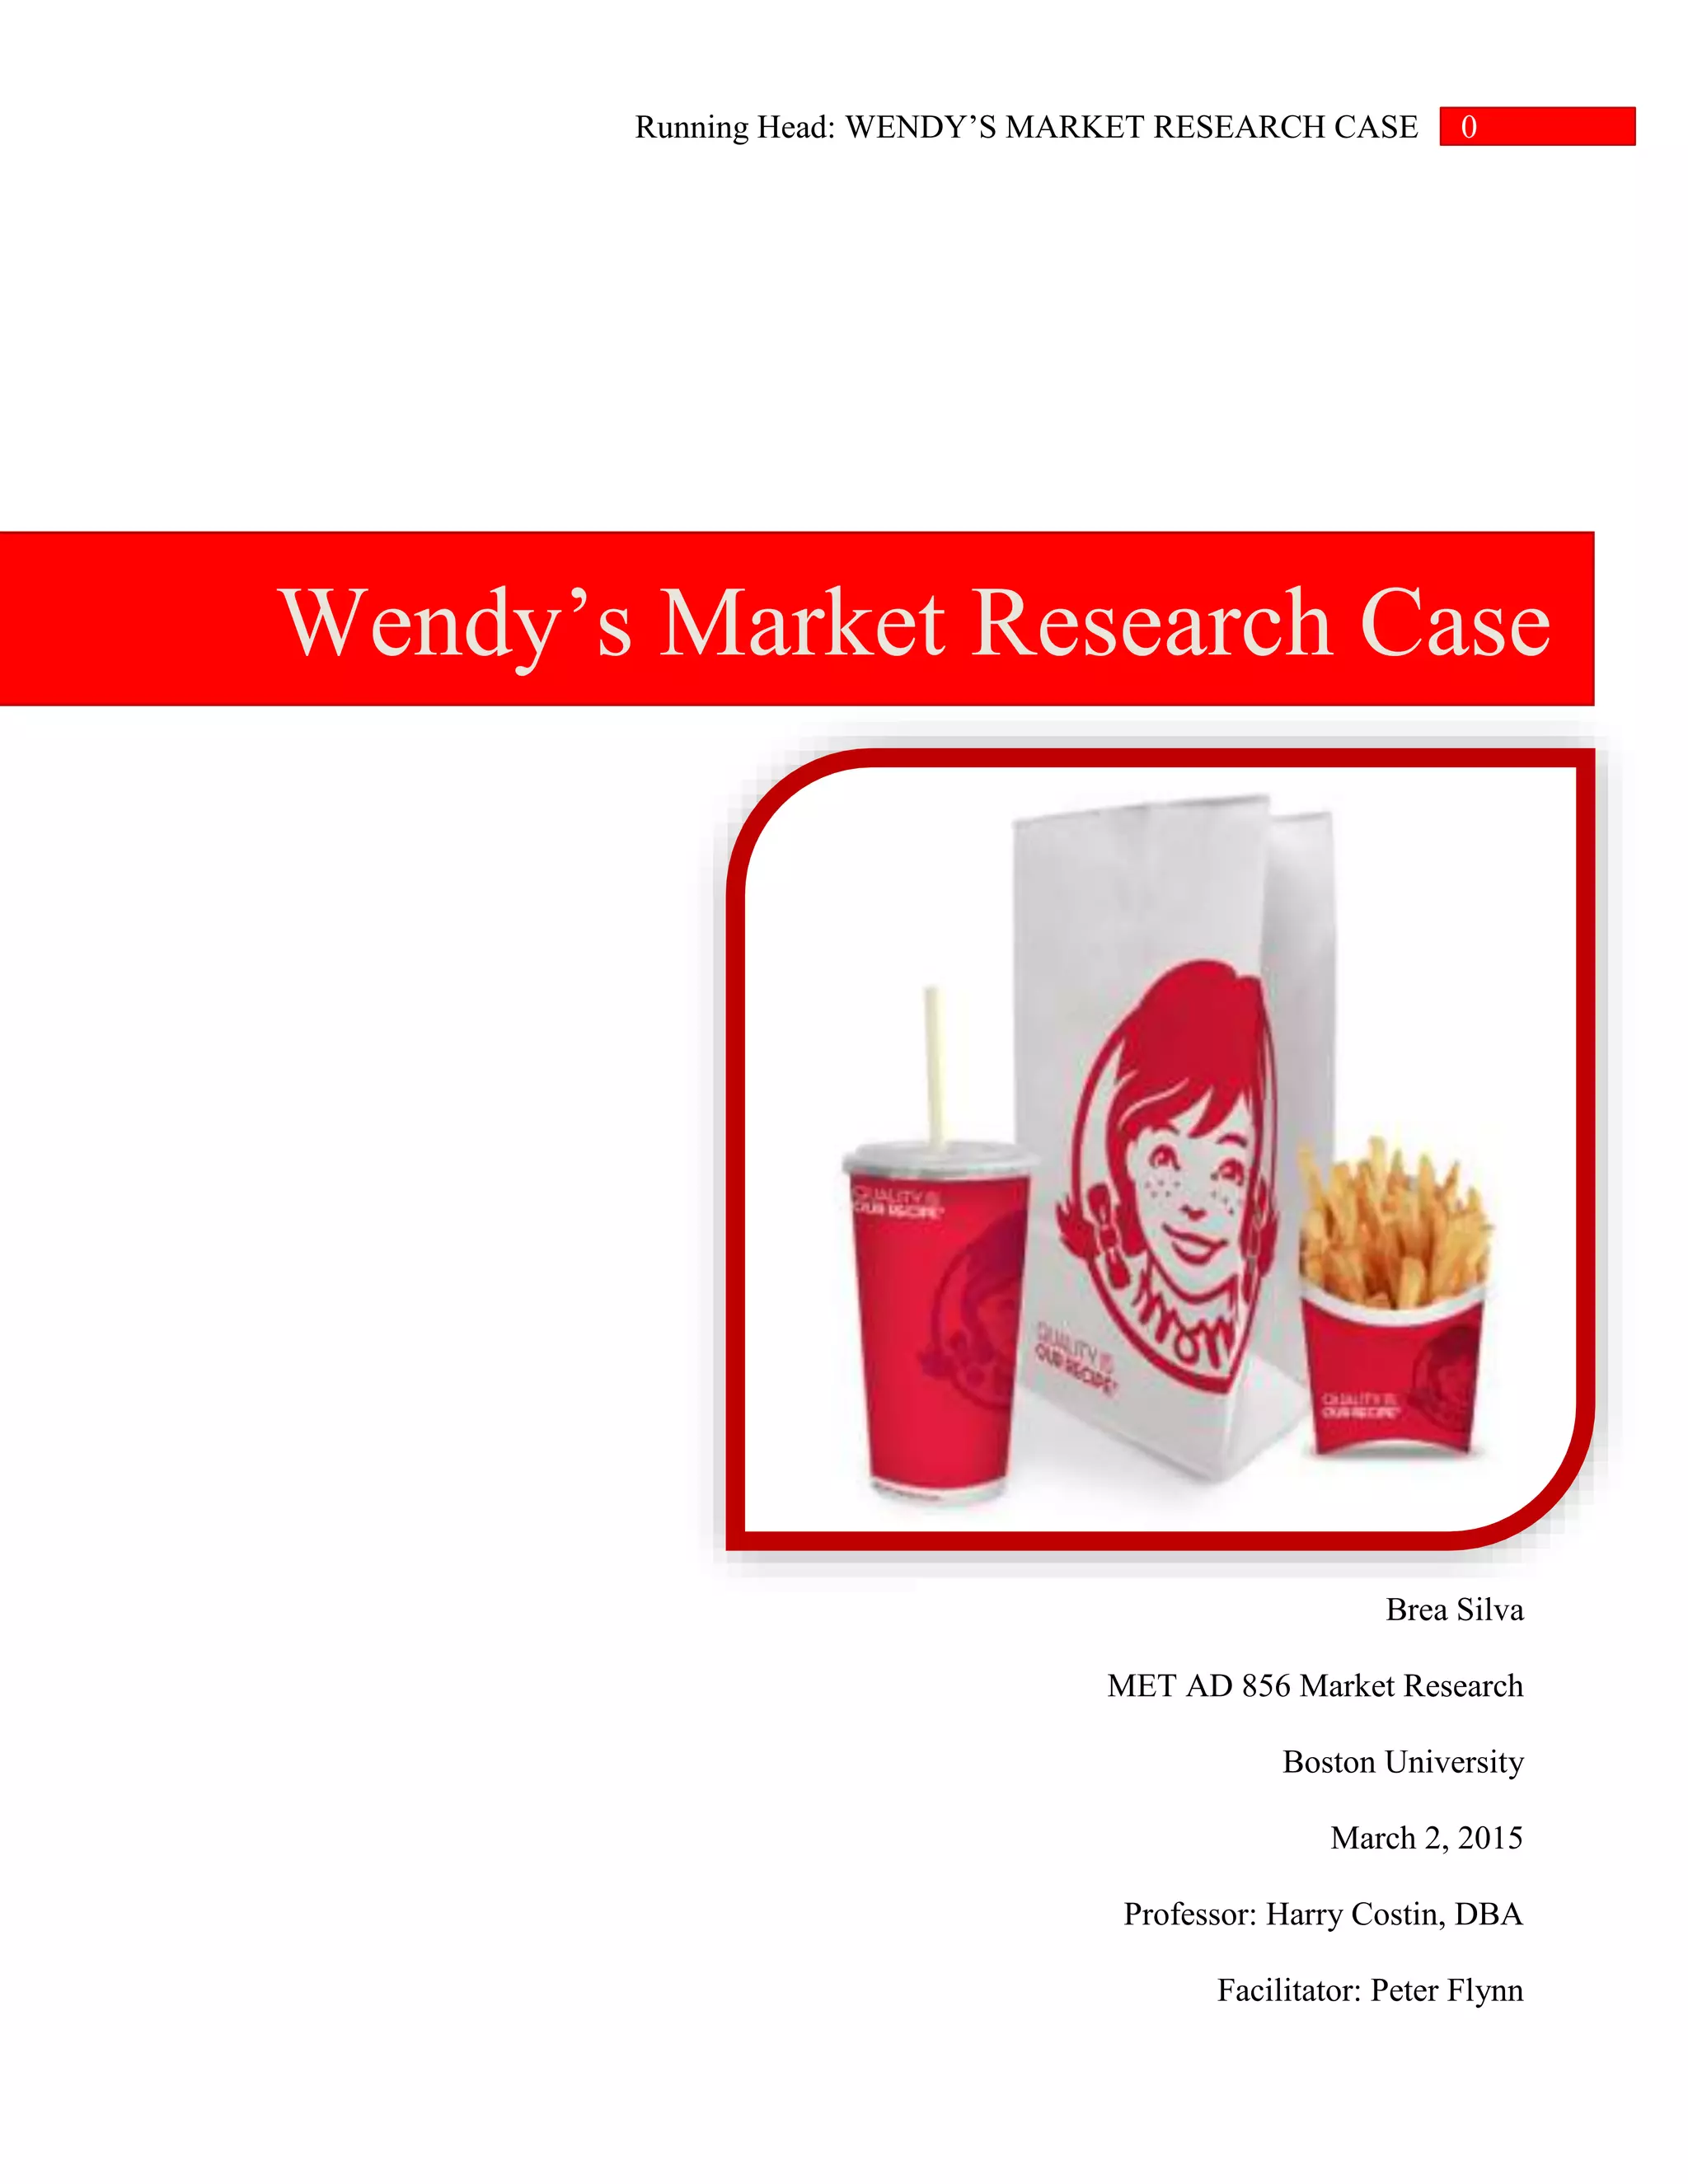
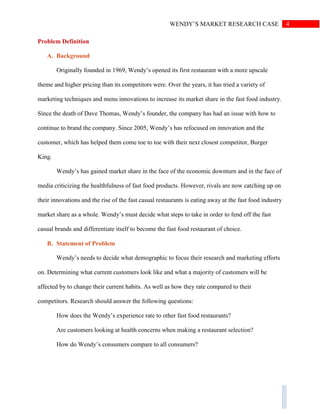
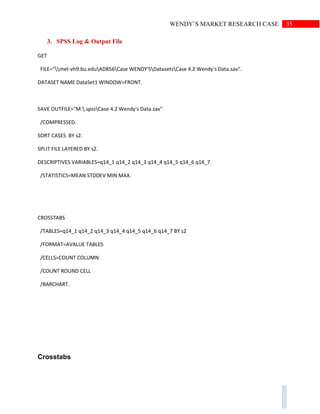
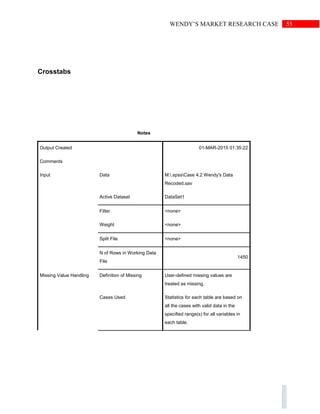
Resources Processor Time 00:00:00.02
Elapsed Time 00:00:00.01
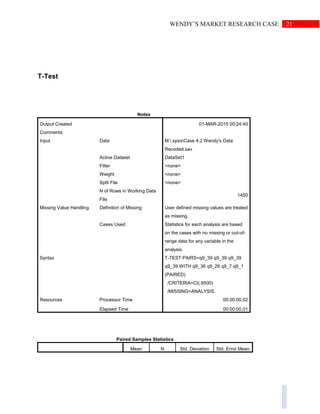
[DataSet1] M:.spssCase 4.2 Wendy's Data Recoded.sav
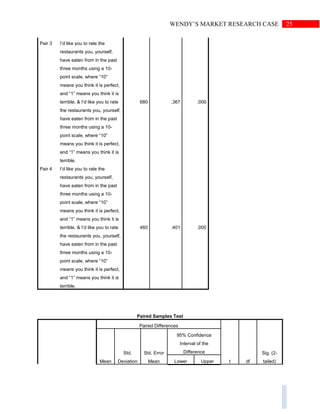
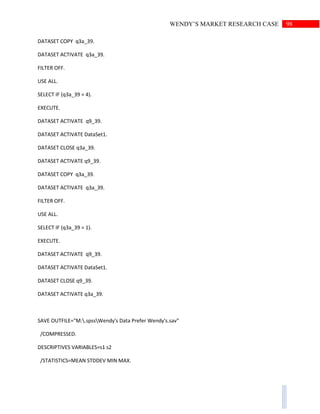
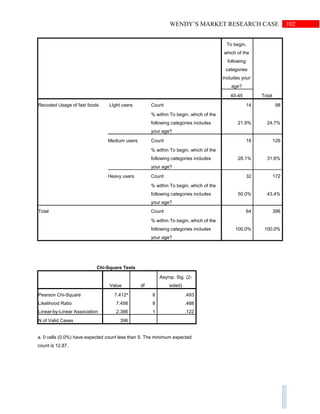
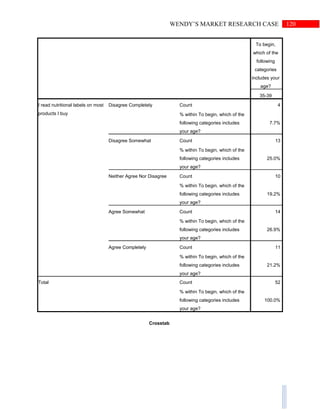
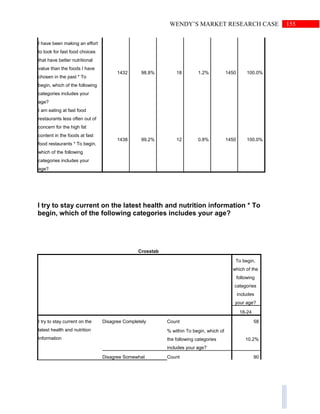
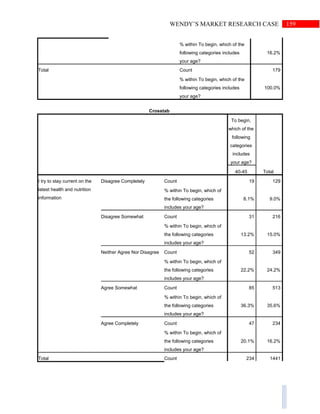
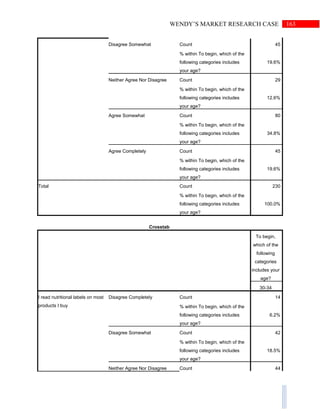
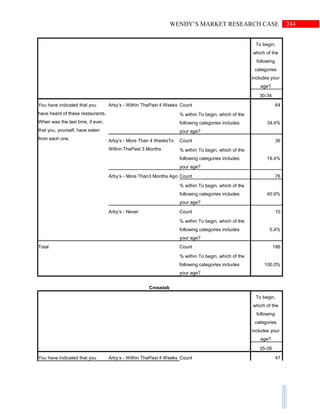
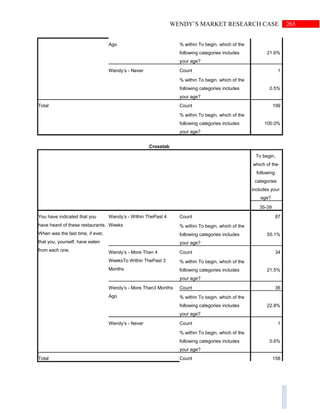
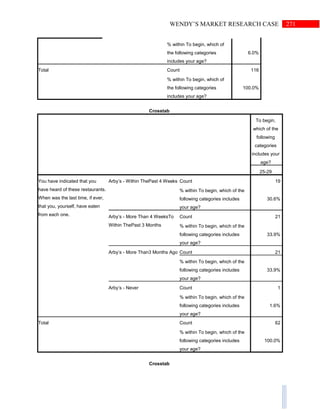
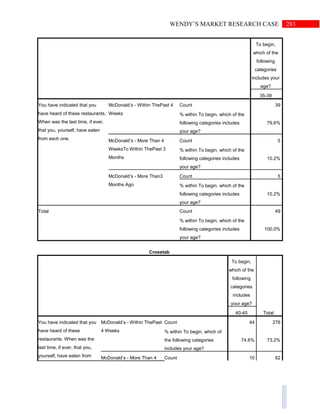
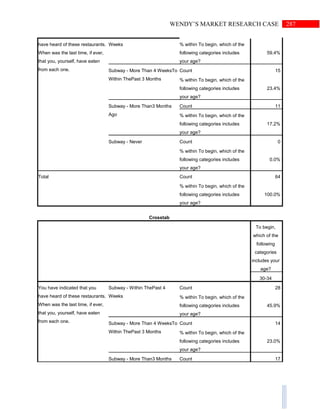
Case Processing Summary
Cases
Included Excluded Total
N Percent N Percent N Percent
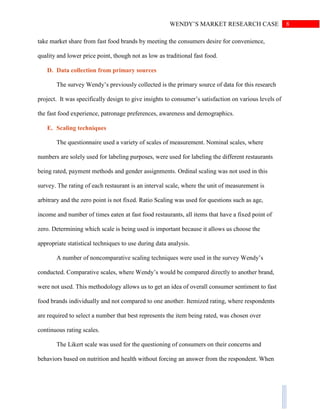
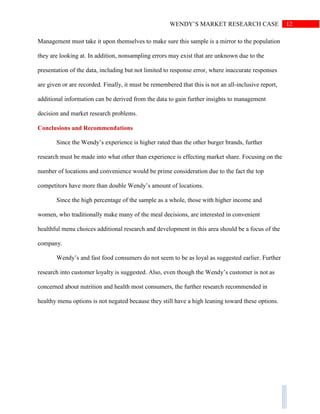
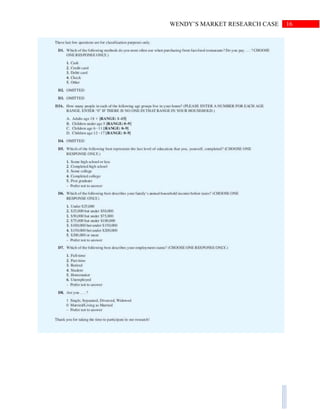
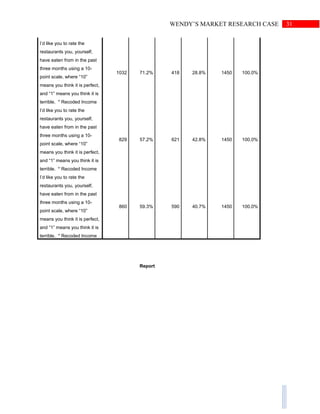
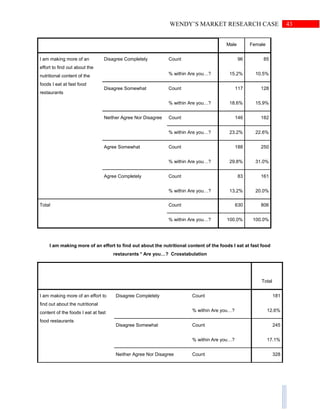
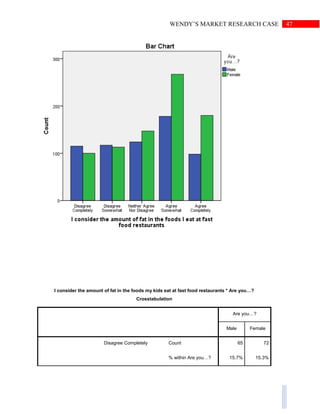
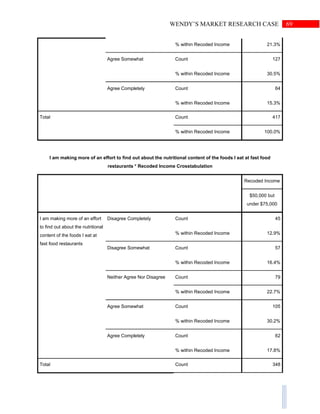
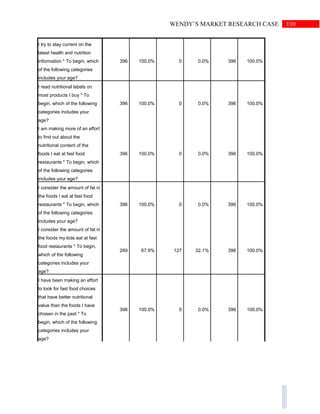
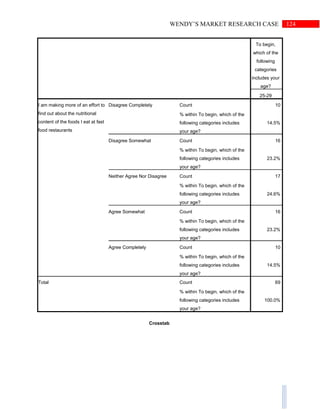
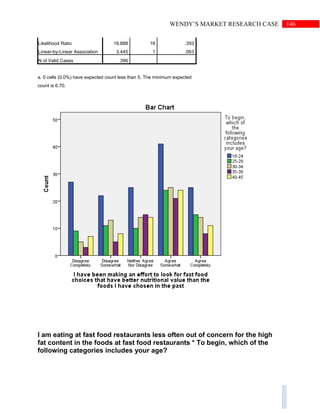
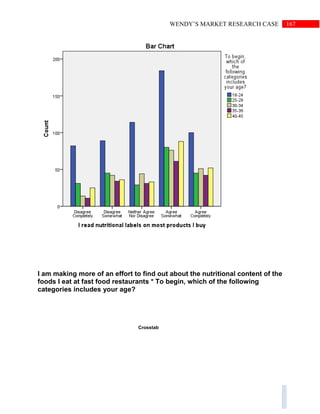
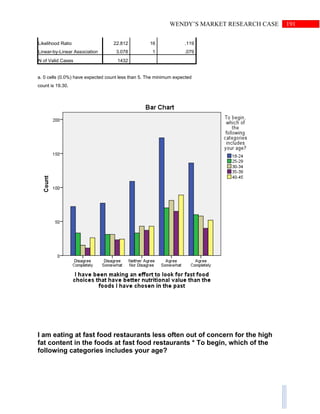
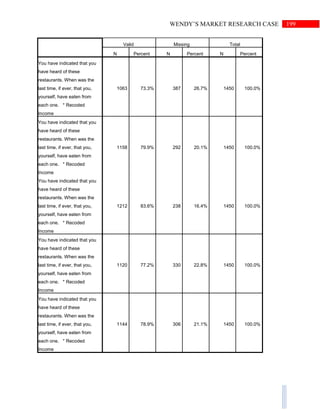
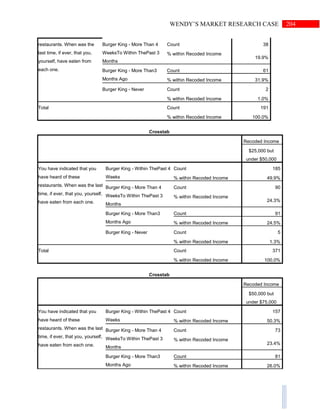
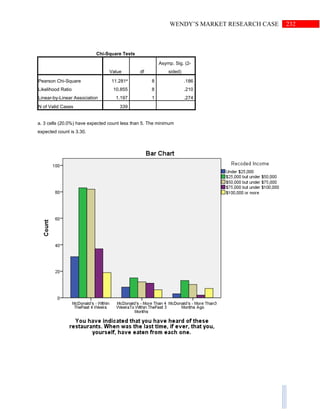
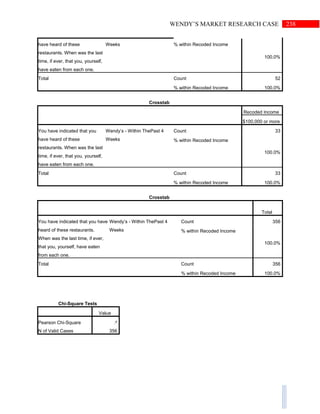
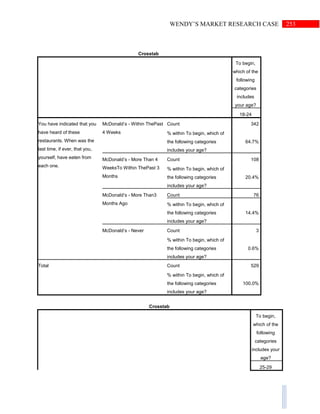
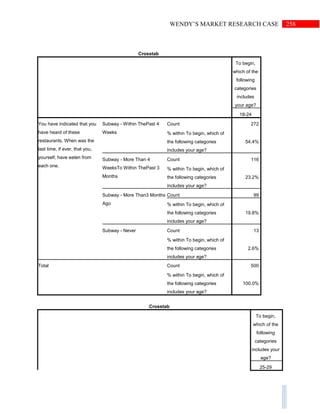
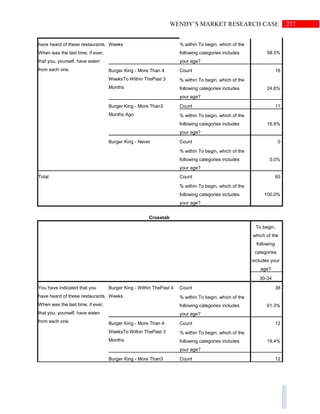
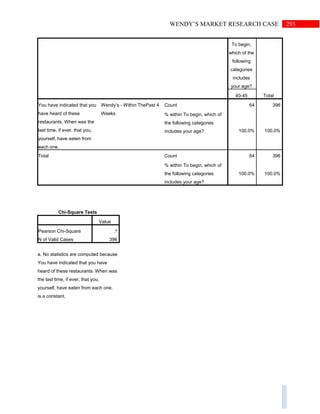
I’d like you to rate the
restaurants you, yourself,
have eaten from in the past
three months using a 10-
point scale, where “10”
means you think it is perfect,
and “1” means you think it is
terrible.
569 39.2% 881 60.8% 1450 100.0%
I’d like you to rate the
restaurants you, yourself,
have eaten from in the past
three months using a 10-
point scale, where “10”
means you think it is perfect,
and “1” means you think it is
terrible.
928 64.0% 522 36.0% 1450 100.0%
I’d like you to rate the
restaurants you, yourself,
have eaten from in the past
three months using a 10-
point scale, where “10”
means you think it is perfect,
and “1” means you think it is
terrible.
1143 78.8% 307 21.2% 1450 100.0%](https://image.slidesharecdn.com/marketresearch856finalproject-151103221240-lva1-app6892/85/Market-Research-856-Final-Project-20-320.jpg)


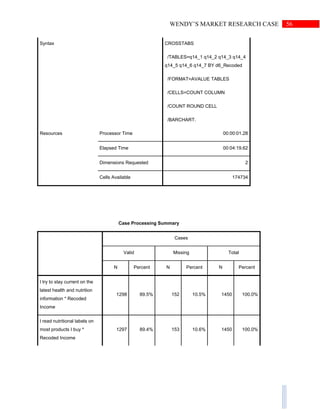


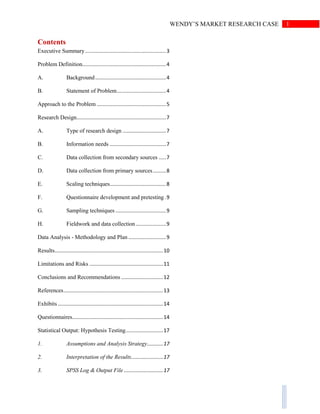
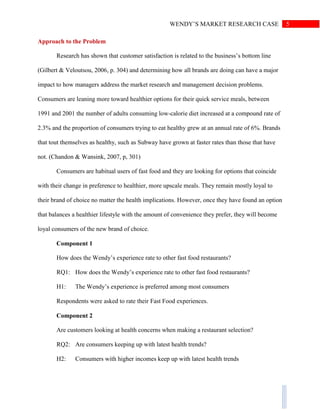
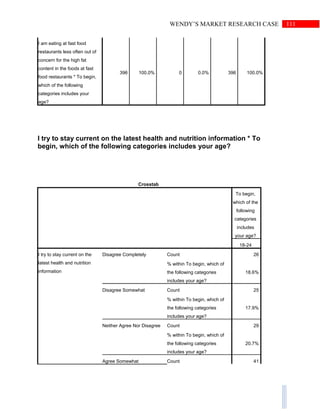
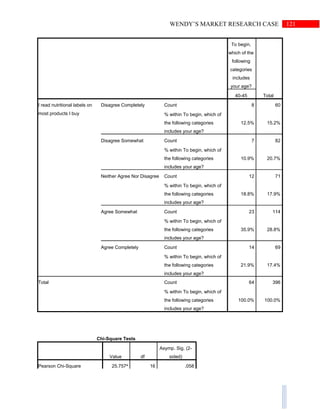
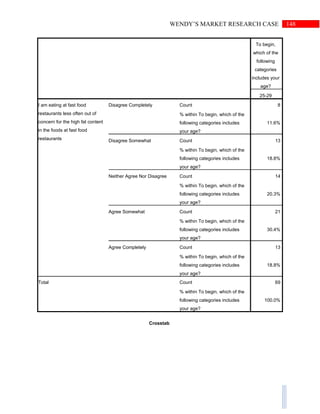
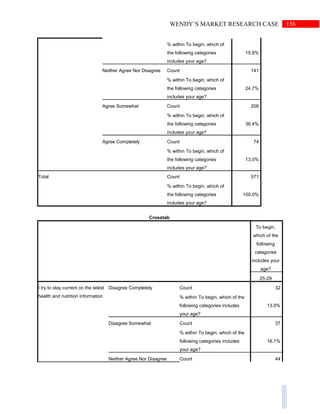
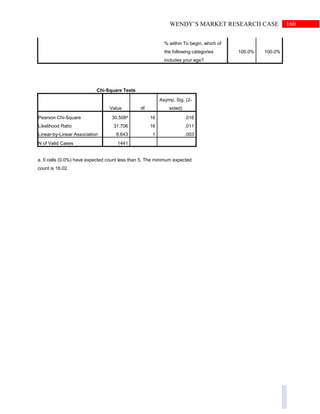
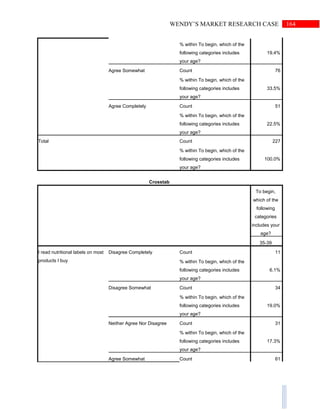
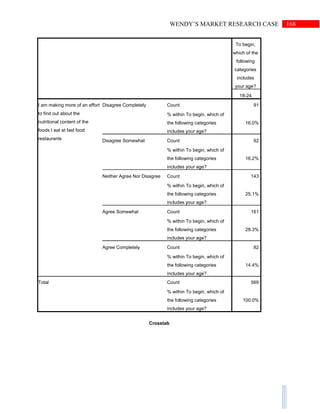
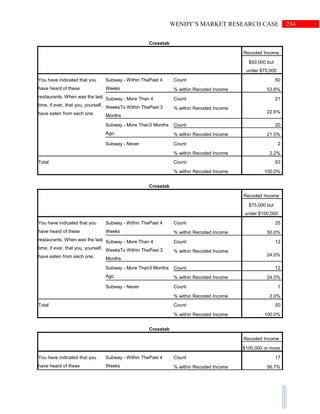
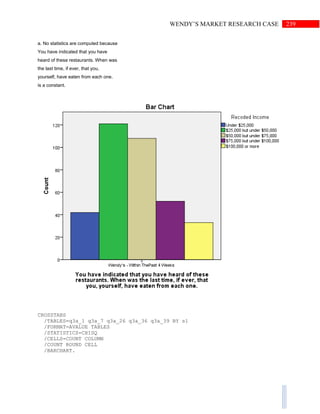
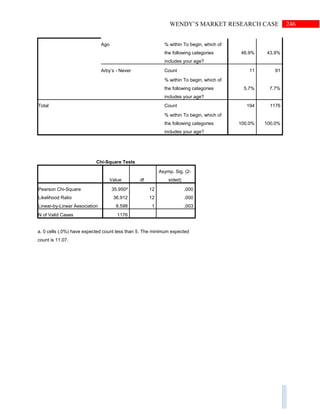
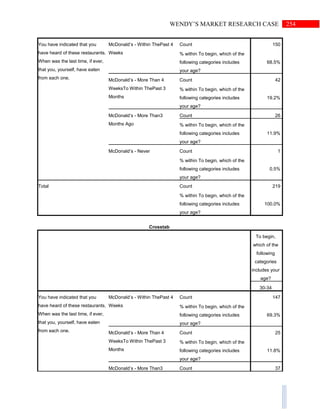
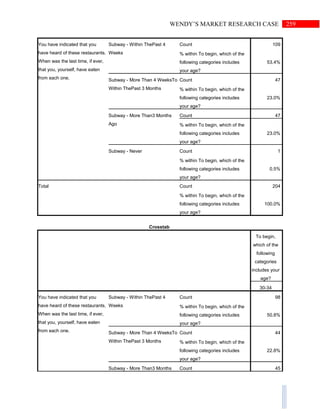
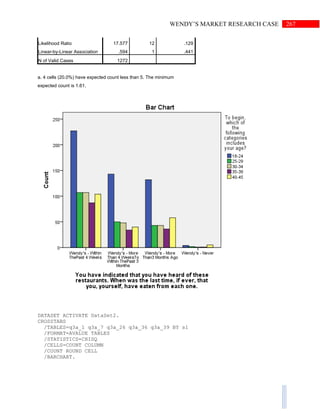
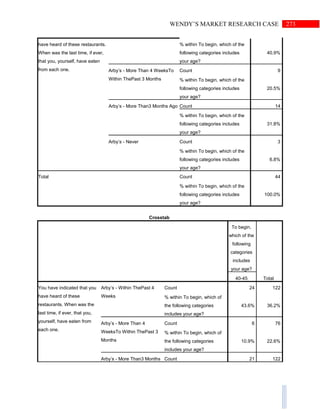
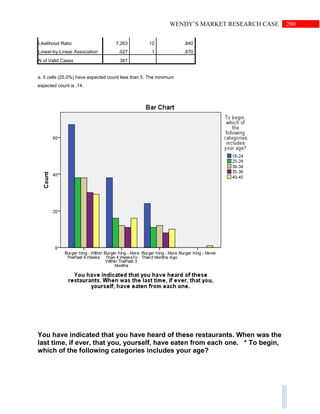
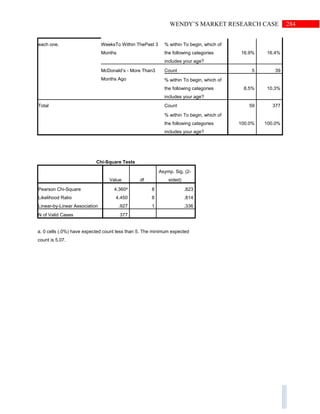
![104WENDY’S MARKET RESEARCH CASE
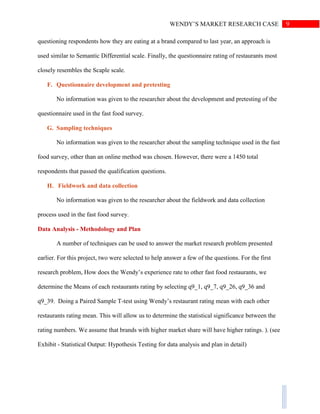
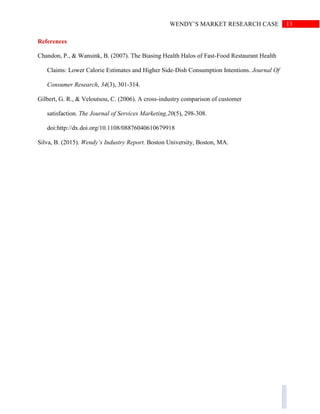
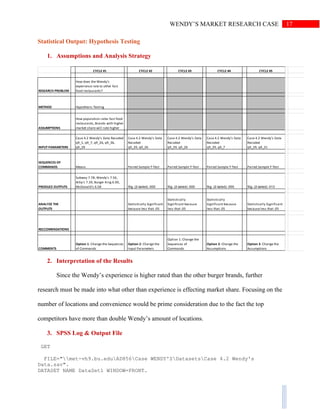
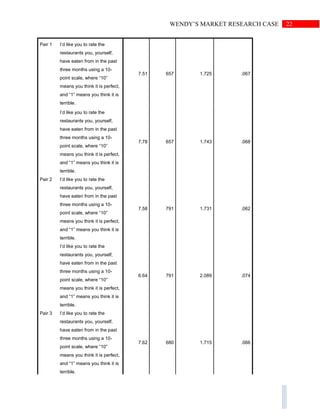
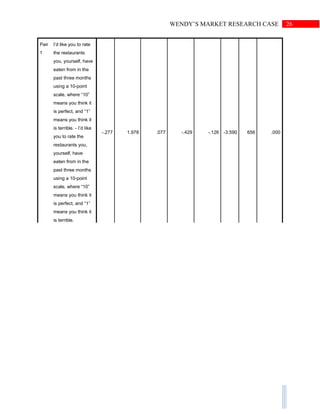
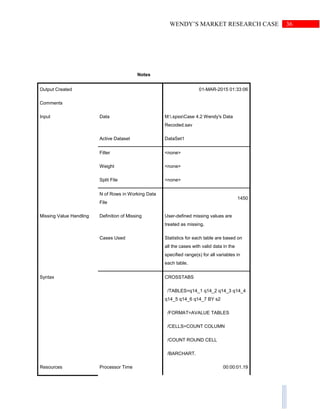
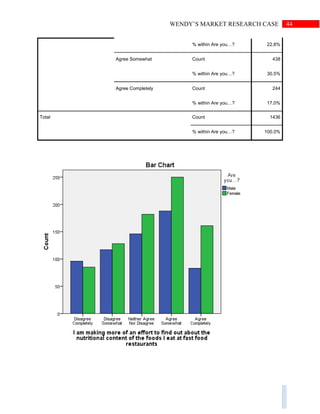
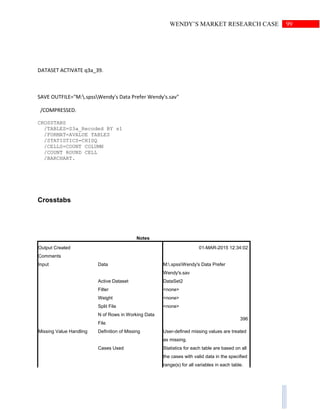
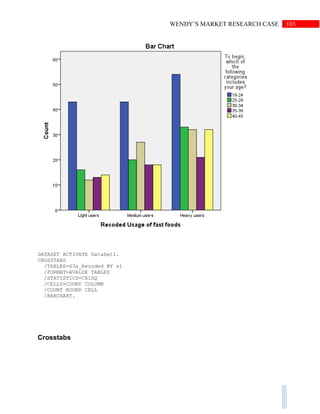
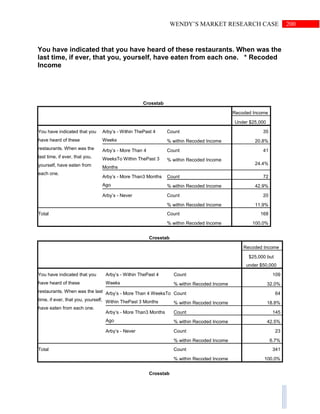
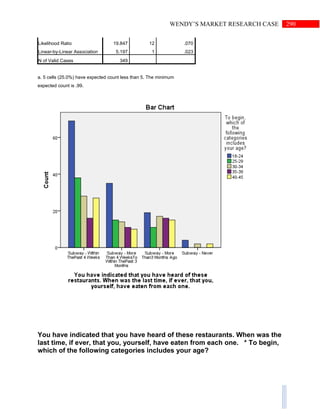
Notes
Output Created 01-MAR-2015 12:49:12
Comments
Input Data M:.spssCase 4.2 Wendy's Data
Recoded.sav
Active Dataset DataSet1
Filter <none>
Weight <none>
Split File <none>
N of Rows in Working Data
File
1450
Missing Value Handling Definition of Missing User-defined missing values are treated
as missing.
Cases Used Statistics for each table are based on all
the cases with valid data in the specified
range(s) for all variables in each table.
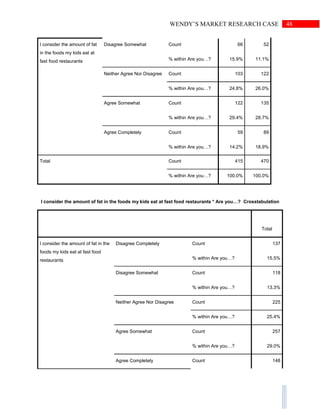
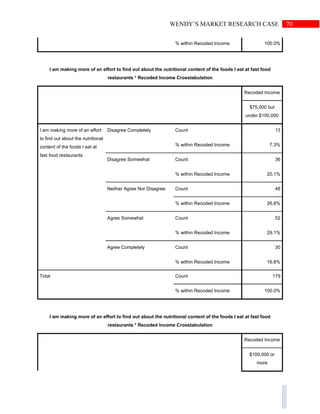
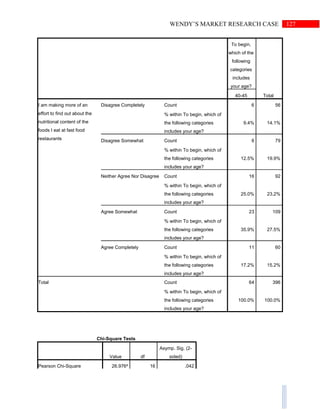
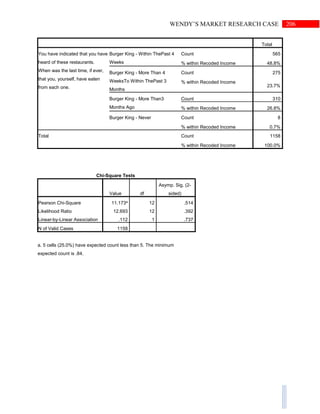
Syntax CROSSTABS
/TABLES=S3a_Recoded BY s1
/FORMAT=AVALUE TABLES
/STATISTICS=CHISQ
/CELLS=COUNT COLUMN
/COUNT ROUND CELL
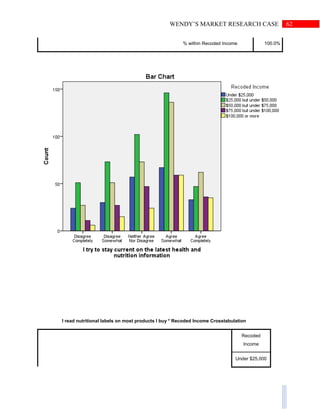
/BARCHART.
Resources Processor Time 00:00:00.34
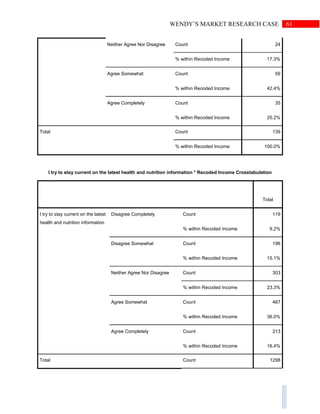
Elapsed Time 00:00:04.74
Dimensions Requested 2
Cells Available 174734
[DataSet1] M:.spssCase 4.2 Wendy's Data Recoded.sav
Case Processing Summary
Cases
Valid Missing Total
N Percent N Percent N Percent](https://image.slidesharecdn.com/marketresearch856finalproject-151103221240-lva1-app6892/85/Market-Research-856-Final-Project-105-320.jpg)


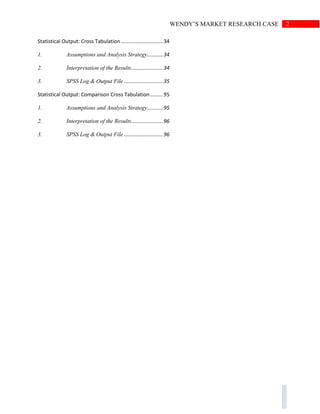
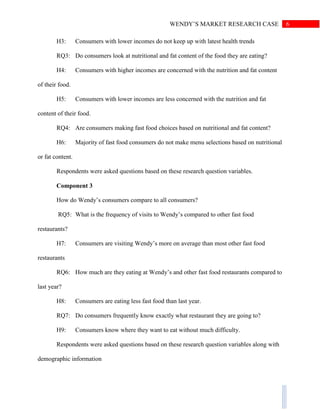
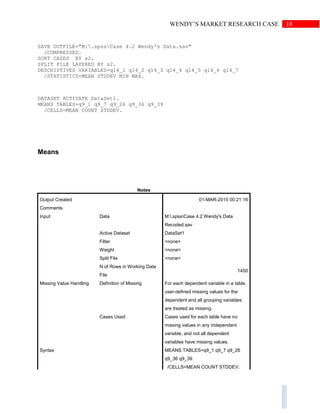
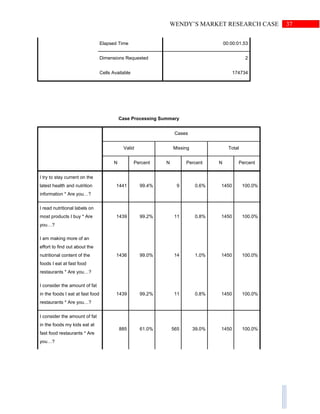
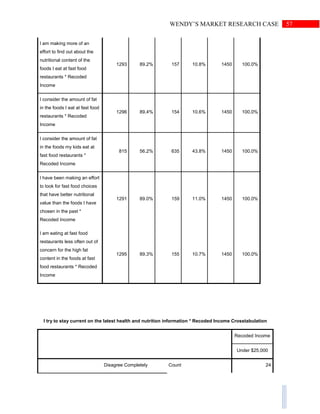
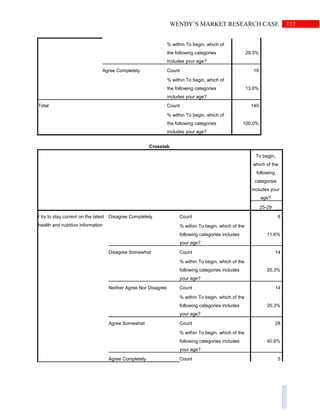
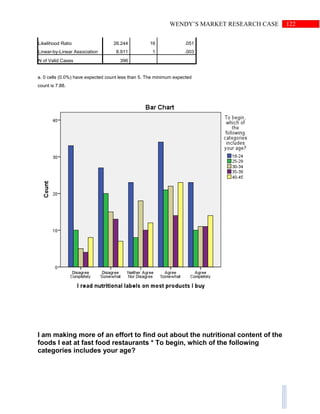
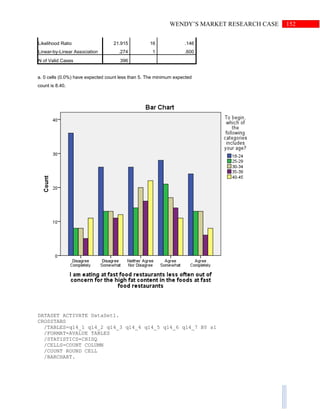
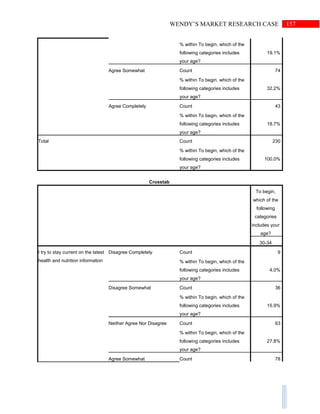
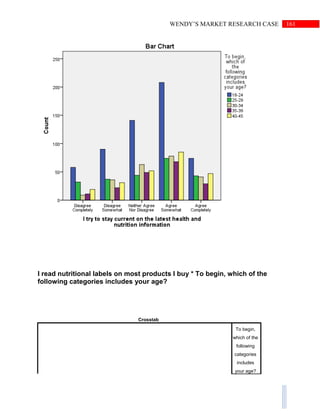
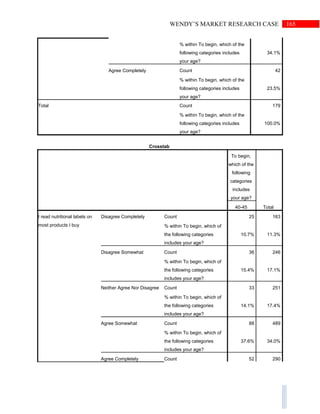
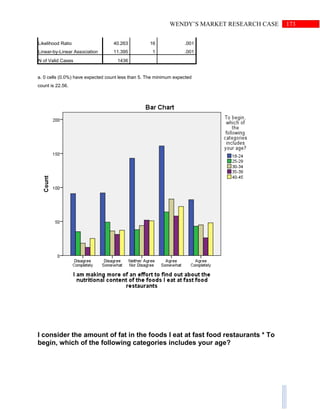
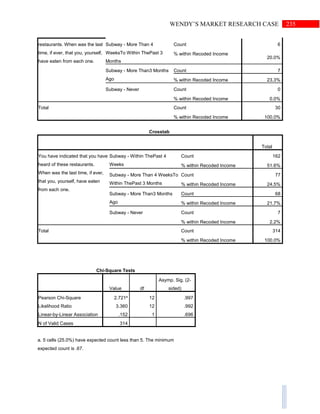
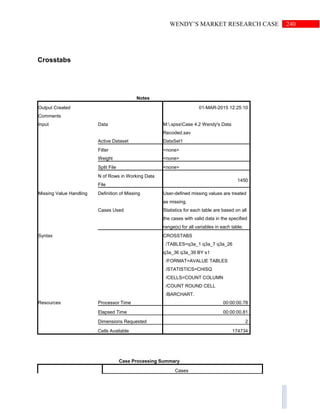
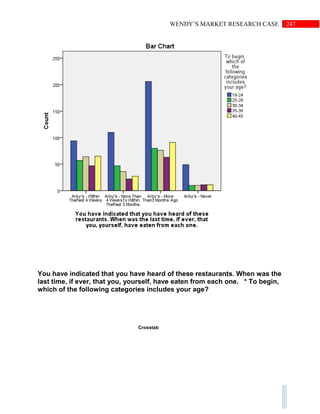
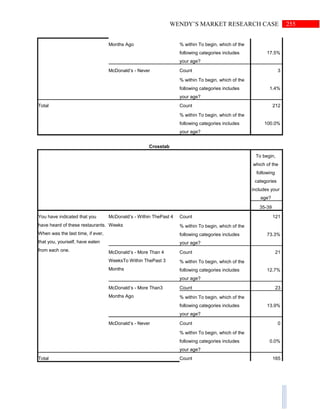
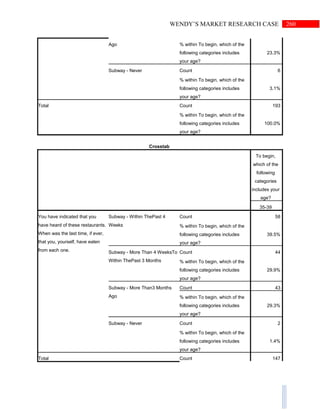
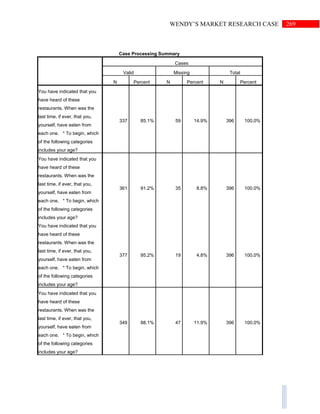
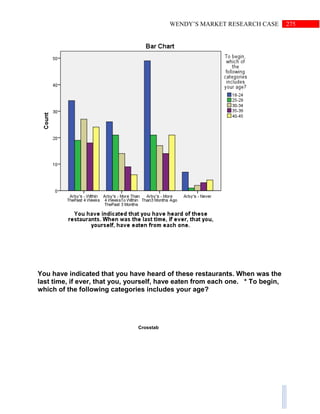
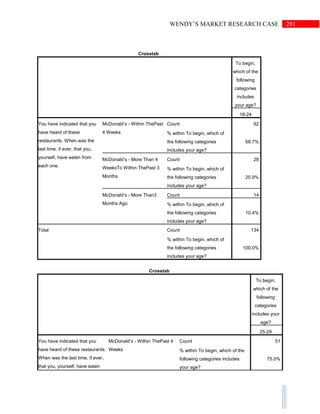
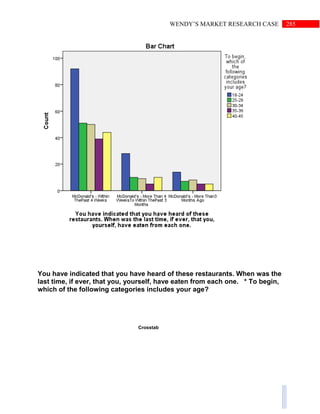
![109WENDY’S MARKET RESEARCH CASE
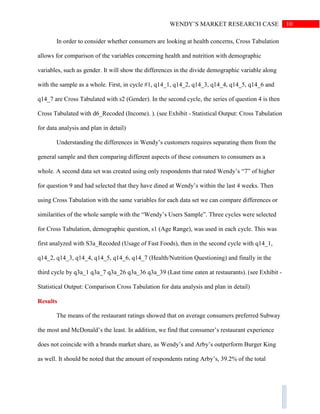
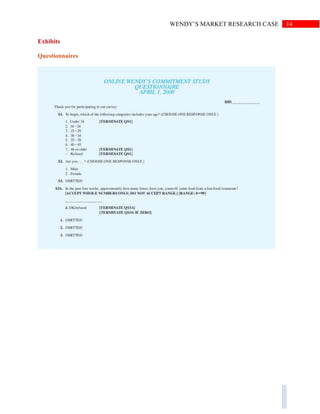
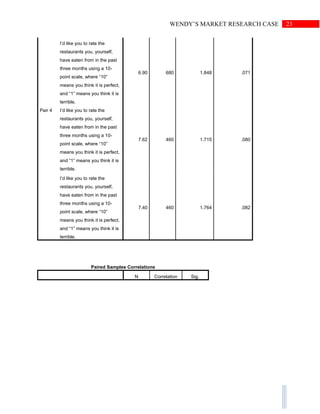
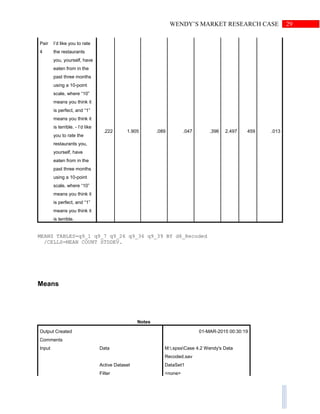
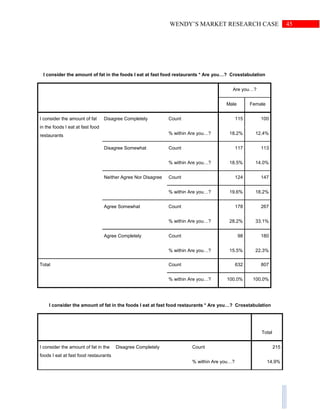
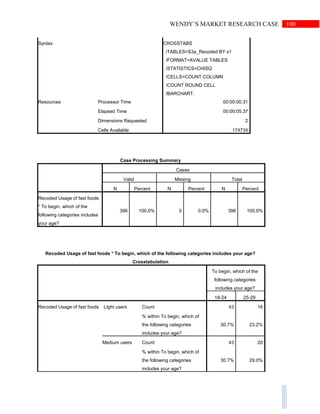
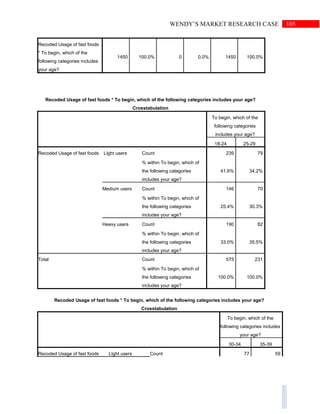
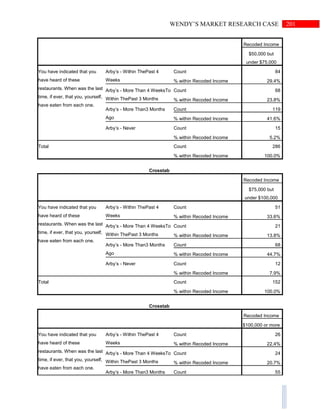
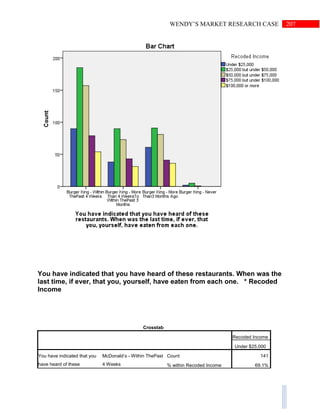
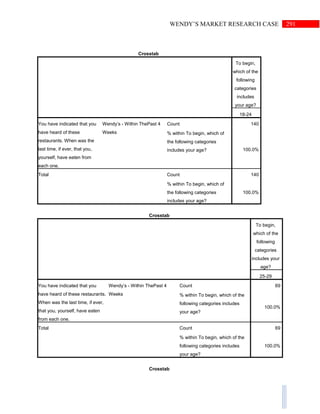
Notes
Output Created 01-MAR-2015 12:51:13
Comments
Input Data M:.spssWendy's Data Prefer
Wendy's.sav
Active Dataset DataSet2
Filter <none>
Weight <none>
Split File <none>
N of Rows in Working Data
File
396
Missing Value Handling Definition of Missing User-defined missing values are treated
as missing.
Cases Used Statistics for each table are based on all
the cases with valid data in the specified
range(s) for all variables in each table.
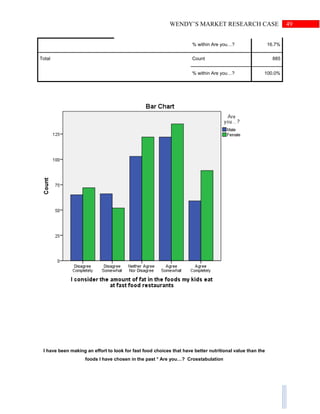
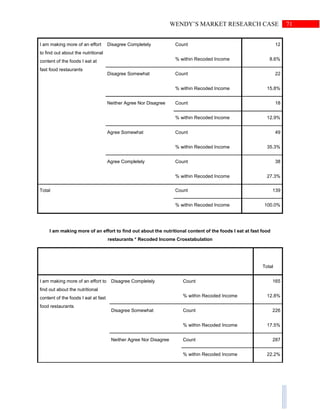
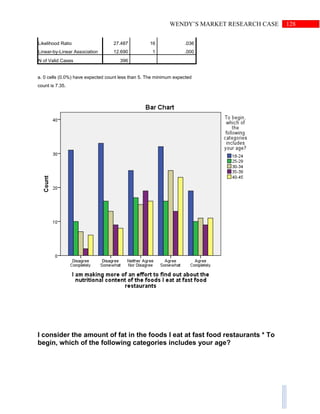
Syntax CROSSTABS
/TABLES=q14_1 q14_2 q14_3 q14_4
q14_5 q14_6 q14_7 BY s1
/FORMAT=AVALUE TABLES
/STATISTICS=CHISQ
/CELLS=COUNT COLUMN
/COUNT ROUND CELL
/BARCHART.
Resources Processor Time 00:00:01.14
Elapsed Time 00:00:01.40
Dimensions Requested 2
Cells Available 174734
[DataSet2] M:.spssWendy's Data Prefer Wendy's.sav
Case Processing Summary
Cases
Valid Missing Total
N Percent N Percent N Percent](https://image.slidesharecdn.com/marketresearch856finalproject-151103221240-lva1-app6892/85/Market-Research-856-Final-Project-110-320.jpg)
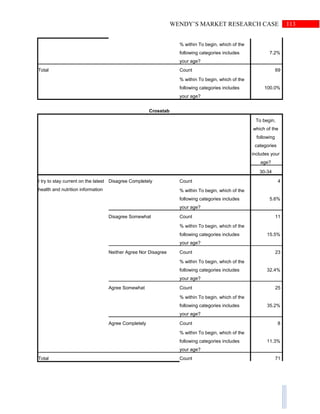


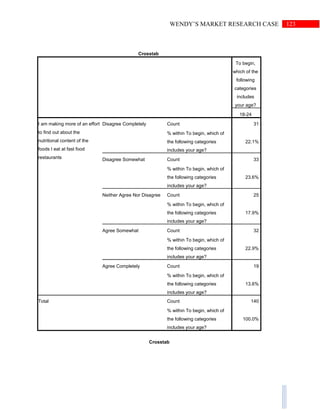


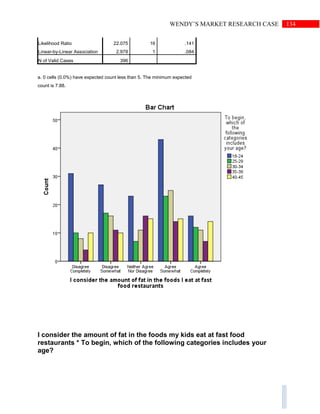

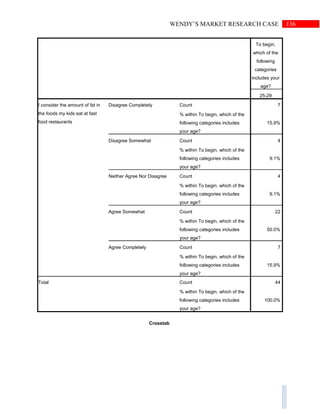


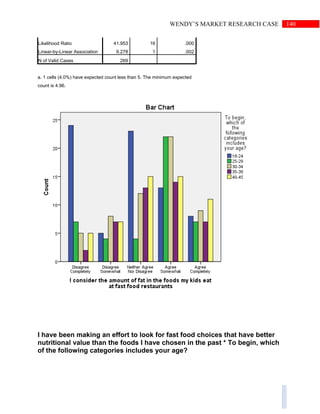


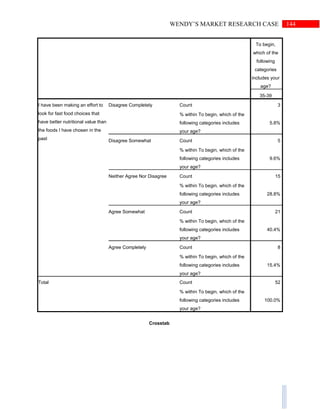


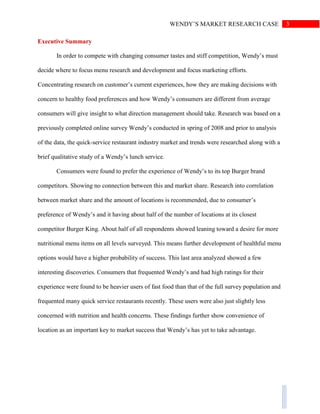
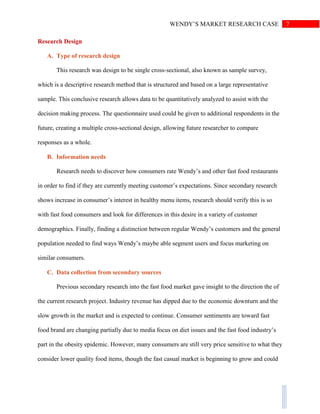
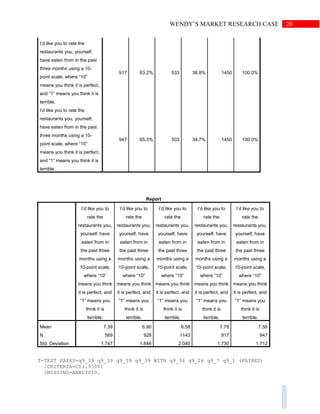
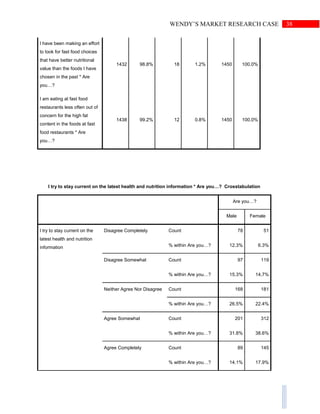
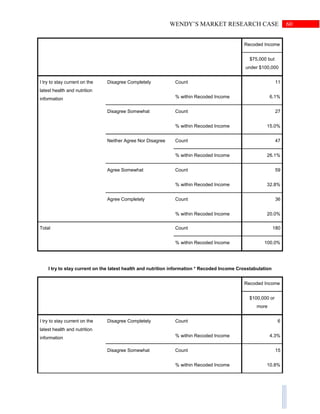
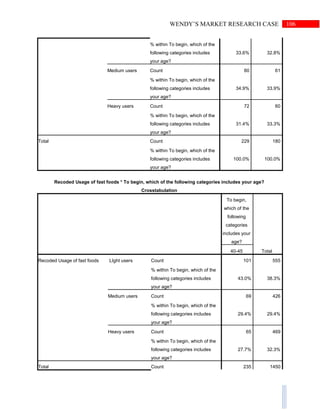
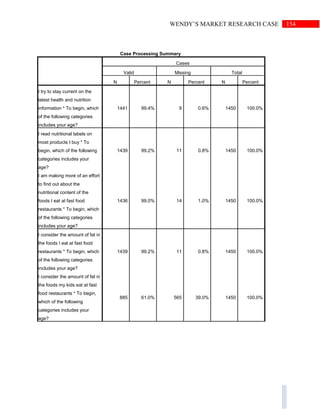
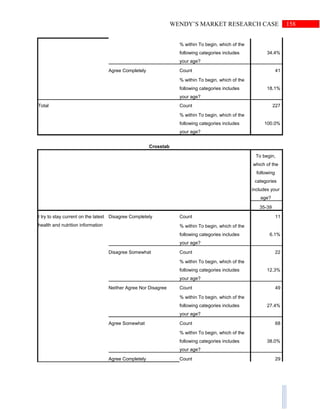
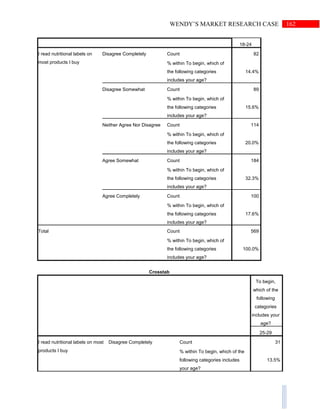
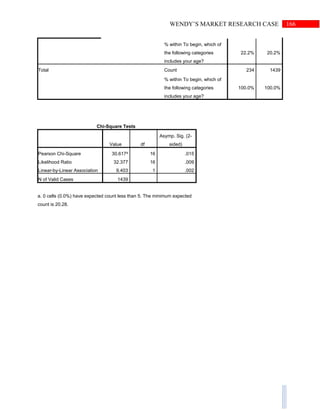
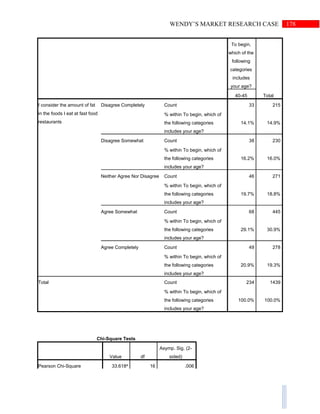
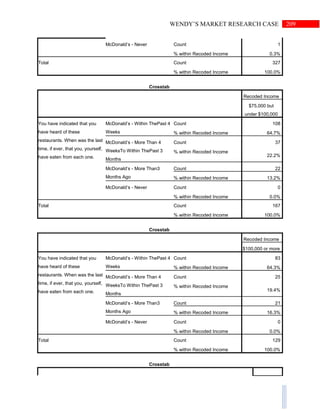
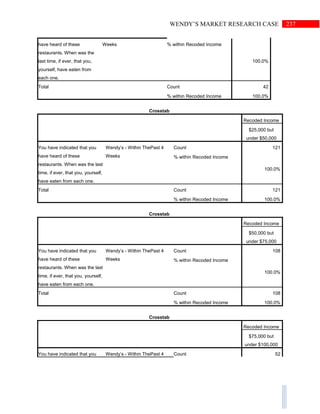
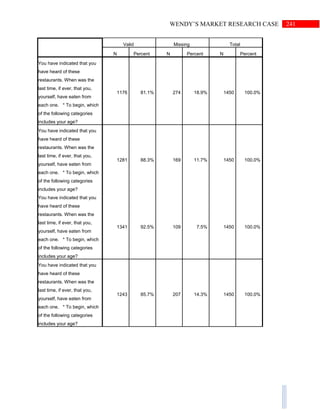
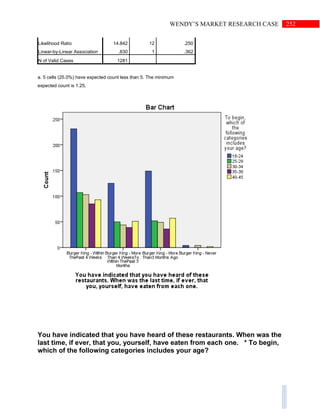
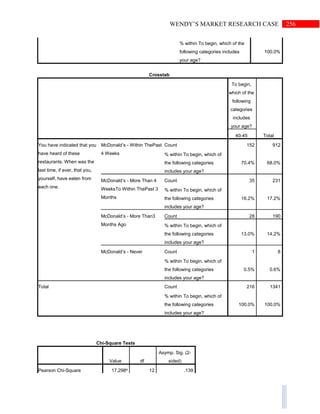
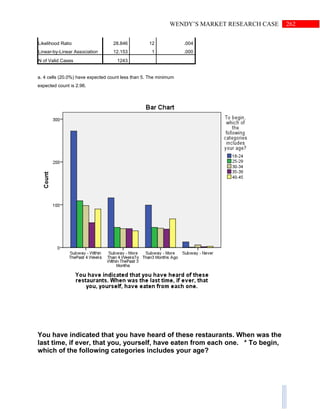
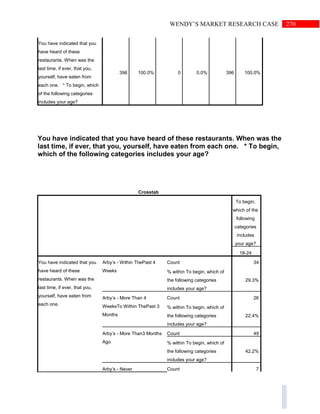
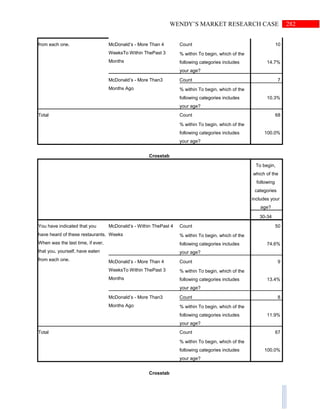
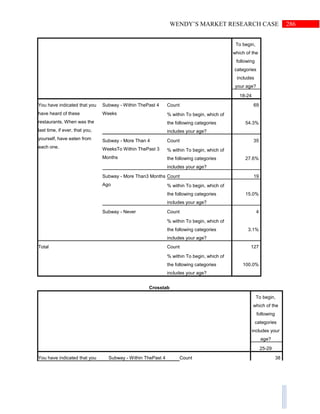
![153WENDY’S MARKET RESEARCH CASE
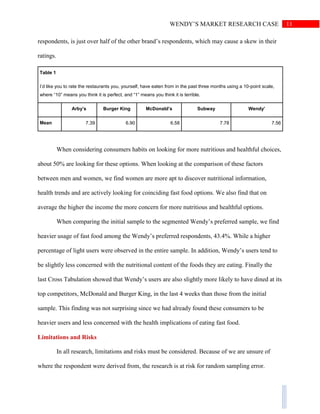
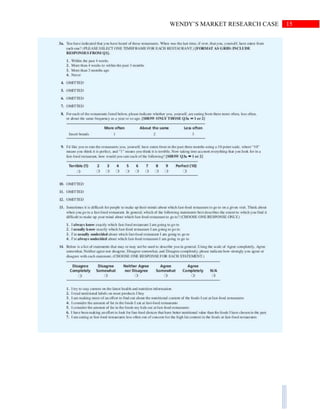
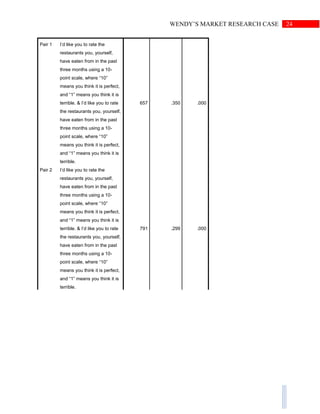
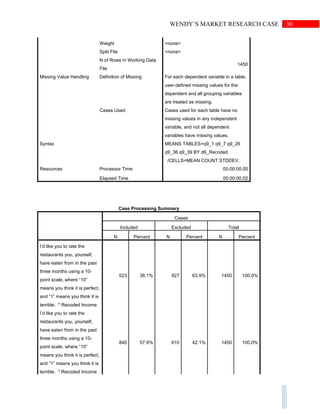
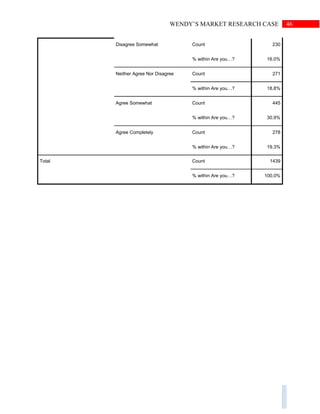
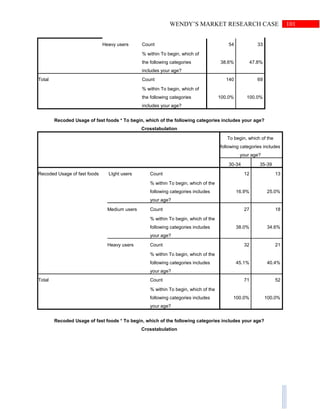
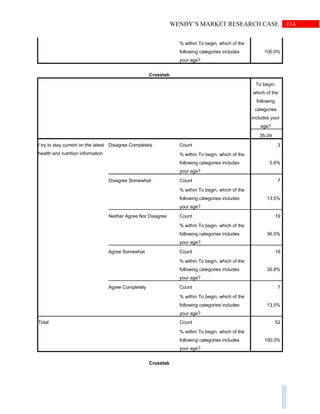
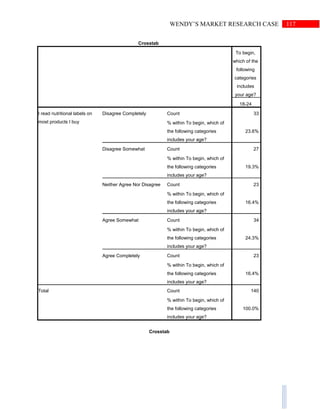
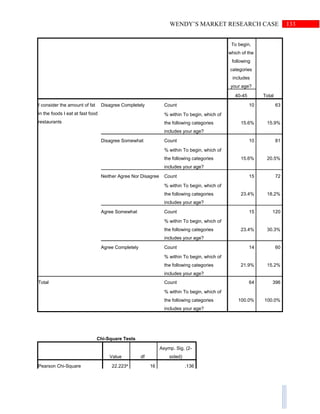
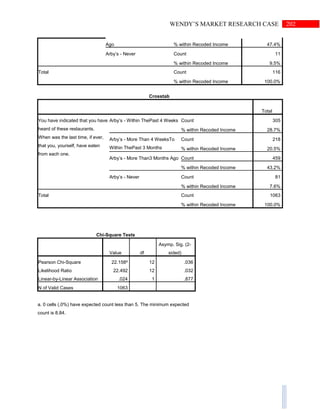
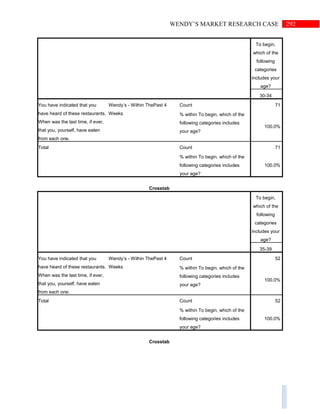
Crosstabs
Notes
Output Created 01-MAR-2015 12:51:37
Comments
Input Data M:.spssCase 4.2 Wendy's Data
Recoded.sav
Active Dataset DataSet1
Filter <none>
Weight <none>
Split File <none>
N of Rows in Working Data
File
1450
Missing Value Handling Definition of Missing User-defined missing values are treated
as missing.
Cases Used Statistics for each table are based on all
the cases with valid data in the specified
range(s) for all variables in each table.
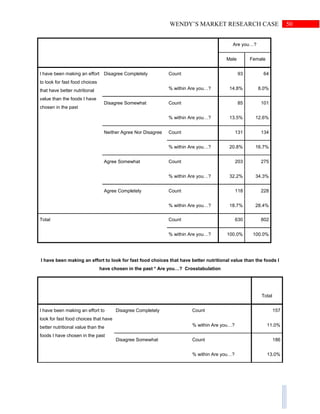
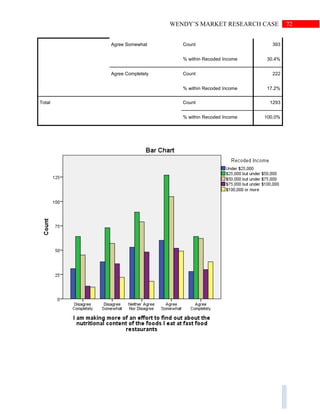
Syntax CROSSTABS
/TABLES=q14_1 q14_2 q14_3 q14_4
q14_5 q14_6 q14_7 BY s1
/FORMAT=AVALUE TABLES
/STATISTICS=CHISQ
/CELLS=COUNT COLUMN
/COUNT ROUND CELL
/BARCHART.
Resources Processor Time 00:00:01.08
Elapsed Time 00:00:01.44
Dimensions Requested 2
Cells Available 174734
[DataSet1] M:.spssCase 4.2 Wendy's Data Recoded.sav](https://image.slidesharecdn.com/marketresearch856finalproject-151103221240-lva1-app6892/85/Market-Research-856-Final-Project-154-320.jpg)


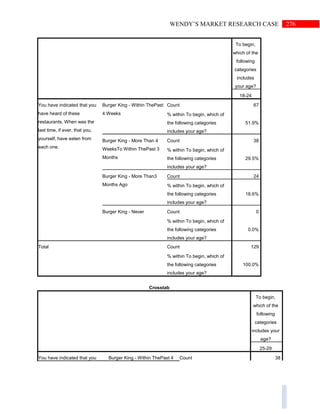
![220WENDY’S MARKET RESEARCH CASE
Notes
Output Created 01-MAR-2015 12:15:53
Comments
Input Data M:.spssWendy's Data Prefer
Wendy's.sav
Active Dataset DataSet2
Filter <none>
Weight <none>
Split File <none>
N of Rows in Working Data
File
396
Missing Value Handling Definition of Missing User-defined missing values are treated
as missing.
Cases Used Statistics for each table are based on all
the cases with valid data in the specified
range(s) for all variables in each table.
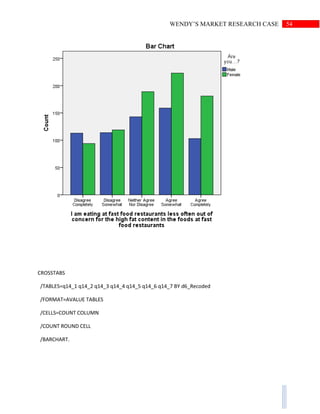
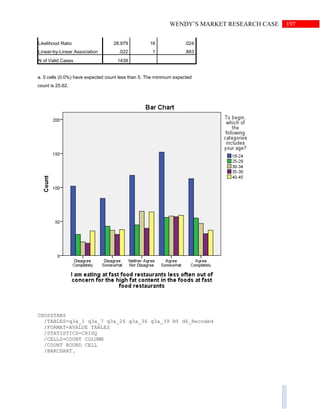
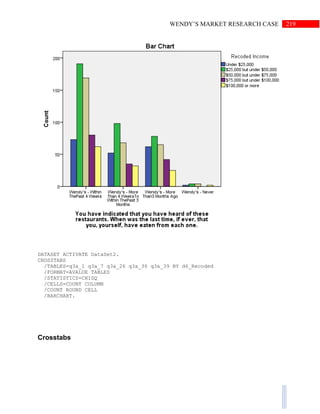
Syntax CROSSTABS
/TABLES=q3a_1 q3a_7 q3a_26
q3a_36 q3a_39 BY d6_Recoded
/FORMAT=AVALUE TABLES
/STATISTICS=CHISQ
/CELLS=COUNT COLUMN
/COUNT ROUND CELL
/BARCHART.
Resources Processor Time 00:00:00.78
Elapsed Time 00:00:05.25
Dimensions Requested 2
Cells Available 174734
[DataSet2] M:.spssWendy's Data Prefer Wendy's.sav
Case Processing Summary
Cases
Valid Missing Total
N Percent N Percent N Percent](https://image.slidesharecdn.com/marketresearch856finalproject-151103221240-lva1-app6892/85/Market-Research-856-Final-Project-221-320.jpg)


![268WENDY’S MARKET RESEARCH CASE
Crosstabs
Notes
Output Created 01-MAR-2015 12:25:55
Comments
Input Data M:.spssWendy's Data Prefer
Wendy's.sav
Active Dataset DataSet2
Filter <none>
Weight <none>
Split File <none>
N of Rows in Working Data
File
396
Missing Value Handling Definition of Missing User-defined missing values are treated
as missing.
Cases Used Statistics for each table are based on all
the cases with valid data in the specified
range(s) for all variables in each table.
Syntax CROSSTABS
/TABLES=q3a_1 q3a_7 q3a_26
q3a_36 q3a_39 BY s1
/FORMAT=AVALUE TABLES
/STATISTICS=CHISQ
/CELLS=COUNT COLUMN
/COUNT ROUND CELL
/BARCHART.
Resources Processor Time 00:00:00.73
Elapsed Time 00:00:00.89
Dimensions Requested 2
Cells Available 174734
[DataSet2] M:.spssWendy's Data Prefer Wendy's.sav](https://image.slidesharecdn.com/marketresearch856finalproject-151103221240-lva1-app6892/85/Market-Research-856-Final-Project-269-320.jpg)


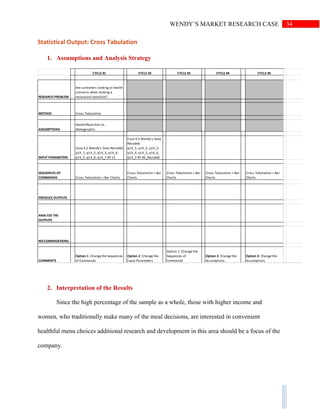
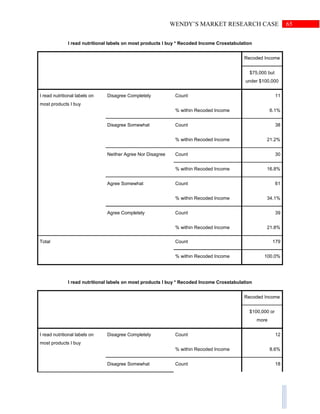
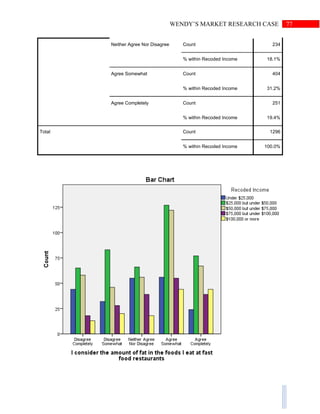
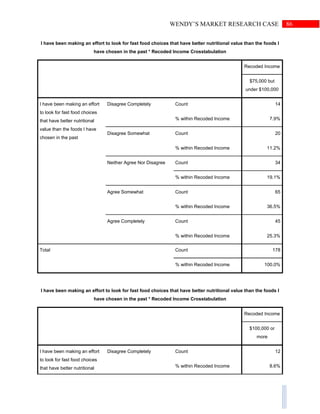
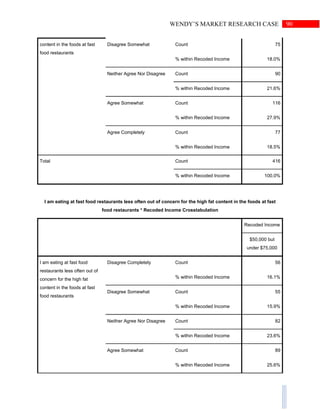
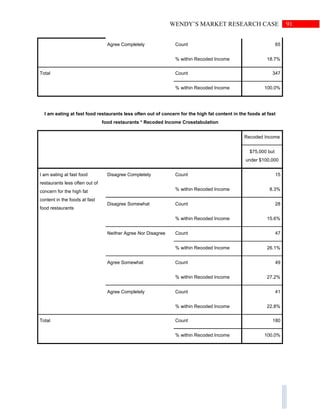
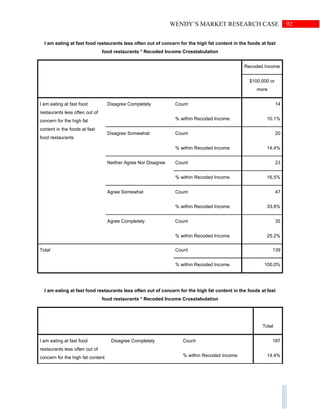
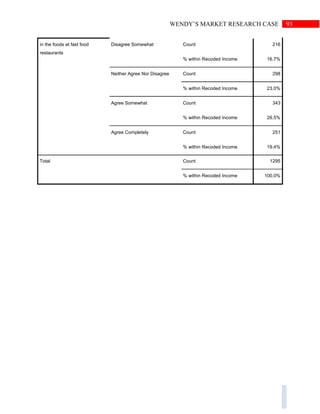
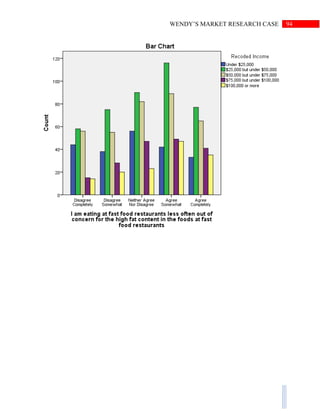
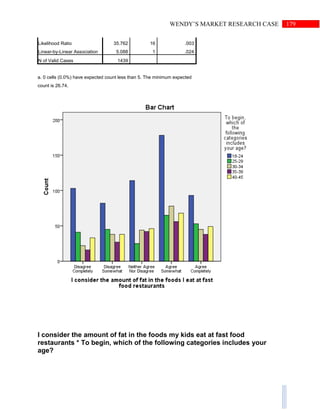
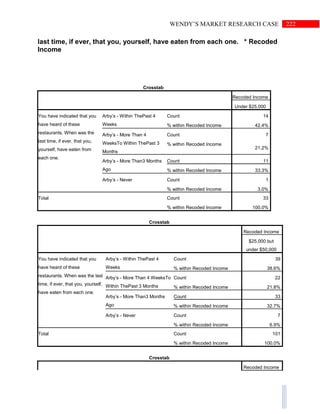
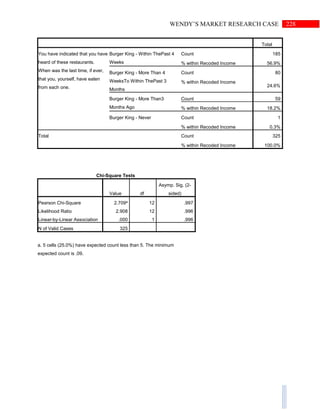
This document outlines a market research case study for Wendy's. It defines the problem as needing to determine how to focus research and marketing efforts given changing consumer tastes and competition. The approach involves analyzing existing Wendy's survey data to see how customers rate their experience versus competitors, whether they consider health when choosing restaurants, and how Wendy's consumers compare to all consumers in terms of visit frequency and preferences. The research design is a cross-sectional survey analysis using both secondary data and primary data collection to address these questions and guide Wendy's strategy.


