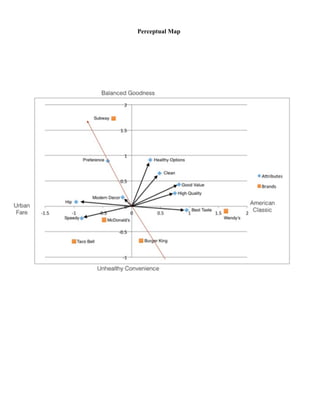
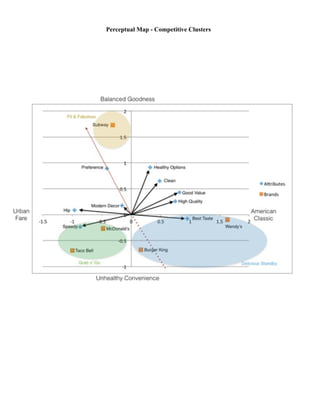
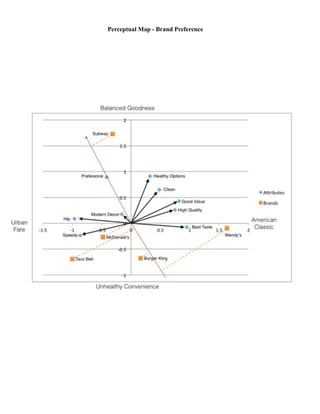
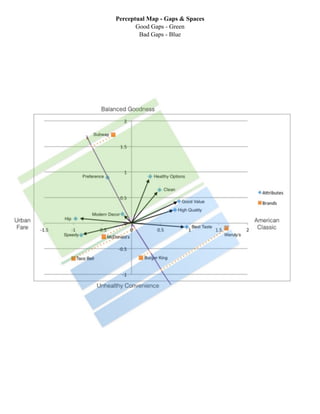
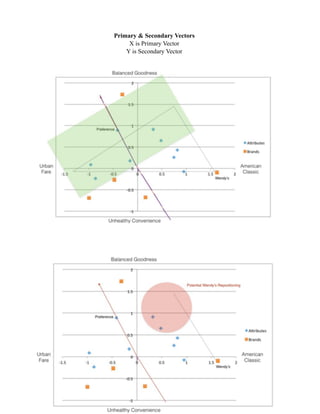
How to Leverage Behavioral Science Insights for Direct Mail Success
T. grossheim perceptual mapping
1.
Repositioning of Wendy’s
Teri Grossheim
September 24, 2014
MKT 534 – Fall 2014
Analytical Tools of Marketers
2.
Executive Summary
This report provides information regarding perceptual mapping techniques and
their application to five brands in the fast food industry, with a focus on the repositioning
of Wendy’s. Wendy’s marketing personnel requested these services from TG Consulting,
as a result of poor sales performance in Q2 FY14. TG Consulting uses qualitative data,
surveying, and proven analytical methodologies make assumptions and suggestions
throughout this report. As a result of four focus groups, the five brands chosen for this
report are McDonalds, Taco Bell, Wendy’s, Subway, and Burger King. This is likely due
to brand familiarity in the marketplace, various similarities to the client, and competitive
state of the industry.
Perceptual mapping has been chosen for this report since it is a data-driven
consumer insight tool that shows the positioning of a chosen brand versus relevant
competitors’ brands. The perceptual mapping techniques have brought out noticeable
trends among the five fast food brands. Perhaps the most noticeable perceptions among
the brands were they range from balanced goodness to unhealthy convenience. Both
these perceptions carry certain attributes that support these descriptions, which will be
further explained and analyzed using two main differentiating dimensions (X and Y).
Perceptual Mapping Methodology
TG Consulting leveraged perceptual mapping for this study, since it is a proven
analytical tool for conducting perceived brand analysis in a given industry. The first step
of a perceptual mapping study is to identify segment relevant brands and attributes. TG
Consulting conducted this part of the study during June 2014, where four focus groups
were used to determine the five brands included in this study. The next step was
collecting perceptions data by developing and fielding a large-sample survey, which was
conducted during July and August 2014. This provided quantitative data, which supports
assumptions, insights, and suggestions included throughout this report. The third step
involved analyzing the survey results, which included factor analysis. The mechanics of
factor analysis include averaging each attribute and brand value that resulted from the
survey and standardizing the averaged data, which allows for data reduction without any
significant loss of information. This methodology finds underlying patterns and
interrelationships among attributes. This is important because this is the basis where
correlated attributes have an underlying factor that represent all without significant
information loss. Lastly, perceptual maps were created to obtain a brand “reality check”,
which serves as a foundation for assumptions and suggestions throughout this report.
Current State
A survey was given to approximately 1500 fast food consumers during July and
August 2014, where the participants rated the five brands on nine attributes1
using an odd
numbered Likert scale ranging from strongly disagree (1) to strongly agree (7).
Preference, which also was one of the attributes used in the survey, is an important focal
1
Appendix: Rotated Component Matrix
3.
point of this analysis. According to the perceptual map2
that resulted from the survey, the
five brands were rated regarding preference as follows:
1. Subway
2. McDonalds
3. Taco Bell
4. Burger King
5. Wendy’s
The positioning of these brands hinge from dimensions in consumer perceptions. In
addition to balanced goodness and unhealthy convenience (Y dimension), the perceptions
of these brands also range from urban fare to American classic (X dimension)3
. The
perceptual map demonstrates that Subway can be associated with balanced goodness,
Burger King and Taco Bell with unhealthy convenience, Wendy’s with American classic,
and McDonald’s with urban fare. These phrases are based on attributes and how they fall
on the perceptual map. The dimensions of the perceptual map, as well as brand and
attribute positions, are valid based on the data collected and analyzed from survey results4
.
According to TG Consulting’s quantitative analysis5
, which resulted from
surveying fast food consumers, Wendy’s ranks lowest in preference (2.67) out of all five
brands. While Wendy’s does rank lowest in preference and hip (2.67), it does rank
highest in best taste (5.67), high quality (4.00), and good value (5.33). Another attribute
where Wendy’s scores highly is healthy options (5.33). Moreover, Wendy’s score varies
regarding other attributes such as speedy (5.00), modern décor (3.00), and clean (4.33).
While Wendy’s score low in preference, the brand does score highly in other important
attributes. Data analysis techniques6
further support this assessment, which demonstrates
the validity of attribute and brand positioning discussed throughout this report.
The brands can also be associated with competitive groups based on their correlation
to certain attributes. In perceptual mapping, this is known as clusters. According the
cluster perceptual map7
, there are three groups that the five brands fall into:
• Fit N’ Fabulous
• Grab N’ Go
• Delicious Standby
The analysis shows Subway falls into Fit N’ Fabulous, McDonalds and Taco Bell fall
into Grab N’ Go, Wendy’s and Burger King into Delicious Standby. While these groups
provide an overview of the five brands, more detail should be considered regarding
insights to assist Wendy’s marketing personnel with decision making involving their
brand. The competitive environment where Wendy’s operates should be evaluated and
considered by marketing personnel. Wendy’s closest competitor is Burger King, which is
2
Appendix: Perceptual Map – Brand Preference
3
Appendix: Perceptual Map
4
Appendix: SPSS Output & Total Variance Explained
5
Appendix: SPSS Output & Total Variance Explained
6
Appendix: Total Variance Explained
7
Appendix: Perceptual Map - Competitive Clusters
4.
also considered a Delicious Standby8
. Subway, McDonalds, and Taco Bell are currently
considered distant competition, but would need to be reevaluated if Wendy’s chooses to
reposition its brand. There are areas where Wendy’s can consider repositioning if
marketing personnel chose to act on the findings of this report.
Repositioning of Wendy’s
There are a few indications that suggest Wendy’s should consider repositioning
their brand. As stated, Wendy’s scored low in preference but highly in other attributes.
Moreover, the gaps and spaces apparent in the perceptual map9
demonstrate there are
areas Wendy’s can consider moving into, which could help increase sales performance.
TG Consulting makes these suggestions based on data and insights that resulted from the
study. Wendy’s marketing personnel must exercise judgment regarding budget and other
marketing considerations prior to making decisions based on this study.
The perceptual map shows there is a large space available where Wendy’s could
reposition itself in a more favorable preference position, or good gaps10
(highlighted in
green), utilizing what is known in perceptual mapping as primary and second vectors.
Wendy’s could easily continue leveraging attributes where they rank highly such as good
value, healthy options, and best taste. If Wendy’s chooses to strengthen their position by
moving towards speedy, modern décor, and hip, this could result in substantially more
effort on various levels. For Wendy’s to be perceived as more hip, this could mean
changes in marketing and could be planned for in upcoming budget and marketing
planning. However, to be perceived as speedy could involve some operational changes,
which might have cost and logistic implications that might be more difficult to alter in the
near term. Another example would be for improvements in modern décor, which means
an increase in renovations and real estate costs. TG Consulting would suggest moving
away from bad gaps11
(highlighted in blue), since they indicate poor preferences as a
result of the study.
According the perceptual map12
, the repositioning suggestion for Wendy’s does
not have any brands or clusters located in the chosen quadrant, which has implications
regarding competition, potential effort by Wendy’s marketing, and potential increase in
sales as a result of the position change. In theory, the suggested repositioning is feasible
based on Wendy’s current position in the study. Since there are no existing brands in the
suggested quadrant, Wendy’s could potentially have little to no competition, which
would have positive implications regarding sales. Moreover, the suggested repositioning
would allow Wendy’s to leverage existing attribute strengths such as good value, healthy
options, and best taste. Wendy’s would not have to make huge changes in this respect,
but can proceed with current marketing or create methods to accelerate the perception of
these attributes. For example, Wendy’s can continue to capitalize on being an American
Classic with healthy options and roll out changes to their menu that emphasize salads,
vegetarian options, and low fat/carb choices. Slight improvements related to the best taste
8
Appendix: Perceptual Map – Competitive Clusters
9
Appendix: Perceptual Map – Gaps & Spaces
10
Appendix: Perceptual Map – Primary/Secondary Vectors
11
Appendix: Perceptual Map – Gaps & Spaces
12
Appendix: Perceptual Map – Primary/Secondary Vectors
5.
attribute imply evaluating menu and food ingredient quality. Another example could
include a dollar menu or daily specials to build upon good value, if these items are not
already in place. A more substantial change could entail Wendy’s moving away from
being known as an American Classic to Balanced Goodness, where significant changes
would likely need to be made in marketing, food ingredients/menu, and operations. In all,
Wendy’s key stakeholders should evaluate these suggestions prior to taking action.
Wendy’s might also consider its position with Subway, which in this study is the
aspirational brand. Subway ranks highest in preference (6.33), clean(liness) (5.00), and
healthy options (6.67). In addition it ranks highly in hip (4.00), good value (5.00) and
modern décor (3.33). In perceptual mapping, aspirational brands are typically the most
desirable brand within a study. Even though Subway was found to be the aspirational fast
food brand in this study, Wendy’s should carefully evaluate its current position, potential
repositioning, and whether Subway’s status as an aspirational brand is worthy of
consideration during decision making. Wendy’s is currently aligned with perceived in
budget brands such as Burger King, Taco Bell, and McDonalds.
Conclusion
This study shows the dynamics of the fast food industry as it relates to the five
brands and provides great detail regarding Wendy’s current and potential repositioning. It
should be noted that even though perceptual mapping is a proven analytical tool, there are
some weaknesses that should be considered prior to making decisions based on the
presented data and suggestions. First of all, perceptual mapping is a “snapshot” of trends
and preferences at one point of time. If Wendy’s marketing personnel would prefer
ongoing studies or measure preference over a period of time, it might be wise to evaluate
a tool that works well for these situations. In addition, it’s been mentioned throughout
this report that perceptual mapping utilizes averages and factor analysis for quantitative
data. As a result, perceptual mapping can be less accurate than other marketing tools.
Moreover, if Wendy’s marketing personnel plans to leverage this data outside the
marketing realm, for instance in proposals to finance or operational executives,
perceptual mapping can often fall on deaf ears when presented to professionals outside of
marketing. Lastly, many assumptions and suggestions have been outlined in this report
and even though they are supported by quantitative data, Wendy’s marketing personnel
should evaluate the cost and time necessary to implement any changes.