Download to read offline
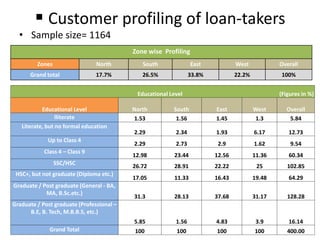
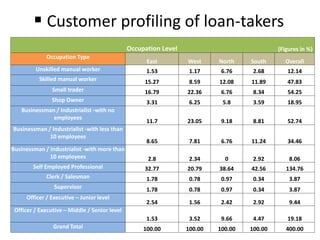
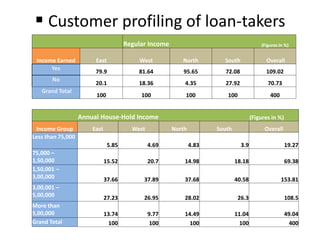
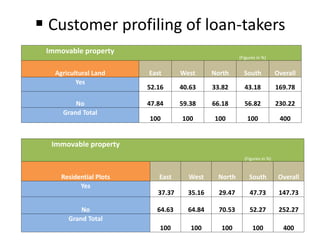
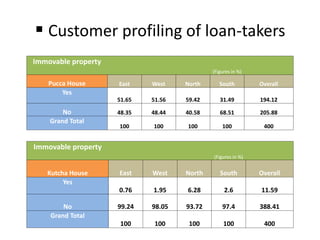
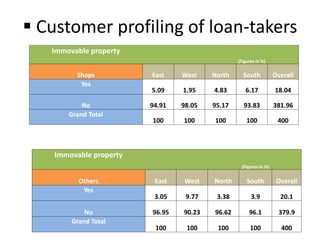
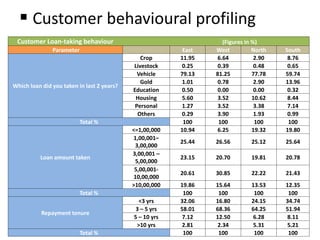
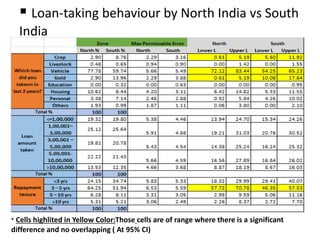
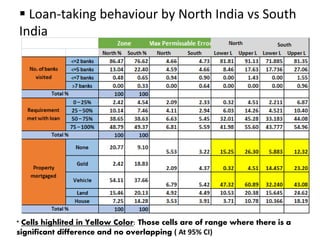
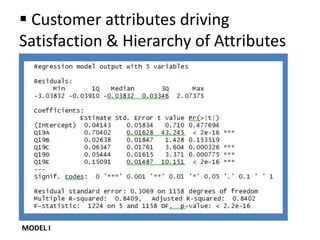
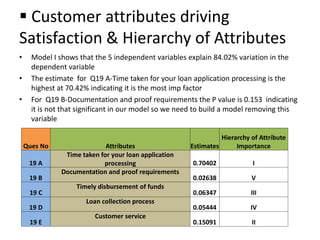
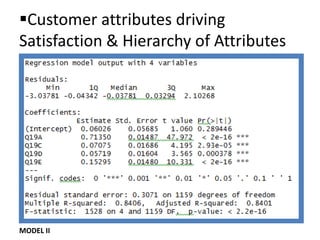
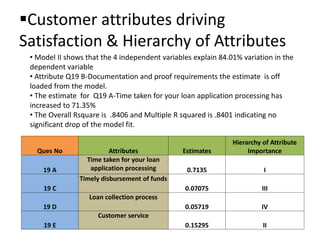
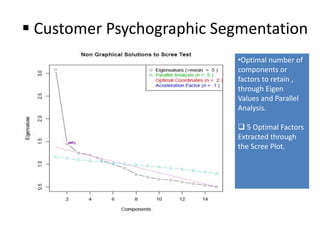
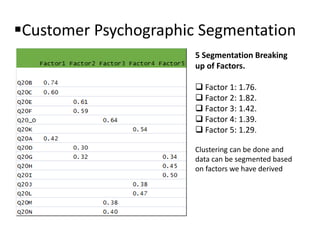
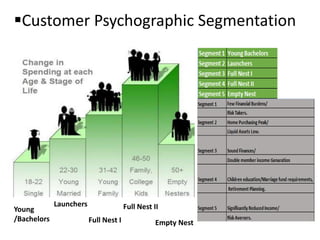
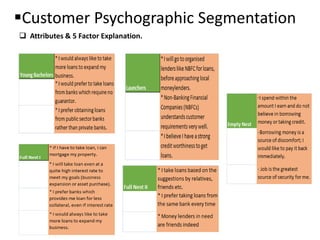


The document outlines a market research report on loan-takers conducted by a team, detailing customer profiling based on demographic and behavioral factors across different regions. It includes data on education, occupation, regular income, household income, and properties owned, as well as insights into loan-taking behavior. Additionally, it analyzes customer satisfaction attributes and psychographic segmentation, employing statistical models to evaluate the factors influencing customer experience in loan applications.


![[DSC Europe 25] Josip Saban - Career building for data professionals.pptx](https://cdn.slidesharecdn.com/ss_thumbnails/zroflcttkm1vmli0txea-josip-saban-career-building-for-data-professionals-260123083019-587cdb8c-thumbnail.jpg?width=640&height=640&fit=bounds)


