Download as PDF, PPTX

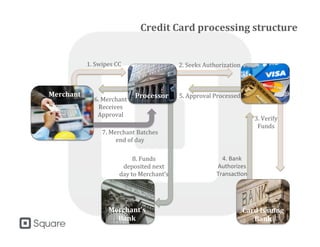
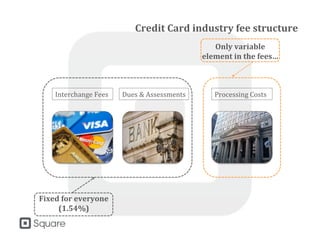
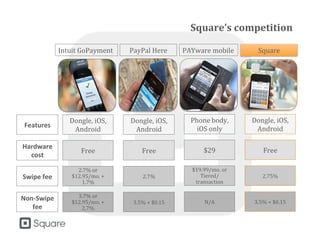
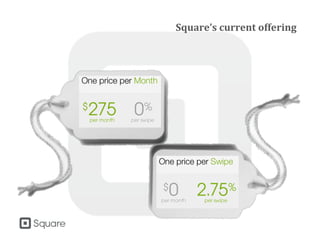
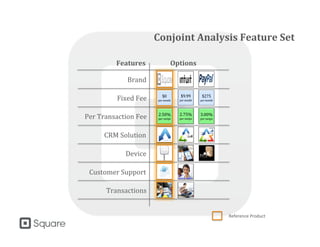
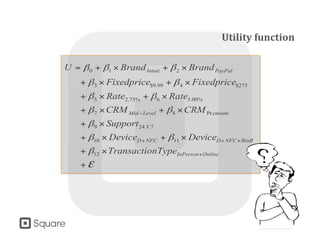
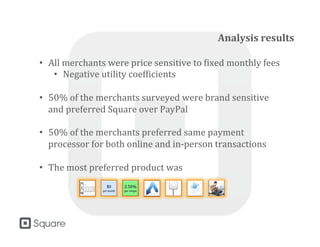
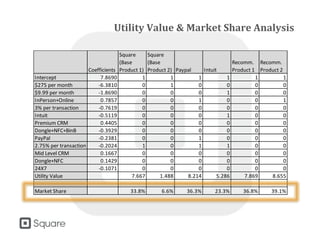
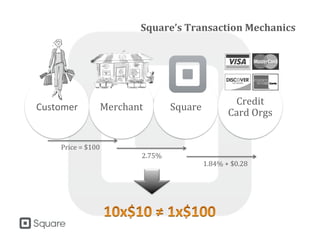
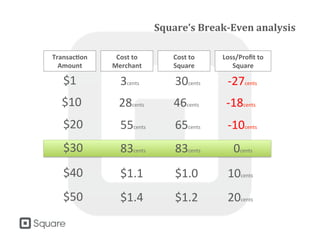
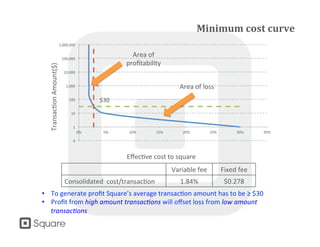
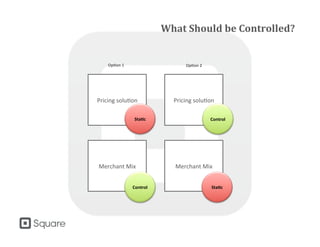
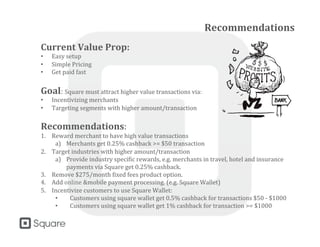
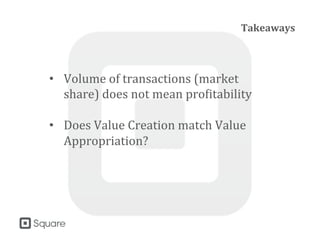


The document outlines the credit card processing structure and fee system used by Square, detailing how transactions are processed and the competition within the market. It analyzes merchant preferences and behavior through surveys and regression analysis, identifying significant factors influencing their payment processor choice, primarily price sensitivity and brand preference. Recommendations are made for Square to improve profitability by incentivizing higher transaction values and removing fixed fees.


