Mapping Uncounted Anthropogenic Fill Flows: Environmental Impact and Mitigation
1.
景観生態学(第1回)
2024 AAG Honolulu
MappingUncounted Anthropogenic Fill Flows:
Environmental Impact and Mitigation
Yuji HARA and Yuki SAMPEI
Wakayama University (Japan)
hara@wakayama-u.ac.jp
future-landscape.com
1/23
2.
景観生態学(第1回)
2024 AAG Honolulu
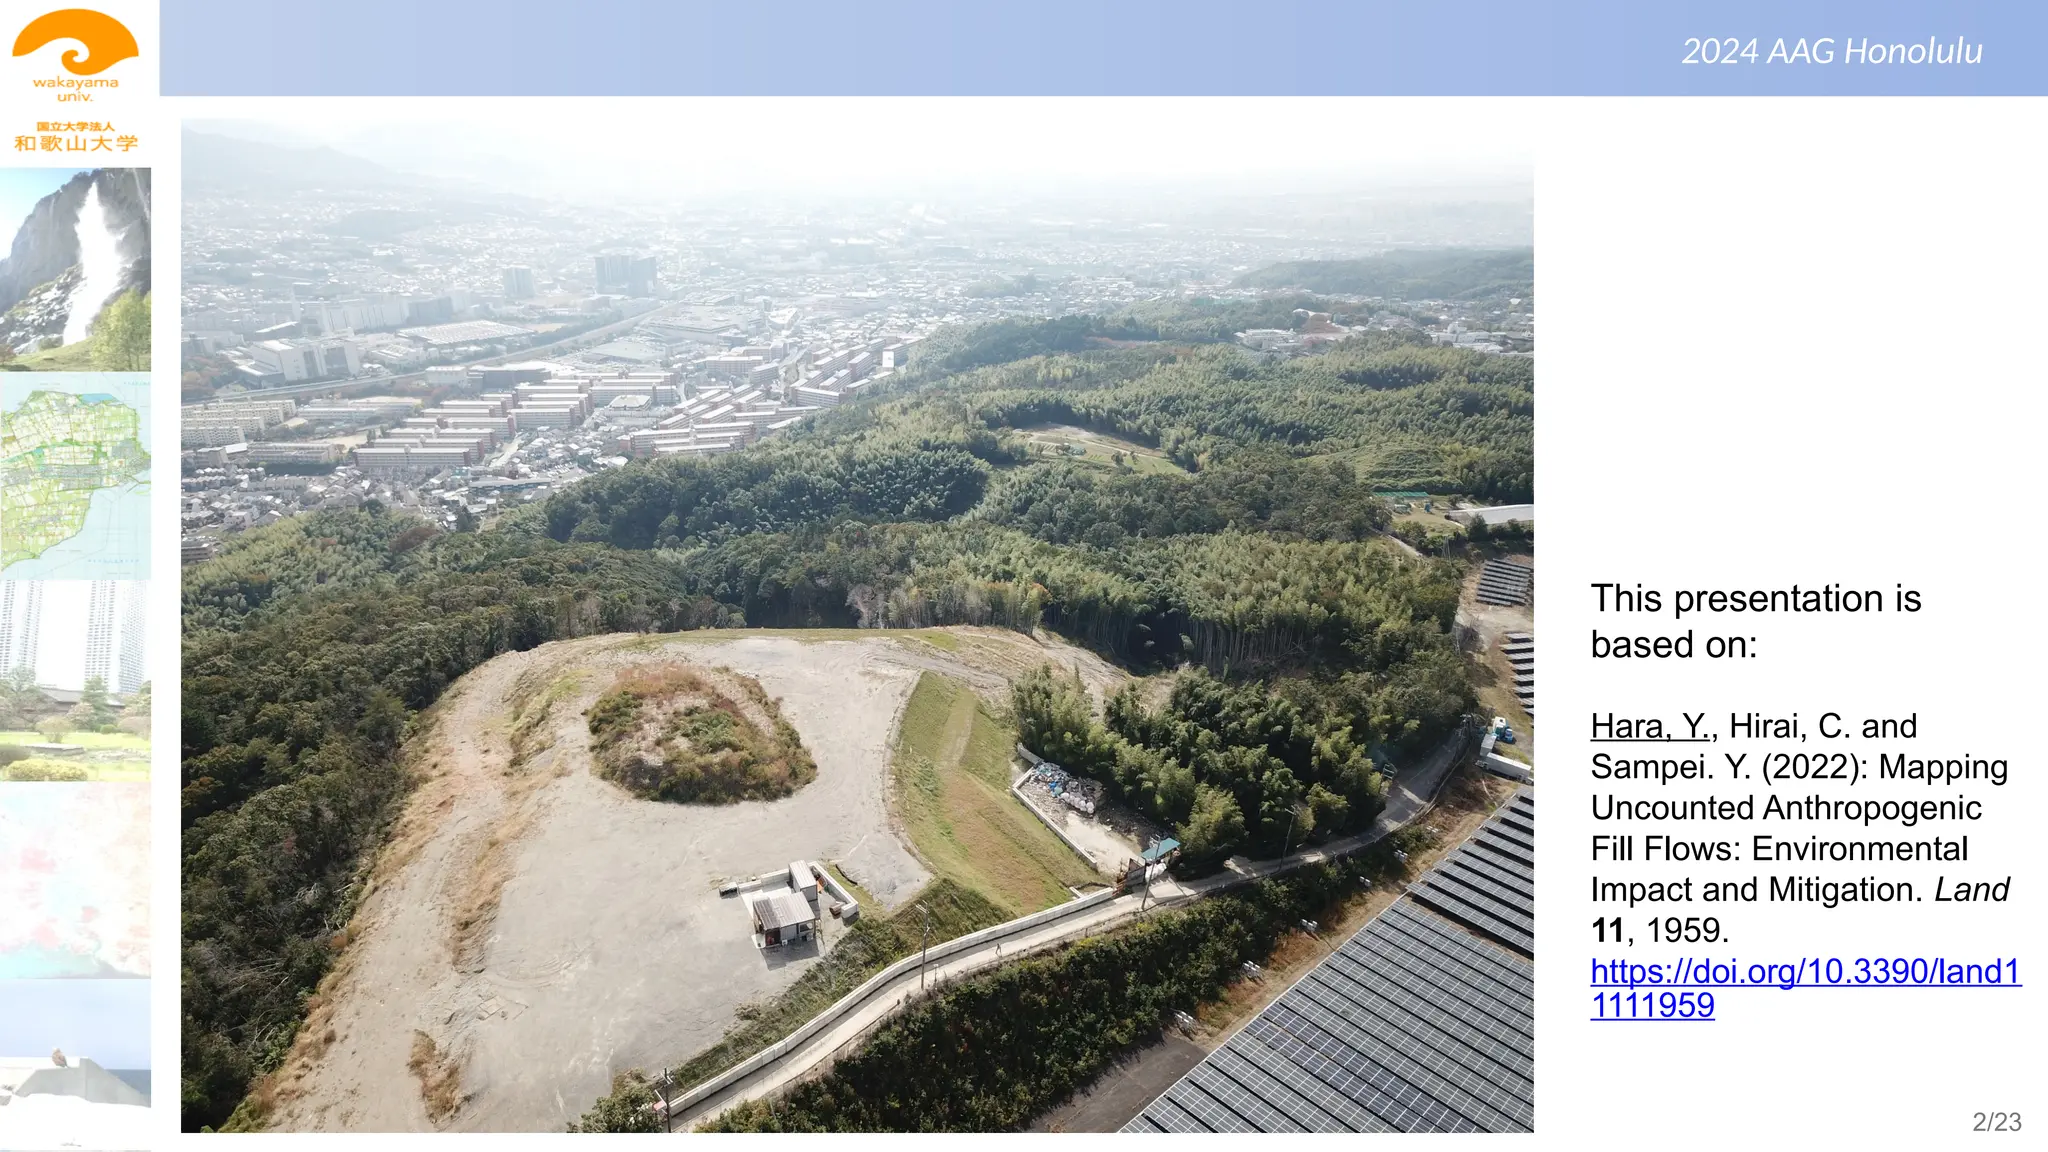
Thispresentation is
based on:
Hara, Y., Hirai, C. and
Sampei. Y. (2022): Mapping
Uncounted Anthropogenic
Fill Flows: Environmental
Impact and Mitigation. Land
11, 1959.
https://doi.org/10.3390/land1
1111959
2/23
景観生態学(第1回)
2024 AAG Honolulu
ResearchBackgrounds
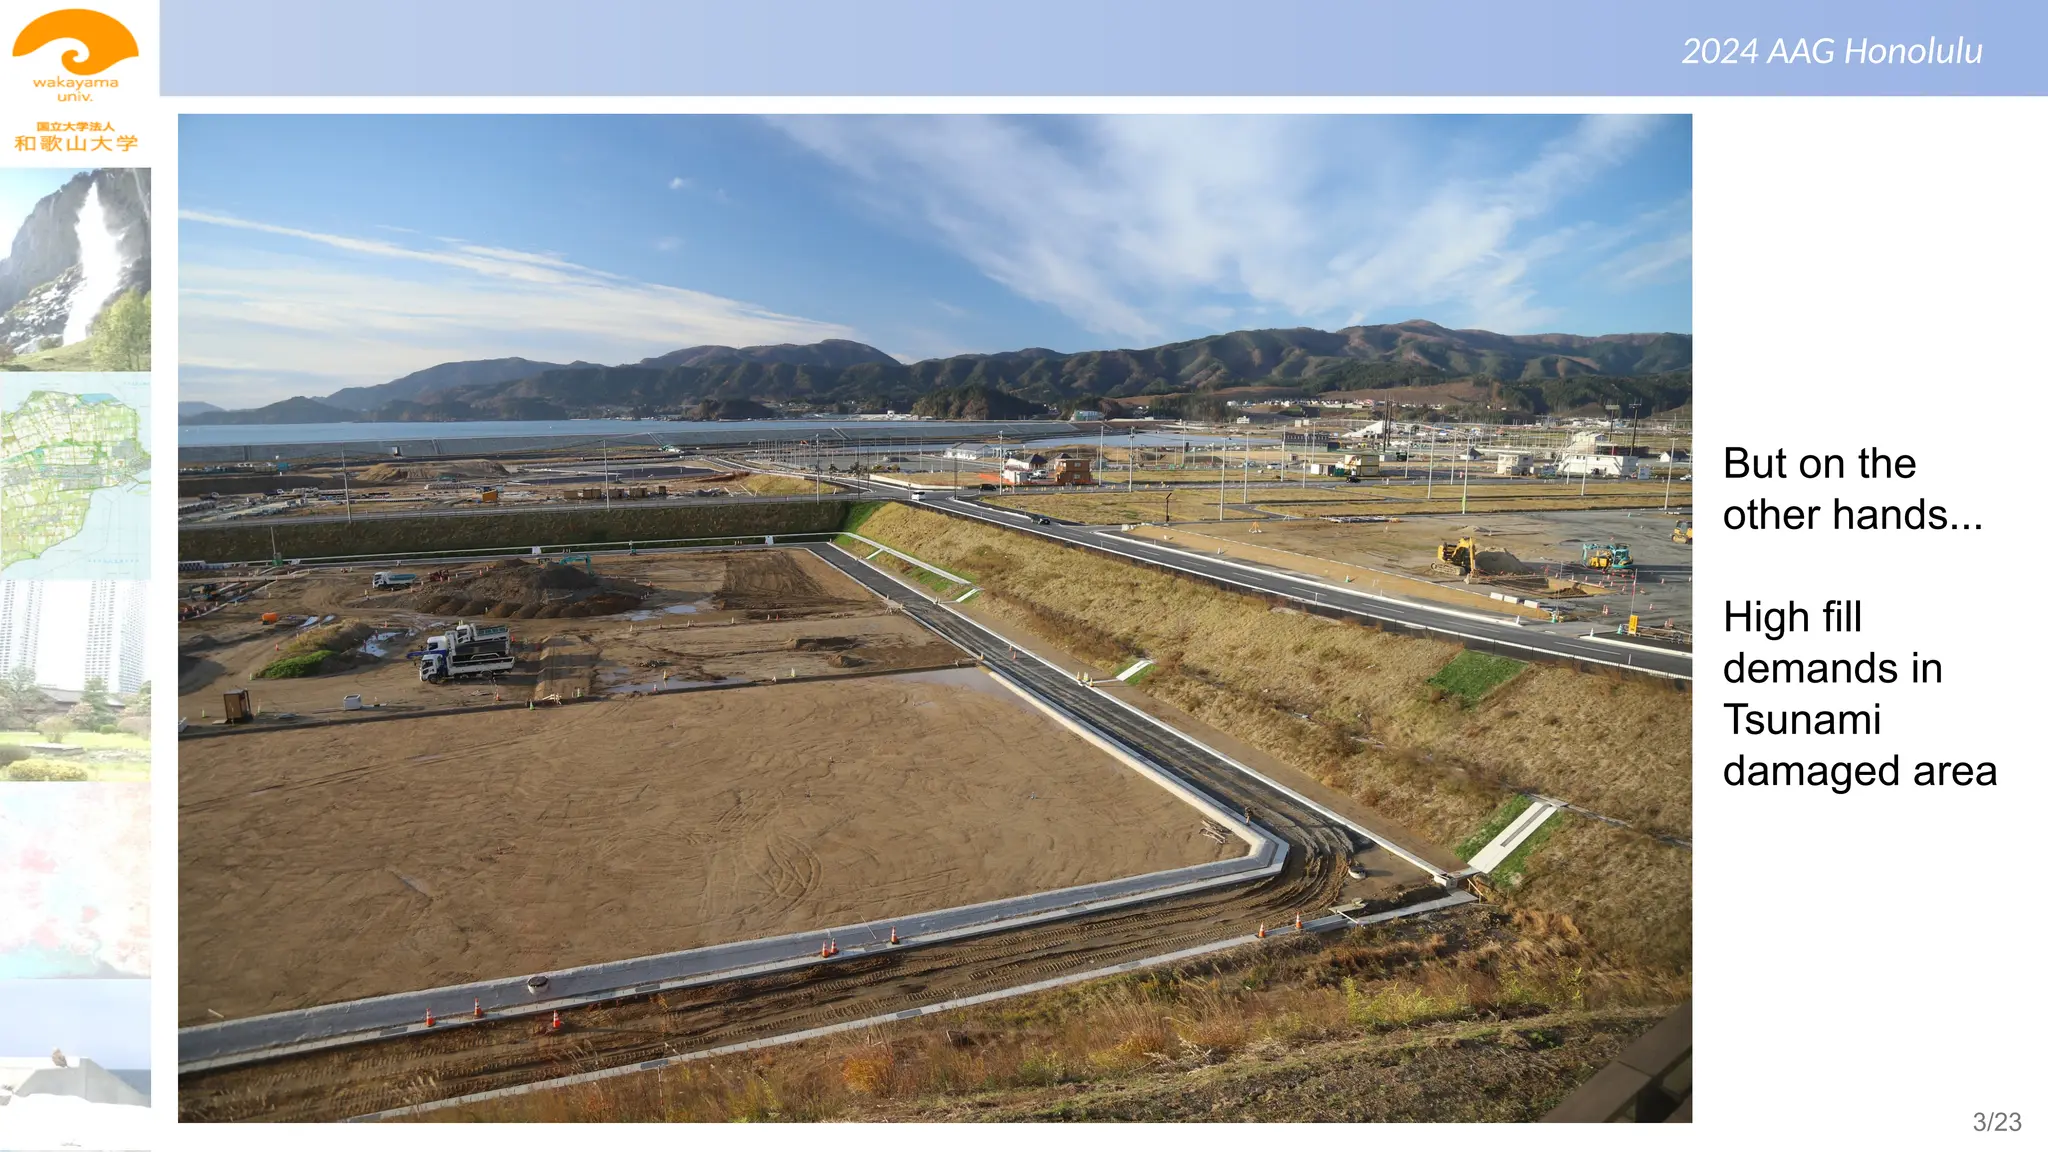
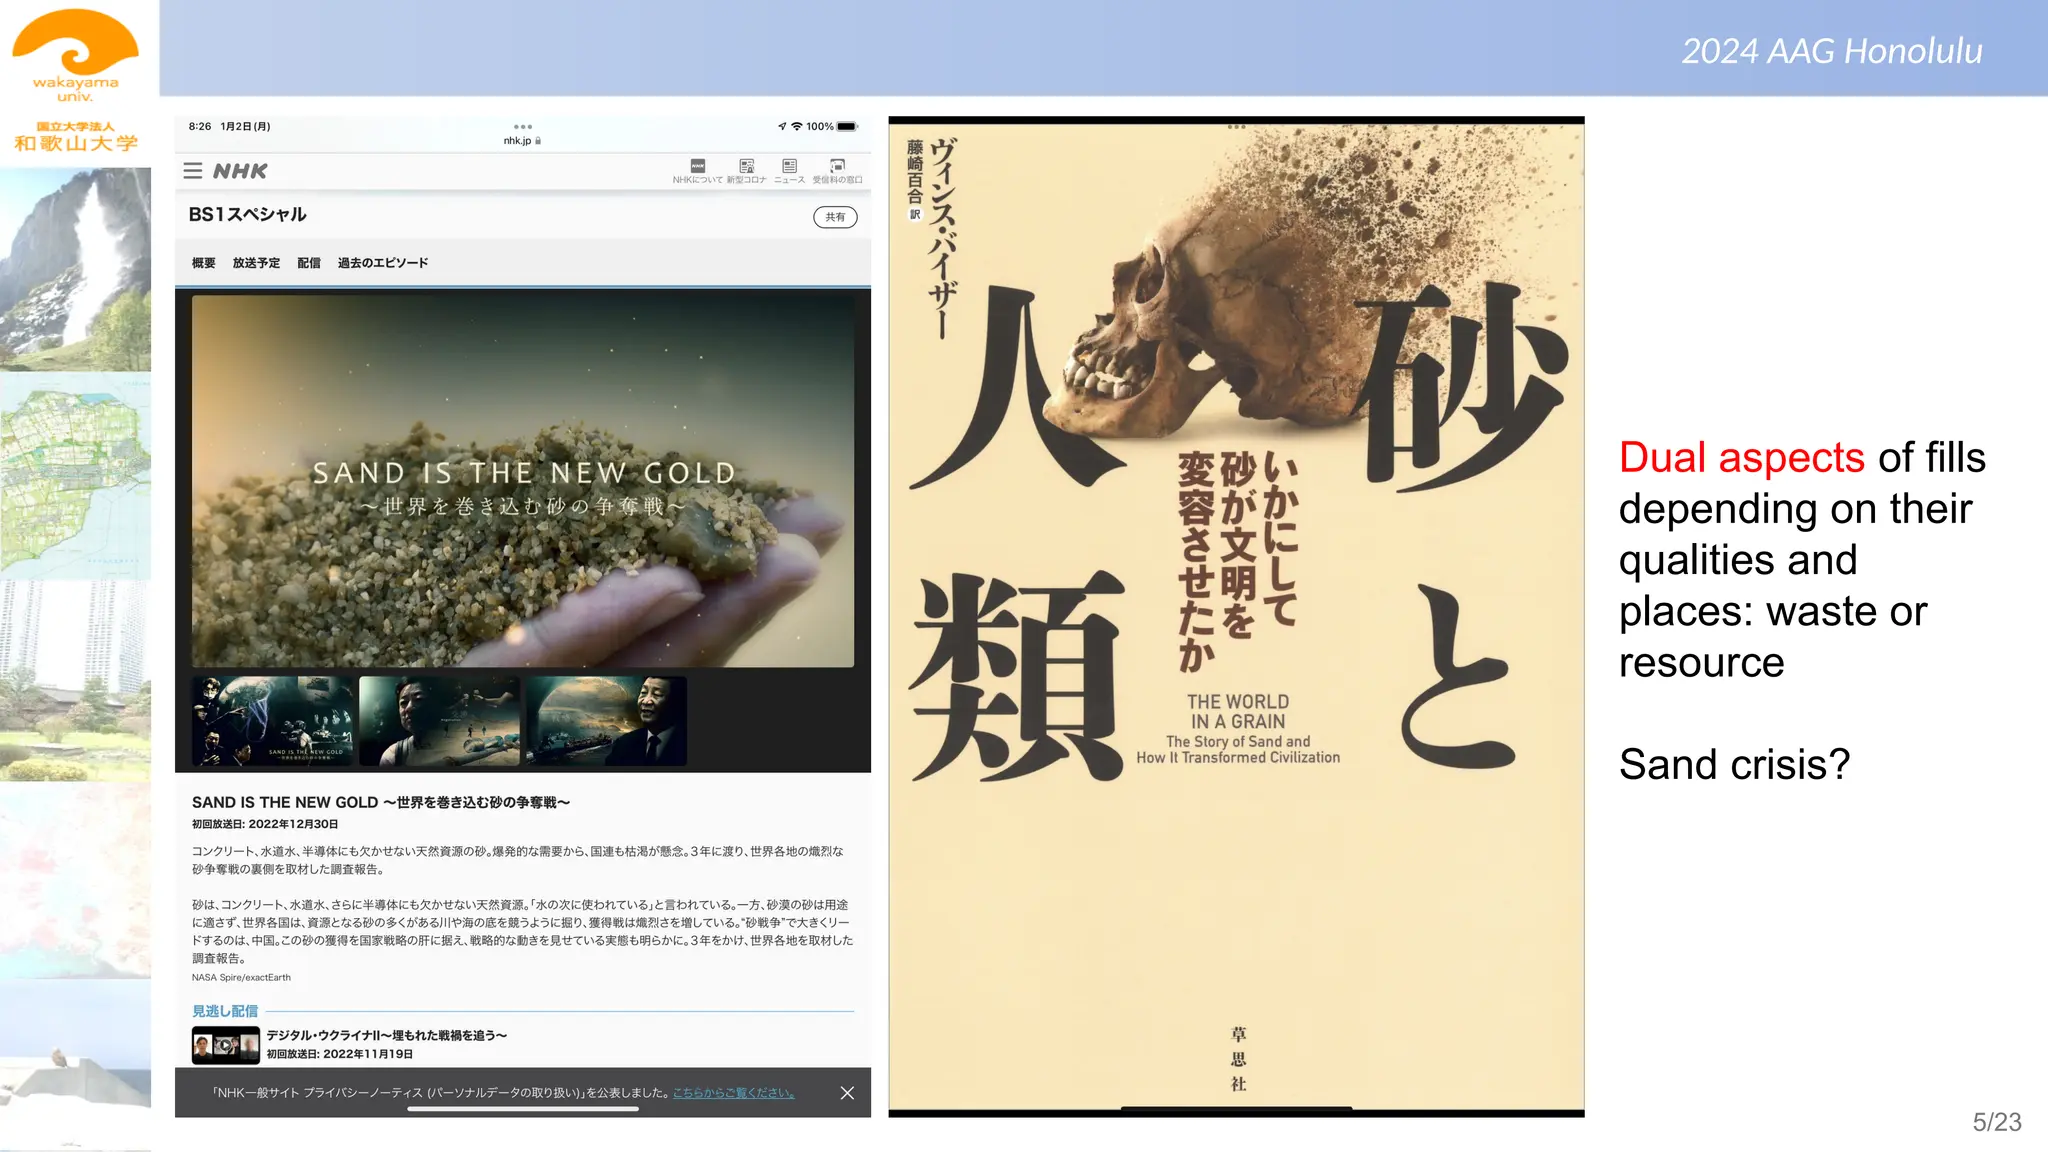
A strong debris flow in Atami City, Japan on 3 July 2021 killed 26 people residing
along a steep stream with a massive unapproved fill at the headwater point, which
drew public and scientific attention to the issue of inappropriate fill.
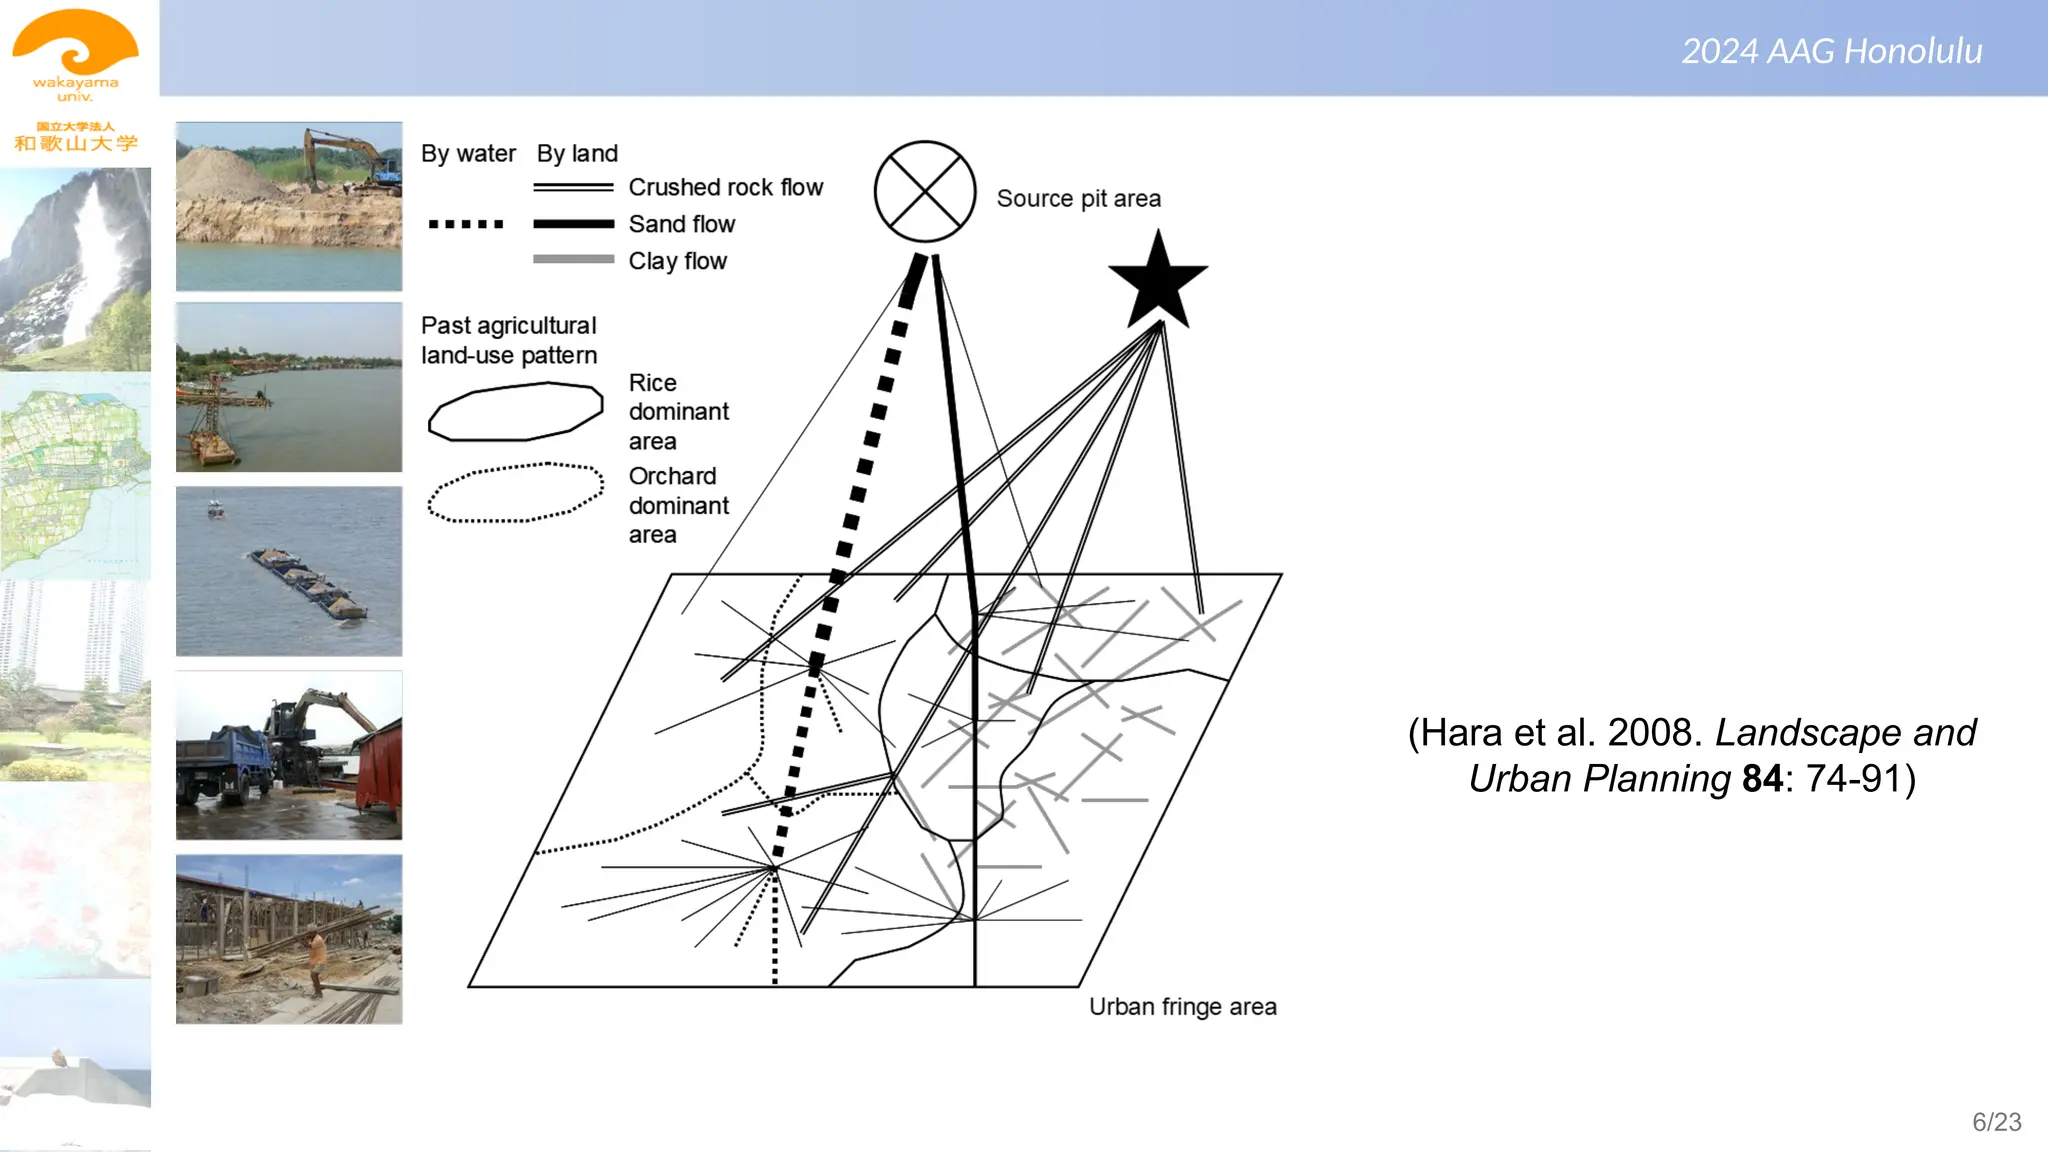
Since the 1960s, alluvial plains in Japan have mostly been developed in tandem
with urbanization and economic development, and hilly and mountainous areas at
the urban fringe have drawn intensive focus as sites for cut–fill residential
development.
In many cases, these soil flows were not counted in public statistics because of the
secretive nature of the matching between fill suppliers and accepters.
Moreover, during this intensive development period, there was almost no concept
of open-source data, and quantification tools, including digital statistical data and
geographic information system (GIS), were not yet developed, making it almost
impossible to address these massive soil problems.
4/23
景観生態学(第1回)
2024 AAG Honolulu
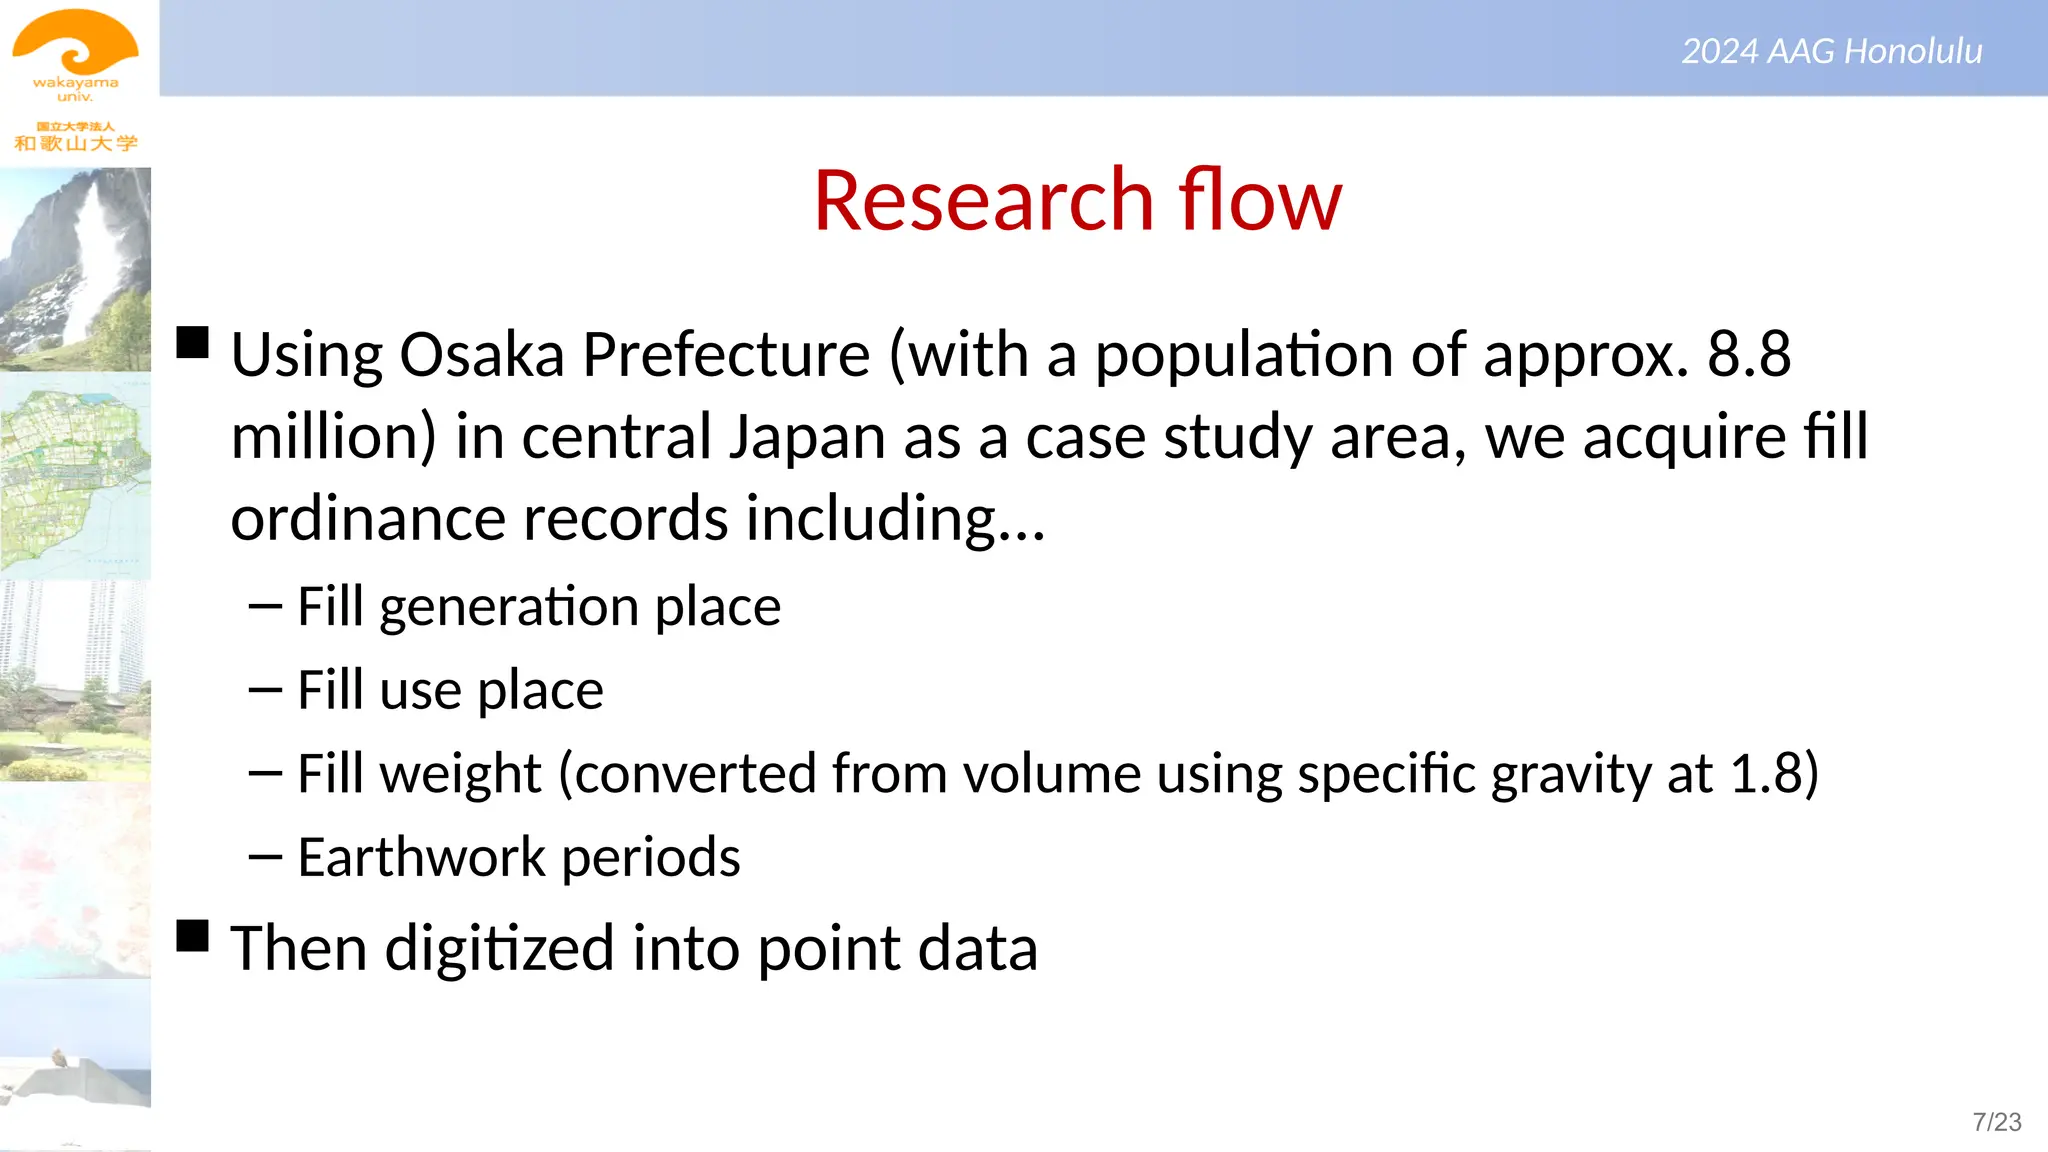
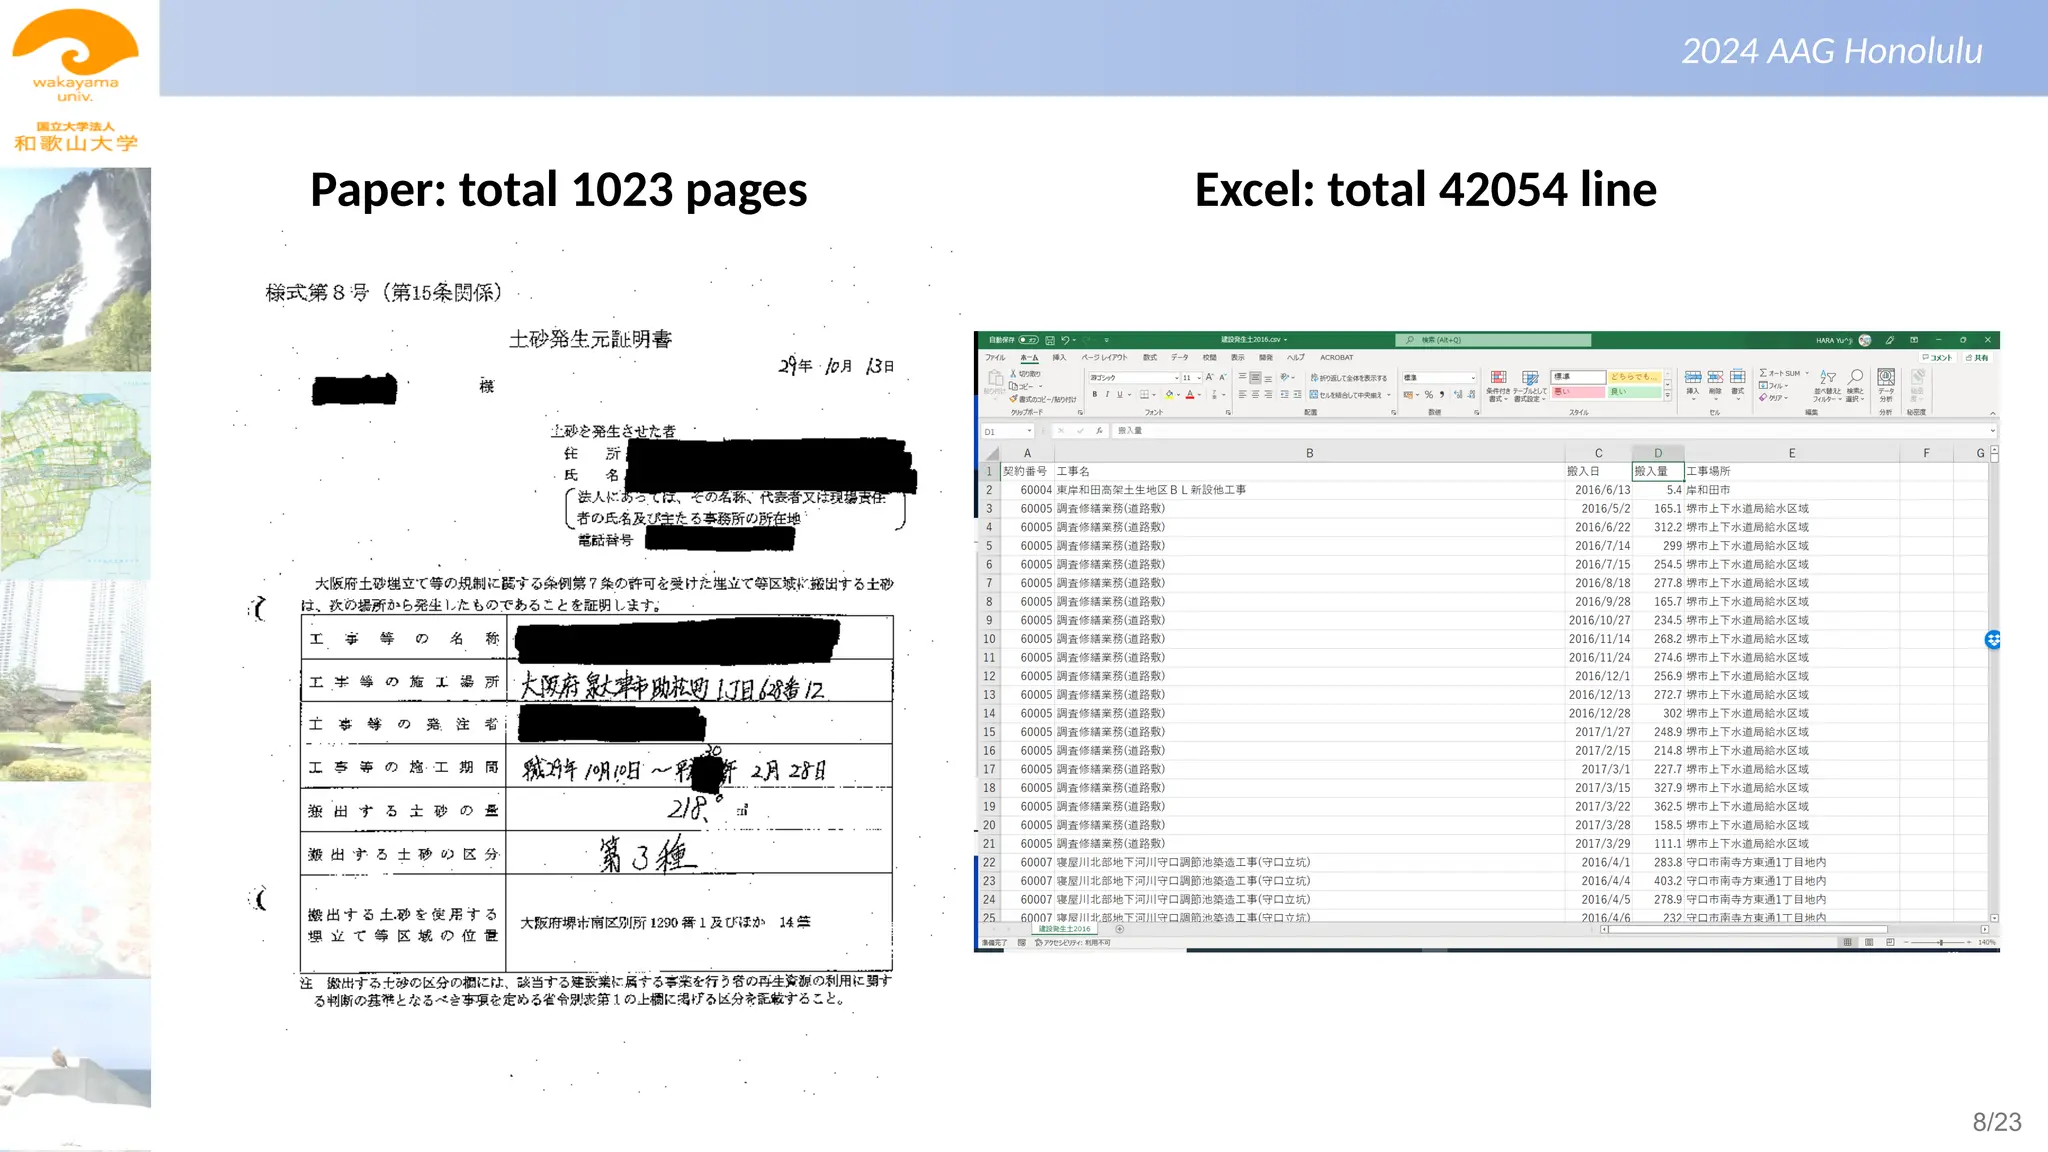
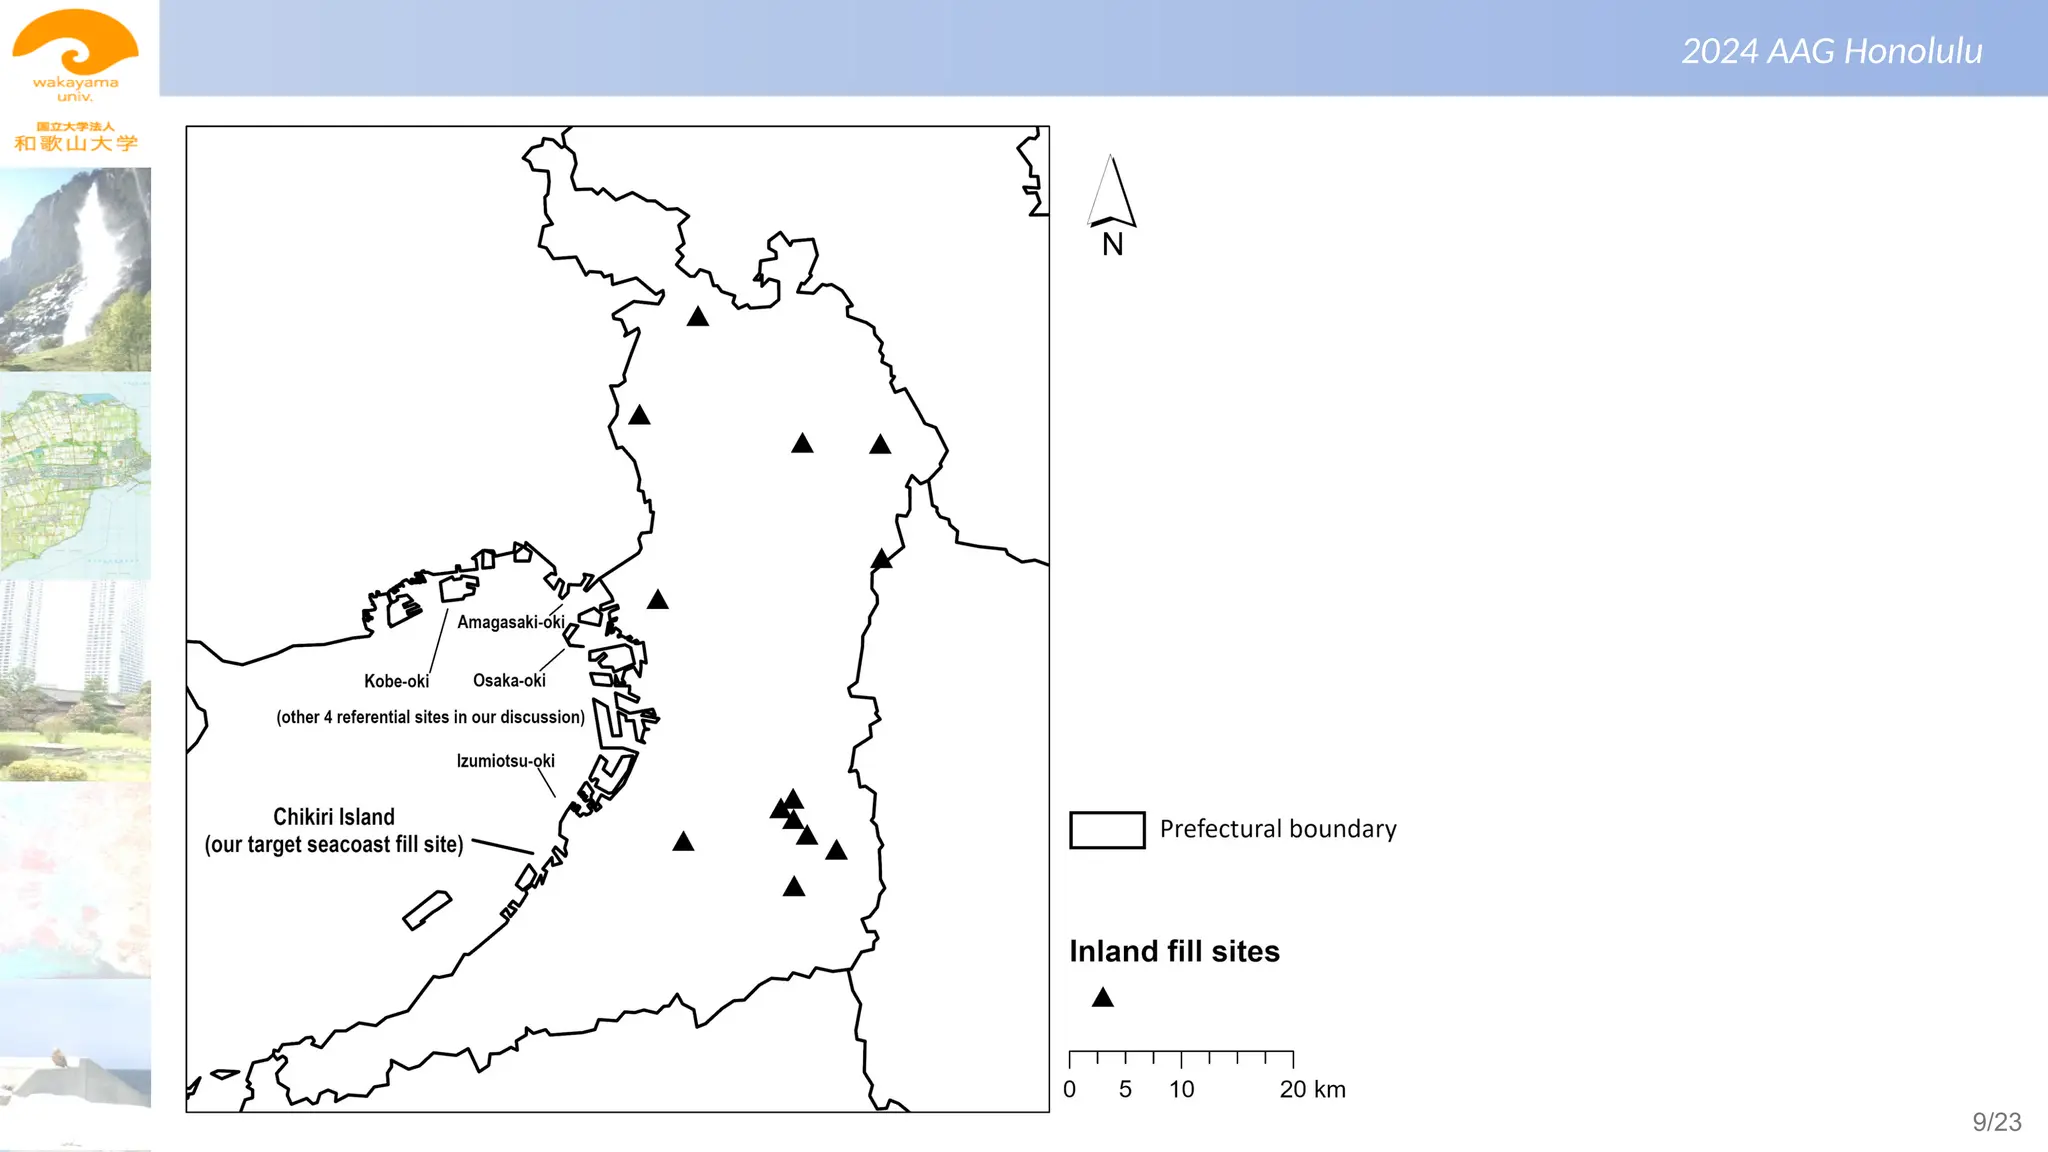
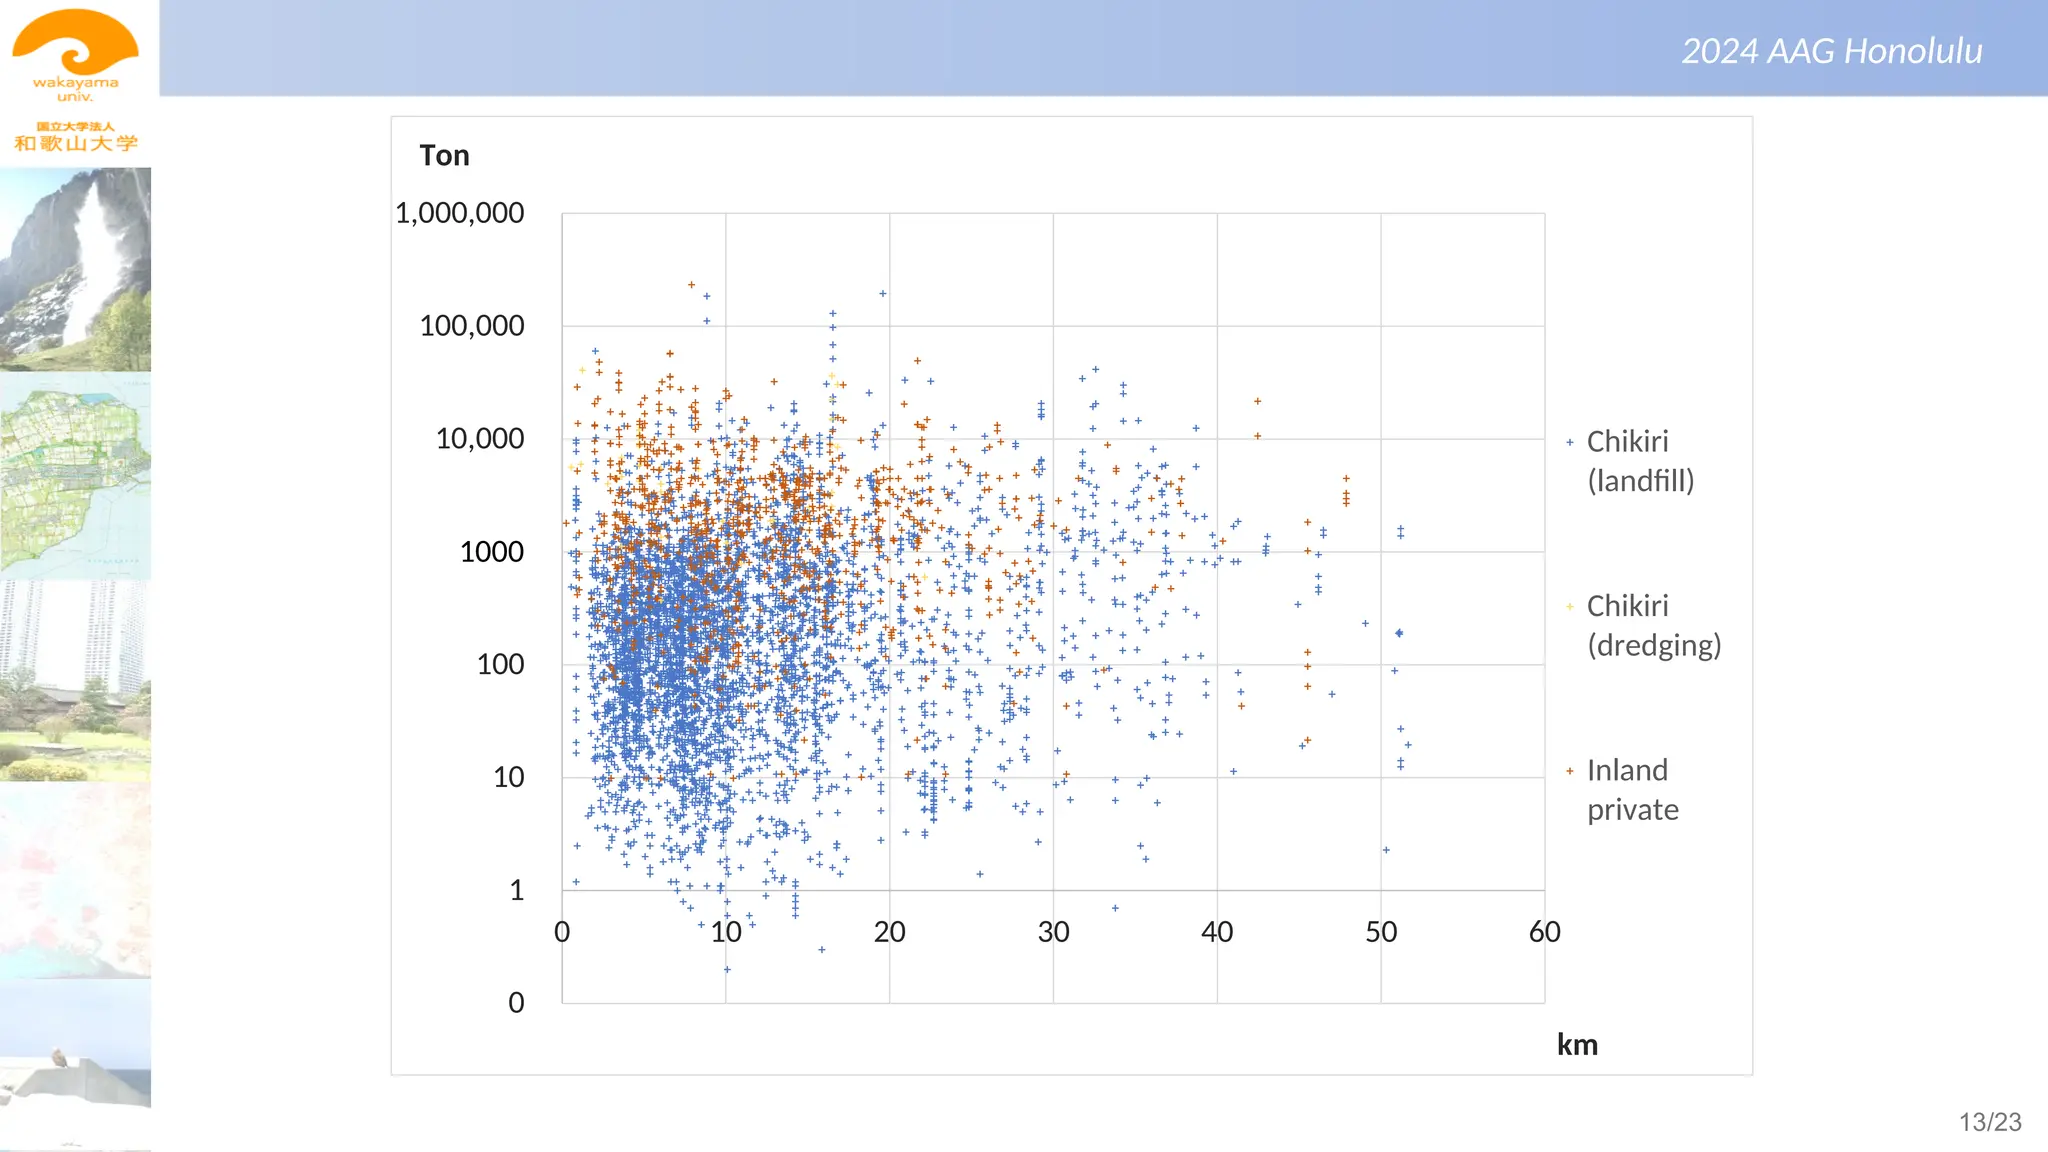
Researchflow
Using Osaka Prefecture (with a population of approx. 8.8
million) in central Japan as a case study area, we acquire fill
ordinance records including...
– Fill generation place
– Fill use place
– Fill weight (converted from volume using specific gravity at 1.8)
– Earthwork periods
Then digitized into point data
7/23
景観生態学(第1回)
2024 AAG Honolulu
Researchaim
Mapping real fill flows and calculating associated CO2 emission
– Compare to natural river erosion rate (in the context of Anthropocene)
– Compare to CO2 emission from public statistics in Osaka Prefecture
Simulating possible environmental reduction by total shortest
distance matching optimization scenario (using Python)
– Validating feasibility of this best matching scenario with officials and
local civil engineering contractors
– Identifying possible obstacles and bottleneck
11/23
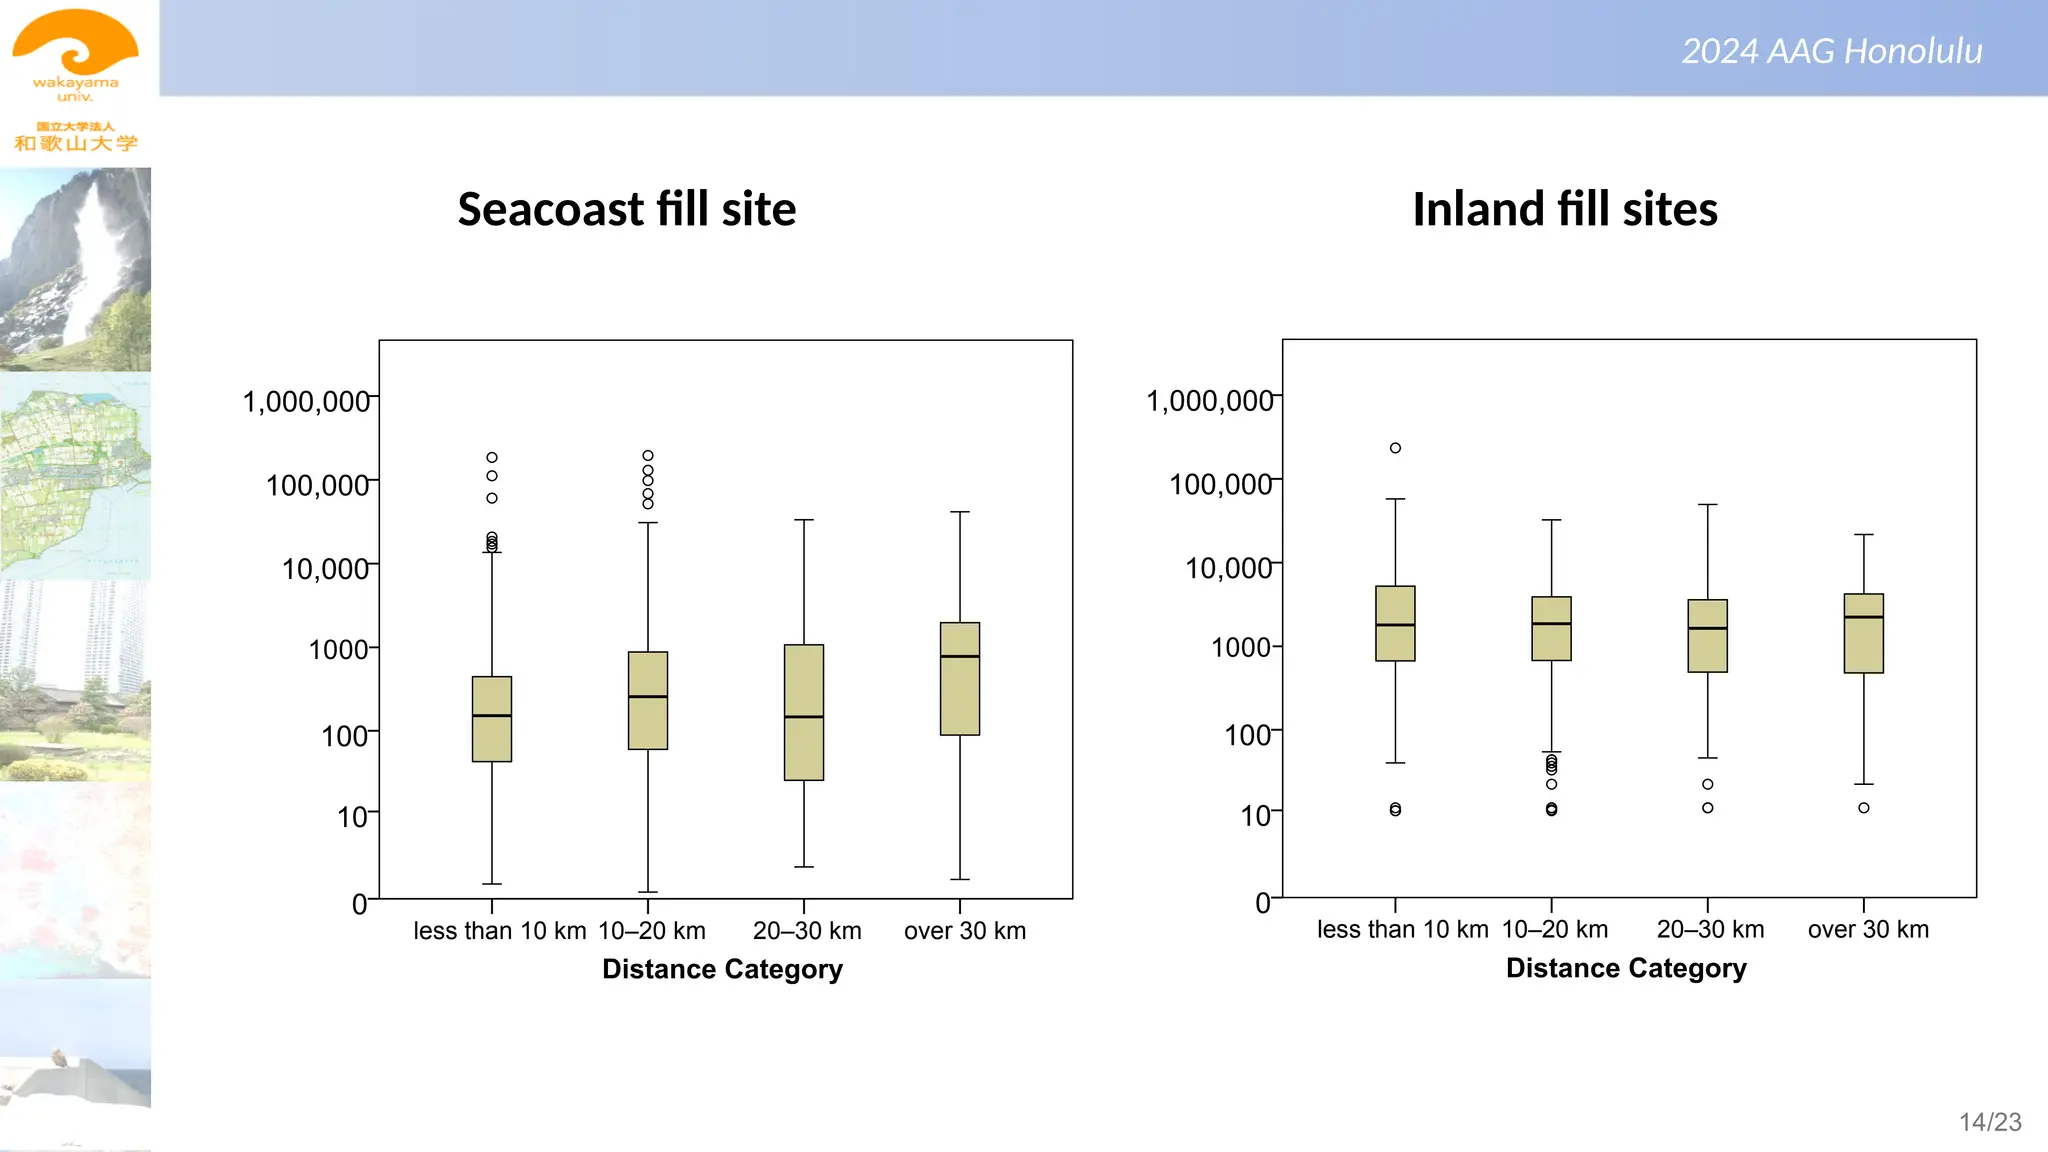
景観生態学(第1回)
2024 AAG Honolulu
Seacoastfill site Inland fill sites
Distance Category
over 30 km
20–30 km
10–20 km
less than 10 km
Ton
1,000,000
100,000
10,000
1,000
100
10
0
1000
Distance Category
over 30 km
20–30 km
10–20 km
less than 10 km
Ton
1,000,000
100,000
10,000
1,000
100
10
0
1000
14/23
景観生態学(第1回)
2024 AAG Honolulu
0
2,000
4,000
6,000
8,000
10,000
12,000
14,000
16,000
18,000
20,000
20142015 2016 2017 2018 2019 2020 2021
By excavation for 4 referential
fill sites (dredging)
By excavation for 4 referential
fill sites (landfill)
By transportaion to Chikiri
Island (dredging)
By excavation for Chikiri
Island (dredging)
By transportaion to Chikiri
Island (landfill)
By excavation for Chikiri
Island (landfill)
By transportation to inland
private fill sites
By excavation for inland
private fill sites
Ton
8000
6000
4000
2000
16/23
景観生態学(第1回)
2024 AAG Honolulu
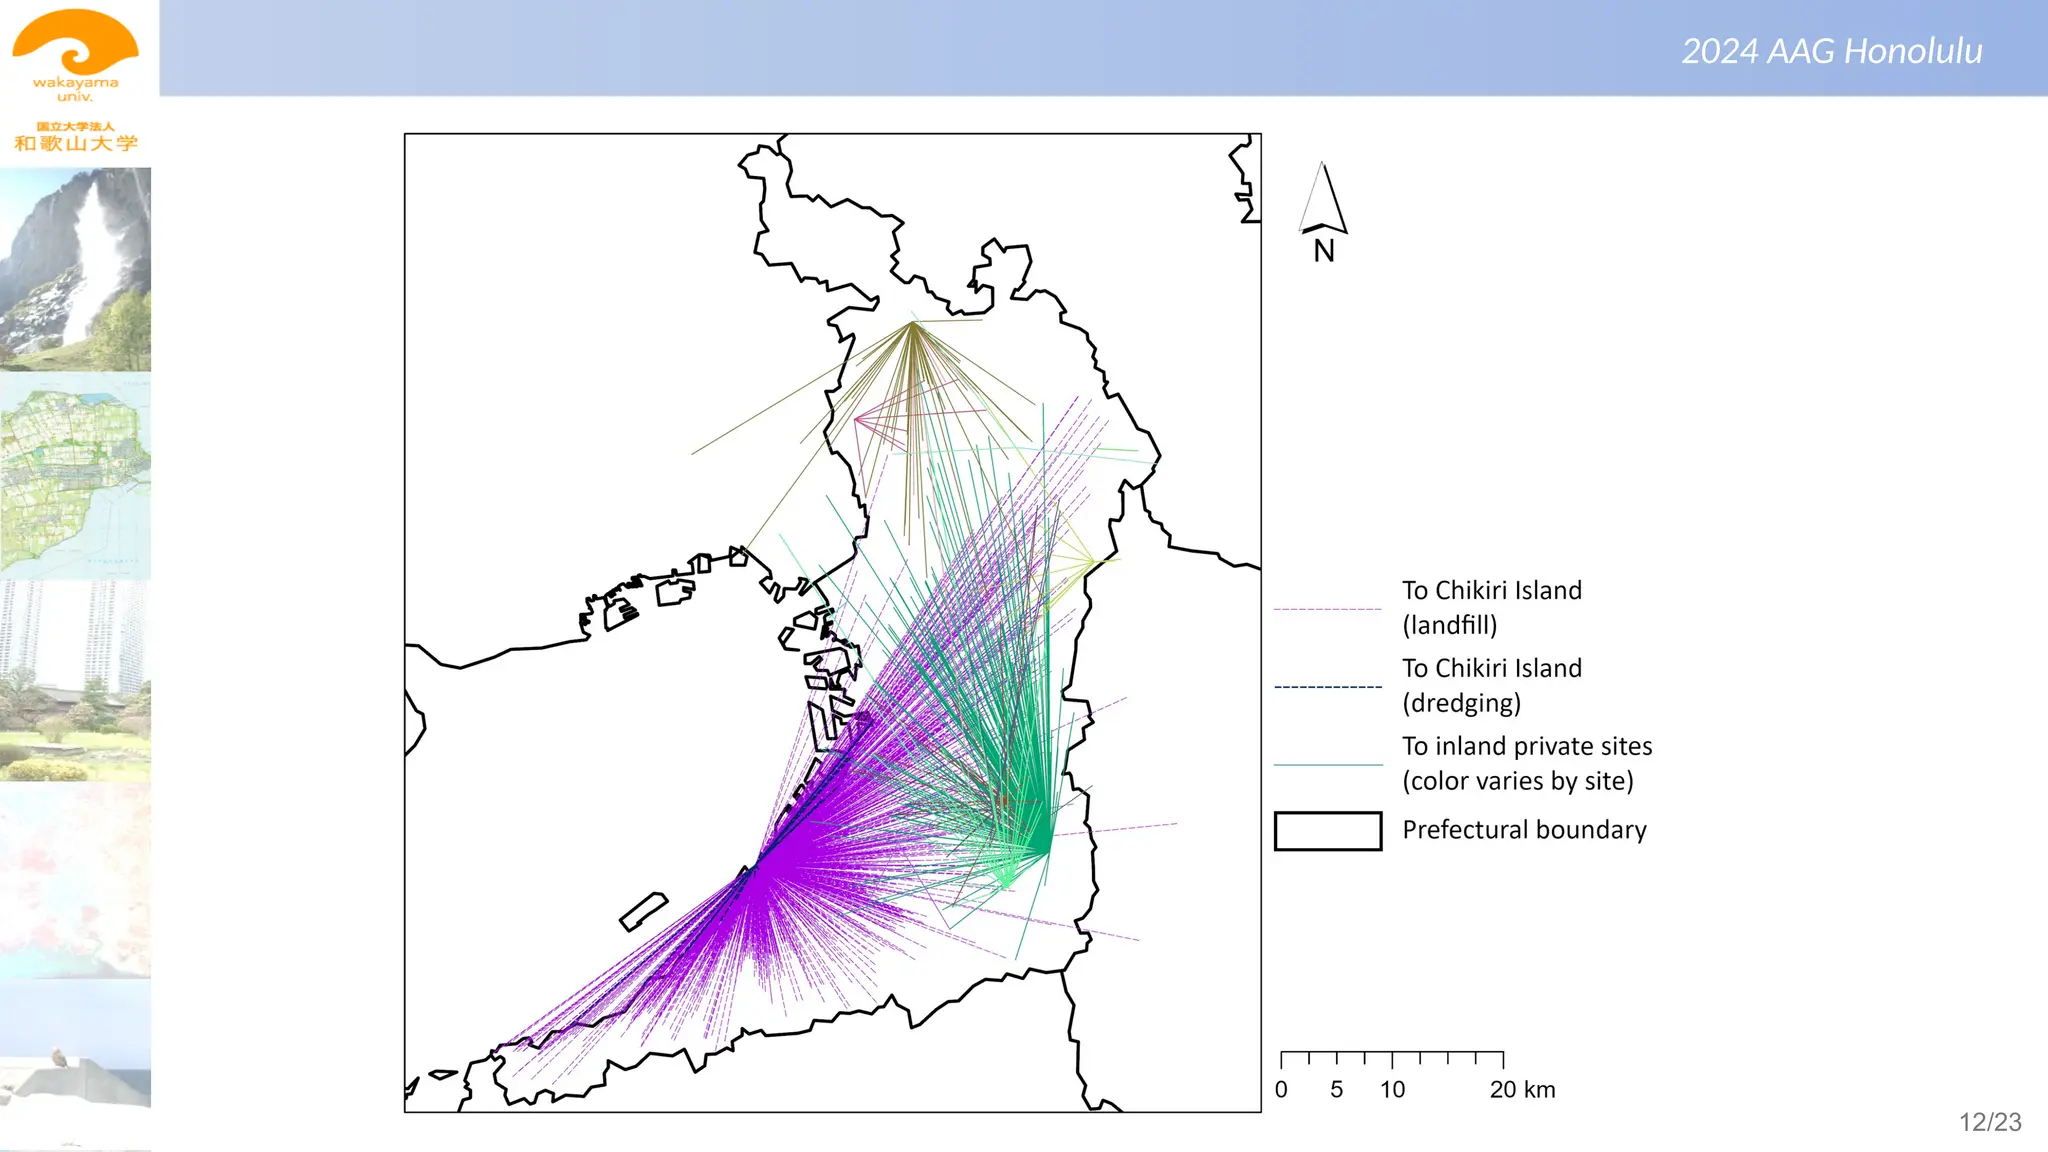
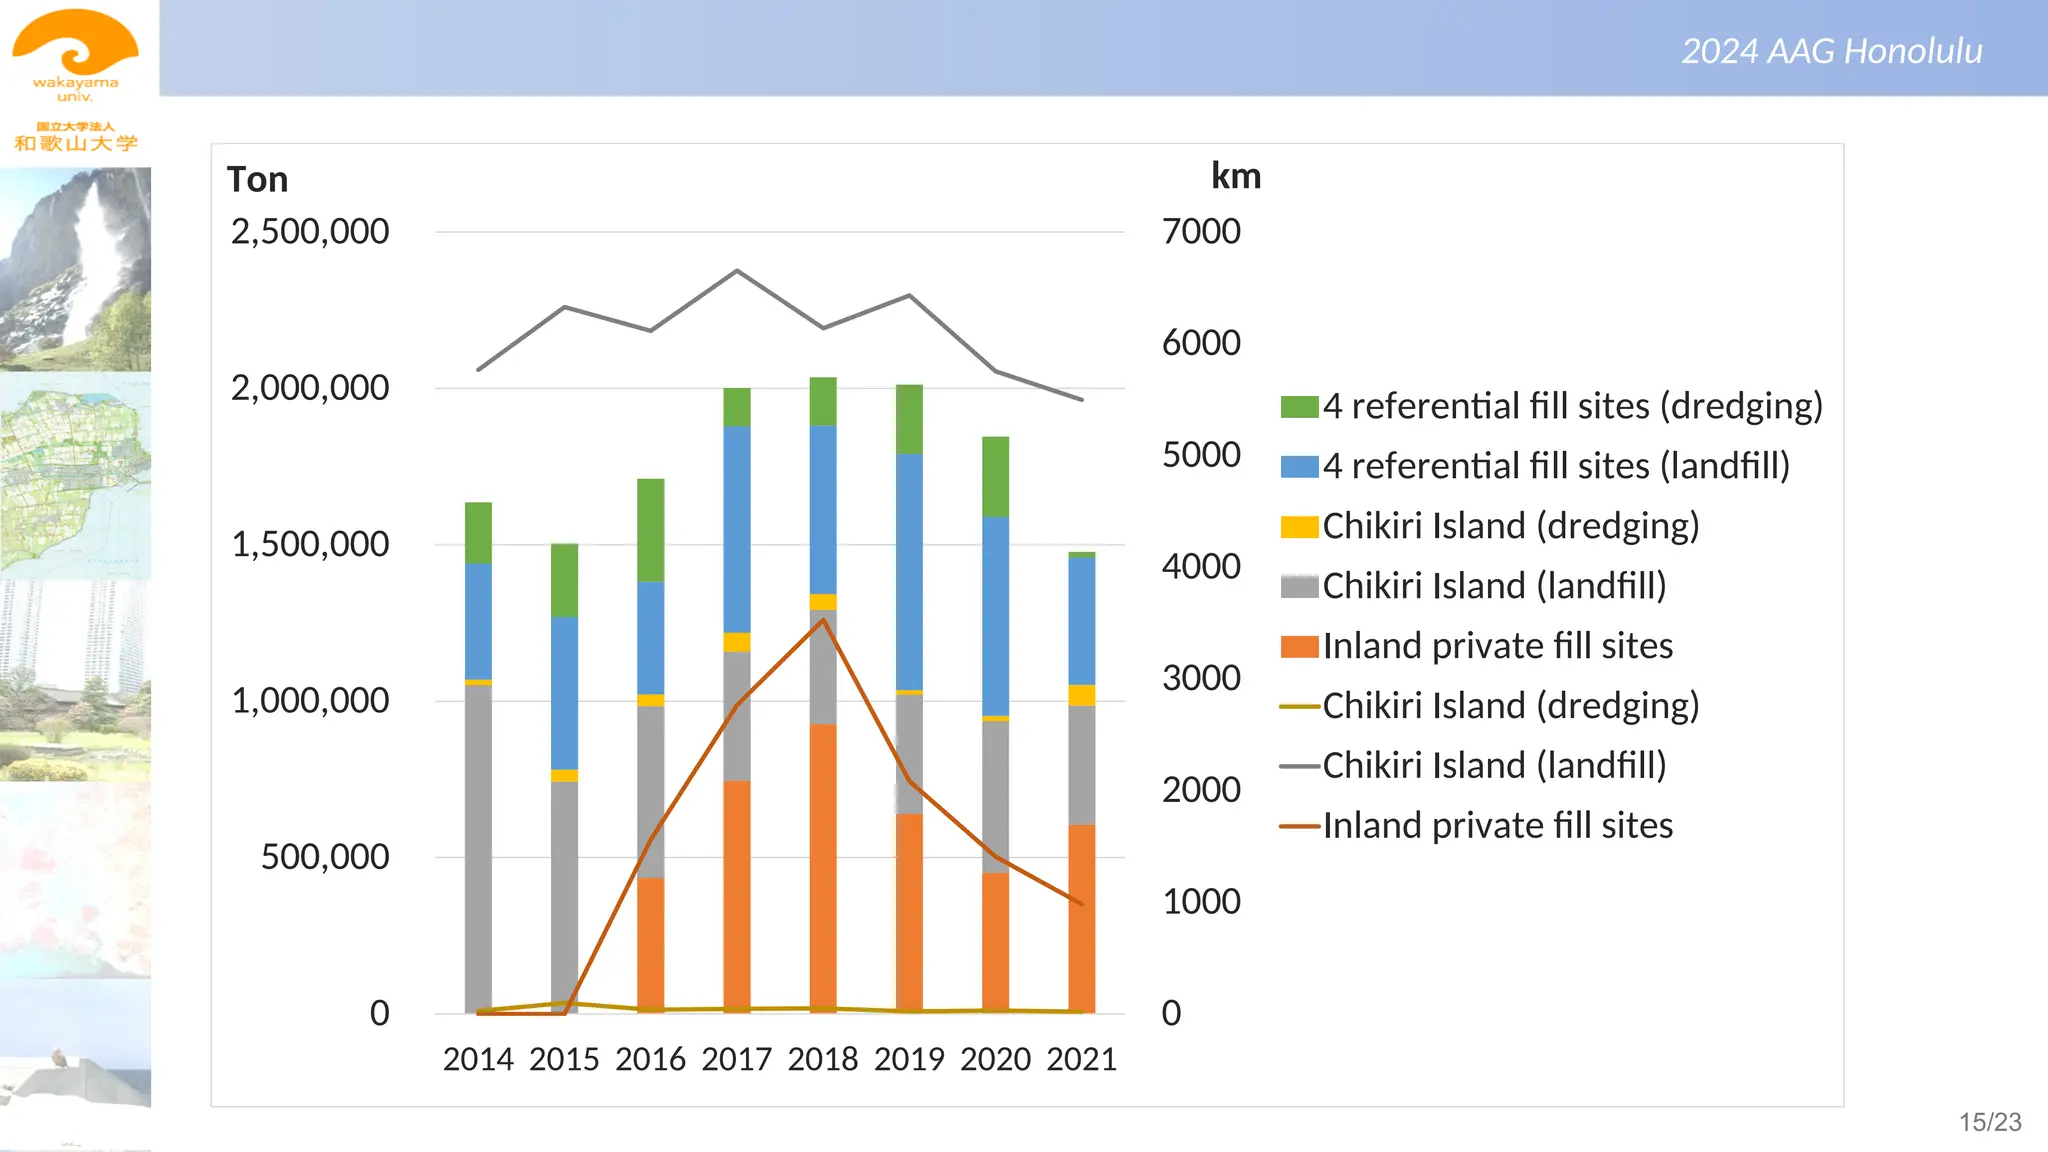
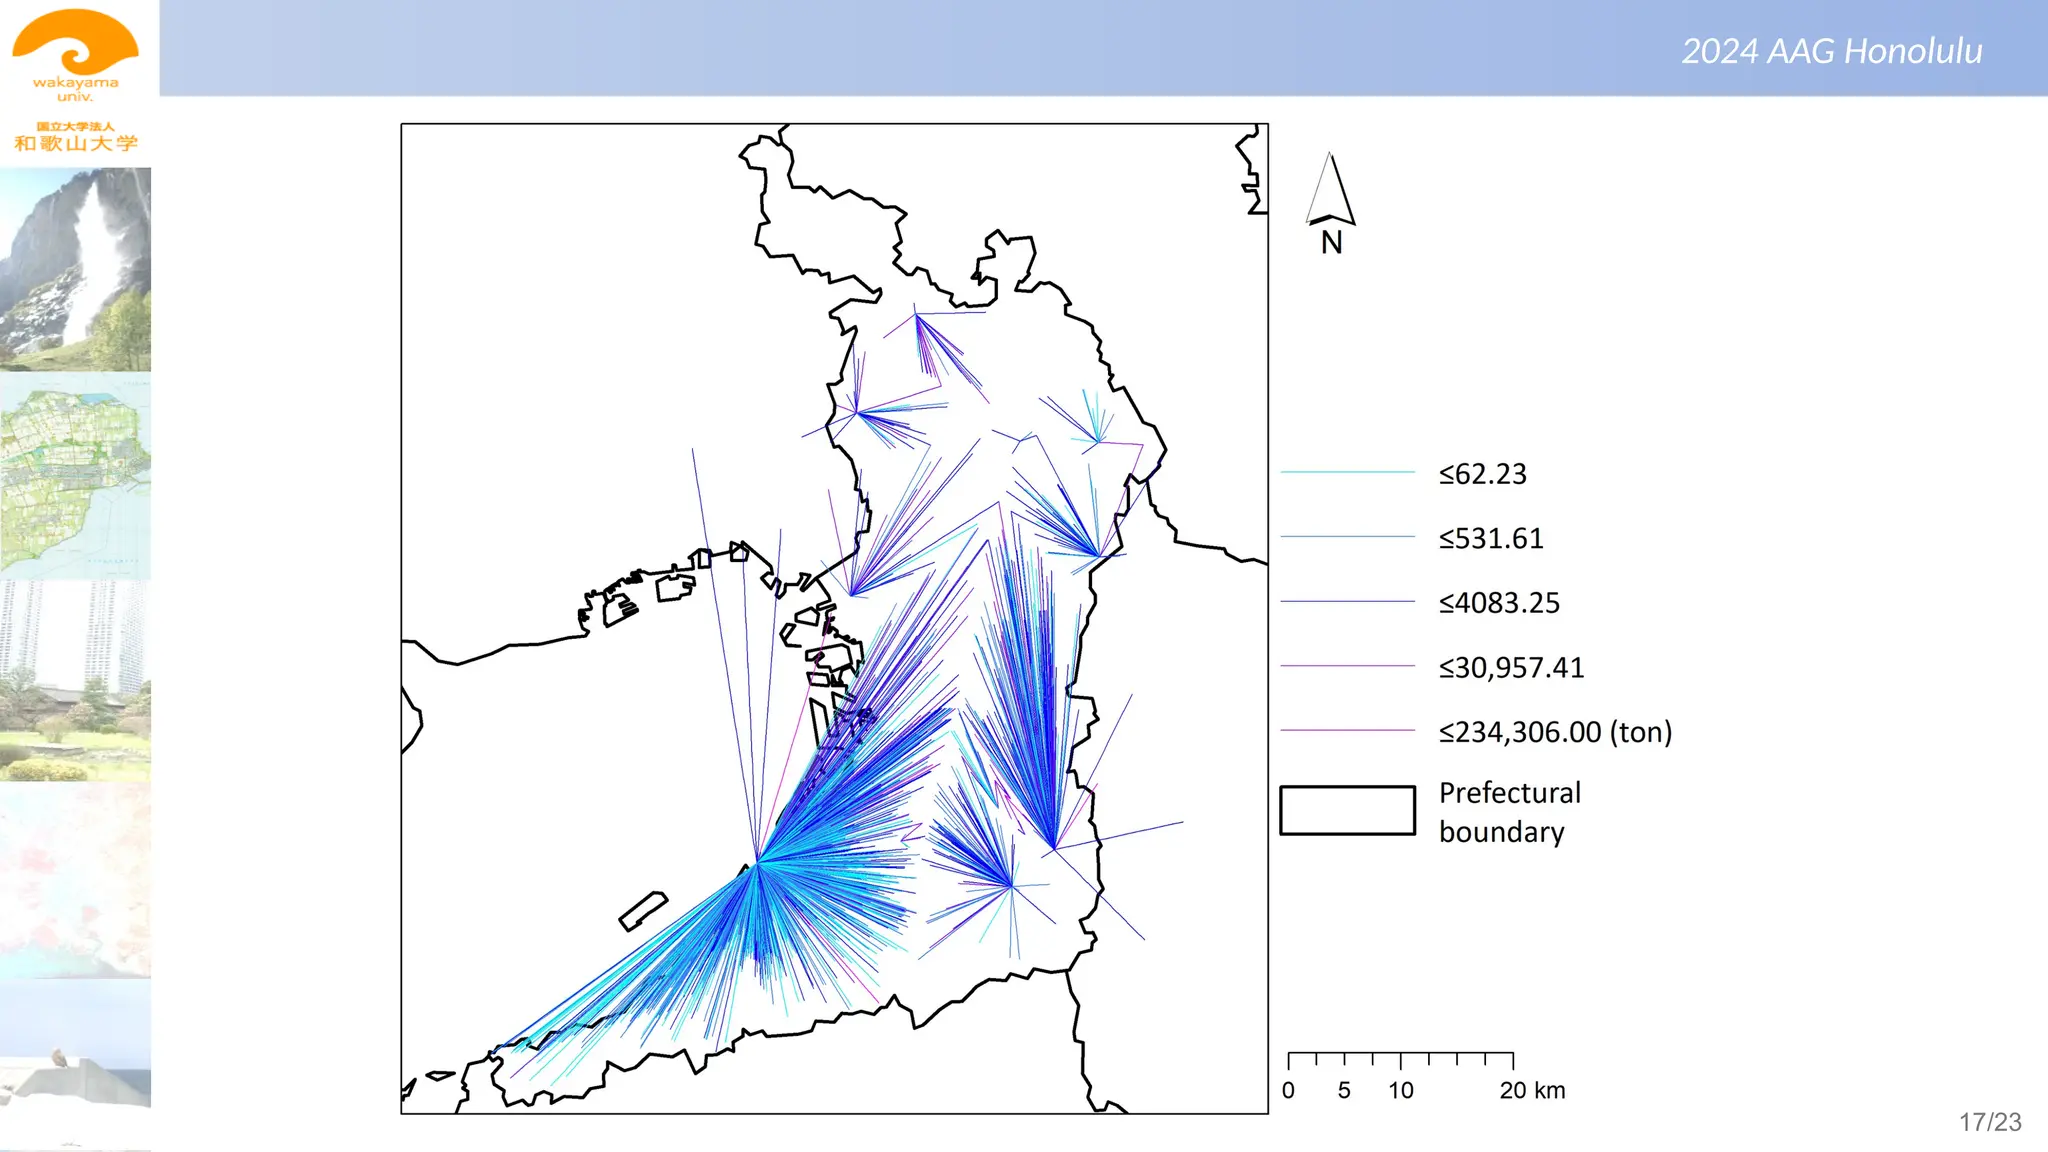
The current fill flows average 7668 km/year, of which 79% come from a seacoast
large-scale fill site, 20% from inland private fill sites, and the remaining 1% from
dredging at a seacoast site.
The annual average total fill weights are 1,059,019 t, of which 51% come from a
seacoast fill site, 45% from inland private fill sites, and 4% from dredging.
Overall, the total anthropogenic fill flow was estimated as 311.2 m3
/km2
/year as
compared to the natural geomorphic erosion rate of 22 m3
/km2
/year.
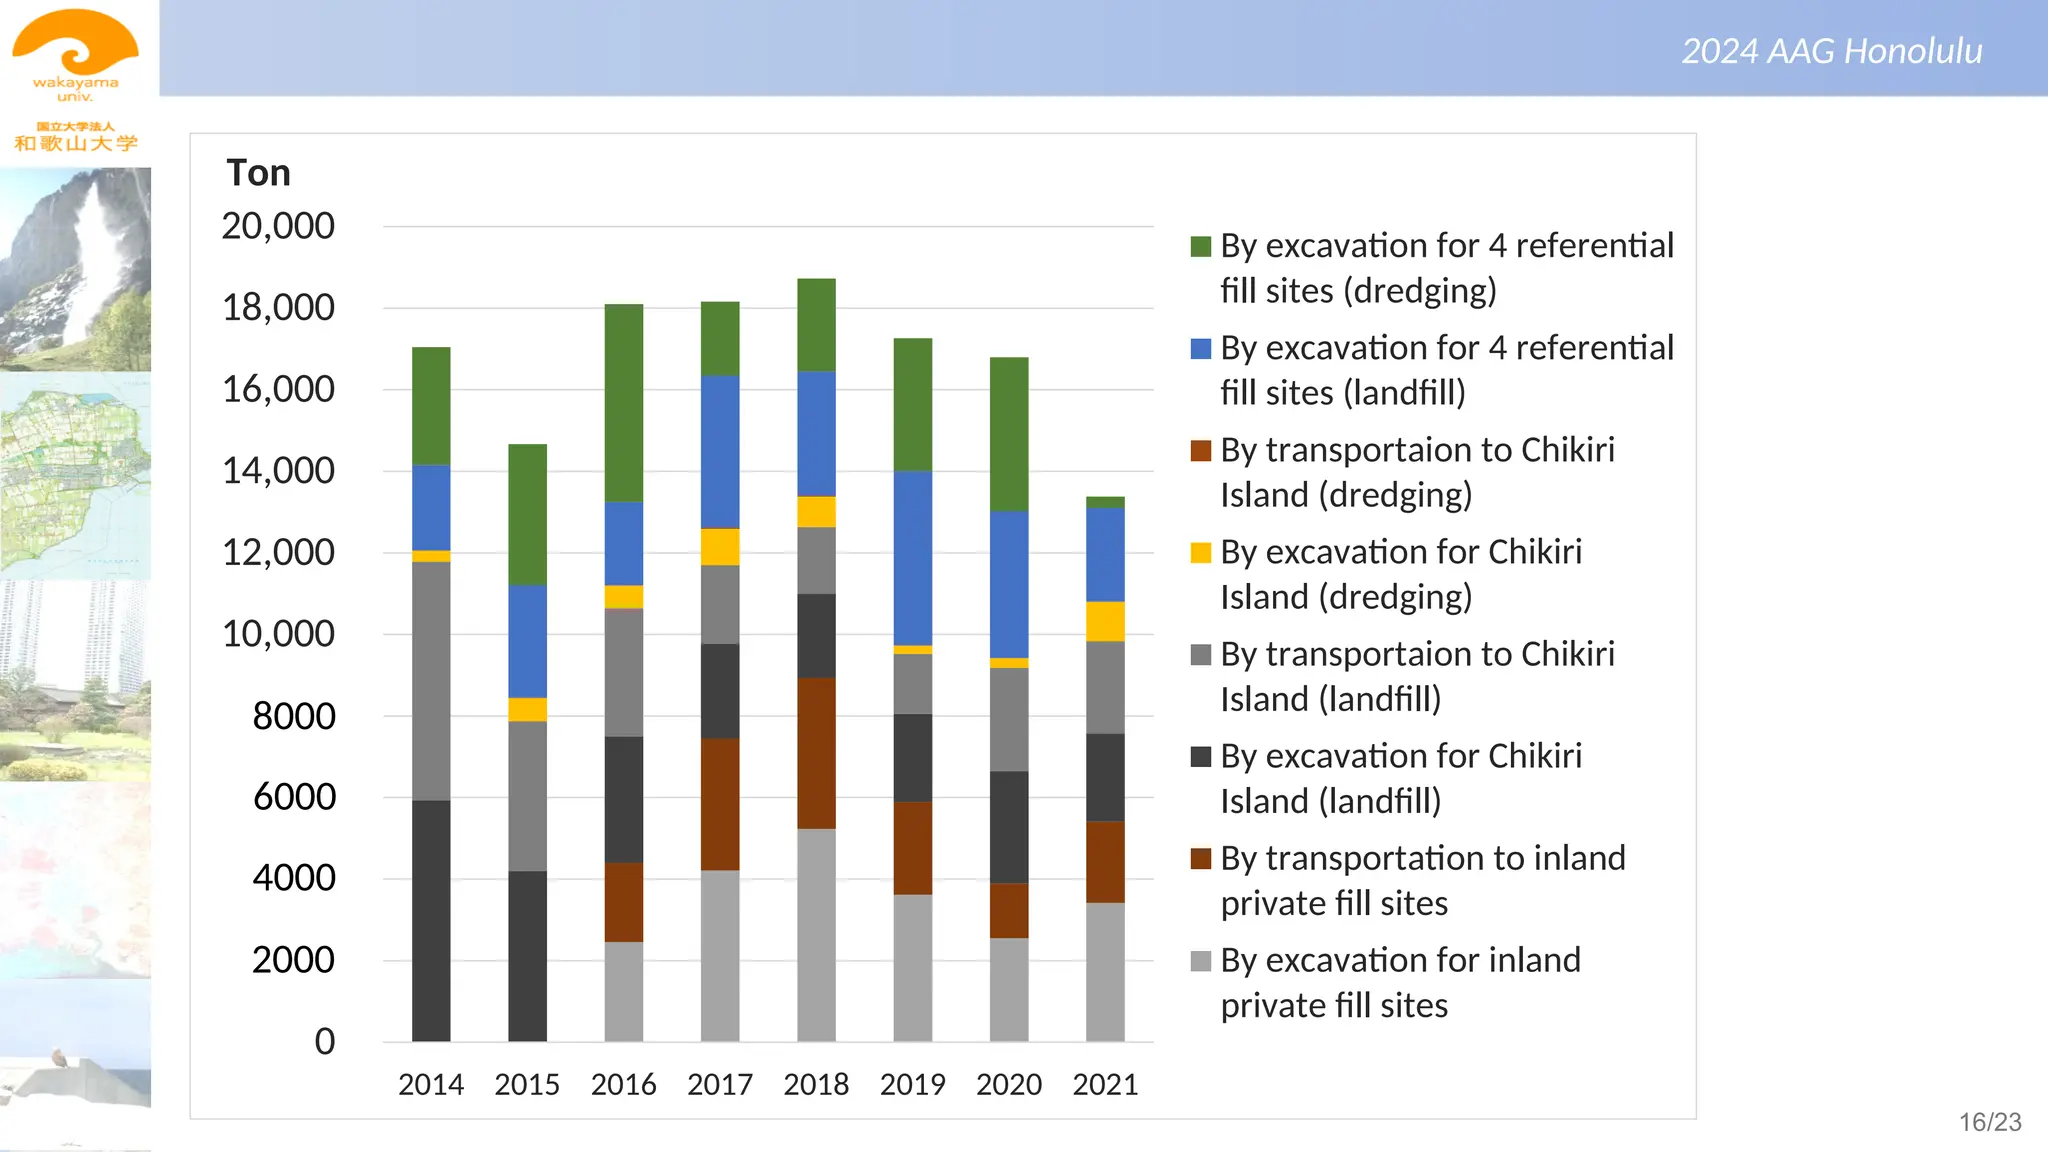
The annual average CO2 emissions from fill flows are 10,964 t, of which 58% are from
excavation and 42% from transportation.
Our GIS-programming-based shortest-distance matching simulation could achieve an
8448 km reduction in fill flow length and a 5724 t-CO2 reduction in emissions. This
reduction is equivalent to the annual CO2 emissions of 2160 households.
18/23
19.
景観生態学(第1回)
2024 AAG Honolulu
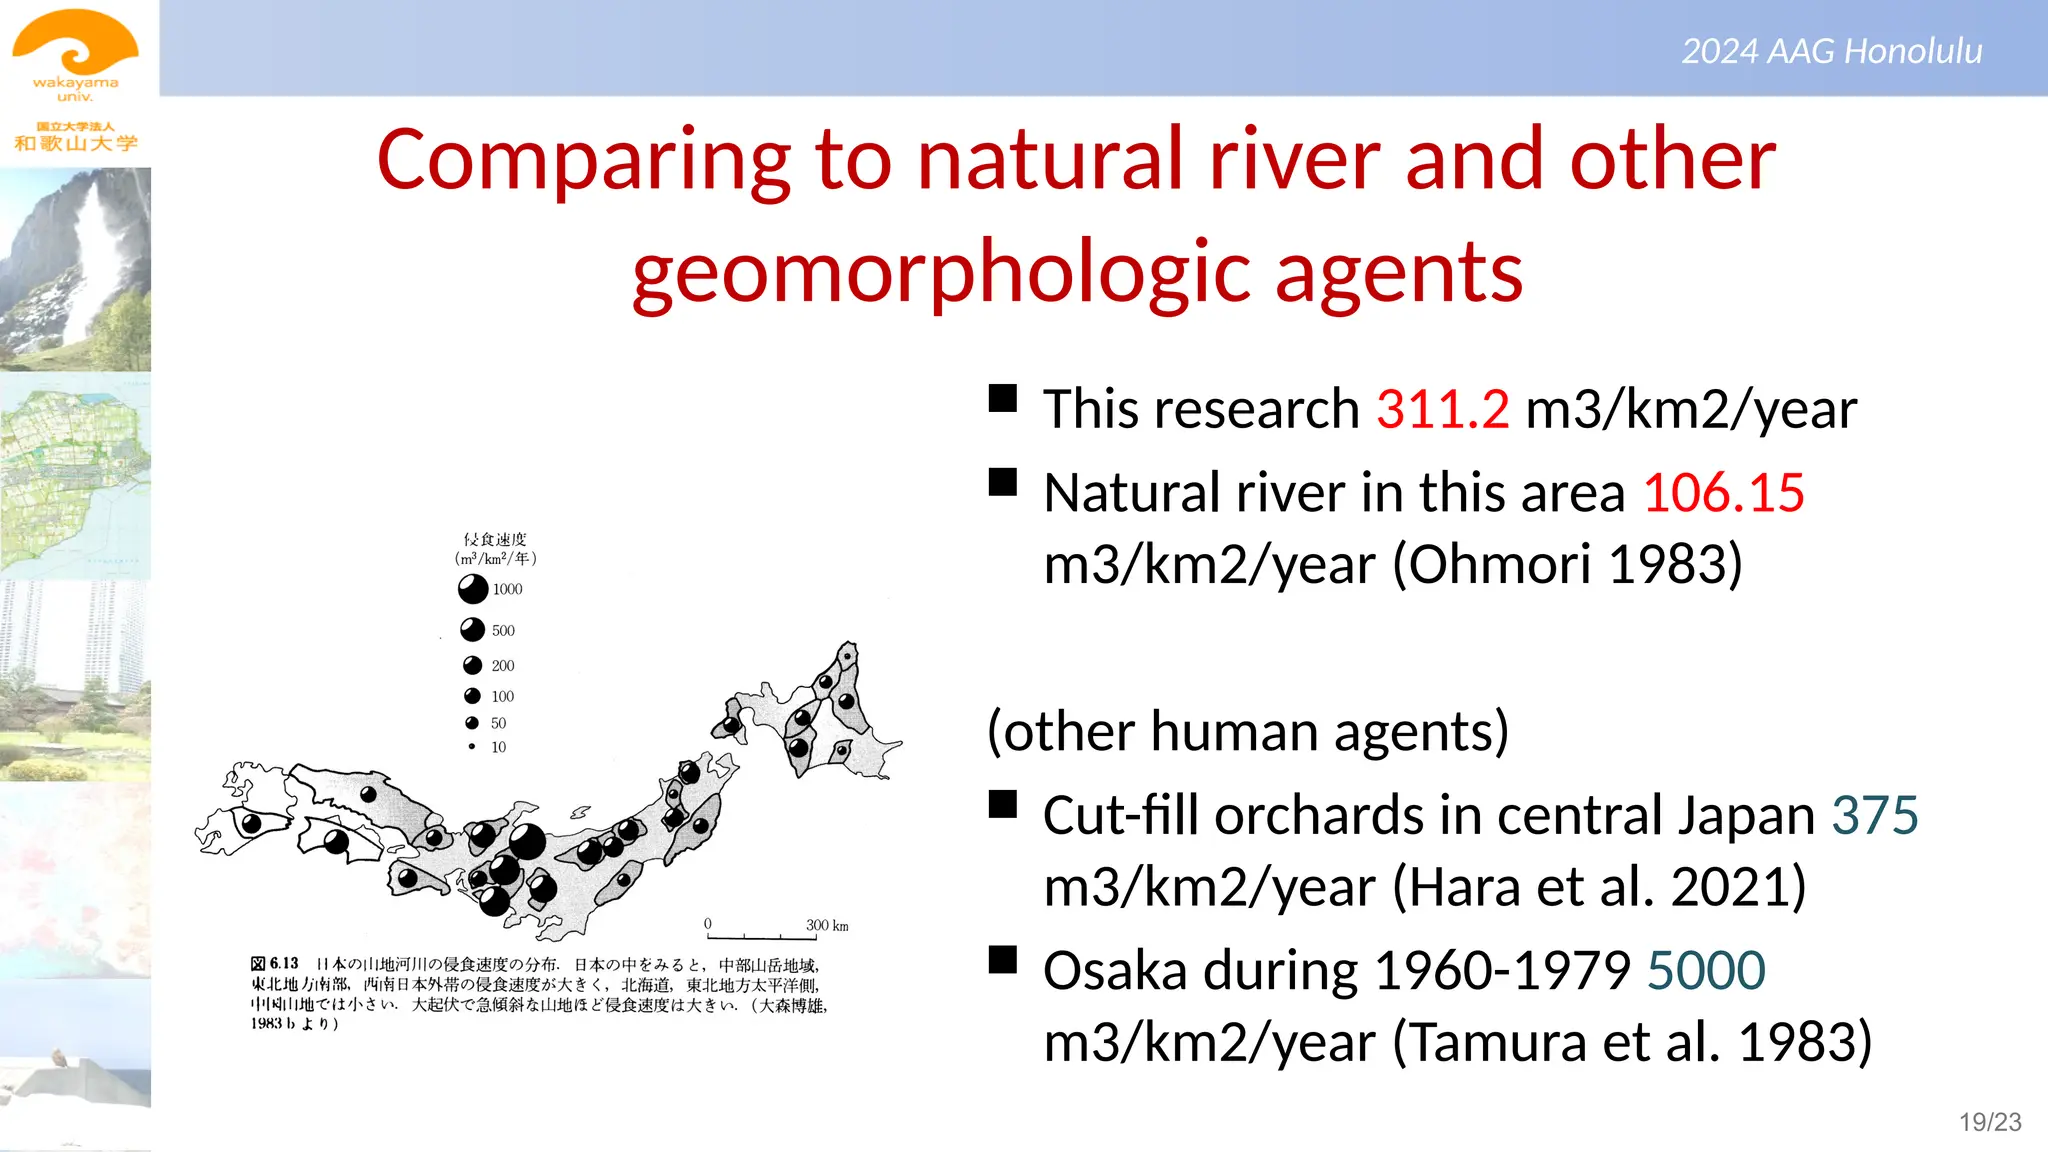
Comparingto natural river and other
geomorphologic agents
This research 311.2 m3/km2/year
Natural river in this area 106.15
m3/km2/year (Ohmori 1983)
(other human agents)
Cut-fill orchards in central Japan 375
m3/km2/year (Hara et al. 2021)
Osaka during 1960-1979 5000
m3/km2/year (Tamura et al. 1983)
19/23
20.
景観生態学(第1回)
2024 AAG Honolulu
Comparingto energy uses
This research annual average 10,964 t-CO2
Possible reduction by total shortest distance matching
scenario 5724 t-CO2
(public statistics based on monetary transaction)
Waste management sector in Osaka Prefecture in 2019
1,610,000 t-CO2
Earthwork in Osaka Prefecture in 2004 1700 t-CO2
(Nakaguchi &Iida 2007)
20/23
21.
景観生態学(第1回)
2024 AAG Honolulu
Feasibilityof best matching scenario
According to interviews with officials/environmental law
researchers and existing papers/governmental reports...
– An importance of matching between public and private sectors is
highly recognized
– But public works are basically subject to initial proposal, hence
change of fill site is almost impossible even new large scale private
fill site emerges nearby
– Many construction work timing mismatch, stockyard?
– Large scale seacoast fill site can function as first choice due to its
stability
– Quality and trust of fill 21/23


![Pollution.ppt [Autosaved].ppt yogesh kumbhar](https://cdn.slidesharecdn.com/ss_thumbnails/pollution-251205194856-d30cfee8-thumbnail.jpg?width=640&height=640&fit=bounds)


