Mean Average Precision
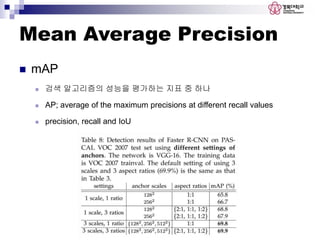
mAP
검색 알고리즘의 성능을 평가하는 지표 중 하나
AP; average of the maximum precisions at different recall values
precision, recall and IoU
2
3.
Confusion Matrix
BinaryClassfier 의 Prediction 결과
Prediction 과 Ground Truth 의 일치여부로 True/False 를 정한다.
Prediction 결과에 따라 Positive/Negative 를 정한다.
3
4.
Precision & recall
정밀도(Precision)
Precision 은 분류기가 P로 예측한 sample 중에서 맞게 예측한 것의 비율
재현율(Recall)
Recall 은 Ground Truth 의 총 positive sample 중에서 positive로 맞게 예
측한 것의 비율
4
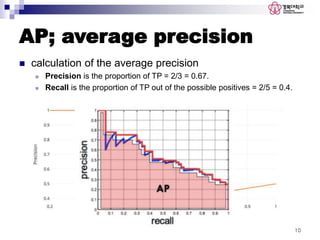
AP; average precision
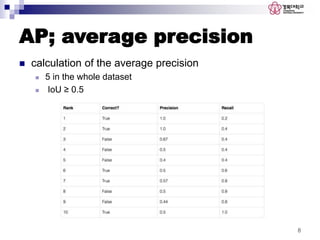
calculation of the average precision
5 in the whole dataset
IoU ≥ 0.5
8
9.
AP; average precision
calculation of the average precision (rank #3)
Precision is the proportion of TP = 2/3 = 0.67.
Recall is the proportion of TP out of the possible positives = 2/5 = 0.4.
9
10.
AP; average precision
calculation of the average precision
Precision is the proportion of TP = 2/3 = 0.67.
Recall is the proportion of TP out of the possible positives = 2/5 = 0.4.
10
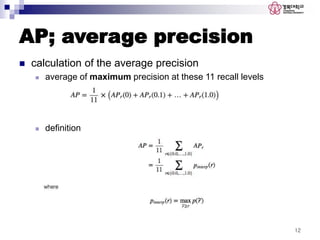
AP; average precision
calculation of the average precision
average of maximum precision at these 11 recall levels
definition
12
13.
AP; average precision
calculation of the average precision
AP = (5 × 1.0 + 4 × 0.57 + 2 × 0.5) /11 = 0.752
13
14.
mAP
mAP (meanAverage Precision)
just the average over all classes
it is often called AP instead
14
15.
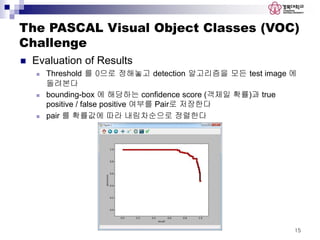
The PASCAL VisualObject Classes (VOC)
Challenge
Evaluation of Results
Threshold 를 0으로 정해놓고 detection 알고리즘을 모든 test image 에
돌려본다
bounding-box 에 해당하는 confidence score (객체일 확률)과 true
positive / false positive 여부를 Pair로 저장한다
pair 를 확률값에 따라 내림차순으로 정렬한다
15
16.
Interpolated recall-precision값 11개를 구한다
11개의 recall 값 : [0.0, 0.1, …, 1.0] 의 evenly-spaced 11-values
AP
11개의 precision 값의 평균
mAP
여러개의 object 에 대해 AP 를 구하고 평균을 구한다
16
The PASCAL Visual Object Classes (VOC)
Challenge
17.
COCO mAP
COCOdataset
AP is the average over multiple IoU
AP@[.50:.05:.95]
start from 0.5 to 0.95 with a step size of 0.05
mAP@.75 means the mAP with IoU=0.75
17
18.
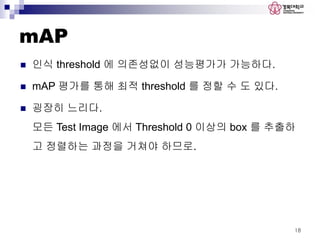
mAP
인식 threshold에 의존성없이 성능평가가 가능하다.
mAP 평가를 통해 최적 threshold 를 정할 수 도 있다.
굉장히 느리다.
모든 Test Image 에서 Threshold 0 이상의 box 를 추출하
고 정렬하는 과정을 거쳐야 하므로.
18
#3 Object Detection 알고리즘 논문을 보면 성능평가지표로 mAP (mean Average Precision) 이라는 것을 이용한다.
mutiple object detection 알고리즘에 대한 성능을 1개의 scalar value로 표현한 것
#4 Binary Classfier 의 Prediction 결과를 2x2 Matrix 로 나타낸 것이다.
#8 딥러닝 객체 검출 알고리즘에서는 검출된 상자가 참일 확률이 같이 출력됩니다.
확률이 몇 퍼센트 이상일 때 양성으로 판정할지의 기준선인 ‘임계값’을 몇으로 정하는지에 따라서 예측 결과가 참인지 거짓인지가 달라지기 때문에 정밀도와 재현율도 모두 달라지게 됩니다. 임계값을 바꿔가면서 실제로 참인 객체가 임계값 내에 포함될 때마다 정밀도와 재현율을 모두 측정하면 실제로 참인 객체 만큼의 정밀도, 재현율 쌍이 생기게 됩니다. 여기서 정밀도만을 골라 내어 평균을 낸 것이 평균 정밀도(AP; average precision)입니다.
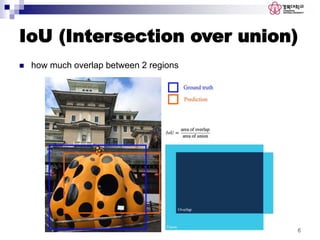
객체 검출에서 출력되는 경계 박스는 참인지 거짓인지가 출력되지 않고 경계 박스의 위치만이 출력됩니다. 이 경계 박스를 실제로 참으로 볼지 거짓으로 볼지는 실체 위치(ground truth)와 검출된 객체 상자 간의 IoU 값이 일정 이상인지를 평가하여 이루어집니다.
#9 We collect all the predictions the model made for apples and rank it according to the predicted confidence level
#16 PASCAL VOC 문서의 Evaluation of Result 항목을 보면 mAP를 어떻게 구하는지 명기되어있습니다.
이를 토대로 구하는 순서를 정리해보겠습니다.
if multiple detections of the same object are detected, it counts the first one as a positive while the rest as negatives
#18 Latest research papers tend to give results for the COCO dataset only
http://cocodataset.org/#home


![ Interpolated recall-precision 값 11개를 구한다
11개의 recall 값 : [0.0, 0.1, …, 1.0] 의 evenly-spaced 11-values
AP
11개의 precision 값의 평균
mAP
여러개의 object 에 대해 AP 를 구하고 평균을 구한다
16
The PASCAL Visual Object Classes (VOC)
Challenge](https://image.slidesharecdn.com/0918-181010102923/85/mAP-Mean-Average-Precision-16-320.jpg)
![COCO mAP
COCO dataset
AP is the average over multiple IoU
AP@[.50:.05:.95]
start from 0.5 to 0.95 with a step size of 0.05
mAP@.75 means the mAP with IoU=0.75
17](https://image.slidesharecdn.com/0918-181010102923/85/mAP-Mean-Average-Precision-17-320.jpg)


![SSII2022 [OS2-01] イメージング最前線](https://cdn.slidesharecdn.com/ss_thumbnails/ssii2022-os2-1-220607020403-b550c379-thumbnail.jpg?width=640&height=640&fit=bounds)


![[DL輪読会]Convolutional Conditional Neural Processesと Neural Processes Familyの紹介](https://cdn.slidesharecdn.com/ss_thumbnails/20191220readingpaperconvcnp-191220034420-thumbnail.jpg?width=640&height=640&fit=bounds)


![[홍대 머신러닝 스터디 - 핸즈온 머신러닝] 3장. 분류](https://cdn.slidesharecdn.com/ss_thumbnails/handson-mlch-180724063825-thumbnail.jpg?width=640&height=640&fit=bounds)


