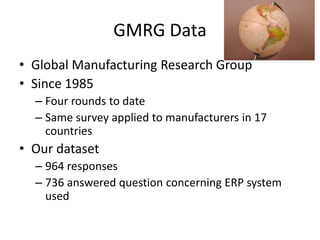
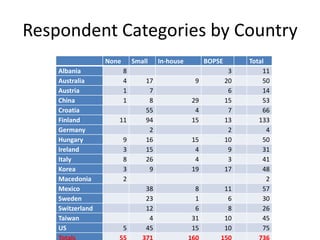
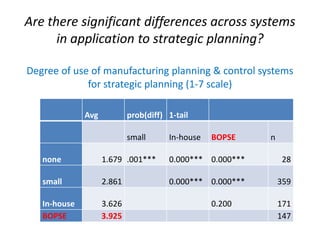
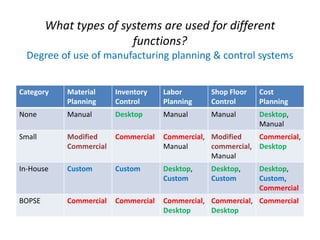
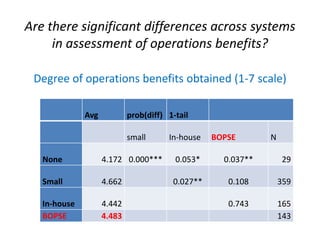
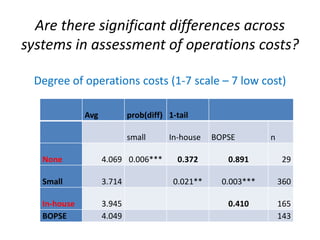
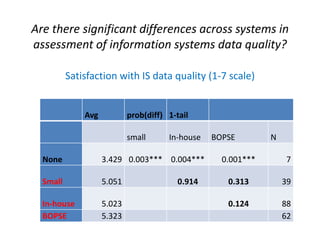
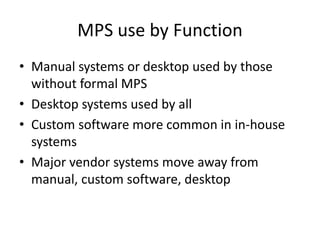
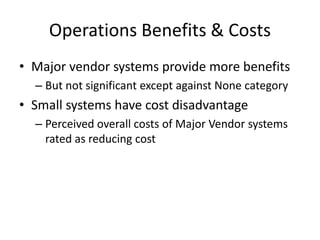
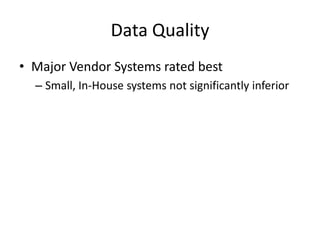
Manufacturing Planning Systems
  Use for Strategic Planning

 David L. Olson, University of Nebraska-Lincoln,
               dolson3@unl.edu
 Bongsug (Kevin) Chae, Kansas State University
     Chwen Sheu, Kansas State University
Manufacturing Planning Systems
• 1960s 1970s
  – Continue to evolve
• 1990s – ERP
  – Integrated systems
  – Expensive
     • MANY VARIANTS
• MPS specific systems can handle planning,
  logistics functions
  – Not integrated
  – More affordable
GMRG Data
• Global Manufacturing Research Group
• Since 1985
  – Four rounds to date
  – Same survey applied to manufacturers in 17
    countries
• Our dataset
  – 964 responses
  – 736 answered question concerning ERP system
    used
Respondent Categories by Country
                  None       Small    In-house        BOPSE        Total
    Albania              8                                     3       11
    Australia            4       17              9            20       50
    Austria              1        7                            6       14
    China                1        8              29           15       53
    Croatia                      55               4            7       66
    Finland          11          94              15           13      133
    Germany                       2                            2         4
    Hungary              9       16              15           10       50
    Ireland              3       15               4            9       31
    Italy                8       26               4            3       41
    Korea                3        9              19           17       48
    Macedonia            2                                               2
    Mexico                       38               8           11       57
    Sweden                       23               1            6       30
    Switzerland                  12               6            8       26
    Taiwan                        4              31           10       45
    US                   5       45              15           10       75
Are there significant differences across systems
      in application to strategic planning?

Degree of use of manufacturing planning & control systems
             for strategic planning (1-7 scale)

              Avg           prob(diff) 1-tail

                            small      In-house   BOPSE    n

   none             1.679 .001***      0.000*** 0.000***        28

   small            2.861              0.000*** 0.000***       359

   In-house         3.626                         0.200        171
   BOPSE            3.925                                      147
What types of systems are used for different
                        functions?
  Degree of use of manufacturing planning & control systems


Category    Material     Inventory    Labor       Shop Floor   Cost
            Planning     Control      Planning    Control      Planning
None        Manual       Desktop      Manual      Manual       Desktop,
                                                               Manual
Small       Modified     Commercial   Commercial, Modified    Commercial,
            Commercial                Manual      commercial, Desktop
                                                  Manual
In-House    Custom       Custom       Desktop,    Desktop,     Desktop,
                                      Custom      Custom       Custom,
                                                               Commercial
BOPSE       Commercial   Commercial   Commercial, Commercial, Commercial
                                      Desktop     Desktop
Are there significant differences across systems
     in assessment of operations benefits?

 Degree of operations benefits obtained (1-7 scale)

              Avg           prob(diff) 1-tail

                            small      In-house   BOPSE       N

   None             4.172 0.000***       0.053*     0.037**        29

   Small            4.662               0.027**      0.108        359

   In-house         4.442                            0.743        165
   BOPSE            4.483                                         143
Are there significant differences across
systems in assessment of operations costs?

 Degree of operations costs (1-7 scale – 7 low cost)

              Avg           prob(diff) 1-tail

                            small      In-house   BOPSE        n

   None             4.069 0.006***        0.372      0.891          29

   Small            3.714               0.021**     0.003***       360

   In-house         3.945                            0.410         165
   BOPSE            4.049                                          143
Are there significant differences across systems in
assessment of information systems data quality?

          Satisfaction with IS data quality (1-7 scale)


              Avg           prob(diff) 1-tail

                            small      In-house   BOPSE        N

  None              3.429 0.003*** 0.004***         0.001***        7

  Small             5.051                 0.914      0.313         39

  In-house          5.023                            0.124         88
  BOPSE             5.323                                          62
Conclusions
• There are a variety of ways to get MPS
• Vendor systems better for strategic planning
  – In-house systems not significantly inferior
MPS use by Function
• Manual systems or desktop used by those
  without formal MPS
• Desktop systems used by all
• Custom software more common in in-house
  systems
• Major vendor systems move away from
  manual, custom software, desktop
Operations Benefits & Costs
• Major vendor systems provide more benefits
  – But not significant except against None category
• Small systems have cost disadvantage
  – Perceived overall costs of Major Vendor systems
    rated as reducing cost
Data Quality
• Major Vendor Systems rated best
  – Small, In-House systems not significantly inferior

Manufacturing Planning Systems Use for Strategic Planning

  • 1.
    Manufacturing Planning Systems Use for Strategic Planning David L. Olson, University of Nebraska-Lincoln, dolson3@unl.edu Bongsug (Kevin) Chae, Kansas State University Chwen Sheu, Kansas State University
  • 2.
    Manufacturing Planning Systems •1960s 1970s – Continue to evolve • 1990s – ERP – Integrated systems – Expensive • MANY VARIANTS • MPS specific systems can handle planning, logistics functions – Not integrated – More affordable
  • 3.
    GMRG Data • GlobalManufacturing Research Group • Since 1985 – Four rounds to date – Same survey applied to manufacturers in 17 countries • Our dataset – 964 responses – 736 answered question concerning ERP system used
  • 4.
    Respondent Categories byCountry None Small In-house BOPSE Total Albania 8 3 11 Australia 4 17 9 20 50 Austria 1 7 6 14 China 1 8 29 15 53 Croatia 55 4 7 66 Finland 11 94 15 13 133 Germany 2 2 4 Hungary 9 16 15 10 50 Ireland 3 15 4 9 31 Italy 8 26 4 3 41 Korea 3 9 19 17 48 Macedonia 2 2 Mexico 38 8 11 57 Sweden 23 1 6 30 Switzerland 12 6 8 26 Taiwan 4 31 10 45 US 5 45 15 10 75
  • 5.
    Are there significantdifferences across systems in application to strategic planning? Degree of use of manufacturing planning & control systems for strategic planning (1-7 scale) Avg prob(diff) 1-tail small In-house BOPSE n none 1.679 .001*** 0.000*** 0.000*** 28 small 2.861 0.000*** 0.000*** 359 In-house 3.626 0.200 171 BOPSE 3.925 147
  • 6.
    What types ofsystems are used for different functions? Degree of use of manufacturing planning & control systems Category Material Inventory Labor Shop Floor Cost Planning Control Planning Control Planning None Manual Desktop Manual Manual Desktop, Manual Small Modified Commercial Commercial, Modified Commercial, Commercial Manual commercial, Desktop Manual In-House Custom Custom Desktop, Desktop, Desktop, Custom Custom Custom, Commercial BOPSE Commercial Commercial Commercial, Commercial, Commercial Desktop Desktop
  • 7.
    Are there significantdifferences across systems in assessment of operations benefits? Degree of operations benefits obtained (1-7 scale) Avg prob(diff) 1-tail small In-house BOPSE N None 4.172 0.000*** 0.053* 0.037** 29 Small 4.662 0.027** 0.108 359 In-house 4.442 0.743 165 BOPSE 4.483 143
  • 8.
    Are there significantdifferences across systems in assessment of operations costs? Degree of operations costs (1-7 scale – 7 low cost) Avg prob(diff) 1-tail small In-house BOPSE n None 4.069 0.006*** 0.372 0.891 29 Small 3.714 0.021** 0.003*** 360 In-house 3.945 0.410 165 BOPSE 4.049 143
  • 9.
    Are there significantdifferences across systems in assessment of information systems data quality? Satisfaction with IS data quality (1-7 scale) Avg prob(diff) 1-tail small In-house BOPSE N None 3.429 0.003*** 0.004*** 0.001*** 7 Small 5.051 0.914 0.313 39 In-house 5.023 0.124 88 BOPSE 5.323 62
  • 10.
    Conclusions • There area variety of ways to get MPS • Vendor systems better for strategic planning – In-house systems not significantly inferior
  • 11.
    MPS use byFunction • Manual systems or desktop used by those without formal MPS • Desktop systems used by all • Custom software more common in in-house systems • Major vendor systems move away from manual, custom software, desktop
  • 12.
    Operations Benefits &Costs • Major vendor systems provide more benefits – But not significant except against None category • Small systems have cost disadvantage – Perceived overall costs of Major Vendor systems rated as reducing cost
  • 13.
    Data Quality • MajorVendor Systems rated best – Small, In-House systems not significantly inferior