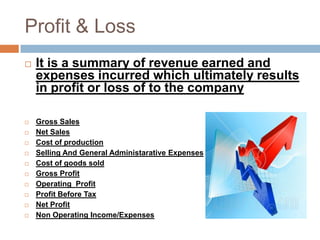
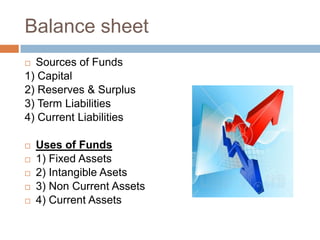
Profit & Loss and Balance
           sheet
COMPLETED BY


Names                 Roll nos.

Samad Khan            28
Ashraf Malpara        31
Yunus Shaikh     46
Raza Shaikh           47
Husain Vaghe          60
You can do cut copy paste

Yunus Shaikh
Brief about the company………
Brief about the
    company………
   Mahindra Satyam is a Brand identity of Satyam Computer Services Limited.
    Satyam Computer Services Limited was founded in 1987 by B Ramalinga
    Raju. Mahindra Satyam is a part of the USD 7.1-billion Mahindra Group
    which is one of the top 10 industrial firms based in India. The company
    offers consulting and information technology (IT) services spanning various
    sectors, and is listed on the New York Stock Exchange, the National Stock
    Exchange (India) and Bombay Stock Exchange (India). In June 2009, the
    company unveiled its new brand identity “Mahindra Satyam” subsequent to
    its takeover by the Mahindra Group’s IT arm, Tech Mahindra. Mahindra
    Satyam has offices in 35 countries.
   Mahindra Satyam, formerly known as Satyam Computer Services, on
    Monday reported an over two-fold sequential jump in consolidated net
    profit for the quarter ended December 31, 2010, to Rs 58.9 crore.
   The company had reported a consolidated net profit of Rs 23.3 crore for
    the July-September quarter of 2010.
   Revenue for the third quarter grew marginally to Rs 1,279.3 crore from
    Rs 1,242 crore in Q2, Mahindra Satyam said in a filing to the Bombay
    Stock Exchange.
   Mahindra Satyam had reported a net loss of Rs 1,250 crore for the
    year ended March, 2010, giving a first view of its financials almost
    two years after founder B Ramalinga Raju admitted to cooking the
    company's account books for years.
   "Our efforts of investing in core competencies have begun to show
    encouraging results. The recognitions that we have received from
    our partners are true reflections of our inherent capabilities...
    Mahindra Satyam is geared up for a promising year of growth and
    opportunities," Mahindra Satyam chairman Vineet Nayyar said.
   In January, 2009, former chairman and founder Ramalinga Raju
    had confessed to perpetrating a multi-crore scam wherein the
    company's profits were overstated and its assets falsified.
   Tech Mahindra bought Satyam in April, 2009, and is operating it as
    an independent company. The company had 217 clients at the end
    of December 31, 2010. Its consolidated cash and cash-equivalent
    reserves stood at Rs 3,048 crore for the reporting quarter
Chairman        CEO
Vinnet Nayyar   CP Gurnani
Balance sheet & Profit loss ppt
needs to be add

Ashraf
Malpara
Profit & Loss and Balance
sheet
Profit & Loss and Balance sheet
   A financial statement that summarizes the revenues, costs and expenses
    incurred during a specific period of time - usually a fiscal quarter or year.
    These records provide information that shows the ability of a company to
    generate profit by increasing revenue and reducing costs. The P&L
    statement is also known as a "statement of profit and loss", an "income
    statement" or an "income and expense statement".

   A financial statement that summarizes a company's assets, liabilities
    and shareholders' equity at a specific point in time. These three balance
    sheet segments give investors an idea as to what the company owns
    and owes, as well as the amount invested by the shareholders.

    The balance sheet must follow the following formula

    Assets = Liabilities + Shareholders' Equity
Samad Khan
Profit & Loss
   It is a summary of revenue earned and
    expenses incurred which ultimately results
    in profit or loss of to the company

   Gross Sales
   Net Sales
   Cost of production
   Selling And General Administarative Expenses
   Cost of goods sold
   Gross Profit
   Operating Profit
   Profit Before Tax
   Net Profit
   Non Operating Income/Expenses
Balance sheet
 Sources of Funds
1) Capital
2) Reserves & Surplus
3) Term Liabilities
4) Current Liabilities

   Uses of Funds
   1) Fixed Assets
   2) Intangible Asets
   3) Non Current Assets
   4) Current Assets
Raza
Mohammad
Mahindra Satyam 1 year chart
Mahindra Satyam this week
chart
Yesterday market of Mahindra
Satyam
   BSE 04 Mar 11 | 03:59 PM
    63.60   0.35 (0.55%)
   NSE 04 Mar 11 | 03:59 PM
    63.65   0.25 (0.39%)
Conclusion
   SWOT Analysis
    This SWOT Analysis company profile is a crucial resource for industry executives
    and anyone looking to quickly understand the key information concerning Mahindra
    Satyam’s business.
    Business Review’s “Mahindra Satyam SWOT Analysis & Company Profile” reports
    utilize a wide range of primary and secondary sources, which are analyzed and
    presented in a consistent and easily accessible format. Business Review strictly
    follows a standardized research methodology to ensure high levels of data quality
    and these characteristics guarantee a unique report.


   Reasons To Buy
    Quickly enhance your understanding of the company.
    Obtain details and analysis of the market and competitors as well as internal and
    external factors which could impact the industry.
    Increase business/sales activities by understanding your competitors’ businesses
    better.
    Recognize potential partnerships and suppliers.
Mahindra satyam (afs)

Mahindra satyam (afs)

  • 1.
    Profit & Lossand Balance sheet
  • 2.
    COMPLETED BY Names Roll nos. Samad Khan 28 Ashraf Malpara 31 Yunus Shaikh 46 Raza Shaikh 47 Husain Vaghe 60
  • 3.
    You can docut copy paste Yunus Shaikh
  • 4.
    Brief about thecompany………
  • 5.
    Brief about the company………  Mahindra Satyam is a Brand identity of Satyam Computer Services Limited. Satyam Computer Services Limited was founded in 1987 by B Ramalinga Raju. Mahindra Satyam is a part of the USD 7.1-billion Mahindra Group which is one of the top 10 industrial firms based in India. The company offers consulting and information technology (IT) services spanning various sectors, and is listed on the New York Stock Exchange, the National Stock Exchange (India) and Bombay Stock Exchange (India). In June 2009, the company unveiled its new brand identity “Mahindra Satyam” subsequent to its takeover by the Mahindra Group’s IT arm, Tech Mahindra. Mahindra Satyam has offices in 35 countries.  Mahindra Satyam, formerly known as Satyam Computer Services, on Monday reported an over two-fold sequential jump in consolidated net profit for the quarter ended December 31, 2010, to Rs 58.9 crore.  The company had reported a consolidated net profit of Rs 23.3 crore for the July-September quarter of 2010.  Revenue for the third quarter grew marginally to Rs 1,279.3 crore from Rs 1,242 crore in Q2, Mahindra Satyam said in a filing to the Bombay Stock Exchange.
  • 6.
    Mahindra Satyam had reported a net loss of Rs 1,250 crore for the year ended March, 2010, giving a first view of its financials almost two years after founder B Ramalinga Raju admitted to cooking the company's account books for years.  "Our efforts of investing in core competencies have begun to show encouraging results. The recognitions that we have received from our partners are true reflections of our inherent capabilities... Mahindra Satyam is geared up for a promising year of growth and opportunities," Mahindra Satyam chairman Vineet Nayyar said.  In January, 2009, former chairman and founder Ramalinga Raju had confessed to perpetrating a multi-crore scam wherein the company's profits were overstated and its assets falsified.  Tech Mahindra bought Satyam in April, 2009, and is operating it as an independent company. The company had 217 clients at the end of December 31, 2010. Its consolidated cash and cash-equivalent reserves stood at Rs 3,048 crore for the reporting quarter
  • 7.
    Chairman CEO Vinnet Nayyar CP Gurnani
  • 8.
    Balance sheet &Profit loss ppt needs to be add Ashraf Malpara
  • 9.
    Profit & Lossand Balance sheet
  • 10.
    Profit & Lossand Balance sheet  A financial statement that summarizes the revenues, costs and expenses incurred during a specific period of time - usually a fiscal quarter or year. These records provide information that shows the ability of a company to generate profit by increasing revenue and reducing costs. The P&L statement is also known as a "statement of profit and loss", an "income statement" or an "income and expense statement".  A financial statement that summarizes a company's assets, liabilities and shareholders' equity at a specific point in time. These three balance sheet segments give investors an idea as to what the company owns and owes, as well as the amount invested by the shareholders. The balance sheet must follow the following formula Assets = Liabilities + Shareholders' Equity
  • 11.
  • 12.
    Profit & Loss  It is a summary of revenue earned and expenses incurred which ultimately results in profit or loss of to the company  Gross Sales  Net Sales  Cost of production  Selling And General Administarative Expenses  Cost of goods sold  Gross Profit  Operating Profit  Profit Before Tax  Net Profit  Non Operating Income/Expenses
  • 13.
    Balance sheet  Sourcesof Funds 1) Capital 2) Reserves & Surplus 3) Term Liabilities 4) Current Liabilities  Uses of Funds  1) Fixed Assets  2) Intangible Asets  3) Non Current Assets  4) Current Assets
  • 14.
  • 15.
  • 16.
  • 17.
    Yesterday market ofMahindra Satyam  BSE 04 Mar 11 | 03:59 PM 63.60 0.35 (0.55%)  NSE 04 Mar 11 | 03:59 PM 63.65 0.25 (0.39%)
  • 18.
    Conclusion  SWOT Analysis This SWOT Analysis company profile is a crucial resource for industry executives and anyone looking to quickly understand the key information concerning Mahindra Satyam’s business. Business Review’s “Mahindra Satyam SWOT Analysis & Company Profile” reports utilize a wide range of primary and secondary sources, which are analyzed and presented in a consistent and easily accessible format. Business Review strictly follows a standardized research methodology to ensure high levels of data quality and these characteristics guarantee a unique report.  Reasons To Buy Quickly enhance your understanding of the company. Obtain details and analysis of the market and competitors as well as internal and external factors which could impact the industry. Increase business/sales activities by understanding your competitors’ businesses better. Recognize potential partnerships and suppliers.