Download as PDF, PPTX


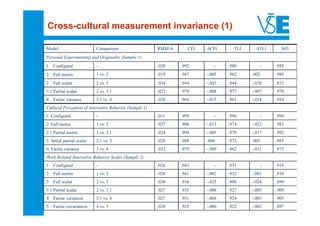
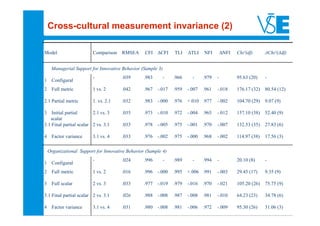
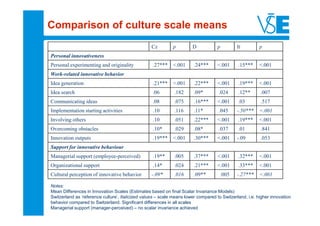


The study analyzes cultural differences in innovative behavior across four countries: the Czech Republic, Germany, Italy, and Switzerland. It aims to create an independent measure of innovative behavior and assess how culture, alongside other factors, impacts innovation. Findings indicate that Swiss participants exhibited the highest innovative behavior, while Germans were less innovative, with significant influences from employment status, gender, and occupation.


