1. Lowering respirable dust at an iron ore concentrator plant through
improved ventilation practices
A.B. Cecala, J.A. Zimmer, J.F. Colinet, & R.J. Timko
National Institute for Occupational Safety and Health, Pittsburgh Research Laboratory, Pittsburgh, PA, USA
INTRODUCTION
In August 2000, the United Steelworkers of America
held a health and safety workshop in Eveleth, Min-
nesota to discuss methods and techniques to improve
working conditions for its membership in the iron
ore mines in Minnesota and Michigan. For this
workshop, the National Institute for Occupational
Safety and Health (NIOSH) was requested to pro-
vide a 90-minute presentation on dust control re-
search applicable to the iron ore industry. Shortly
after this workshop, NIOSH was contacted by the
Tilden Mining Company LC who stated their inter-
est in working with NIOSH and the United Steel-
workers of America union membership at their op-
eration to lower respirable dust concentrations in the
grinding and concentrator mill. Shortly after receiv-
ing this request, a trip was scheduled (April 2001)
for two individuals from NIOSH’s Respiratory Haz-
ards Control Branch to visit the Tilden operation in
Ishpeming, Michigan. The first part of this visit was
a meeting with all three parties to discuss a number
of potential dust control areas of interest. After this
meeting, NIOSH was given a tour of the entire facil-
ity with special emphasis given to the grinding and
concentrator mill. Shortly after this visit, NIOSH
submitted a proposal for a cooperative research ef-
fort to reduce respirable dust levels in the grinding
and concentrator facility to the Tilden Mining Com-
pany and the United Steelworkers of America. A
short time later, NIOSH received notification that
both parties were in agreement and wanted to pro-
ceed on this cooperative research effort.
This cooperative effort has been composed of
three different studies at the Tilden grinding and
concentrator facility: March 11-13, 2002, March 5-
7, 2003, and March 9-11, 2004. The first study was
mainly a baseline analysis to determine dust levels
throughout this huge facility and determine research
areas that could have the most significant impact on
lowering dust. The next two visits were directed
towards specific areas of dust control technology.
All three studies were performed in March for a
number of reasons. First, the Tilden grinding and
concentrator mill would switch from producing
magnetite to hematite throughout the course of the
ABSTRACT: A cooperative research effort was established between the Tilden Mining Company LC, the
United Steelworkers of America, and the National Institute for Occupational Safety and Health to lower res-
pirable dust levels in an iron ore grinding and concentrator plant. This cooperative effort involved three field
studies to evaluate different techniques to lower respirable dust levels. The greatest impact on lowering res-
pirable dust concentrations throughout this facility was achieved through ventilation changes. The most sig-
nificant improvement was realized by changing the ventilation profile throughout the entire facility. The ven-
tilation to this grinding and concentrator facility was provided by approximately 40 roof fans operating in
either the intake or exhaust mode. The operation of these fans was significantly changed in an attempt to pro-
vide more of a directional flow pattern throughout the facility, as well as to more closely balance the intake
and exhaust air volume. This change accounted for a 31 pct reduction in respirable dust levels in the primary
grinding area of the mill. Another successful modification was to improve the sealing of a reclaim tunnel to
the outside and by barricading the access point from the reclaim tunnel to the concentrator plant. This mini-
mized the dust liberated in the conveyor tunnels from traveling through the reclaim tunnel and into the plant.
These two modifications illustrate the impact that improvements in ventilation can have on lowering respir-
able dust concentrations in iron ore processing facilities.
2. year. Hematite is a dustier product and was typi-
cally produced from November through March. All
parties agreed that this research should be performed
during the production of hematite in an effort to
have the greatest impact on lowering respirable dust
concentrations. Another factor in the timing of this
research involved traveling in the winter months.
The Tilden operation is in the upper peninsula of
Michigan, where winters can be, and usually are
very severe. In March, winter conditions usually
begin to ease somewhat, facilitating personnel going
onto the roof of the structure to check on fan opera-
tion. The last factor for performing this research
during the winter months is because the facility is
typically closed to limit the inflow of cold air into
the structure.
The grinding and concentrator mill at the Tilden
operation was an 87,300 m2
(940,000 ft2
) structure
with an internal air volume of 1,274,000 m3
(45,000,000 ft3
). The ventilation provided to this
building was through a network of roof fans that can
be used, for the most part, in either an intake or ex-
haust ventilation mode. In addition to the numerous
roof-powered fans, each of two replacement air sys-
tems supplied 4250 m3
/min (150,000 cfm) of heated
intake air in the basement of the structure, one on
the eastern and the other on the western side of the
structure. With this setup, the building had an ex-
haust capacity of approximately 121,776 m3
/min
(4,300,000 cfm) and an intake air capacity of 23,500
m3
/min (830,000 cfm) based upon the rated capacity
of the fans. Again, 8500 m3
/min (300,000 cfm) of
this air was from the intake air heaters. The roof-
mounted fans are the only source of powered ex-
haust ventilation to the facility, although there may
have been some natural ventilation as the warm air
within the structure rises and escapes through cracks
or openings in the exterior walls or the roof. The
amount of natural ventilation was minimal in com-
parison to the amount of air exhausted through the
roof fans.
The ventilation setup at this facility changed
somewhat over the course of the year based on out-
side air temperatures. Typically, the air exhausted
from the structure was significantly less during the
winter months, with the goal being to provide
enough ventilation to remove contaminants while
trying to maintain an adequate temperature within
the structure. During the summer months, the facil-
ity is more open to the outside air and the exhaust air
from the roof fans is maximized to remove the heat
generated from all the electrical motors and other
processes within the facility.
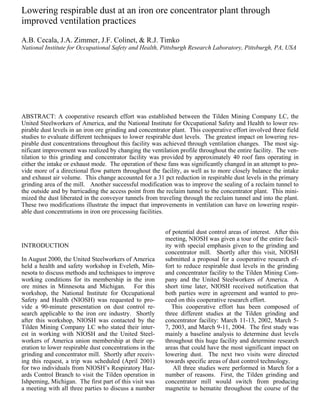
One last area to consider for this research effort is
the location of various ore processes within the
structure. Because some of the processes are more
inherently dusty, certain areas of the grinding and
concentrator facility typically have higher dust lev-
els. Figure 1 shows an overview of the major proc-
esses in this facility. The raw ore mined at the op-
eration is taken to a primary crusher where it is sized
to less than 25.4 cm (10 inches). The ore is then
conveyed to a covered storage building that is lo-
cated along the entire northern portion of the grind-
ing and concentrator facility. When the ore is ready
to be processed, it flows by gravity into the facility
onto one of 12 conveyors lines which brings the ore
up a slope that feeds a primary grinding mill. Each
of these 12 primary grinding mills then feed 2 peb-
ble mills that further reduce the size of the material.
After the ore exits the pebble mills and has been
properly sized, it enters thickener tanks, then flota-
tion tanks, and then back into concentrator thickener
tanks. From this point, it enters concentrate slurry
tanks and is filtered. The ore exits the structure and
is delivered to the palletizing building.
The 12 conveyor lines and the primary grinding
mills are located in the northern portion of the struc-
ture, which encompasses approximately half of the
total area of the building. This is also the dustiest
area of the structure and Tilden management re-
quires that all personnel wear personal protective
respiratory equipment when in this portion of the fa-
cility. The 24 pebble mills encompass approxi-
mately a quarter of the facility. The last quarter is
made up of the concentrator, slurry, thickener tanks,
and filtering area. The southern portion of the build-
ing is much less dusty and does not require work
personnel to wear respiratory protection.
Figure 1. Location of major processes in grinding and
concentrator building.
ACKNOWLEDGEMENT
The authors would like to acknowledge Leonard R.
Parker, Manager-Safety & Environmental, Dave
Wickstrom, (Previous) Union Safety Chair, Bill
Vivian (Union Safety), Greg Magnuson (Ventila-
3. tion), Dan Sleeman (Ventilation), and Scott Rasmus-
sen, Area Manager-Concentrator Operations, for all
their help and assistance in this research effort.
SAMPLING INSTRUMENTATION
The following section describes some of the instru-
mentation used in this cooperative research effort.
Although many types of monitors and instruments
were used, this discussion will be limited to the dust
monitoring and air flow instruments used in the two
ventilation research efforts discussed in this report.
Gravimetric dust sampling packages and PDR in-
stantaneous dust sampling devices will be discussed,
followed by the two types of instruments used for
measuring air velocity.
Gravimetric dust sampling packages consisted of
two sampling units, each containing a sampling
pump, flexible tygon tubing, a respirable dust classi-
fier, and a filter. All dust samples were collected
with the 10-mm Dorr-Oliver cyclone, which classi-
fies the respirable portion of dust, (usually consid-
ered having an aerodynamic diameter of 10 microns
or less). Each gravimetric pump was calibrated to a
flow rate of 1.7 liters/min, (the Mine Safety and
Health Administration’s (MSHA) required flow rate
for the metal/non-metal industry). The respirable
dust classified by the 10-mm cyclone was deposited
on a 37-mm dust filter cassette. These filters were
pre- and post-weighed to the nearest microgram on a
microbalance at the Pittsburgh Research Laboratory
(PRL) and the results of each sampling unit’s filters
were averaged together to determine an average res-
pirable dust mass. From this mass value, the aver-
age respirable dust concentration over the sampling
period was mathematically derived.
The instantaneous monitors used for this testing
were the Personal Data RAM (PDR) from MIE, Inc.
of Bedford MA. This is a real-time aerosol sampler
that measures the respirable dust concentration
based upon the light scattering of particles drawn
through an internal sensing chamber. The respirable
dust levels obtained by light-scattering were re-
corded on an internal data logger and then
downloaded to a laptop computer at the end of each
sampling shift. After the dust traveled through the
PDR, it was deposited on a filter cassette, identical
to that of a gravimetric sampler. A new filer cas-
sette was used for each shift of testing and was ana-
lyzed with the other gravimetric samples upon re-
turning to PRL. For each sampling location, the
PDR dust value was divided into the average gra-
vimetric concentration to determine a correction fac-
tor, which was then applied to all the measurements
taken with the corresponding PDR for that shift.
This allowed the instantaneous respirable dust con-
centrations to be corrected to equivalent measure-
ments taken using the gravimetric method. All PDR
instrument values shown in this report have been
corrected in this manner. Using both of these types
of respirable dust monitoring equipment provided a
good profile of average dust concentrations through-
out the sampling period, as well as variations and
changes in respirable dust concentrations relative to
time throughout the workday.
In addition to the respirable dust measurements,
airflow measurements were taken using a Solent
Velometer from Gill Instruments Limited of Hamp-
shire, England to evaluate the airflow at different lo-
cations throughout the grinding and concentrator
mill building. This velometer is an ultrasonic ane-
mometer that operates by transmitting an ultrasonic
pulse along the wind path and measuring the time
taken to reach the receiver. In essence, the faster the
wind speed, the faster the pulse reaches the receiver.
The velometer was held stationary and a 10-sec
sample period was started. At the end of the 10 sec-
onds, the instrument provided average, maximum
and minimum air velocities for that specific time pe-
riod.
In addition, velocity measurements were also
taken with a vane-anemometer from Davis Instru-
ments of Baltimore, MD. The Davis anemometer
was a 10 cm (4-in) diameter, eight-blade instrument
that can measure air velocities from 0.15 – 25 m/s
(30 to 5000 ft/min). It contains a balanced vane
wheel that rotates in response to airflow. Rotations
are mechanically transmitted to an indicator through
a clock-like movement.
TESTING AND RESULTS
In this cooperative research effort, a number of dif-
ferent areas were investigated in an effort to lower
respirable dust concentrations at the Tilden iron ore
grinding and concentrator facility. It should be
noted that, although the goal was to lower respirable
dust concentrations throughout the entire facility, the
main priority was the primary grinding area. In this
report, we will describe the two most successful ef-
forts, both of which were directly tied to ventilation
changes. The first area to be presented is the impact
that lowering the amount of ventilation flowing
through the reclaim tunnel had on lowering respir-
able dust levels in the western portion of the struc-
ture. The second area is the efforts to improve the
ventilating airflow pattern throughout the entire
grinding and concentrator mill using the roof-
mounted fans in a more direct and balanced flow
pattern and the impact that this had on respirable
4. dust levels, specifically in the primary grinding mill
area.
Improving ventilation and dust in reclaim tunnel
When performing our baseline testing during the
first evaluation in March 2002, it was determined
that dust levels increased from the eastern to the
western portion of the reclaim tunnel. The reclaim
tunnel is a 2.1 m (7 ft) wide by 2.3 m (7 ½ ft) high
opening that runs the entire length of the facility
along the northern portion of the structure. The
function of the reclaim tunnel is to provide access
for workers and equipment to the 12 conveyor lines.
Workers are not normally in the reclaim tunnel
unless they need to access one of the discharge
chutes or conveyors, which moves iron ore from the
storage area to one of the 12 primary grinding mills.
During a walk-through, it appeared that there was a
substantial amount of air moving through this tunnel
and there appeared to be no practical reason for this
amount of ventilation.
To focus on the reclaim tunnel, a test sequence
was performed on the daylight shift of March 6,
2002. Eleven different dust sampling locations pro-
vided a profile of respirable dust concentrations
along the tunnel, as well as in some of the conveyor
slopes. These monitors were started over a one-and-
a-half hour time period and sampled for between
five and six hours. Six of these samples were lo-
cated along the reclaim tunnel, with a seventh sam-
ple location at the midpoint of a lower north-south
tunnel that connected the reclaim tunnel to the main
building basement. This connecting tunnel was lo-
cated between primary mills 10 and 11 and con-
nected the reclaim tunnel to the primary grinding
and concentrator mill about 9 m (30 ft) below the
main working elevation. The remaining four sam-
pling locations were at conveyor transfer locations
in tunnels 6, 7, 9, and 10. These 11 dust sampling
locations provided a good overview of respirable
dust concentrations for the tunnel In addition, veloc-
ity measurements were also taken along the entire
length of the reclaim tunnel, in the connecting tunnel
to the basement of the grinding and concentrator
building, and in each of the 12 conveyor slope tun-
nels.
The dust concentrations and ventilation measure-
ments taken are shown in Figure 2. The values
listed in this figure show a correlation between res-
pirable dust concentrations and airflow measure-
ments. From a dust control standpoint, respirable
dust levels increased as one moved from the eastern
to the western side of the reclaim tunnel. Once the
airflow traveled a short distance past tunnel 11, it
would make a 90 degree turn and flow down the
connecting tunnel to the main structure. As seen,
the respirable dust concentration in this connecting
tunnel was lower than the eastern dust values (tun-
nels 1-11) along the reclaim tunnel because the dust
Figure 2. Respirable dust and airflow measurements during
baseline testing in 2002.
was being diluted with an additional 144 m3
/min
(5,100 cfm) of ventilating airflow that was coming
from conveyor tunnel 12 and was traveling in the re-
claim tunnel from west to east. Although no dust
measurements were taken, it is assumed that the res-
pirable dust concentration of this air was very low.
When this airflow was combined with the airflow
traveling from east to west, it diluted the respirable
dust concentration down to 0.65 mg/m3
. The veloc-
ity measurements in the reclaim tunnel show the
magnitude of airflow in this tunnel. The airflow di-
rection in the conveyor slopes varied with some air
moving up the slope towards the grinding and con-
centrator building and others with air moving down
towards the reclaim tunnel. For those tunnels that
were ventilating downwards, they were introducing
respirable dust generated during conveying and at
transfer points into the reclaim tunnel. As this air
moved from east to west in the tunnel, each addi-
tional conveyor slope would add additional dust to
the airstream.
After analyzing the data from this test, researchers
concluded that the 620 m3
/min (21,900 cfm) of air
being discharged into the basement of the structure
from the connecting tunnel needed to be reduced.
This volume of air had a respirable dust concentra-
tion of 0.65 mg/m3
, which was introducing a signifi-
cant quantity of dust into the grinding and concen-
trator mill building. This volume of dusty air caused
respirable dust concentrations to be higher in the
basement and first floor of the structure in the west-
ern portion of the building, as compared to the cen-
ter or right portions of the structure.
A factor in the amount of air moving through the
reclaim tunnel was that the seal at the eastern end of
5. the reclaim tunnel was badly damaged and was al-
lowing a significant quantity of air into the tunnel.
Air measurements at this location indicated that ap-
proximately 144 m3
/min (5,100 cfm) of air was
coming into the reclaim tunnel from this damaged
seal.
The other area of concern was the amount of air
flowing from the reclaim tunnel into the grinding
and concentrator structure basement from the con-
necting tunnel. Through discussions with all the co-
operating parties in this research effort, it was de-
cided to replace the damaged seal at the eastern end
of the tunnel and to install a seal where the connect-
ing tunnel accessed the main structure.
When returning for the 2003 study, NIOSH was
pleased with the quality of the seals installed at both
locations by Tilden personnel, shown in Figure 3a,b.
The first test performed during this study was to re-
peat the evaluation of the reclaim tunnel area. Iden-
tical respirable dust sampling and airflow measure-
ment locations were used as performed in the
previous study.
Figure 3a. Seal replaced at eastern end of reclaim tunnel to
access outside
Figure 3b. Seal installed where connecting tunnel accesses
main structure in basement of facility.
The results of this test can be seen in Figure 4.
As shown, dust levels constantly increased when
moving from the east to west in the reclaim tunnel.
For a number of areas, one could visually see dust
flowing down the conveyor slope and into the re-
claim tunnel. Average respirable dust levels in-
creased from 0.21 mg/m3
between tunnels 2 and 3 to
2.44 mg/m3
between tunnels 10 and 11. Respirable
dust levels in the lower connecting tunnel averaged a
concentration of 1.27 mg/m3
over the entire sam-
pling period.
Figure 4. Respirable dust and airflow measurements during
2003 testing after installation of seals.
When comparing the results from pre to post-seal
conditions, there are a number of areas that standout.
First, during pre-seal testing, there was 144 m3
/min
(5100 cfm) of air flowing from the door at the east-
ern most portion of the reclaim tunnel; this was re-
duced by 76 pct to a level of 34 m3
/min (1200 cfm)
under post-seal conditions. In addition, there was a
reversal in the airflow direction in a number of the
sloped conveyor tunnels. For the lower numbered
tunnels, the air quantity moving up or down the tun-
nel during post-seal was substantially lower than
during pre-seal conditions. Conveyor tunnel 9
showed a significant increase in airflow quantity
traveling up the tunnel with 215 m3
/min (7600 cfm)
for post-seal, as compared to 2.4 m3
/min (5100 cfm)
for pre-seal. The effectiveness of the barricade on
the lower level connecting tunnel is also verified by
these values. The airflow measured in the connect-
ing tunnel during post-seal was 22.7 m3
/min (800
cfm), which is a 96 pct reduction from the 620
m3
/min (21,900 cfm) measured during pre-seal con-
ditions.
When considering the dust values, it may appear
that improving the seal in the reclaim tunnel was
counter productive because respirable dust concen-
trations increased at some locations. This increase
was first noticed at the midpoint for mills 9 and 10
and remained evaluated at the next two sample loca-
6. tions. The dust liberated in the various conveyor
slope areas and drawn into the reclaim tunnel was
diluted by a much lower quality of air, and thus, the
reason for the higher dust concentration at the west-
ern portions. To consider the true impact of the
seals on lowering respirable dust flowing into the
grinding and concentrator building from the reclaim
tunnel, both the airflow and the respirable dust con-
centrations must be considered. For pre-seal test
conditions in 2002, there was 620 m3
/min (21,900
cfm) of air traveling into the main structure at a res-
pirable dust concentration of 0.65 mg/m3
. Through
a simple calculation, it was determined that 24,188
mg of respirable dust was being delivered into the
main building every hour under pre-seal conditions.
And although the respirable dust levels are higher
under post-seal conditions at a level of 1.27 mg/m3
,
when one considers this value with the reduction in
airflow, only 1729 mg of respirable dust is being de-
livered into the main building every hour, a 93 pct
reduction over pre-seal conditions.
The most significant benefit from the installation
of seals and minimizing the airflow through the re-
claim tunnel is the significant reduction in the
amount of respirable dust being introduced into the
western portion of the building. In the pre-seal test-
ing, there was a 67 pct increase in respirable dust
concentrations at primary mill 12 (0.67 mg/m3
) on
the western side of the building as compared to res-
pirable dust levels at mill 1 (0.44 mg/m3
) on the
eastern side. When the exact study was performed
again with post-seal conditions, both dust measure-
ments were almost identical: 0.84 mg/m3
at mill 12
and 0.87 mg/m3
at mill 1. Although the respirable
dust concentrations at both locations went up, this is
a relative value based on the amount of production
and ore being processed at any given time period.
Respirable dust levels being identical on the eastern
and western side of the structure indicates the impact
that the seals had on minimizing the amount of air-
flow traveling through the reclaim tunnel.
Entire structure ventilation
During the testing performed during 2003, an entire-
structure ventilation change was performed which
indicated promising results. This led to a more in-
depth study performed during 2004 which involved
changing the quantity of air that entered and was ex-
hausted from the structure. During the first day of
testing, the operation’s normal ventilation setup was
evaluated. Figure 5 shows a summary of this venti-
lation setup with the exhaust and intake fans differ-
entiated by color-coding of the fan symbol. To
evaluate this original ventilation design, the struc-
ture was broken down into three distinct areas: pri-
mary grinding (northern-most portion), secondary
grinding with pebble mills, and filtering and flota
tion (southern-most portion). Respirable dust sam-
plers were located in these three areas, with the
greatest focus being on the primary grinding mills.
This original ventilation setup included twelve ex-
haust fans in the primary grinding area, eight ex-
haust fans and three intake fans in the secondary
grinding area, and nineteen exhaust fans in the filter
and flotation area. The only other mechanical venti-
lation provided was from two intake heater fans lo-
cated at the base of the facility, one located on the
east and the other on the west side of the building.
The volume of air being exhausted from the struc-
ture was 54,670 m3
/min (1,930,500 cfm), as com-
pared to 17,000 m3
/min (600,000 cfm) being
brought into the structure. These ventilation air vol-
umes were calculated based upon the fan quantities
provided by the facility and the assumption that all
the fans were operating at their rated output. The
two intake heater fans accounted for 8,500 m3
/min
(300,000 cfm), or 50 pct of the total intake airflow.
Dust sampling under this ventilation setup was per-
formed for approximately 20 hours of testing.
Figure 5. Baseline or normal ventilation setup.
The imbalance between the intake and exhaust air
volumes with this ventilation setup was substantial;
therefore it was decided to modify the ventilation to
a more balanced design. It should to be noted that
although the goal was to lower respirable dust con-
centrations throughout the entire facility, the main
priority was to lower respirable dust concentrations
in the primary grinding area. Dust levels in the pri-
mary grinding area were higher than in the other ar-
eas because of the amount of dust liberated from the
numerous conveyor lines feeding the primary grind-
ing mills, as well as the amount of dust liberated
from the mills themselves.
To focus on this area, a ventilation change was
initiated as shown in Figure 6. The two intake
heater fans continued to bring a significant portion
of intake air into the facility. For this modified de-
sign, there were eleven exhaust fans operating in the
primary grinding area, twelve intake fans in the sec-
7. ondary grinding area, and eight exhaust fans operat-
ing in the filtering and flotation area. The volume of
air being exhausted from the structure was approxi-
mately 26,600 m3
/min (940,500 cfm), with ap-
proximately 29,600 m3
/min (1,045,000 cfm) brought
into the structure through the roof intake fans and
two heater fans. This ventilation design was again
tested for approximately 20 hours.
Figure 6. Ventilation setup # 2.
During this phase of testing, a smoke flare was
released into one of the intake fans over the pebble
mill. Since properly operating intake fans should
move an air parcel 10 fan diameters before being re-
duced to 10 pct of the fan’s air velocity, the roof-
mounted fans should introduce a parcel of air into
the lower parts of the building (Industrial Ventila-
tion, 2001). These roof-mounted fans are all 1.2m
(4 ft) in diameter and should introduce a parcel of air
at least 12.2 to 15.2 m (40 to 50 ft) into the structure.
Since this testing was performed during the winter
months, introducing cold outside air into the struc-
ture should also assist the air parcel’s ability to flow
down into the lower levels of the structure. From
visual observations during this smoke flare release,
it appeared that the intake fan chosen for this testing
was not operating at the calculated airflow. The
smoke remained within the top one-quarter of the
structure and tended to drift towards the southern
portion of the building (toward the flotation and fil-
tration area). As test personnel walked through the
secondary grinding area, it was very difficult to feel
the intake air being delivered into the structure by
the intake fans. Since the walkway was only 30 ft
below the intake fans, airflow should have been per-
ceivable at this level.
Because the intake air appeared to be drifting to-
wards the flotation and filtration area, it was decided
to modify the ventilation setup to provide a greater
quantity of the intake air moving in the northern di-
rection towards the primary grinding mills. Figure 7
indicates the second modification to the ventilation
design which was evaluated for approximately 8
hours during the last day of testing. This ventilation
setup was composed of 24 exhaust fans and 12 in-
take fans, along with the two heater intake fans. The
volume of air exhausted from the structure was ap
proximately 32,000 m3
/min (1,128,000 cfm), with
29,600 m3
/min (1,045,000 cfm) being brought into
the structure through the roof intake fans and two
heater fans. The amount of intake air was identical
to the previous test, but the exhaust was increased in
an attempt to decrease the flow toward the flotation
and filtration area while increasing the airflow to the
primary grinding mill area.
Figure 7. Ventilation setup # 3.
Table 1 shows the average respirable dust con-
centration as determined by the instantaneous respir-
able dust monitors used in this study and provides a
comparison of the three different ventilation designs
tested. Obviously, the last ventilation design was
the most effective at lowering respirable dust levels,
Table 1. Average respirable dust concentrations in mg/m3
for
three ventilation setups.
__________________________________________________
Location Setup # 1 Setup # 2 Setup # 3
Day Night Day Night Day
__________________________________________
Primary # 2 1.06 1.21 0.66 0.38 0.44
Primary # 4 0.72 0.70 0.59 0.59 0.45
Primary # 6 1.15 1.34 1.37 1.49 0.98
Primary # 8 1.23 1.34 1.18 1.23 0.86
Primary # 10 - 0.97 1.05 0.91 0.72
Primary # 12 0.67 0.72 0.79 0.88 0.75
Average 0.97 1.05 0.94 0.91 0.72
Pebble # 1 0.32 0.38 0.38 0.31 0.29
Pebble # 3 0.42 0.42 0.47 0.51 0.42
Pebble # 6 0.34 0.35 0.48 0.50 0.35
Pebble # 9 0.49 0.50 0.51 0.56 0.49
Pebble # 12 0.38 0.41 0.36 0.43 0.38
Average 0.39 0.41 0.44 0.46 0.38
Flotation # 3 0.25 0.32 0.35 0.34 0.24
Flotation # 9 0.27 0.34 0.45 0.40 0.31
Average 0.26 0.33 0.40 0.37 0.27
particularly in the primary grinding area, which was
the main area of concern. When compared to the
first two ventilation designs, this design lowered
respirable dust concentrations in the primary grind-
ing area by 31 and 25 pct, respectively. This is a
very significant reduction when one considers it was
achieved by using the existing fans and simply vary-
ing the intake and exhaust flow quantities. Addi-
tionally, respirable dust levels were also slightly
8. lower in the pebble mill and the flotation and filtra-
tion areas with the last ventilation setup. This study
indicates the impact that ventilation can have on
lowering respirable dust levels throughout a large-
volume iron ore processing structure.
CONCLUSIONS
A cooperative research effort was established be-
tween the Tilden Mining Company LC, the United
Steelworkers of America, and the National Institute
for Occupational Safety and Health in an effort to
lower respirable dust levels in Tilden’s grinding and
concentrator facility located in Ishpeming, Michi-
gan. The two most significant impacts in this coop-
erative effort dealt with ventilation changes. The
first change was to minimize the amount of air trav-
eling through a reclaim tunnel before flowing into
the basement of the structure. As the air moved
through this reclaim tunnel, it entrained a substantial
quantity of respirable dust generated from the twelve
conveyor lines. As the air moved through this re-
claim tunnel, it entrained a substantial quantity of
respirable dust generated from the twelve conveyor
lines. As this dust laden air then entered the main
structure through a connecting tunnel, it caused res-
pirable dust levels to be 61 pct higher on the western
side of the building as compared to the eastern side.
In an effort to eliminate this occurrence, a seal on
the very eastern side of the structure, where the re-
claim tunnel accessed the outside environment, was
rebuilt. In addition, a new seal was installed where
the reclaim tunnel accessed the main structure. Both
of these seals substantially lowered the amount of air
flowing through the reclaim tunnel and entering the
main structure. Although this lower air flow caused
dust levels in the reclaim tunnel to be higher at some
locations, this was not a significant factor since per-
sonnel are not normally in this tunnel. The benefit
of this change was that respirable dust levels were
lowered in the western side of the main grinding
area to a point that they were the same as on the
eastern side of the structure.
The second and more significant improvement
identified in this cooperative research effort was ac-
complished by modifying the way the entire struc-
ture was ventilated. The effort involved monitoring
respirable dust levels throughout the entire structure
for three ventilation schemes. The first setup tested
was as the structure was normally ventilated (by Til-
den). For this setup, the exhausted air was over
three times greater than the intake air, which caused
the structure to be under negative pressure. For the
second setup, the ventilation was changed to a more
balanced design and improved airflow pattern within
the structure. Based upon the configuration of the
fans, it was decided to bring the intake air into the
building at the center of the structure and exhaust it
northward toward the primary grinding mills and
southward toward the flotation and filtering areas.
A smoke flare released into one of the intake fans
indicated that a substantial portion of the air was
drifting south towards the flotation and filtering ar-
eas, than was flowing north. Moreover, although the
intent was to lower respirable dust levels throughout
the entire structure, the main priority was to lower
levels in the primary grinding area, where workers
were required to wear respirators.
A third ventilation setup was tested which in-
creased the number of exhaust fans in the northern
portion and reduced them in the southern portion of
the structure. This last ventilation design was the
most effective of the three tested and provided a 31
pct reduction in respirable dust levels in the primary
grinding area when compared to levels measured for
the first setup. Respirable levels were also slightly
lower in the pebble mill and flotation and filtration
areas. This is a substantial reduction when consider-
ing that it came about by creating a more balanced
flow pattern, but still using the same amount of fans.
In closing, both of these research efforts indicate
the significant and cost-effective impacts that venti-
lation changes can have on lowering respirable dust
levels in a very large iron ore facility.
REFERENCES
Industrial Ventilation – A Manual of Recommended Practices,
2001 – 24th
edition (American Conference of Governmental
Industrial Hygienist: Cincinnati)