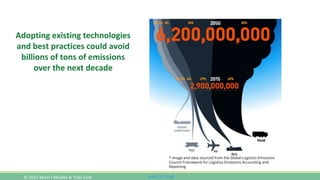
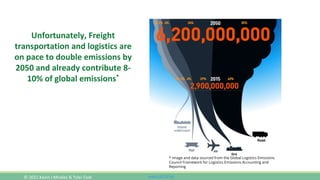
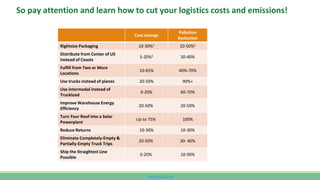
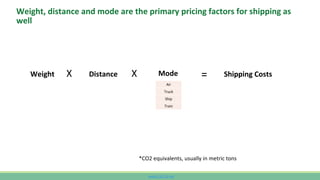
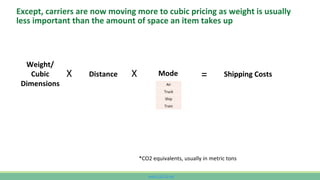
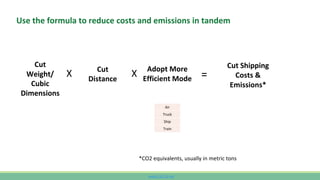
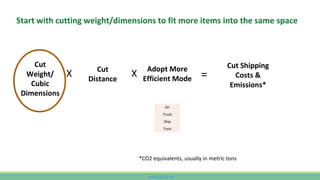
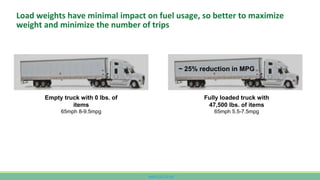
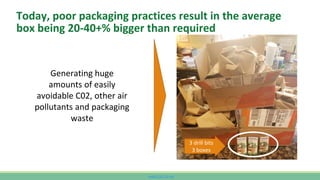
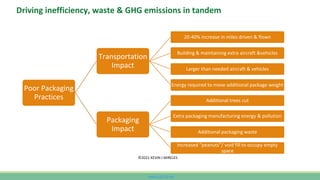
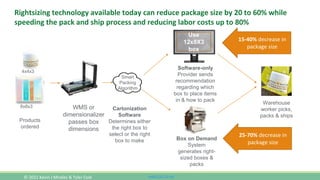
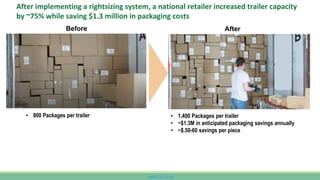
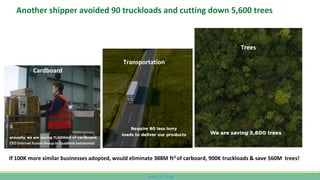
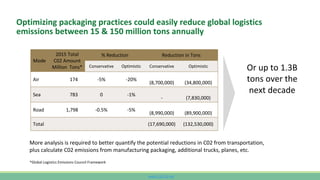
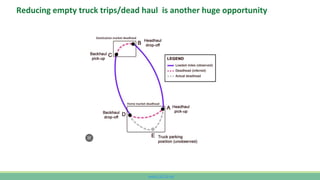
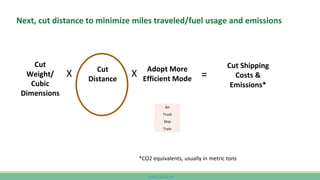
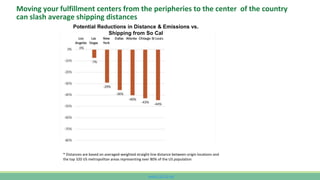
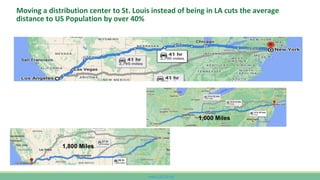
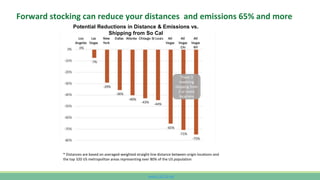
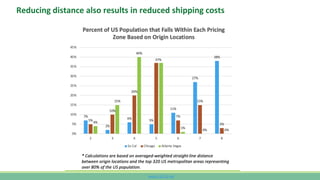
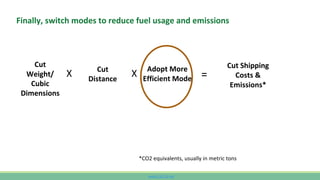
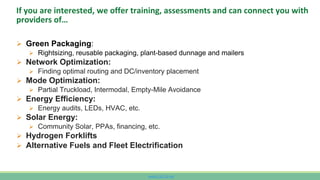
www.CutCO2.net
Logistics Sustainability &
Profitability 101
A Simple Overview to Help Shippers
Save ⏰ , 💰, & 🌎
Kevin J Mireles & Tyler Cole
www.CutCO2.net
Introductions
Kevin Mireles is a former journalist turned product manager who
spent 15 years at FedEx before becoming a Chief Sustainability
Officer for a logistics firm. He is now the founder of CutCO2.net,
your one-stop shop for for shippers to save time, money and the
planet, and provides logistics sustainability consulting.
Tyler Cole is a global supply chain thought leader with a passion for
decarbonizing value chains, focusing on freight, fuels, and energy. Always a
student, Tyler brings a thoughtful tone to the subject of sustainability in an
effort to educate, inspire and engage audiences. He thrives at creating
spaces for thoughtful discussion around serious issues like sustainability and
climate change.
© 2022 Kevin J Mireles & Tyler Cole
www.CutCO2.net
Adopting existing technologies
and best practices could avoid
billions of tons of emissions
over the next decade
* Image and data sourced from the Global Logistics Emissions
Council Framework for Logistics Emissions Accounting and
Reporting
© 2022 Kevin J Mireles & Tyler Cole
www.CutCO2.net
Unfortunately, Freight
transportation and logistics are
on pace to double emissions by
2050 and already contribute 8-
10% of global emissions*
* Image and data sourced from the Global Logistics Emissions
Council Framework for Logistics Emissions Accounting and
Reporting
© 2022 Kevin J Mireles & Tyler Cole
www.CutCO2.net
And while shippers want to be more sustainable they don’t know how
www.CutCO2.net
Googling Sustainability in logistics sends you on a clickfest
⏰ , 💰 & 🌎
⏰ , 💰 & 🌎
www.CutCO2.net
And much of the information is about future solutions or makes minimal impact
<1%
reduction in
emissions
<10%
adoption
by 2030
<5%
adoption by
2025
www.CutCO2.net
Plus, while everyone wants to be sustainable, profitability comes first
www.CutCO2.net
And so people think being sustainable will be more expensive
www.CutCO2.net
The good news is that sustainability in logistics usually drives costs down
and profits up!
www.CutCO2.net
So pay attention and learn how to cut your logistics costs and emissions!
Cost savings
Pollution
Reduction
Rightsize Packaging 10-30%1 10-50%1
Distribute from Center of US
Instead of Coasts
5-20%2 30-40%
Fulfill from Two or More
Locations
10-65% 40%-70%
Use trucks instead of planes 20-50% 90%+
Use intermodal instead of
Truckload
0-20% 60-70%
Improve Warehouse Energy
Efficiency
20-50% 20-50%
Turn Your Roof into a Solar
Powerplant
Up to 75% 100%
Reduce Returns 10-30% 10-30%
Eliminate Completely-Empty &
Partially-Empty Truck Trips
20-50% 30- 40%
Ship the Straightest Line
Possible
0-20% 10-90%
www.CutCO2.net
Do you care about the bottle, the transportation or the beer?
www.CutCO2.net
Almost all movement and packaging is waste
www.CutCO2.net
Almost all movement and packaging is waste
www.CutCO2.net
Save money and improve experience by reducing movement and packaging
www.CutCO2.net
So, what’s the biggest driver of emissions, packaging or transportation?
*Air & Ground shipments based on a 1,000 mile 3 lb shipment using US EPA calculations. Box emissions courtesy
of Consumer Ecology https://consumerecology.com/carbon-footprint-of-a-cardboard-box/
3.84
0.7
0.21
0.12 0.05
0.00
0.50
1.00
1.50
2.00
2.50
3.00
3.50
4.00
4.50
Air Shipment Ground Shipment Box (12X12X12) Box (9X9X9) Box (6X6X6)
CO2e Emissions (lbs) for 1,000 mile 3lb shipment and
different box sizes
www.CutCO2.net
As a shipper, calculating transportation emissions is relatively
straightforward, but not very accurate
Weight Distance
Emissions
Factor by mode
CO2e*
X X =
*CO2 equivalents, usually in metric tons
Air Cargo 1.16E-03
Truck 2.11E-04
Ship 3.60E-05
Train 2.20E-05
www.CutCO2.net
FXE Hub
UPS Hub
FXE
via Memphis
1900 Miles
2.2 tonnes CO2e
46% > UPS
24X> Truck
UPS
Via Louisville
1300 Miles
1.5 tonnes CO2e
32% < FXE
17X>Truck
Straight Line
400 Miles
Truck =.08 tonnes CO2e
Air =.46 tonnes CO2e
By Road
440 Miles
Truck =.09 tonnes CO2e
Origin
Destination
*The analysis is not based on an actual shipment but hypotheticals as I don’t have
access to FedEx or UPS routing data. FedEx could also potentially route the
shipment through their Indianapolis hub, which would result in the distance and
emissions being the same as UPS at 1,300 miles & 1.5 tonnes. Emissions
calculations are based on US EPA emission factors.
Emissions estimates can easily be off by 2 to 10X due to lack of data
www.CutCO2.net
Weight, distance and mode are the primary pricing factors for shipping as
well
Weight Distance Mode Shipping Costs
X X =
*CO2 equivalents, usually in metric tons
Air
Truck
Ship
Train
www.CutCO2.net
Except, carriers are now moving more to cubic pricing as weight is usually
less important than the amount of space an item takes up
Weight/
Cubic
Dimensions
Distance Mode Shipping Costs
X X =
*CO2 equivalents, usually in metric tons
Air
Truck
Ship
Train
www.CutCO2.net
Use the formula to reduce costs and emissions in tandem
Cut
Weight/
Cubic
Dimensions
Cut
Distance
Adopt More
Efficient Mode
Cut Shipping
Costs &
Emissions*
X X =
*CO2 equivalents, usually in metric tons
Air
Truck
Ship
Train
www.CutCO2.net
Start with cutting weight/dimensions to fit more items into the same space
Cut
Weight/
Cubic
Dimensions
Cut
Distance
Adopt More
Efficient Mode
Cut Shipping
Costs &
Emissions*
X X =
*CO2 equivalents, usually in metric tons
Air
Truck
Ship
Train
www.CutCO2.net
Load weights have minimal impact on fuel usage, so better to maximize
weight and minimize the number of trips
Fully loaded truck with
47,500 lbs. of items
65mph 5.5-7.5mpg
~ 25% reduction in MPG
Empty truck with 0 lbs. of
items
65mph 8-9.5mpg
www.CutCO2.net
Since emissions are directly correlated with fuel usage, a fully loaded truck shipping
10 items generates almost the same emissions as an almost empty truck
1,000
1,028
1,056
1,083
1,111
1,139
1,167
1,194
1,222
1,250
0
200
400
600
800
1,000
1,200
1,400
1 2 3 4 5 6 7 8 9 10
Tons
CO2e
Number of Items Shipped
Tons CO2e per Item Shipped
Total Tons CO2e
www.CutCO2.net
The more items you can ship on the same truck results in dramatic per item
emissions reductions
1,000
514
352
271
222
190 167 149 136 125
-
200
400
600
800
1,000
1,200
1 2 3 4 5 6 7 8 9 10
Tons
CO2e
Number of Items Shipped
Tons CO2e Per Item
Tons CO2e Per Item
www.CutCO2.net
Especially versus shipping the one item per trip
1,250
1,000
2,000
3,000
4,000
5,000
6,000
7,000
8,000
9,000
10,000
0
2,000
4,000
6,000
8,000
10,000
12,000
1 2 3 4 5 6 7 8 9 10
Tons
CO2e
Number of Items Shipped
Tons CO2e per Item Shipped in Single Trip vs. Multiple Trips
Total Tons CO2e if Shipped Together Tons CO2e if Shipped Separately
www.CutCO2.net
Today, poor packaging practices result in the average
box being 20-40+% bigger than required
Generating huge
amounts of easily
avoidable C02, other air
pollutants and packaging
waste
3 drill bits
3 boxes
www.CutCO2.net
Driving inefficiency, waste & GHG emissions in tandem
Poor Packaging
Practices
Transportation
Impact
20-40% Increase in miles driven & flown
Building & maintaining extra aircraft &vehicles
Larger than needed aircraft & vehicles
Energy required to move additional package weight
Packaging
Impact
Additional trees cut
Extra packaging manufacturing energy & pollution
Additional packaging waste
Increased “peanuts”/ void fill to occupy empty
space
©2021 KEVIN J MIRELES
www.CutCO2.net
Rightsizing technology available today can reduce package size by 20 to 60% while
speeding the pack and ship process and reducing labor costs up to 80%
Warehouse
worker picks,
packs & ships
Cartonization
Software
Determines either
the right box to
select or the right
box to make
Software-only
Provider sends
recommendation
regarding which
box to place items
in & how to pack
Use
12x8X3
box
Smart
Packing
Algorithm
Products
ordered
WMS or
dimensionalizer
passes box
dimensions
4x4x4
8x8x3
4x4x3
Box on Demand
System
generates right-
sized boxes &
packs
15-40% decrease in
package size
25-70% decrease in
package size
© 2022 Kevin J Mireles & Tyler Cole
www.CutCO2.net
After implementing a rightsizing system, a national retailer increased trailer capacity
by ~75% while saving $1.3 million in packaging costs
Before After
• 800 Packages per trailer • 1,400 Packages per trailer
• ~$1.3M in anticipated packaging savings annually
• ~$.50-60 savings per piece
www.CutCO2.net
Another shipper avoided 90 truckloads and cutting down 5,600 trees
31
CEO Internet Fusion Group in Quadient testimonial
Cardboard
Transportation
Trees
If 100K more similar businesses adopted, would eliminate 388M ft3 of carboard, 900K truckloads & save 560M trees!
www.CutCO2.net
Optimizing packaging practices could easily reduce global logistics
emissions between 15 & 150 million tons annually
Mode
2015 Total
C02 Amount
Million Tons*
% Reduction Reduction in Tons
Conservative Optimistic Conservative Optimistic
Air 174 -5% -20%
(8,700,000) (34,800,000)
Sea 783 0 -1%
- (7,830,000)
Road 1,798 -0.5% -5%
(8,990,000) (89,900,000)
Total (17,690,000) (132,530,000)
More analysis is required to better quantify the potential reductions in C02 from transportation,
plus calculate C02 emissions from manufacturing packaging, additional trucks, planes, etc.
Or up to 1.3B
tons over the
next decade
*Global Logistics Emissions Council Framework
www.CutCO2.net
Partial truckload also enables you to put more items in a trailer eliminating
an additional trip
www.CutCO2.net
Reducing empty truck trips/dead haul is another huge opportunity
www.CutCO2.net
Next, cut distance to minimize miles traveled/fuel usage and emissions
Cut
Weight/
Cubic
Dimensions
Cut
Distance
Adopt More
Efficient Mode
Cut Shipping
Costs &
Emissions*
X X =
*CO2 equivalents, usually in metric tons
Air
Truck
Ship
Train
www.CutCO2.net
Moving your fulfillment centers from the peripheries to the center of the country
can slash average shipping distances
These 3
involving
shipping from
2 or more
locations
* Distances are based on averaged-weighted straight-line distance between origin locations and
the top 320 US metropolitan areas representing over 80% of the US population
Potential Reductions in Distance & Emissions vs.
Shipping from So Cal
www.CutCO2.net
Moving a distribution center to St. Louis instead of being in LA cuts the average
distance to US Population by over 40%
1,000 Miles
1,800 Miles
www.CutCO2.net
Forward stocking can reduce your distances and emissions 65% and more
These 3
involving
shipping from
2 or more
locations
* Distances are based on averaged-weighted straight-line distance between origin locations and
the top 320 US metropolitan areas representing over 80% of the US population
Potential Reductions in Distance & Emissions vs.
Shipping from So Cal
www.CutCO2.net
Reducing distance also results in reduced shipping costs
www.CutCO2.net
FXE Hub
UPS Hub
FXE
via Memphis
1900 Miles
2.2 tonnes CO2e
46% > UPS
24X> Truck
UPS
Via Louisville
1300 Miles
1.5 tonnes CO2e
32% < FXE
17X>Truck
Straight Line
400 Miles
Truck =.08 tonnes CO2e
Air =.46 tonnes CO2e
By Road
440 Miles
Truck =.09 tonnes CO2e
Origin
Destination
*The analysis is not based on an actual shipment but hypotheticals as I don’t have
access to FedEx or UPS routing data. FedEx could also potentially route the
shipment through their Indianapolis hub, which would result in the distance and
emissions being the same as UPS at 1,300 miles & 1.5 tonnes. Emissions
calculations are based on US EPA emission factors.
Moving your express shipping to hubs with direct flights eliminates extra hops and
massively reduces distances
www.CutCO2.net
Finally, switch modes to reduce fuel usage and emissions
Cut
Weight/
Cubic
Dimensions
Cut
Distance
Adopt More
Efficient Mode
Cut Shipping
Costs &
Emissions*
X X =
*CO2 equivalents, usually in metric tons
www.CutCO2.net
Switching from plane to truck and train results in 80%+ pollution reductions
Truck =
80+% Reduction
vs air*
Train=
98% Reduction
vs air* &
90% vs truck
*Doesn’t include impact of contrails on global warming which increases
plane’s contributions to warming by about 1.9X, nor fact that most
Express shipments travel much further distances due to hub & spoke
model.
www.CutCO2.net
Avoid express shipping to save money and the environment
Air shipments drive
majority of UPS,
FedEx and DHL
emissions
www.CutCO2.net
For managed truckload freight, explore alternative fueling options
Benefits can include:
Cost and Emission Reductions
Improved Service Levels
Reduced Budget Variability
www.CutCO2.net
Finally, adopt energy efficiency and solar for your warehouse
Energy
Efficiency
Solar
✔ 10-30% Cost
Savings
✔ 50 to 100%
reduction in
emissions
+ =
www.CutCO2.net
Given the escalating cost of electricity and the plummeting price of solar,
warehouse owners can transform their roof into a moneymaker
Solar Electricity
Lease Roof to Solar Developer
Sign Power Purchase Agreement
Finance purchase
Pay Outright
www.CutCO2.net
If you are interested, we offer training, assessments and can connect you with
providers of…
 Green Packaging:
 Rightsizing, reusable packaging, plant-based dunnage and mailers
 Network Optimization:
 Finding optimal routing and DC/inventory placement
 Mode Optimization:
 Partial Truckload, Intermodal, Empty-Mile Avoidance
 Energy Efficiency:
 Energy audits, LEDs, HVAC, etc.
 Solar Energy:
 Community Solar, PPAs, financing, etc.
 Hydrogen Forklifts
 Alternative Fuels and Fleet Electrification
www.CutCO2.net
Please reach out to us with any questions you have!
Kevin J Mireles
CEO & Founder
901 230-1048
kevin@CutCO2.net
www.CutCO2.net
LinkedIn

Logistics Sustainability & Profitability 101

  • 1.
    www.CutCO2.net Logistics Sustainability & Profitability101 A Simple Overview to Help Shippers Save ⏰ , 💰, & 🌎 Kevin J Mireles & Tyler Cole
  • 2.
    www.CutCO2.net Introductions Kevin Mireles isa former journalist turned product manager who spent 15 years at FedEx before becoming a Chief Sustainability Officer for a logistics firm. He is now the founder of CutCO2.net, your one-stop shop for for shippers to save time, money and the planet, and provides logistics sustainability consulting. Tyler Cole is a global supply chain thought leader with a passion for decarbonizing value chains, focusing on freight, fuels, and energy. Always a student, Tyler brings a thoughtful tone to the subject of sustainability in an effort to educate, inspire and engage audiences. He thrives at creating spaces for thoughtful discussion around serious issues like sustainability and climate change. © 2022 Kevin J Mireles & Tyler Cole
  • 3.
    www.CutCO2.net Adopting existing technologies andbest practices could avoid billions of tons of emissions over the next decade * Image and data sourced from the Global Logistics Emissions Council Framework for Logistics Emissions Accounting and Reporting © 2022 Kevin J Mireles & Tyler Cole
  • 4.
    www.CutCO2.net Unfortunately, Freight transportation andlogistics are on pace to double emissions by 2050 and already contribute 8- 10% of global emissions* * Image and data sourced from the Global Logistics Emissions Council Framework for Logistics Emissions Accounting and Reporting © 2022 Kevin J Mireles & Tyler Cole
  • 5.
    www.CutCO2.net And while shipperswant to be more sustainable they don’t know how
  • 6.
    www.CutCO2.net Googling Sustainability inlogistics sends you on a clickfest ⏰ , 💰 & 🌎 ⏰ , 💰 & 🌎
  • 7.
    www.CutCO2.net And much ofthe information is about future solutions or makes minimal impact <1% reduction in emissions <10% adoption by 2030 <5% adoption by 2025
  • 8.
    www.CutCO2.net Plus, while everyonewants to be sustainable, profitability comes first
  • 9.
    www.CutCO2.net And so peoplethink being sustainable will be more expensive
  • 10.
    www.CutCO2.net The good newsis that sustainability in logistics usually drives costs down and profits up!
  • 11.
    www.CutCO2.net So pay attentionand learn how to cut your logistics costs and emissions! Cost savings Pollution Reduction Rightsize Packaging 10-30%1 10-50%1 Distribute from Center of US Instead of Coasts 5-20%2 30-40% Fulfill from Two or More Locations 10-65% 40%-70% Use trucks instead of planes 20-50% 90%+ Use intermodal instead of Truckload 0-20% 60-70% Improve Warehouse Energy Efficiency 20-50% 20-50% Turn Your Roof into a Solar Powerplant Up to 75% 100% Reduce Returns 10-30% 10-30% Eliminate Completely-Empty & Partially-Empty Truck Trips 20-50% 30- 40% Ship the Straightest Line Possible 0-20% 10-90%
  • 12.
    www.CutCO2.net Do you careabout the bottle, the transportation or the beer?
  • 13.
    www.CutCO2.net Almost all movementand packaging is waste
  • 14.
    www.CutCO2.net Almost all movementand packaging is waste
  • 15.
    www.CutCO2.net Save money andimprove experience by reducing movement and packaging
  • 16.
    www.CutCO2.net So, what’s thebiggest driver of emissions, packaging or transportation? *Air & Ground shipments based on a 1,000 mile 3 lb shipment using US EPA calculations. Box emissions courtesy of Consumer Ecology https://consumerecology.com/carbon-footprint-of-a-cardboard-box/ 3.84 0.7 0.21 0.12 0.05 0.00 0.50 1.00 1.50 2.00 2.50 3.00 3.50 4.00 4.50 Air Shipment Ground Shipment Box (12X12X12) Box (9X9X9) Box (6X6X6) CO2e Emissions (lbs) for 1,000 mile 3lb shipment and different box sizes
  • 17.
    www.CutCO2.net As a shipper,calculating transportation emissions is relatively straightforward, but not very accurate Weight Distance Emissions Factor by mode CO2e* X X = *CO2 equivalents, usually in metric tons Air Cargo 1.16E-03 Truck 2.11E-04 Ship 3.60E-05 Train 2.20E-05
  • 18.
    www.CutCO2.net FXE Hub UPS Hub FXE viaMemphis 1900 Miles 2.2 tonnes CO2e 46% > UPS 24X> Truck UPS Via Louisville 1300 Miles 1.5 tonnes CO2e 32% < FXE 17X>Truck Straight Line 400 Miles Truck =.08 tonnes CO2e Air =.46 tonnes CO2e By Road 440 Miles Truck =.09 tonnes CO2e Origin Destination *The analysis is not based on an actual shipment but hypotheticals as I don’t have access to FedEx or UPS routing data. FedEx could also potentially route the shipment through their Indianapolis hub, which would result in the distance and emissions being the same as UPS at 1,300 miles & 1.5 tonnes. Emissions calculations are based on US EPA emission factors. Emissions estimates can easily be off by 2 to 10X due to lack of data
  • 19.
    www.CutCO2.net Weight, distance andmode are the primary pricing factors for shipping as well Weight Distance Mode Shipping Costs X X = *CO2 equivalents, usually in metric tons Air Truck Ship Train
  • 20.
    www.CutCO2.net Except, carriers arenow moving more to cubic pricing as weight is usually less important than the amount of space an item takes up Weight/ Cubic Dimensions Distance Mode Shipping Costs X X = *CO2 equivalents, usually in metric tons Air Truck Ship Train
  • 21.
    www.CutCO2.net Use the formulato reduce costs and emissions in tandem Cut Weight/ Cubic Dimensions Cut Distance Adopt More Efficient Mode Cut Shipping Costs & Emissions* X X = *CO2 equivalents, usually in metric tons Air Truck Ship Train
  • 22.
    www.CutCO2.net Start with cuttingweight/dimensions to fit more items into the same space Cut Weight/ Cubic Dimensions Cut Distance Adopt More Efficient Mode Cut Shipping Costs & Emissions* X X = *CO2 equivalents, usually in metric tons Air Truck Ship Train
  • 23.
    www.CutCO2.net Load weights haveminimal impact on fuel usage, so better to maximize weight and minimize the number of trips Fully loaded truck with 47,500 lbs. of items 65mph 5.5-7.5mpg ~ 25% reduction in MPG Empty truck with 0 lbs. of items 65mph 8-9.5mpg
  • 24.
    www.CutCO2.net Since emissions aredirectly correlated with fuel usage, a fully loaded truck shipping 10 items generates almost the same emissions as an almost empty truck 1,000 1,028 1,056 1,083 1,111 1,139 1,167 1,194 1,222 1,250 0 200 400 600 800 1,000 1,200 1,400 1 2 3 4 5 6 7 8 9 10 Tons CO2e Number of Items Shipped Tons CO2e per Item Shipped Total Tons CO2e
  • 25.
    www.CutCO2.net The more itemsyou can ship on the same truck results in dramatic per item emissions reductions 1,000 514 352 271 222 190 167 149 136 125 - 200 400 600 800 1,000 1,200 1 2 3 4 5 6 7 8 9 10 Tons CO2e Number of Items Shipped Tons CO2e Per Item Tons CO2e Per Item
  • 26.
    www.CutCO2.net Especially versus shippingthe one item per trip 1,250 1,000 2,000 3,000 4,000 5,000 6,000 7,000 8,000 9,000 10,000 0 2,000 4,000 6,000 8,000 10,000 12,000 1 2 3 4 5 6 7 8 9 10 Tons CO2e Number of Items Shipped Tons CO2e per Item Shipped in Single Trip vs. Multiple Trips Total Tons CO2e if Shipped Together Tons CO2e if Shipped Separately
  • 27.
    www.CutCO2.net Today, poor packagingpractices result in the average box being 20-40+% bigger than required Generating huge amounts of easily avoidable C02, other air pollutants and packaging waste 3 drill bits 3 boxes
  • 28.
    www.CutCO2.net Driving inefficiency, waste& GHG emissions in tandem Poor Packaging Practices Transportation Impact 20-40% Increase in miles driven & flown Building & maintaining extra aircraft &vehicles Larger than needed aircraft & vehicles Energy required to move additional package weight Packaging Impact Additional trees cut Extra packaging manufacturing energy & pollution Additional packaging waste Increased “peanuts”/ void fill to occupy empty space ©2021 KEVIN J MIRELES
  • 29.
    www.CutCO2.net Rightsizing technology availabletoday can reduce package size by 20 to 60% while speeding the pack and ship process and reducing labor costs up to 80% Warehouse worker picks, packs & ships Cartonization Software Determines either the right box to select or the right box to make Software-only Provider sends recommendation regarding which box to place items in & how to pack Use 12x8X3 box Smart Packing Algorithm Products ordered WMS or dimensionalizer passes box dimensions 4x4x4 8x8x3 4x4x3 Box on Demand System generates right- sized boxes & packs 15-40% decrease in package size 25-70% decrease in package size © 2022 Kevin J Mireles & Tyler Cole
  • 30.
    www.CutCO2.net After implementing arightsizing system, a national retailer increased trailer capacity by ~75% while saving $1.3 million in packaging costs Before After • 800 Packages per trailer • 1,400 Packages per trailer • ~$1.3M in anticipated packaging savings annually • ~$.50-60 savings per piece
  • 31.
    www.CutCO2.net Another shipper avoided90 truckloads and cutting down 5,600 trees 31 CEO Internet Fusion Group in Quadient testimonial Cardboard Transportation Trees If 100K more similar businesses adopted, would eliminate 388M ft3 of carboard, 900K truckloads & save 560M trees!
  • 32.
    www.CutCO2.net Optimizing packaging practicescould easily reduce global logistics emissions between 15 & 150 million tons annually Mode 2015 Total C02 Amount Million Tons* % Reduction Reduction in Tons Conservative Optimistic Conservative Optimistic Air 174 -5% -20% (8,700,000) (34,800,000) Sea 783 0 -1% - (7,830,000) Road 1,798 -0.5% -5% (8,990,000) (89,900,000) Total (17,690,000) (132,530,000) More analysis is required to better quantify the potential reductions in C02 from transportation, plus calculate C02 emissions from manufacturing packaging, additional trucks, planes, etc. Or up to 1.3B tons over the next decade *Global Logistics Emissions Council Framework
  • 33.
    www.CutCO2.net Partial truckload alsoenables you to put more items in a trailer eliminating an additional trip
  • 34.
    www.CutCO2.net Reducing empty trucktrips/dead haul is another huge opportunity
  • 35.
    www.CutCO2.net Next, cut distanceto minimize miles traveled/fuel usage and emissions Cut Weight/ Cubic Dimensions Cut Distance Adopt More Efficient Mode Cut Shipping Costs & Emissions* X X = *CO2 equivalents, usually in metric tons Air Truck Ship Train
  • 36.
    www.CutCO2.net Moving your fulfillmentcenters from the peripheries to the center of the country can slash average shipping distances These 3 involving shipping from 2 or more locations * Distances are based on averaged-weighted straight-line distance between origin locations and the top 320 US metropolitan areas representing over 80% of the US population Potential Reductions in Distance & Emissions vs. Shipping from So Cal
  • 37.
    www.CutCO2.net Moving a distributioncenter to St. Louis instead of being in LA cuts the average distance to US Population by over 40% 1,000 Miles 1,800 Miles
  • 38.
    www.CutCO2.net Forward stocking canreduce your distances and emissions 65% and more These 3 involving shipping from 2 or more locations * Distances are based on averaged-weighted straight-line distance between origin locations and the top 320 US metropolitan areas representing over 80% of the US population Potential Reductions in Distance & Emissions vs. Shipping from So Cal
  • 39.
    www.CutCO2.net Reducing distance alsoresults in reduced shipping costs
  • 40.
    www.CutCO2.net FXE Hub UPS Hub FXE viaMemphis 1900 Miles 2.2 tonnes CO2e 46% > UPS 24X> Truck UPS Via Louisville 1300 Miles 1.5 tonnes CO2e 32% < FXE 17X>Truck Straight Line 400 Miles Truck =.08 tonnes CO2e Air =.46 tonnes CO2e By Road 440 Miles Truck =.09 tonnes CO2e Origin Destination *The analysis is not based on an actual shipment but hypotheticals as I don’t have access to FedEx or UPS routing data. FedEx could also potentially route the shipment through their Indianapolis hub, which would result in the distance and emissions being the same as UPS at 1,300 miles & 1.5 tonnes. Emissions calculations are based on US EPA emission factors. Moving your express shipping to hubs with direct flights eliminates extra hops and massively reduces distances
  • 41.
    www.CutCO2.net Finally, switch modesto reduce fuel usage and emissions Cut Weight/ Cubic Dimensions Cut Distance Adopt More Efficient Mode Cut Shipping Costs & Emissions* X X = *CO2 equivalents, usually in metric tons
  • 42.
    www.CutCO2.net Switching from planeto truck and train results in 80%+ pollution reductions Truck = 80+% Reduction vs air* Train= 98% Reduction vs air* & 90% vs truck *Doesn’t include impact of contrails on global warming which increases plane’s contributions to warming by about 1.9X, nor fact that most Express shipments travel much further distances due to hub & spoke model.
  • 43.
    www.CutCO2.net Avoid express shippingto save money and the environment Air shipments drive majority of UPS, FedEx and DHL emissions
  • 44.
    www.CutCO2.net For managed truckloadfreight, explore alternative fueling options Benefits can include: Cost and Emission Reductions Improved Service Levels Reduced Budget Variability
  • 45.
    www.CutCO2.net Finally, adopt energyefficiency and solar for your warehouse Energy Efficiency Solar ✔ 10-30% Cost Savings ✔ 50 to 100% reduction in emissions + =
  • 46.
    www.CutCO2.net Given the escalatingcost of electricity and the plummeting price of solar, warehouse owners can transform their roof into a moneymaker Solar Electricity Lease Roof to Solar Developer Sign Power Purchase Agreement Finance purchase Pay Outright
  • 47.
    www.CutCO2.net If you areinterested, we offer training, assessments and can connect you with providers of…  Green Packaging:  Rightsizing, reusable packaging, plant-based dunnage and mailers  Network Optimization:  Finding optimal routing and DC/inventory placement  Mode Optimization:  Partial Truckload, Intermodal, Empty-Mile Avoidance  Energy Efficiency:  Energy audits, LEDs, HVAC, etc.  Solar Energy:  Community Solar, PPAs, financing, etc.  Hydrogen Forklifts  Alternative Fuels and Fleet Electrification
  • 48.
    www.CutCO2.net Please reach outto us with any questions you have! Kevin J Mireles CEO & Founder 901 230-1048 kevin@CutCO2.net www.CutCO2.net LinkedIn