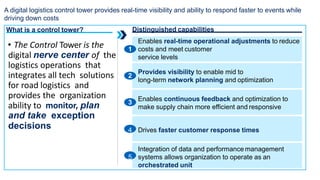
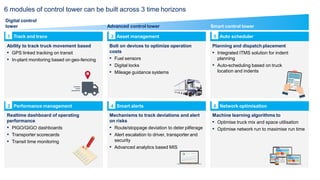
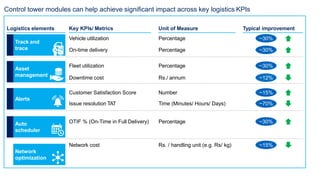
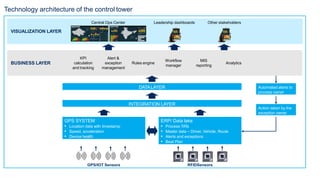
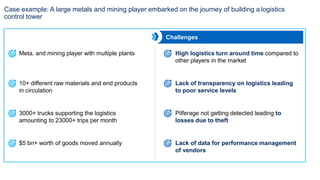
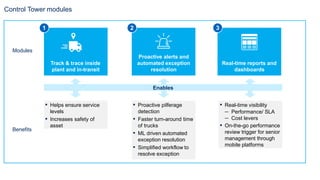
Logistics Control Tower
MONITOR | CONTROL | RESPOND
Several issues plague logistics in India...
1
2
3
4
5
Poor transit times and service levels
Non availability of trucks
Lack of end to end visibility
Poor maintenance of assets
High idle time of assets
…Which have significant implications on organizations
1
2
3
4
5
Poor transit times
Non availability of trucks
Lack of end to end visibility
Poor maintenance of assets
High idle time of assets
High inventory cost and poor planning
Missed deliveries (cut-off times/poor
service level)
No performance management,
pilferage/theft, inefficient planning
Frequent breakdown, increase in
maintenance cost
Low utilization leading to higher cost
Across industries, organizations are facing issues in logistics management
▪ Pilferage of material
undetected by standard
weigh bridges
▪ High TAT and transit time
limiting plant throughput
▪ Issues with “change in
destination” resulting in
revenue loss in
geographic pricing
scenario e.g., bag drops
Metals and mining Cement/Chemical Auto
▪ High transit times
▪ Assembly line shutdown
due to unavailability of
RM
▪ Lost sales
Express
▪ Low asset utilization
▪ Poor service levels
▪ Fuel theft
▪ Higher wear and tear of
assets
A digital logistics control tower provides real-time visibility and ability to respond faster to events while
driving down costs
• The Control Tower is the
digital nerve center of the
logistics operations that
integrates all tech solutions
for road logistics and
provides the organization
ability to monitor, plan
and take exception
decisions
2
3
Enables real-time operational adjustments to reduce
1 costs and meet customer
service levels
Provides visibility to enable mid to
long-term network planning and optimization
Enables continuous feedback and optimization to
make supply chain more efficient and responsive
4 Drives faster customer response times
Integration of data and performance management
5 systems allows organization to operate as an
orchestrated unit
What is a control tower? Distinguished capabilities
6 modules of control tower can be built across 3 time horizons
Track and trace Asset management Auto scheduler
Track and trace
1 3 5
Track and trace Smart alerts Network optimisation
Performance management
2 4 6
Ability to track truck movement based
▪ GPS linked tracking on transit
▪ In-plant monitoring based on geo-fencing
Bolt on devices to optimize operation
costs
▪ Fuel sensors
▪ Digital locks
▪ Mileage guidance systems
Planning and dispatch placement
▪ Integrated ITMS solution for indent
planning
▪ Auto-scheduling based on truck
location and indents
Realtime dashboard of operating
performance
▪ PIGO/GIGO dashboards
▪ Transporter scorecards
▪ Transit time monitoring
Mechanisms to track deviations and alert
on risks
▪ Route/stoppage deviation to deter pilferage
▪ Alert escalation to driver, transporter and
security
▪ Advanced analytics based MIS
Machine learning algorithms to
▪ Optimise truck mix and space utilisation
▪ Optimise network run to maximise run time
Digital control
tower Advanced control tower Smart control tower
Most of the modules are applicable across sectors
Digital
Advanced
Smart
Metals & Cement/
mining chemicals Pharma/FMCG Auto Express/3PL
1 Track and trace
2
Performance
management
3
Asset
management
4 Deviation control
5 Auto scheduler
6
Network
optimisation
Control tower modules can help achieve significant impact across key logistics KPIs
Logistics elements
Track and
trace
Key KPIs/ Metrics Typical improvement
Alerts
Network
optimization
Asset
management
Unit of Measure
Vehicle utilization ~30%
Percentage
On-time delivery ~30%
Percentage
Customer Satisfaction Score ~15%
Number
Issue resolution TAT ~70%
Time (Minutes/ Hours/ Days)
Network cost ~15%
Rs. / handling unit (e.g. Rs/ kg)
Fleet utilization ~30%
Percentage
Downtime cost ~12%
Rs./ annum
Auto
scheduler
OTIF % (On-Time in Full Delivery) Percentage ~30%
Technology architecture of the control tower
Central Ops Center Leadership dashboards Other stakeholders
KPI
calculation
and tracking
Alert &
exception
management
Rules engine
Workflow
manager
MIS
reporting
Analytics
BUSINESS LAYER
VISUALIZATION LAYER
INTEGRATION LAYER
Automated alerts to
process owner
GPS SYSTEM
▪ Location data with timestamp
▪ Speed, acceleration
▪ Device health
ERP/ Data lake
▪ Process TATs
▪ Master data – Driver, Vehicle, Route
▪ Alerts and exceptions
▪ Beat Plan
DATALAYER
Action taken by the
exception owner
GPS/IOT Sensors RFIDSensors
Case example: A large metals and mining player embarked on the journey of building a logistics
control tower
Challenges
Context
Meta. and mining player with multiple plants High logistics turn around time compared to
other players in the market
10+ different raw materials and end products
in circulation
Lack of transparency on logistics leading
to poor service levels
3000+ trucks supporting the logistics
amounting to 23000+ trips per month
Pilferage not getting detected leading to
losses due to theft
$5 bn+ worth of goods moved annually Lack of data for performance management
of vendors
Control Tower modules
Modules
Benefits
Proactive alerts and
automated exception
resolution
Track & trace inside
plant and in-transit
Real-time reports and
dashboards
1 2 3
▪ Helps ensure service
levels
▪ Increases safety of
asset
▪ Proactive pilferage
detection
▪ Faster turn-around time
of trucks
▪ ML driven automated
exception resolution
▪ Simplified workflow to
resolve exception
▪ Real-time visibility
– Performance/ SLA
– Cost levers
▪ On-the-go performance
review trigger for senior
management through
mobile platforms
Enables
Accurate indent planning: defined time
slot when trucks are required
 Cost savings from trip optimization
 Minimize parking lotcongestion
Plant 1
(Loading)
1
Vision: Future state workflow for inter-plant movement leveraging an integrated Digital Control Tower
Control
tower
ETA at unloading plant so
driver can plan transit time
Gate out
2
5Detect pilferage
during transit
Parking-in
 Driver gets ETA of plant entry to the parking lot
 Logistics lead made aware of vehicles with alerts
approaching parking lot to ensure quickresolution
6
Track and trace in truck
movement on map viaGPS
Transit
3
Transit
Performance
review
Gate-out Weekly/
monthly AA
based MIS
reports
12
Gate-in
8  Auto gate-in for registered trucks (autopass)
4 Alert in case of route deviation
 Automated Call/SMS devices at entry timeslot
 Visual board of call-in list
7
station (geo-fence)
9  Real-time tracking of trucksacross
11All “paperwork” done digitally with integrated ITMS
Real-time status of TAT performance
at station boards
10
Plant 2
(Unloading)
L
a
st
M
o
d
i f
i
e
d
7
/
1
2
/
2
0
1
9
Common myths that prevent organizations from setting up a LCT
1
2
3
Establishing a control tower is a long drawn process
Entire technology stack needs to be revisited to implement the LCT
Adding more manpower is more cost effective than to automate
using technology
4 First version of the control tower must be AI/ML enabled
5 Simple track and trace is enough to get full control of the operations
Key success factors in setting up the Logistics ControlTower
1
3
Think through value proposition - Invest time and effort in diagnostic
to identify holistic use case
Design the solution fit-for-purpose – Create wireframes
and design suited for need and not plug-and play only
Take a holistic and long term view – Create a wave of roll-out of
different phases across time horizon
4 Tech is just 30% of answer - Collaborate across functions and
stakeholders to design, implement and sustain
2
THANK YOU
ANY QUESTIONS

Logistics Control Tower .pptx

  • 1.
  • 2.
    Several issues plaguelogistics in India... 1 2 3 4 5 Poor transit times and service levels Non availability of trucks Lack of end to end visibility Poor maintenance of assets High idle time of assets
  • 3.
    …Which have significantimplications on organizations 1 2 3 4 5 Poor transit times Non availability of trucks Lack of end to end visibility Poor maintenance of assets High idle time of assets High inventory cost and poor planning Missed deliveries (cut-off times/poor service level) No performance management, pilferage/theft, inefficient planning Frequent breakdown, increase in maintenance cost Low utilization leading to higher cost
  • 4.
    Across industries, organizationsare facing issues in logistics management ▪ Pilferage of material undetected by standard weigh bridges ▪ High TAT and transit time limiting plant throughput ▪ Issues with “change in destination” resulting in revenue loss in geographic pricing scenario e.g., bag drops Metals and mining Cement/Chemical Auto ▪ High transit times ▪ Assembly line shutdown due to unavailability of RM ▪ Lost sales Express ▪ Low asset utilization ▪ Poor service levels ▪ Fuel theft ▪ Higher wear and tear of assets
  • 5.
    A digital logisticscontrol tower provides real-time visibility and ability to respond faster to events while driving down costs • The Control Tower is the digital nerve center of the logistics operations that integrates all tech solutions for road logistics and provides the organization ability to monitor, plan and take exception decisions 2 3 Enables real-time operational adjustments to reduce 1 costs and meet customer service levels Provides visibility to enable mid to long-term network planning and optimization Enables continuous feedback and optimization to make supply chain more efficient and responsive 4 Drives faster customer response times Integration of data and performance management 5 systems allows organization to operate as an orchestrated unit What is a control tower? Distinguished capabilities
  • 6.
    6 modules ofcontrol tower can be built across 3 time horizons Track and trace Asset management Auto scheduler Track and trace 1 3 5 Track and trace Smart alerts Network optimisation Performance management 2 4 6 Ability to track truck movement based ▪ GPS linked tracking on transit ▪ In-plant monitoring based on geo-fencing Bolt on devices to optimize operation costs ▪ Fuel sensors ▪ Digital locks ▪ Mileage guidance systems Planning and dispatch placement ▪ Integrated ITMS solution for indent planning ▪ Auto-scheduling based on truck location and indents Realtime dashboard of operating performance ▪ PIGO/GIGO dashboards ▪ Transporter scorecards ▪ Transit time monitoring Mechanisms to track deviations and alert on risks ▪ Route/stoppage deviation to deter pilferage ▪ Alert escalation to driver, transporter and security ▪ Advanced analytics based MIS Machine learning algorithms to ▪ Optimise truck mix and space utilisation ▪ Optimise network run to maximise run time Digital control tower Advanced control tower Smart control tower
  • 7.
    Most of themodules are applicable across sectors Digital Advanced Smart Metals & Cement/ mining chemicals Pharma/FMCG Auto Express/3PL 1 Track and trace 2 Performance management 3 Asset management 4 Deviation control 5 Auto scheduler 6 Network optimisation
  • 8.
    Control tower modulescan help achieve significant impact across key logistics KPIs Logistics elements Track and trace Key KPIs/ Metrics Typical improvement Alerts Network optimization Asset management Unit of Measure Vehicle utilization ~30% Percentage On-time delivery ~30% Percentage Customer Satisfaction Score ~15% Number Issue resolution TAT ~70% Time (Minutes/ Hours/ Days) Network cost ~15% Rs. / handling unit (e.g. Rs/ kg) Fleet utilization ~30% Percentage Downtime cost ~12% Rs./ annum Auto scheduler OTIF % (On-Time in Full Delivery) Percentage ~30%
  • 9.
    Technology architecture ofthe control tower Central Ops Center Leadership dashboards Other stakeholders KPI calculation and tracking Alert & exception management Rules engine Workflow manager MIS reporting Analytics BUSINESS LAYER VISUALIZATION LAYER INTEGRATION LAYER Automated alerts to process owner GPS SYSTEM ▪ Location data with timestamp ▪ Speed, acceleration ▪ Device health ERP/ Data lake ▪ Process TATs ▪ Master data – Driver, Vehicle, Route ▪ Alerts and exceptions ▪ Beat Plan DATALAYER Action taken by the exception owner GPS/IOT Sensors RFIDSensors
  • 10.
    Case example: Alarge metals and mining player embarked on the journey of building a logistics control tower Challenges Context Meta. and mining player with multiple plants High logistics turn around time compared to other players in the market 10+ different raw materials and end products in circulation Lack of transparency on logistics leading to poor service levels 3000+ trucks supporting the logistics amounting to 23000+ trips per month Pilferage not getting detected leading to losses due to theft $5 bn+ worth of goods moved annually Lack of data for performance management of vendors
  • 11.
    Control Tower modules Modules Benefits Proactivealerts and automated exception resolution Track & trace inside plant and in-transit Real-time reports and dashboards 1 2 3 ▪ Helps ensure service levels ▪ Increases safety of asset ▪ Proactive pilferage detection ▪ Faster turn-around time of trucks ▪ ML driven automated exception resolution ▪ Simplified workflow to resolve exception ▪ Real-time visibility – Performance/ SLA – Cost levers ▪ On-the-go performance review trigger for senior management through mobile platforms Enables
  • 12.
    Accurate indent planning:defined time slot when trucks are required  Cost savings from trip optimization  Minimize parking lotcongestion Plant 1 (Loading) 1 Vision: Future state workflow for inter-plant movement leveraging an integrated Digital Control Tower Control tower ETA at unloading plant so driver can plan transit time Gate out 2 5Detect pilferage during transit Parking-in  Driver gets ETA of plant entry to the parking lot  Logistics lead made aware of vehicles with alerts approaching parking lot to ensure quickresolution 6 Track and trace in truck movement on map viaGPS Transit 3 Transit Performance review Gate-out Weekly/ monthly AA based MIS reports 12 Gate-in 8  Auto gate-in for registered trucks (autopass) 4 Alert in case of route deviation  Automated Call/SMS devices at entry timeslot  Visual board of call-in list 7 station (geo-fence) 9  Real-time tracking of trucksacross 11All “paperwork” done digitally with integrated ITMS Real-time status of TAT performance at station boards 10 Plant 2 (Unloading)
  • 13.
    L a st M o d i f i e d 7 / 1 2 / 2 0 1 9 Common mythsthat prevent organizations from setting up a LCT 1 2 3 Establishing a control tower is a long drawn process Entire technology stack needs to be revisited to implement the LCT Adding more manpower is more cost effective than to automate using technology 4 First version of the control tower must be AI/ML enabled 5 Simple track and trace is enough to get full control of the operations
  • 14.
    Key success factorsin setting up the Logistics ControlTower 1 3 Think through value proposition - Invest time and effort in diagnostic to identify holistic use case Design the solution fit-for-purpose – Create wireframes and design suited for need and not plug-and play only Take a holistic and long term view – Create a wave of roll-out of different phases across time horizon 4 Tech is just 30% of answer - Collaborate across functions and stakeholders to design, implement and sustain 2
  • 15.