Transportation Control Tower
•
5 likes•2,822 views

Real Time Monitoring - Automatic alerts based on tracking rules, considering real time GIS data, omnichannel and analytics features ( KPI dashboards)

Recommended
More Related Content
What's hot
What's hot (20)
Similar to Transportation Control Tower
Similar to Transportation Control Tower (20)
More from Paulo Henrique Pinhão
More from Paulo Henrique Pinhão (14)
Recently uploaded
Recently uploaded (20)
Transportation Control Tower
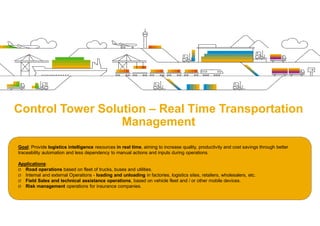
- 1. Goal: Provide logistics intelligence resources in real time, aiming to increase quality, productivity and cost savings through better traceability automation and less dependency to manual actions and inputs during operations. Applications: Ø Road operations based on fleet of trucks, buses and utilities. Ø Internal and external Operations - loading and unloading in factories, logistics sites, retailers, wholesalers, etc. Ø Field Sales and technical assistance operations, based on vehicle fleet and / or other mobile devices. Ø Transportation risk management required by the Insurer (cargo policy). Transportation Control Tower for Real Time Management
- 2. 2 Challenges in Logistics Market limitations of infrastructure (Brazil and Latin America) Low capacity in Prevention SLA x Undisciplined Market § modal bottlenecks: § restrictions of Infrastructure § growing of cargo theft § Outsourcing: § Difficulties to integrated control § Reaction to the failures: § generate rework and delays § generate penalties and customer dissatisfaction § generate higher operational costs § reduction of contribution margins § Low fidelity § Demand Prediction restricted § frequent capacity overflows § Very fragmented Orders § A lot of exceptions and contractual conditions How to differentiate my business competitively?
- 3. 3 § At change are increasingly more frequent and less predictable. § Greater need for make decisions in real time. § Most demanding Customers (demands are more personalized) § Greater reliance on Supply-Chain (Integration and collaboration) § integrated visibility operational information for improve decisions. § Warranty on integrity, unity and security on real-time data. § > tax and regulatory pressure (SOX, ISO 14000, etc). § # Failures and response times reduction. § Prevent incidents and interruptions Why the Operational Control Panels are increasingly critical? +70% of management problems are unrelated to the Strategic settings, but to implemention and operation failures. Fortune Magazine Flexibilize change To monitor indicators Operator Controller
- 4. 4 The Manager transport need go along Operation in real time Ø monitor metrics business in different dimensions v Cost, Time and Resources ... v scorecards implemented through visual indicators Ø Use of Resources Operational Intelligence and Management § Create and customize rules expeditiously. § Automatically detect events and generate alerts. § Real-time visibility Indicators. Ø Monitor and improve process flows. § To eliminate redundancies or inefficiencies § Identify bottlenecks - balance workload § Increase punctuality and reduce latencies § Minimize penalties Larger preventive and Proactive Capacity
- 5. 5 Real-time visibility throughout the supply chain Lenght of stay (Collection / delivery) Origin point Carrier inbound outbound
- 6. 6 Rules Engine Event Detection BD georeferenced TCT Solution CRM ERP TMS spreadsh eets Data from Customers Data from Vehicle, driver and Carrier Data from NC (OFF) Scripting packing lists uploads contracts IntegrationandDataLoad Load Originator Driver Supervisor Carrier Load Receiving Mobile interaction Capture Real Time Trackers Sascar BlackBox; OnixSat; Omnilink; Controlloc; among others... transponders RFID, etc Solution TCT- Transportation Control Tower InteractionwiththeTower tower Control alerts Notifications BD georeferenced
- 7. 7 • Offered as cloud service, there is no investment in software licensing and acquisition or in infrastructure. • The engagement is based on pre-established service level (SLA). • IoT based on third parties crawlers (Sascar, Omnilink, etc). • Integration with all vehicle tracking services. • Easy integration with other existing solutions (ERP, TMS, SCM, marketplaces, B2B, eCommerce, etc). • Graphic interface oriented to simple and fast adoption with user capabilities on mobile devices. • Analytical capabilities to create operational dashboards. • Based on Geo-referenced database and supported by cartographic and photographic mapping of highways, railways, etc (Including Google maps). • More accurate location because the geo-referencing considers perimeter and distance. • Monitoring polygonal areas modeled graphically and dynamically in the digital map. • Simple and fast Implementation. Easy adaptation in case of specific information requirements. Technical Characteristics
- 8. 8 ResultsDischargeTravelCharge control of the target process in real time (transport) optimization of routes • Position of Orders and Deliveries • Position of Daily rates • Position of Fines • Operational Reports • KPIs: (Dashboard) • Reports for Insurance • Guarantee and respect time limits and scheduling. • Accusing delays and penalties. • Speed discharge and pending resolution of the delivery. • Provide better visibility to the customer. • real vision of re- supplies and returns. • Identify offways • Identify unnecessary stops or not scheduled • Avoid travel risks (flooding, fines, etc). • Register incidents. • Get real-time collaboration with the tower. • Provide better visibility to the customer. • Guarantee and respect limits and schedules times. • Accusing delays and penalties. • Prepare quick and safe discharge through QR Code • Set optimized routes (smaller) • Respect restrictions routes (Contract) • Identify safe areas (<incidents) • Identify temporary interruptions routes (road repairs)
- 9. 9 Ø Routes optimization. o The starting point is the planned routing based on forecast deliveries in the short term. o Considers points stops and emergency restrictions, agreements and other restrictive inputs. ü prohibited roads, hazardous areas, timeouts, etc ü impassable roads, deviations, incidents, etc. Functional Characteristics
- 10. 10 Ø Internal Controls in Loading and Unloading: • Agile and flexible mapping of control points (Arrival, Balance, Charge / Discharge, Fiscal Office, etc). • In agricultural sites, these control points can be collection areas, silos, etc • configuration fixed routes and speed limits within the landing site. • automatic generation of alerts preventive and corrective. • Programming and verification times by control point. • proactive information generation for collection of fines (Carrier) and daily rates (Shipper). • app Mobile (mobile) - Use of QR Code and Code Bars for guiding the loading / unloading vehicle on respective discharge points. Functional Characteristics
- 11. 11 Ø Mobile app: • It offers visual query of deliveries considering packing list / order, id. driver or vehicle plate. • O app also works offline, that is, It stores the operating data for later timing until the connection is reestablished. • It supports the recording of incidents by the driver. • Allows mapping routes defined by driver (suggestion submitted to the tower). • It sends and receive notifications and alerts to/from the control tower. Functional Characteristics operators drivers Customers Tower
- 12. 12 Ø Travel controls : o route deviation alert o unforeseen stop alert o Arrival and departure time alert at the load / unloading point. o Penalty (fines) or daily rate Alert o Incident Alert Functional Characteristics
- 13. 13 Dashboard - Visual Operation Monitoring
- 15. Operational Indicators Logistic Dashboard Deliveries Storage Expedition Client Inventory Accuracy idle of assets Orders Received Per hour Dock to Stock Time cost per order shipped Average times Load / unload Cycle time Order on Time in Full Level of Retention Perfect orders Rate of Satisfaction Vehicle Incidents Used Load Capacity Transp non compliances % transp costs per sales On time shipments Shipping cost per delivery Transp cost x failures
- 16. 16 • To the Shipper: • The route optimization generates reduction of kilometrage per vehicle. • The solution indicates and supports the execution of penalties for noncompliance (carriers). • The greater punctuality and productivity generates a greater number of deliveries per vehicle and so it reduces the required number of vehicles in operation. • The solution offers a differentiated customer experience through visibility and real-time notifications, generating customer satisfaction and retention. • It offers better resources to Risk management, aimed to accidents prevention (Insurance). • Integration with all tracking services enables online visibility of the entire fleet, regardless of the technology used in vehicles. Proven benefits
- 17. 17 • To the Carrier: • Higher productivity leads a labor costs reduction (overtime, daily rates and additional) and fleet expenses reduction (fuel, tire, wear on the vehicle, etc.). • The solution indicates and supports the charging for loading / unloading delays (daily rates). • The Integration with all tracking services enables online visibility of the entire fleet, regardless of the technology in use in vehicles. • It generates greater contracting fidelity by the shippers (customers). Proven benefits
- 18. 18 • To the Risk Management: • Less probability of monitoring failures, therefore it mitigates the risk of financial burden to the insurer. • Reduced need for human resources (monitors) in the management team (Cost Reduction). • Compulog proactively draws risk management through omnichannel alerts that can be scaled in case of inoperability (scalating workflow). • Higher quality of information generated by risk management to the transport operation. Monitoring Robots Control Tower Automatic Alerts Proven benefits
- 19. Success Stories
- 20. 21 • Problem: • Operation with 30 trucks burdened by ill-planned routes and unproductive deliveries. • Solution: • Route optimization analysis. • Delivery routes monitoring (offways and stops). • Results: • Distance reduction: 16397 Km (routes), generating monthly savings (R$ 8198,00) • Delivery Productivity increasing (from 4 to 6 deliveries per truck), It reduced the fleet demand to 27 trucks Client: Lebes Stores
- 21. 22 • Problem: • Inbound operations at automakers (Mercedes and GM) • Difficulty controlling and charging daily rate expenses due to delays in loading and unloading. • Operational losses (unplanned deviations and stops, additional fuel consumption, etc.). • Solution: • Tracking of routes, schedules (arrival / departure) and times (load, route, unload) • Automatic triggering of alerts for extra daily charges. • Results: • Increase in revenue per truck (Daily rates). • Reduction of operating costs and labor charges (overtime and night overtime) • Greater punctuality and customer satisfaction Client: JSL – Júlio Simões
- 22. 23 • Problem: • Improproductiviity in discharging operations at SBC factory (production warehouses). • Delays in supplier deliveries compromising production just-in-time • JSL Fleet. • Solution: • Mapping of control points in the georeferenced polygon of the factory. • Control of scheduling of inputs and outputs (supplier and factory). • Monitoring of supply routes of each supplier (deviations and stops). • Results: • > Punctuality and productivity in factory inbound • Reduction of trucks and times in operations (by warehouse of supply). Client: Mercedes-Benz
- 23. 24 • Problem: • Passive labor, overtime and nighttime hours of drivers and helpers. • Operating 75 trucks in FEMSA • Solution: • Monitoring of routes, schedules (input / output) and times (charge, travel and discharge) • results: • Reduction of R$ 15,000 / day in the first month of monitoring Client: Schio Shipping (Purchased by JSL in Dec / 11)
- 24. 25 Negotiated price according to client; Payment monthly per trip, per vehicle or asset monitored; Price SaaS Service ( "Software as a Service")
- 25. 26 Proof of Concept We are able to prove the effectiveness of the solution through the following approaches: • Try & Buy - We can provide the solution to "Full“ use for a while, considering a specific operation and a sampling of fleet and control objects. • Backlog Analysis - If there is a georeferenced operation backlog, we can perform a previous diagnosis of the power gains with solution adoption.
- 26. 27 Additional Services • Process Review Consulting (Transportation Management) - 2 weeks • Deployment (adoption follow-up) - 2 weeks • User training - 1 day • User Support service - by call solved • In Portuguese and Spanish (July / 17) • Development of specific functionalities (bespoke). • Based on Hours estimating (project) New
- 27. 28 Why deploy this solution? Fast return on investment through effective savings achieved through better resources to manage the logistic operation. (Spent)
- 28. Thank you! Obs .; This is a generic presentation and does not aims to meet specific demands of a customer