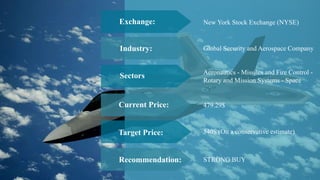
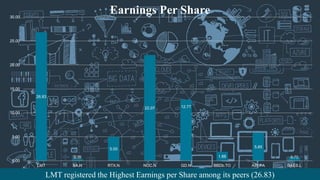
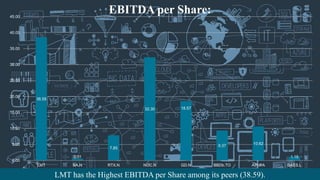
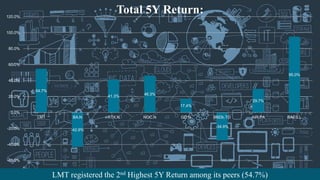
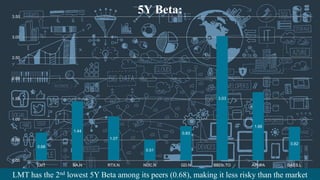
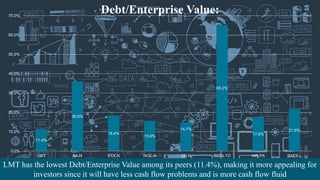
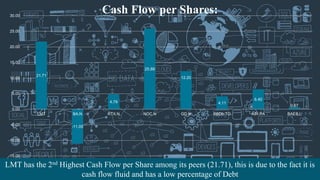
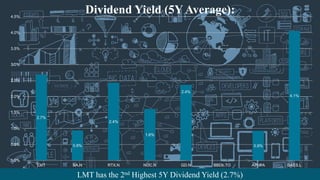
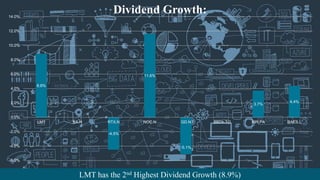
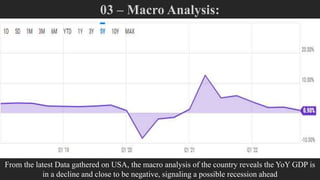
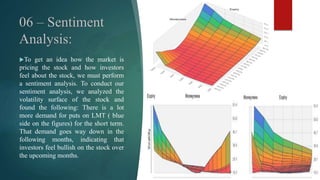
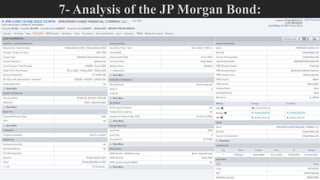
Investment Pitch For A Portfolio Composed of
Lockheed Martin (LMT) stock and JP Morgan
Corporate Bond
Agenda: 01
02
03
04
05
Brief Description of the company, as well as the
latest news and events concerning it.
Company Overview of LMT:
Fundamental, comparative analysis of LMT
alongside its peers:
LMT Peers Analysis:
Economic Quad analysis, alongside yield
curve examination
Macro Analysis:
Inspection of the price chart in order to understand
the trend and forecast based on it
LMT Technical Analysis:
Quantitative comparison of the stock with its
peers as well as the S&P500 index
LMT Quantitative Analysis:
06
A dive into investors’ sentiments by examining the
volatility surface of the stock
Sentiment Analysis:
07
Presentation of our bond of choice as well as
its risk analysis
Analysis of the JP Morgan Bond:
1 - Company Overview:
(LMT)
Exchange:
Industry:
New York Stock Exchange (NYSE)
Global Security and Aerospace Company
Aeronautics - Missiles and Fire Control -
Rotary and Mission Systems - Space
479.29$
540$ (On a conservative estimate)
Sectors
Current Price:
Target Price:
Recommendation: STRONG BUY
Nº1 Government Contractor: Golden
Standard with $41.9B in Obligations in 2021
$8B contract with the US for its F35 jets
Just signed $2B contract in Feb with the Navy,
$2B with Australia for its Black Hawk
Choppers
Just received approval for $10B of sales of
“HI mars” rockets to Poland
$19B deal with Canada for its F35 jets
Registered $66B in Sales in 2022
Company
Events &
News:
LMT and its peers:
LMT: Lockheed Martin Corp
BA.N: Boeing Co
RTX.N: Raytheon Technologies Corp
NOC.N: Northrop Grumman Corp
GD.N: General Dynamics Corp
BBDb.TO: Bombardier Inc
AIR.PA: Airbus SE
BAES.L: BAE Systems PLC
26.83
0.35
5.00
22.07 12.77
1.88
5.85
0.70
0.00
5.00
10.00
15.00
20.00
25.00
30.00
LMT BA.N RTX.N NOC.N GD.N BBDb.TO AIR.PA BAES.L
Earnings Per Share
LMT registered the Highest Earnings per Share among its peers (26.83)
38.59
0.51
7.85
32.30 18.57
9.37
10.62
1.18
0.00
5.00
10.00
15.00
20.00
25.00
30.00
35.00
40.00
45.00
LMT BA.N RTX.N NOC.N GD.N BBDb.TO AIR.PA BAES.L
EBITDA per Share:
LMT has the Highest EBITDA per Share among its peers (38.59).
54.7%
-42.9%
41.3% 46.3%
17.4%
-34.9%
29.7%
95.0%
-60.0%
-40.0%
-20.0%
0.0%
20.0%
40.0%
60.0%
80.0%
100.0%
120.0%
LMT BA.N RTX.N NOC.N GD.N BBDb.TO AIR.PA BAES.L
Total 5Y Return:
LMT registered the 2nd Highest 5Y Return among its peers (54.7%)
0.68
1.44
1.07
0.51
0.83
3.03
1.66
0.82
0.00
0.50
1.00
1.50
2.00
2.50
3.00
3.50
LMT BA.N RTX.N NOC.N GD.N BBDb.TO AIR.PA BAES.L
5Y Beta:
LMT has the 2nd lowest 5Y Beta among its peers (0.68), making it less risky than the market
11.4%
36.0%
18.4%
15.6%
14.7%
65.2%
17.6%
21.6%
0.0%
10.0%
20.0%
30.0%
40.0%
50.0%
60.0%
70.0%
LMT BA.N RTX.N NOC.N GD.N BBDb.TO AIR.PA BAES.L
Debt/Enterprise Value:
LMT has the lowest Debt/Enterprise Value among its peers (11.4%), making it more appealing for
investors since it will have less cash flow problems and is more cash flow fluid
21.71
-11.05
4.79
25.88
12.20
4.11
6.40
0.67
-15.00
-10.00
-5.00
0.00
5.00
10.00
15.00
20.00
25.00
30.00
LMT BA.N RTX.N NOC.N GD.N BBDb.TO AIR.PA BAES.L
Cash Flow per Shares:
LMT has the 2nd Highest Cash Flow per Share among its peers (21.71), this is due to the fact it is
cash flow fluid and has a low percentage of Debt
2.7%
0.9%
2.4%
1.6%
2.4%
0.9%
4.1%
0.0%
0.5%
1.0%
1.5%
2.0%
2.5%
3.0%
3.5%
4.0%
4.5%
LMT BA.N RTX.N NOC.N GD.N BBDb.TO AIR.PA BAES.L
Dividend Yield (5Y Average):
LMT has the 2nd Highest 5Y Dividend Yield (2.7%)
8.9%
-4.5%
11.6%
-5.1%
3.7%
4.4%
-6.0%
-4.0%
-2.0%
0.0%
2.0%
4.0%
6.0%
8.0%
10.0%
12.0%
14.0%
LMT BA.N RTX.N NOC.N GD.N BBDb.TO AIR.PA BAES.L
Dividend Growth:
LMT has the 2nd Highest Dividend Growth (8.9%)
From the latest Data gathered on USA, the macro analysis of the country reveals the YoY GDP is
in a decline and close to be negative, signaling a possible recession ahead
The inflation fell like the GDP, reaching 6.41%
Deflation Ahead:
With the YoY GDP and Inflation both falling, we can expect USA to enter a Deflationary
Economical Quad (also known as Quad 4 or 4th Quad) characterized as follows:
The 4 Quads of the Economy:
The Yield Curve Analysis of USA:
USA’s yield curve is inverted, signaling an upcoming recession ahead. Because of that, we can
expect growth stocks to go down in value unlike defensive stocks which we believe will hold their
ground and some even boom in the upcoming months
The Yield Curve Analysis of USA:
The current spread between 10-Year Bonds and 3 Months Bonds is heavily inverted. By looking
at the chart, we notice that each time the yield curve was inverted, since the 60s, there was a
recession the following year (shaded in grey)
Credit Card Debt vs Savings:
The Credit Card Debt has reached an all time high and is close to reach 1 Trillion USD, compared
with an extremely small savings percentage of 3.1%. This is an indicator of serious upcoming
economical crisis
We can notice in the price chart a double bottom formation, that is more than one month old, and the two bottoms are less than 3%
apart. Additionally, the uptrend after the first bottom goes up by more than 10% and the price does break the neckline, indicating a
strong reversal of the downtrend and an uptrend ahead
Double Bottom Formation:
The MACD analysis shows that the MACD Line is under the Signal Line since early 2023 due to a small correction. The way the
two signals are headed, it seems the MACD Line will pass over the Signal Line; if so, confirming our Buy Signal
MACD Analysis:
Finally, we used the Trend-Based Fibonacci Approach to forecast our price using 1.618 starting from what we consider to be the
beginning of the whole uptrend in October 2022. We Reached a target price of 540 USD
Trend-Based Fibonacci Extension Analysis:
Quantitative comparison with the following:
 Northrop Grumman Corp (NOC)
 General Dynamics Corp (GD)
 S&P500 (SPX)
Weekly Return Analysis:
 LMT shows the highest Mean Return among all four Returns with 0.2%.
 Despite that, LMT is the 2nd riskiest amongst the four in terms of Volatility since it has the 2nd highest standard deviation
with 3.76%.
 To put both things into context, we computed the Sharpe Ratio of each to consider how much return we are getting for
each level of risk. LMT’s Sharpe Ratio is the 2nd highest amongst all four, signaling we are getting a high level of return
for the risk we are undertaking with the stock, although it fails to beat the Index.
 LMT is the only stock with positive skewness: In terms of risk associated with skewness, the others have more outliers
on the bottom region, and while a few frequent gains happen, it can lead to whopping losses, they are much riskier.
 To add to that, in terms of Kurtosis, all are above 3, with SPX being the highest (8.32). They are leptokurtic, they have
fatter tails and are more peaked, the bigger the Kurtosis, the bigger the profits, the losses, the risk.
 We can also add that we are 95% confident, based on our VAR calculations, that the worst daily loss will not exceed
5.98% for LMT, 4.45% for SPX, 5.95% for NOC and 6.25% for GD.
LMT SPX NOC GD
Mean 0.20% 0.18% 0.19% 0.09%
Median 0.16% 0.40% 0.30% 0.42%
Maximum 19.63% 12.10% 14.38% 14.11%
Minimum -14.09% -14.98% -12.30% -18.37%
Std. Dev. 3.76% 2.82% 3.73% 3.85%
Skewness 0.2327 (0.5644) (0.1105) (0.5998)
Kurtosis 8.0342 8.3203 4.9722 6.9039
Sharpe Ratio 5.34% 6.28% 5.12% 2.33%
VaR -5.98% -4.45% -5.95% -6.25%
Weekly Return Analysis:
To get an idea how the market is
pricing the stock and how investors
feel about the stock, we must perform
a sentiment analysis. To conduct our
sentiment analysis, we analyzed the
volatility surface of the stock and
found the following: There is a lot
more demand for puts on LMT ( blue
side on the figures) for the short term.
That demand goes way down in the
following months, indicating that
investors feel bullish on the stock over
the upcoming months.
Bond Risk
Analysis
Duration = 0.9458
 Based on its duration, we can expect that if the
interest rates rise by 1%, the bond will go down
in value by 0.9458%, and vice versa. It is
relatively small (is even less than 1%, meaning
the bond is not so volatile).
Convexity = 1.2837
 The convexity is an indicator of the sensitivity
of a bond's duration to changes in yield.
Both are relatively small, signaling lower
risk for the bond.
Lockheed Martin Stock Pitch

Lockheed Martin Stock Pitch

  • 1.
    Investment Pitch ForA Portfolio Composed of Lockheed Martin (LMT) stock and JP Morgan Corporate Bond
  • 2.
    Agenda: 01 02 03 04 05 Brief Descriptionof the company, as well as the latest news and events concerning it. Company Overview of LMT: Fundamental, comparative analysis of LMT alongside its peers: LMT Peers Analysis: Economic Quad analysis, alongside yield curve examination Macro Analysis: Inspection of the price chart in order to understand the trend and forecast based on it LMT Technical Analysis: Quantitative comparison of the stock with its peers as well as the S&P500 index LMT Quantitative Analysis: 06 A dive into investors’ sentiments by examining the volatility surface of the stock Sentiment Analysis: 07 Presentation of our bond of choice as well as its risk analysis Analysis of the JP Morgan Bond:
  • 3.
    1 - CompanyOverview: (LMT)
  • 4.
    Exchange: Industry: New York StockExchange (NYSE) Global Security and Aerospace Company Aeronautics - Missiles and Fire Control - Rotary and Mission Systems - Space 479.29$ 540$ (On a conservative estimate) Sectors Current Price: Target Price: Recommendation: STRONG BUY
  • 5.
    Nº1 Government Contractor:Golden Standard with $41.9B in Obligations in 2021 $8B contract with the US for its F35 jets Just signed $2B contract in Feb with the Navy, $2B with Australia for its Black Hawk Choppers Just received approval for $10B of sales of “HI mars” rockets to Poland $19B deal with Canada for its F35 jets Registered $66B in Sales in 2022 Company Events & News:
  • 6.
    LMT and itspeers: LMT: Lockheed Martin Corp BA.N: Boeing Co RTX.N: Raytheon Technologies Corp NOC.N: Northrop Grumman Corp GD.N: General Dynamics Corp BBDb.TO: Bombardier Inc AIR.PA: Airbus SE BAES.L: BAE Systems PLC
  • 7.
    26.83 0.35 5.00 22.07 12.77 1.88 5.85 0.70 0.00 5.00 10.00 15.00 20.00 25.00 30.00 LMT BA.NRTX.N NOC.N GD.N BBDb.TO AIR.PA BAES.L Earnings Per Share LMT registered the Highest Earnings per Share among its peers (26.83)
  • 8.
    38.59 0.51 7.85 32.30 18.57 9.37 10.62 1.18 0.00 5.00 10.00 15.00 20.00 25.00 30.00 35.00 40.00 45.00 LMT BA.NRTX.N NOC.N GD.N BBDb.TO AIR.PA BAES.L EBITDA per Share: LMT has the Highest EBITDA per Share among its peers (38.59).
  • 9.
    54.7% -42.9% 41.3% 46.3% 17.4% -34.9% 29.7% 95.0% -60.0% -40.0% -20.0% 0.0% 20.0% 40.0% 60.0% 80.0% 100.0% 120.0% LMT BA.NRTX.N NOC.N GD.N BBDb.TO AIR.PA BAES.L Total 5Y Return: LMT registered the 2nd Highest 5Y Return among its peers (54.7%)
  • 10.
    0.68 1.44 1.07 0.51 0.83 3.03 1.66 0.82 0.00 0.50 1.00 1.50 2.00 2.50 3.00 3.50 LMT BA.N RTX.NNOC.N GD.N BBDb.TO AIR.PA BAES.L 5Y Beta: LMT has the 2nd lowest 5Y Beta among its peers (0.68), making it less risky than the market
  • 11.
    11.4% 36.0% 18.4% 15.6% 14.7% 65.2% 17.6% 21.6% 0.0% 10.0% 20.0% 30.0% 40.0% 50.0% 60.0% 70.0% LMT BA.N RTX.NNOC.N GD.N BBDb.TO AIR.PA BAES.L Debt/Enterprise Value: LMT has the lowest Debt/Enterprise Value among its peers (11.4%), making it more appealing for investors since it will have less cash flow problems and is more cash flow fluid
  • 12.
    21.71 -11.05 4.79 25.88 12.20 4.11 6.40 0.67 -15.00 -10.00 -5.00 0.00 5.00 10.00 15.00 20.00 25.00 30.00 LMT BA.N RTX.NNOC.N GD.N BBDb.TO AIR.PA BAES.L Cash Flow per Shares: LMT has the 2nd Highest Cash Flow per Share among its peers (21.71), this is due to the fact it is cash flow fluid and has a low percentage of Debt
  • 13.
    2.7% 0.9% 2.4% 1.6% 2.4% 0.9% 4.1% 0.0% 0.5% 1.0% 1.5% 2.0% 2.5% 3.0% 3.5% 4.0% 4.5% LMT BA.N RTX.NNOC.N GD.N BBDb.TO AIR.PA BAES.L Dividend Yield (5Y Average): LMT has the 2nd Highest 5Y Dividend Yield (2.7%)
  • 14.
    8.9% -4.5% 11.6% -5.1% 3.7% 4.4% -6.0% -4.0% -2.0% 0.0% 2.0% 4.0% 6.0% 8.0% 10.0% 12.0% 14.0% LMT BA.N RTX.NNOC.N GD.N BBDb.TO AIR.PA BAES.L Dividend Growth: LMT has the 2nd Highest Dividend Growth (8.9%)
  • 15.
    From the latestData gathered on USA, the macro analysis of the country reveals the YoY GDP is in a decline and close to be negative, signaling a possible recession ahead
  • 16.
    The inflation felllike the GDP, reaching 6.41%
  • 17.
    Deflation Ahead: With theYoY GDP and Inflation both falling, we can expect USA to enter a Deflationary Economical Quad (also known as Quad 4 or 4th Quad) characterized as follows:
  • 18.
    The 4 Quadsof the Economy:
  • 19.
    The Yield CurveAnalysis of USA: USA’s yield curve is inverted, signaling an upcoming recession ahead. Because of that, we can expect growth stocks to go down in value unlike defensive stocks which we believe will hold their ground and some even boom in the upcoming months
  • 20.
    The Yield CurveAnalysis of USA: The current spread between 10-Year Bonds and 3 Months Bonds is heavily inverted. By looking at the chart, we notice that each time the yield curve was inverted, since the 60s, there was a recession the following year (shaded in grey)
  • 21.
    Credit Card Debtvs Savings: The Credit Card Debt has reached an all time high and is close to reach 1 Trillion USD, compared with an extremely small savings percentage of 3.1%. This is an indicator of serious upcoming economical crisis
  • 22.
    We can noticein the price chart a double bottom formation, that is more than one month old, and the two bottoms are less than 3% apart. Additionally, the uptrend after the first bottom goes up by more than 10% and the price does break the neckline, indicating a strong reversal of the downtrend and an uptrend ahead Double Bottom Formation:
  • 23.
    The MACD analysisshows that the MACD Line is under the Signal Line since early 2023 due to a small correction. The way the two signals are headed, it seems the MACD Line will pass over the Signal Line; if so, confirming our Buy Signal MACD Analysis:
  • 24.
    Finally, we usedthe Trend-Based Fibonacci Approach to forecast our price using 1.618 starting from what we consider to be the beginning of the whole uptrend in October 2022. We Reached a target price of 540 USD Trend-Based Fibonacci Extension Analysis:
  • 25.
    Quantitative comparison withthe following:  Northrop Grumman Corp (NOC)  General Dynamics Corp (GD)  S&P500 (SPX)
  • 26.
    Weekly Return Analysis: LMT shows the highest Mean Return among all four Returns with 0.2%.  Despite that, LMT is the 2nd riskiest amongst the four in terms of Volatility since it has the 2nd highest standard deviation with 3.76%.  To put both things into context, we computed the Sharpe Ratio of each to consider how much return we are getting for each level of risk. LMT’s Sharpe Ratio is the 2nd highest amongst all four, signaling we are getting a high level of return for the risk we are undertaking with the stock, although it fails to beat the Index.  LMT is the only stock with positive skewness: In terms of risk associated with skewness, the others have more outliers on the bottom region, and while a few frequent gains happen, it can lead to whopping losses, they are much riskier.  To add to that, in terms of Kurtosis, all are above 3, with SPX being the highest (8.32). They are leptokurtic, they have fatter tails and are more peaked, the bigger the Kurtosis, the bigger the profits, the losses, the risk.  We can also add that we are 95% confident, based on our VAR calculations, that the worst daily loss will not exceed 5.98% for LMT, 4.45% for SPX, 5.95% for NOC and 6.25% for GD. LMT SPX NOC GD Mean 0.20% 0.18% 0.19% 0.09% Median 0.16% 0.40% 0.30% 0.42% Maximum 19.63% 12.10% 14.38% 14.11% Minimum -14.09% -14.98% -12.30% -18.37% Std. Dev. 3.76% 2.82% 3.73% 3.85% Skewness 0.2327 (0.5644) (0.1105) (0.5998) Kurtosis 8.0342 8.3203 4.9722 6.9039 Sharpe Ratio 5.34% 6.28% 5.12% 2.33% VaR -5.98% -4.45% -5.95% -6.25%
  • 27.
  • 28.
  • 29.
    To get anidea how the market is pricing the stock and how investors feel about the stock, we must perform a sentiment analysis. To conduct our sentiment analysis, we analyzed the volatility surface of the stock and found the following: There is a lot more demand for puts on LMT ( blue side on the figures) for the short term. That demand goes way down in the following months, indicating that investors feel bullish on the stock over the upcoming months.
  • 31.
    Bond Risk Analysis Duration =0.9458  Based on its duration, we can expect that if the interest rates rise by 1%, the bond will go down in value by 0.9458%, and vice versa. It is relatively small (is even less than 1%, meaning the bond is not so volatile). Convexity = 1.2837  The convexity is an indicator of the sensitivity of a bond's duration to changes in yield. Both are relatively small, signaling lower risk for the bond.