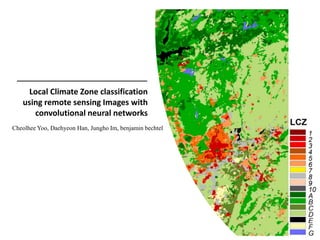
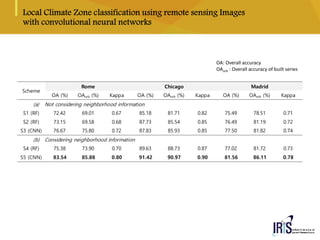
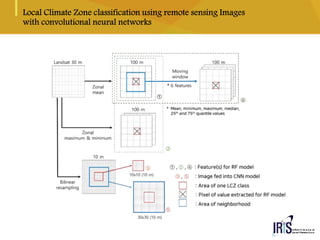
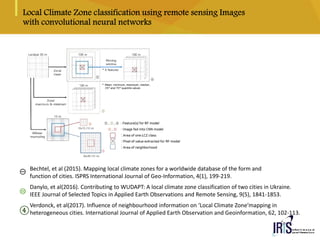
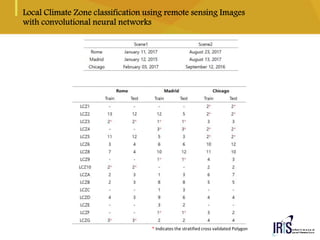
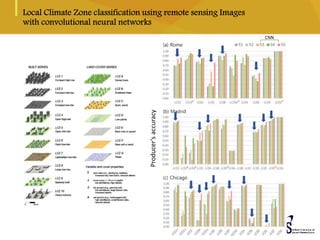
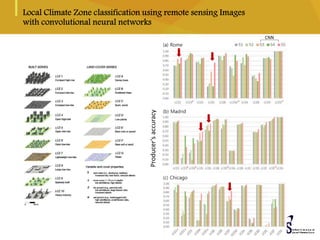
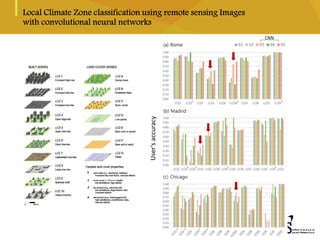
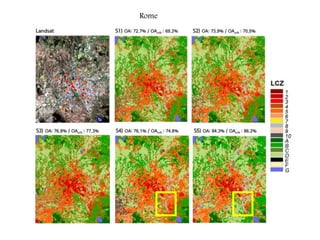
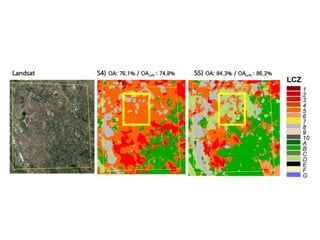
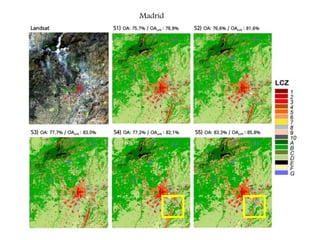
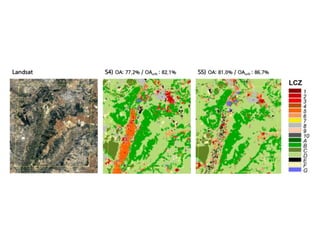
Local Climate Zone classification
using remote sensing Images with
convolutional neural networks
Cheolhee Yoo, Daehyeon Han, Jungho Im, benjamin bechtel
OA: Overall accuracy
OAurb : Overall accuracy of built series
Scheme
Rome Chicago Madrid
OA (%) OAurb (%) Kappa OA (%) OAurb (%) Kappa OA (%) OAurb (%) Kappa
(a) Not considering neighborhood information
S1 (RF) 72.42 69.01 0.67 85.18 81.71 0.82 75.49 78.51 0.71
S2 (RF) 73.15 69.58 0.68 87.73 85.54 0.85 76.49 81.19 0.72
S3 (CNN) 76.67 75.80 0.72 87.83 85.93 0.85 77.50 81.82 0.74
(b) Considering neighborhood information
S4 (RF) 75.38 73.90 0.70 89.63 88.73 0.87 77.02 81.72 0.73
S5 (CNN) 83.54 85.88 0.80 91.42 90.97 0.90 81.56 86.11 0.78
1
Bechtel, et al (2015). Mapping local climate zones for a worldwide database of the form and
function of cities. ISPRS International Journal of Geo-Information, 4(1), 199-219.
Danylo, et al(2016). Contributing to WUDAPT: A local climate zone classification of two cities in Ukraine.
IEEE Journal of Selected Topics in Applied Earth Observations and Remote Sensing, 9(5), 1841-1853.
Verdonck, et al(2017). Influence of neighbourhood information on ‘Local Climate Zone’mapping in
heterogeneous cities. International Journal of Applied Earth Observation and Geoinformation, 62, 102-113.
①
②
④
* Indicates the stratified cross validated Polygon
Producer’saccuracy
CNN
Producer’saccuracy
CNN
Producer’saccuracy
CNN
User’saccuracy
CNN
Rome
Madrid
Local Climate Zone classification using CNN

Local Climate Zone classification using CNN

  • 1.
    Local Climate Zoneclassification using remote sensing Images with convolutional neural networks Cheolhee Yoo, Daehyeon Han, Jungho Im, benjamin bechtel
  • 2.
    OA: Overall accuracy OAurb: Overall accuracy of built series Scheme Rome Chicago Madrid OA (%) OAurb (%) Kappa OA (%) OAurb (%) Kappa OA (%) OAurb (%) Kappa (a) Not considering neighborhood information S1 (RF) 72.42 69.01 0.67 85.18 81.71 0.82 75.49 78.51 0.71 S2 (RF) 73.15 69.58 0.68 87.73 85.54 0.85 76.49 81.19 0.72 S3 (CNN) 76.67 75.80 0.72 87.83 85.93 0.85 77.50 81.82 0.74 (b) Considering neighborhood information S4 (RF) 75.38 73.90 0.70 89.63 88.73 0.87 77.02 81.72 0.73 S5 (CNN) 83.54 85.88 0.80 91.42 90.97 0.90 81.56 86.11 0.78 1
  • 4.
    Bechtel, et al(2015). Mapping local climate zones for a worldwide database of the form and function of cities. ISPRS International Journal of Geo-Information, 4(1), 199-219. Danylo, et al(2016). Contributing to WUDAPT: A local climate zone classification of two cities in Ukraine. IEEE Journal of Selected Topics in Applied Earth Observations and Remote Sensing, 9(5), 1841-1853. Verdonck, et al(2017). Influence of neighbourhood information on ‘Local Climate Zone’mapping in heterogeneous cities. International Journal of Applied Earth Observation and Geoinformation, 62, 102-113. ① ② ④
  • 5.
    * Indicates thestratified cross validated Polygon
  • 6.
  • 7.
  • 8.
  • 9.
  • 10.
  • 12.