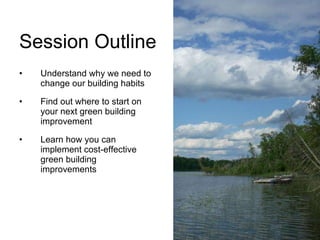
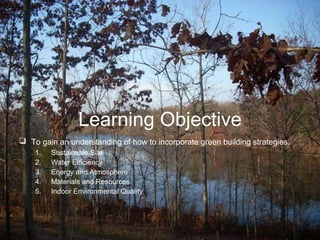
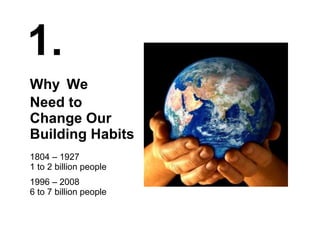
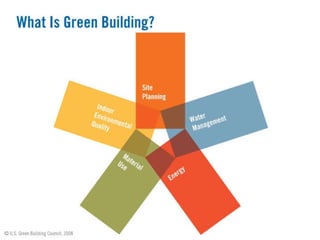
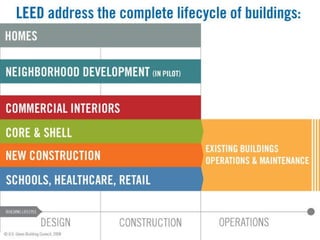
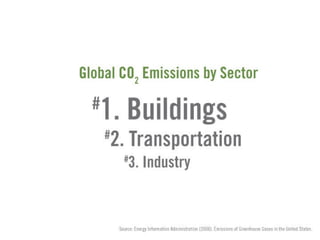
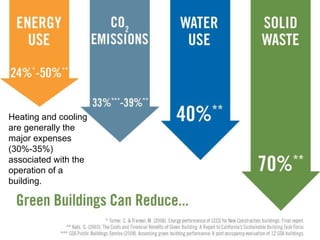
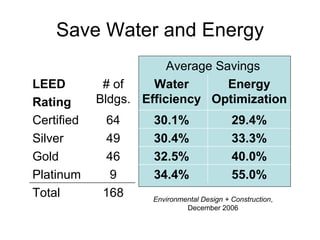
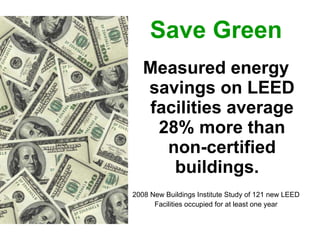
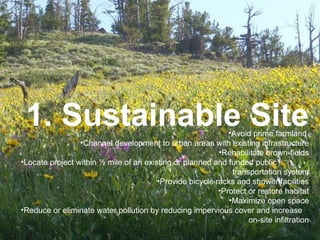
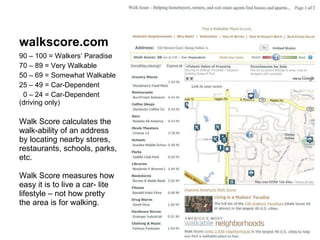
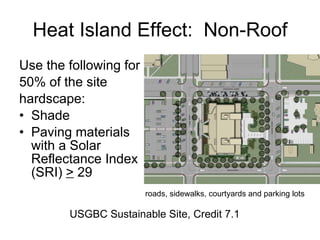
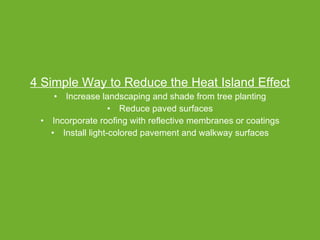
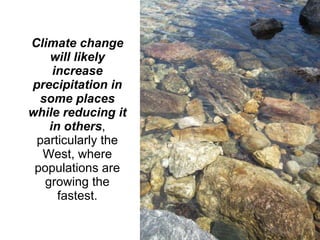
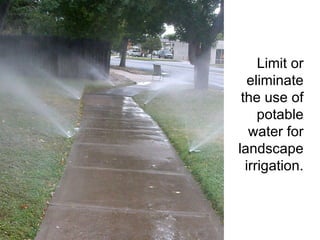
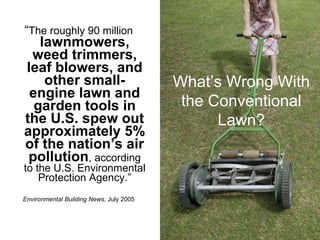
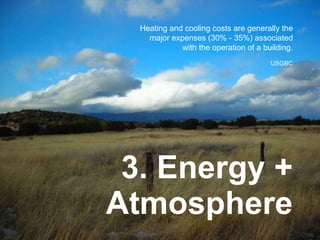
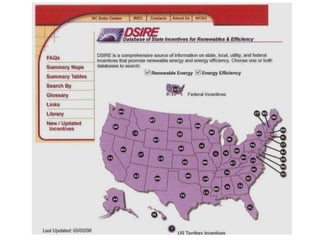
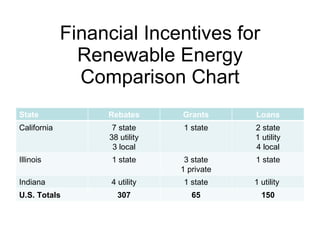
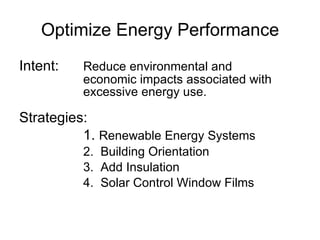
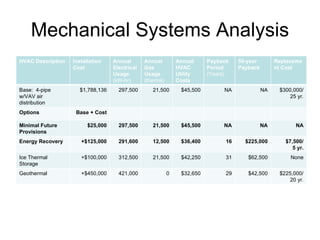
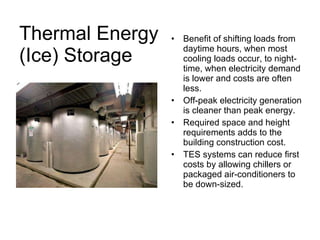
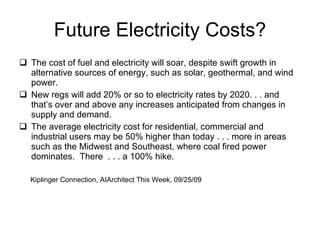
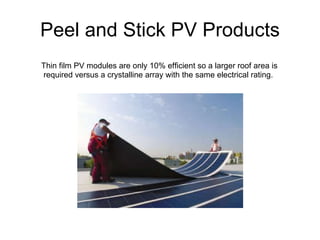
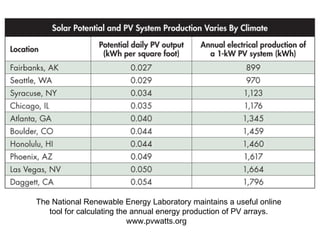
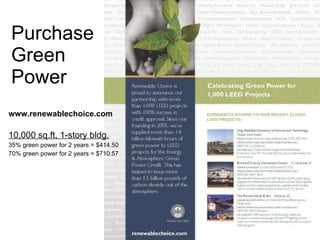
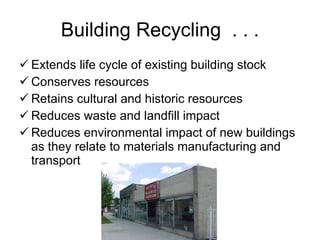
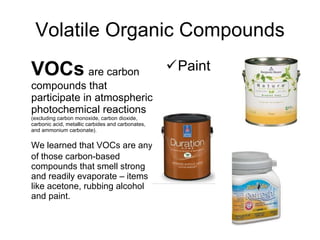
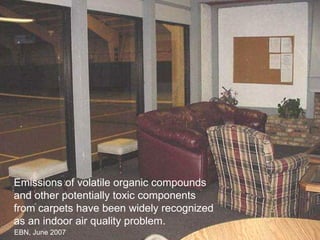
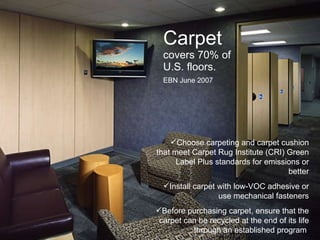
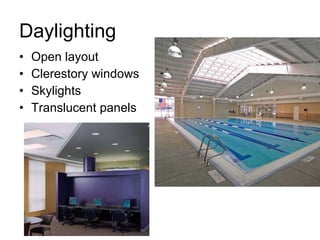
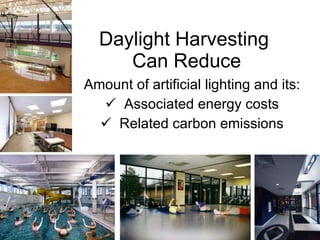
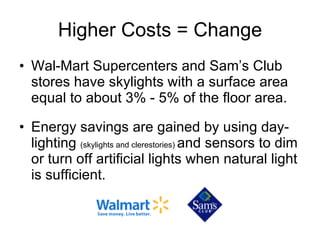
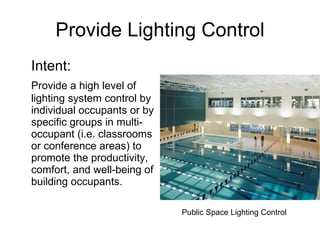
Live Well, Live Green, Indiana Park and Recreation Conference, West Lafayette, Indiana January 21, 2010 Build Green
Session Outline Understand why we need to change our building habits Find out where to start on your next green building improvement Learn how you can implement cost-effective green building improvements
Learning Objective To gain an understanding of how to incorporate green building strategies . Sustainable Site Water Efficiency Energy and Atmosphere Materials and Resources Indoor Environmental Quality
Why   We Need to Change Our Building Habits 1804 – 1927 1 to 2 billion people 1996 – 2008 6 to 7 billion people 1.
“  . . .   buildings are the biggest source of energy use and greenhouse gas emissions ,   which in turn impact the world’s climate changes.” Green Building:  Essential Design Strategies for a Sustainable Future Barbara A. Nadel, FAIA, Architectural Record, November 2006
“ Global warming is not caused by natural forces beyond our control. . . . human beings are the cause of the problem.  And so it is our responsibility to fix it.” An Inconvenient Truth Al Gore Total Energy Use
Oil Dependence The Middle East holds 61% of the world's proven oil reserves.   North America has 5%.
Increasing Oil Demand Unless there is a dramatic effort to change our consumption, energy demand is expected to rise by nearly 20 percent by 2030 according to the Department of Energy.  Source:  Energy Information Administration
The amount of U.S. greenhouse gases flowing into the atmosphere , mainly carbon dioxide from burning fossil fuels,  increased last year by 1.4 percent after a decline in 2006. Source:  U.S. Energy Department  Associated Press, 12/03/08
“ Carbon emissions have been  growing at 3.5% per year since 2000 , up sharply from the 0.9 percent per year in the 1990s.” 02/15/09 EBN 09/09
01/23/09
Climate Change Quickens, Seas Rise Global warming is happening faster than expected and at worst could raise sea levels by up to 6-1/2’  by 2100 according to a group of scientists.  November 24, 3009
Where Do We Start to Build Green? 2.
A leading-edge system for certifying the greenest performing buildings in the world. www.usgbc.org


Heating and cooling are generally the major expenses (30%-35%) associated with the operation of a building.
Save Water and Energy Average Savings LEED  Rating # of Bldgs. Water Efficiency Energy Optimization Certified 64 30.1% 29.4% Silver 49 30.4% 33.3% Gold 46 32.5% 40.0% Platinum 9 34.4% 55.0% Total 168 Environmental Design + Construction , December 2006
Save Green Measured energy savings on LEED facilities average 28% more than non-certified buildings.   2008 New Buildings Institute Study of 121 new LEED Facilities occupied for at least one year
Green Building Benefits Reduce or eliminate negative environmental impacts Reduce operating costs Enhance work productivity Reduce or eliminate indoor air quality problems Why would anyone choose to build in a way that isn’t comfortable, healthy, and energy efficient?
Ways to Make Your Building Improvements Green 3.
#1   Build a LEED Project Level of LEED Rating Ave. Cost Premium Certified 0.66%* Silver 2.11%  Gold 1.82% Platinum 6.50% Environmental Design + Construction , December 2006
Green buildings are good for the environment, people, and they provide life-cycle cost savings. The Bottom Line:
#2  Incorporate Cost-Effective Green Building Strategies
1. Sustainable Site Avoid prime farmland  Channel development to urban areas with existing infrastructure Rehabilitate brown-fields Locate project within ½ mile of an existing or planned and funded public  transportation system Provide bicycle racks and shower facilities Protect or restore habitat Maximize open space Reduce or eliminate water pollution by reducing impervious cover and increase  on-site infiltration
Install Bicycle Racks Provide bicycle racks for 5% or more of all building users during peak time Reduce automobile use that contributes to air pollution Reduce dependency on oil Reduce impact of oil refining  Promote well-being
Drive Less Walk, bike, carpool or take public transportation more often.   You’ll save one lb of CO2 for every mile you don’t drive. Your car will emit as much CO2 in a year as your entire household = 12,000 lbs.
 
walkscore.com 90 – 100 = Walkers’ Paradise 70 – 89 = Very Walkable 50 – 69 = Somewhat Walkable 25 – 49 = Car-Dependent 0 – 24 = Car-Dependent  (driving only) Walk Score calculates the walk-ability of an address by locating nearby stores, restaurants, schools, parks, etc. Walk Score measures how easy it is to live a car- lite lifestyle – not how pretty the area is for walking.
 
Provide Hybrid Parking Intent:  Reduce pollution and land  development  impacts from automobile use Strategy: Provide preferred parking for low-emitting and  fuel-efficient  vehicles for 5% of the total  parking capacity of the site Example:   200 parking spaces x 5%=10 preferred parking spaces
Heat Island Effect:  Environmental Issues The use of dark, non-reflective surfaces for parking, roofs, walkways and other surfaces contributes to heat island effects. As a result of heat island effects, ambient temperatures in urban areas can be artificially elevated by more than 10 degrees when compared with surrounding suburban and undeveloped areas.  This results in: increased cooling loads in the summer; larger HVAC equipment;  increased electrical demand;  more greenhouse gas + pollution; and increased energy consumption .  Urban heat islands can maintain temperatures 6 – 8 degrees above that of surrounding rural land. EBN September ‘09
Heat Island Effect:  Non-Roof Use the following for  50% of the site  hardscape: Shade  Paving materials with a Solar Reflectance Index (SRI)  >  29 roads, sidewalks, courtyards and parking lots USGBC Sustainable Site, Credit 7.1
Paving Materials’ SRI Solar Reflectance Index (SRI) is the measure of a material’s ability to reject solar heat, as shown by a small temperature rise. Material Reflectance SRI New Gray Concrete 0.35 35 Weathered Gray Concrete 0.20 19 New White Concrete 0.70 86 Weathered White Concrete 0.40 45 New Asphalt 0.05 0 Weathered Asphalt 0.10 6
Improve the curb appeal
 
Did You Know? Proper tree placement can reduce air-conditioning costs by 30% AIA,  Vegetation for Sun Control   Green Step Web Video
Heat Island Effect:  Roof Use roofing materials having a Solar Reflectance Index (SRI) equal to or greater than the values of the table below for a minimum of 75% of the roof surface. USGBC Sustainable Site, Credit 7.2 Roof Type Slope SRI Low-Sloped Roof <  2:12 78 Steep-Sloped Roof > 2:12 29
Roofing Materials SRI Material Solar Reflectance Temperature Rise SRI Gray EPDM 0.23 68 21 Gray Asphalt Shingle 0.22 67 22 White Coating on Metal Roof 0.67 28 79 White EPDM 0.69 25 84 Rising temperatures lead to increased cooling requirements, requiring energy and causing associated emissions.
new roof, new color + drainage White EPDM SRI = 84 Gray EPDM  SRI = 21
Make Your Roof “C-o-o-l” Metal roofs can reflect up to 70% of the sun’s energy and reduce cooling costs by up to 20% Reduce HVAC system size due to smaller peak cooling loads
Green Roofs Reduces roof heat gain  (Sunny 95 degrees, conventional roofs reach 175 vs green at ambient air temperature) Reduces heat island effect Reduces indoor sound  by as much as 40 decibels Reduces storm water runoff Extends roof life, no u.v. rays Energy conservation  plants and 4 inches of growing medium reduce indoor temperatures 6 to 8 degrees and can reduce air-conditioning costs 25 to 50% in single story buildings Live roof replacement every 20 years  u.v. rays breaks down container/tray systems  www.greenroofs.com
4 Simple Way to Reduce the Heat Island Effect Increase landscaping and shade from tree planting Reduce paved surfaces Incorporate roofing with reflective membranes or coatings Install light-colored pavement and walkway surfaces
Less than 3 percent of the water on Earth is fresh;  much of that is unreachable in glaciers, ice-caps or deep in the earth. 2. Water Efficiency`
Climate change will likely increase precipitation in some places while reducing it in others , particularly the West, where populations are growing the fastest. Environmental Building News, September 2008
Limit or eliminate the use of potable water for landscape irrigation.
“ The roughly 90 million   lawnmowers, weed trimmers, leaf blowers, and other small-engine lawn and garden tools in the U.S. spew out approximately 5% of the nation’s air pollution , according to the U.S. Environmental Protection Agency.” Environmental Building News , July 2005 What’s Wrong With the Conventional Lawn?
Use Native Landscaping Reduced air pollution Reduced nutrient runoff, no fertilizer  Reduced pesticide use Increased biodiversity Lower annual operating costs
“ Some experts say that  water may be an even more challenging problem than energy in the coming decades  . . . ” Environmental Building News, September 2008
Lower Volumes of Potable Water + Less Water for Water Treatment Energy Savings and  Carbon Pollution Reduction
Reduce Water use by 20%-30%  Intent: Maximize water efficiency within buildings to reduce  the burden on municipal water supply and waste  water systems. Strategy: Use high-efficiency  fixtures and occupant  sensors to reduce the potable  water demand.
Greening Locker Rooms Install fixtures high a high  water efficiency Provide  touch-less  fixtures Purchase products with a  longer lifecycle Consider  environmentally-friendly  products Purchase products with a  high recycled content  to conserve resources and prevent overflow in landfills
Low-Flow  Showerheads Aging showerheads using as much as 8 gallons per minute Although the federal maximum is 2.5 gpm, models from Bricor, Delta, and Niagara offer satisfying showers with  1.6 gpm or a a 36% water savings over a 2.5 gpm showerhead.
Water Saving Fixtures Toilet flushing is the largest single use of water in most buildings. Zurn’s EcoVantage uses one pint, or 0.125 or 1/8 gallon of water per flush.  They are all sensor-controlled (battery or hard-wired) and have a manual button override. www.zurn.com 1.28 gallons of water per  flush
Four independent, real-world studies . . . have all shown that  sensor-activated faucets increase water use by anywhere from 30% to 100% .  Sensor-activated flushes on toilets and urinals also increase water use, due mainly to “phantom flushes ”.  Environmental Building News – April 2009
4 Simple Ways to Save Water + Costs Use native and or drought resistant landscape Use high-efficiency water fixtures Use low-flow toilets + urinals Consider automatic sensors
3. Energy + Atmosphere Heating and cooling costs are generally the major expenses (30% - 35%) associated with the operation of a building. USGBC
Oil Prices and the Future Prices will start to head up in Spring 2009 Drivers are taking to the road again . . .  today’s low prices plant the seed of future hikes By December 2009, the price per barrel will average $70 or $2 a gallon 2010, growing oil consumption will push prices to $100 a barrel.  Kiplinger Connection, AIArchitect This Week, December 12, 2008
Complete an Energy Audit  www.energysavers.gov Learn Where you are losing energy How to conduct your own audit How to hire a professional Or, choose the topic you want to explore: Tax Credits + Rebates Designing + Remodeling Heating + Cooling Landscaping Water Heating Appliances + Electronics Electricity Insulation + Air Sealing Lighting + Day-lighting Windows, Doors + Skylights
DSIRE Database of State Incentives for Renewables & Efficiency DSIRE is a comprehensive source of information on state, local, utility, and federal incentives that promote renewable energy and energy efficiency. www.dsireusa.org
 
 
Financial Incentives for Renewable Energy Comparison Chart State Rebates Grants Loans California 7 state 38 utility 3 local 1 state 2 state 1 utility 4 local Illinois 1 state 3 state 1 private 1 state Indiana 4 utility 1 state 1 utility  U.S. Totals 307 65 150
Optimize Energy Performance Intent: Reduce environmental and  economic impacts associated with  excessive energy use. Strategies: 1.  Renewable Energy Systems 2.  Building Orientation 3.  Add Insulation  4.  Solar Control Window Films
Mechanical Systems Analysis HVAC Description Installation Cost Annual Electrical Usage  (kW-hr) Annual Gas Usage  (therms) Annual HVAC Utility Costs Payback Period  (Years) 50-year Payback Replacement Cost Base:  4-pipe w/VAV air distribution  $1,788,136 297,500 21,500 $45,500 NA NA $300,000/ 25 yr. Options Base + Cost Minimal Future Provisions $25,000 297,500 21,500 $45,500 NA NA NA Energy Recovery +$125,000 291,600 12,500 $36,400 16 $225,000 $7,500/ 5 yr. Ice Thermal Storage +$100,000 312,500 21,500 $42,250 31 $62,500 None Geothermal +$450,000 421,000 0 $32,650 29 $42,500 $225,000/ 20 yr.
Thermal Energy  (Ice) Storage Benefit of shifting loads from daytime hours, when most cooling loads occur, to night-time, when electricity demand is lower and costs are often less. Off-peak electricity generation is cleaner than peak energy. Required space and height requirements adds to the building construction cost. TES systems can reduce first costs by allowing chillers or packaged air-conditioners to be down-sized.
Saving Money with Off-Peak Electricity
Geo-Thermal  Heat Pumps Ground-source heat pumps (GSHPs), often called “geothermal heat pumps”  exploit the relatively stable temperatures found below the surface, either depositing or extracting low-intensity heat. Ground source heat pumps can be run in reverse to provide heating as well as cooling. Large systems typically use drilled wells that may range up to 1,000 feet, using groundwater as the primary source of stable temperatures. www1.eere.energy.gov/geothermal
Future Electricity Costs? The cost of fuel and electricity will soar, despite swift growth in alternative sources of energy, such as solar, geothermal, and wind power. New regs will add 20% or so to electricity rates by 2020. . . and that’s over and above any increases anticipated from changes in supply and demand. The average electricity cost for residential, commercial and industrial users may be 50% higher than today . . . more in areas such as the Midwest and Southeast, where coal fired power dominates.  There  . . . a 100% hike.  Kiplinger Connection, AIArchitect This Week, 09/25/09
Solar Power Proposal Financial Analysis Installation – Year Costs Average Monthly Utility Savings  (over 25-yr. system life) $278 Gross System Cost  ($7.05/watt DC, $8.30/watt AC) $100,096 Utility Savings Over System Life $83,352 Installer Contract Cost $100,096 Total Life-Cycle Payback  (Cash Flow compared to Net Cost) 132% Incentives/Taxes  ($50,048 + $1,485 installer rebate) $51,533 Rate of Return on Cash Invested +2.6% Net Cost $48,563 Levelized Cost of Solar Energy $0.09 / kWh Net Cost per Watt $34.5/watt DC $4.03/watt AC  424 tons of CO2 Reduction in Green House Gas Emissions 3% of Electric Usage Supplied by Solar 66 photovoltaic panels, 8,100 sq. ft. of roof area
Equivalent CO2 Reductions Small Car: 1,436,949 miles Medium Car:   770,727 miles SUV:   540,000 miles Air Miles:   874,021 miles Trees Planted:   16,956 Over 25 Years based on 14.19 kW Solar Power System
Roof Options + Solar Power Option 1:  Flat Proposed 84 SRI  >  78 Increases photovoltaic panel use Potential ponding + water leaks Economical roof system 20 yr. single-ply membrane roof Option 2: Sloped Proposed 32 SRI  >  29 Limits photovoltaic panel use Potential ice dams in d.s.+gutters More costly roof system 20 yr. standing-seam metal roof
Thin film PV modules are only 10% efficient so a larger roof area is required versus a crystalline array with the same electrical rating.  Peel and Stick PV Products
The National Renewable Energy Laboratory maintains a useful online tool for calculating the annual energy production of PV arrays. www.pvwatts.org
Purchase  Green  Power www.renewablechoice.com 10,000 sq.ft, 1-story bldg.   35% green power for 2 years = $414.50 70% green power for 2 years = $710.57
Building  Orientation   Elongate the building on the east-west axis with small windows on the north side and large windows on the south side to minimize heat loss and maximize solar gain during the winter. Minimize east and west facing windows.  The sun is low in the morning and evening, creating a lot of glare and solar heat gain.
Knauf Insulation Shelbyville, IN www.ecobatt.us Formaldehyde-free binder Contains no dyes
 
Solar Control Window Films Window films from companies such as V-Kool and 3M are an excellent retrofit measure for reducing solar heat-gain Films can filter out half the heat of sunlight while allowing most of the visible light through.
One-third or more of a building’s electrical consumption may go to lighting, and energy saved in lighting also reduces cooling loads. EBN April 2009 Replacing lamps, ballasts, luminaires, or all three, can lead to significant energy savings
Use colors of the same family to create tonal harmonies.
Changing a Light? Replacing one light bulb with a compact fluorescent light bulb will save 150 pounds of carbon dioxide a year The Energy Independence and Security Act of 2007 will phase out conventional incandescent lamps by 2014.
 
Replacing a 60 watt incandescent bulb with a 60 watt compact fluorescent lamp (CFL) results in a 75% energy savings.  Reducing energy usage also reduces greenhouse gases from power plants.  By using CFL you are having a positive impact on climate change.  Incandescent =  1,000 hours, 60 watts of energy used CFL = 10,000 hours, 13 watts of energy used
Cradle to Cradle Certification
4 Simple Ways to Save Energy Costs Complete an energy audit Investigate on-site / renewable energy systems Add insulation Investigate DSIRE for light replacement grants
4. Materials + Resources
Recycle, Reuse, Reduce Recycling 2 lbs saves 130 lbs of CO2 from the air. You can save 2,400 lbs of CO2 per year by recycling just half of your household waste. Recycle copy paper for printing on the other side.  www.rcpworksmarter.com Rubbermaid Commercial
About 80% of what Americans throw away is recyclable, yet our recycling rate is only 28 percent. DoSomething.org 39% of waste in the average American household is paper.  Paper made from virgin materials contributes to deforestation and global warming, and often ends up in a landfill. GreenAmericatoday.org
Recycling Saves Energy   Americans throw away 40,000 plastic bottles every minute.  (19.2 million bottles in 8 hrs.) Recycling doesn’t use more energy than making a new product. Recycling aluminum saves 95% of energy use, plastic saves 60% – 75% and paper 55% – 75%
Recycled content refers to the portion of materials used in a product that have been diverted from the solid waste stream. Post consumer content is generally  viewed as offering greater environmental benefit than pre-consumer content. Environmental Building News December 1, 2008
Reduce
Building Recycling  . . . Extends life cycle of existing building stock Conserves resources Retains cultural and historic resources  Reduces waste and landfill impact Reduces environmental impact of new buildings as they relate to materials manufacturing and transport
Maintain Existing Walls & Roof 2005 dollars 4,640 square feet Canopy $17k Tuckpointing + Cleaning $25k Doors + Windows $57k Site Work $54k Landscaping $7k Total Cost $160k
Recycle  Construction  Waste USGBC December 2008   Materials Use Buildings use 40% of raw materials globally. Waste The EPA estimates that  136 million tons of building-related  construction and  demolition debris   was generated in  the U.S. in a single  year.  Compare that to  209.7 million tons of municipal solid waste  generated in the same year. A LEED project can divert 85% of on-site generated construction waste from a landfill.
Keep it Compact Multipurpose Stack uses Eliminate dead  space Minimize  construction cost,  conditioned space,  lighting,  material/resource  consumption Keep site  disturbance to  a minimum
Eliminate Floor Finishes Concrete finishing options are   less expensive   than carpet or tile and   easier to clean and maintain Eliminates or reduces use of potentially harmful chemicals Risk of injury may a drawback depending on the concrete finish
Design an Open Layout Reduces construction cost Improves daylight and  natural ventilation Reduces duct runs Minimizes material  use Eases space  reconfiguration
Buy Recycled  Products Intent:  Increase demand for building products that incorporate recycled content materials, thereby reducing impacts from extraction and processing of virgin materials.
Use Regional  Materials Intent: Increase demand for building materials and products that are extracted and manufactured within 500 miles of the project site, thereby supporting the use of indigenous resources and reducing the environmental impacts resulting from transportation.
Brick  is  Green  and  a Natural
Sustainability Life cycle of 100+ years  Fire resistant Impact resistant from wind borne debris and or projectiles Resistant to sound transmission Monticello, built in 1769, home of  Thomas Jefferson
Energy Efficiency Brick buildings are more energy efficient due to it’s  thermal mass Thermal lag  keeps the inside temperature more moderate temperature level when outside temperatures change and thus reduce peak heating and cooling loads
Manufacturing Located close to production to reduce transportation costs + effects Automation to reduce energy  Recycling
Life  Cycle  Analysis
4 Simple Ways to Conserve M + Rs Consider building recycling Buy recycled products Use regional materials Consider life-cycle versus initial costs
5. Indoor Environmental Quality Americans spend on average 90% of their time indoors where the U.S. EPA reports that levels of pollutants may run 2 to 5 times higher than outdoor levels.
Use Low-Emitting Materials Intent: Reduce the quantity of indoor air contaminants that are odorous, irritating and/or harmful to the comfort and well-being of installers and occupants.
Volatile Organic Compounds VOCs   are carbon compounds that participate in atmospheric photochemical reactions  (excluding carbon monoxide, carbon dioxide, carbonic acid, metallic carbides and carbonates, and ammonium carbonate).  We learned that VOCs are any of those carbon-based compounds that smell strong and readily evaporate – items like acetone, rubbing alcohol and paint. Paint
EBN, June 2007 Emissions of volatile organic compounds and other potentially toxic components from carpets have been widely recognized as an indoor air quality problem.
 
Carpet  covers 70% of U.S. floors. EBN June 2007 Choose carpeting and carpet cushion that meet Carpet Rug Institute (CRI) Green Label Plus standards for emissions or better Install carpet with low-VOC adhesive or use mechanical fasteners Before purchasing carpet, ensure that the carpet can be recycled at the end of its life through an established program
www.interfaceflor.com Interface is the largest modular carpet manufacturer in the world 40% - 80% recycled content Mission Zero – achieve a  zero environmental footprint by 2020  by 2020
Purge PVC From Your Life Why? PVC is highly toxic throughout its life cycle, from manufacture  to incineration.  Potential hormone disrupters and other  toxins can leach from PVC products, adversely affecting your  health.  Action! Use the power of your wallet to send a message to  companies that they need to stop manufacturing the “poison  plastic.” Spot It “Bad news comes in 3s”, refers to the number  3 recycling symbol displayed on many PVC  products, especially packaging. Building Approximately 75 percent of the PVC manufactured is used  for building materials.  Avoid vinyl windows and siding,  plastic patio furniture, PVC-free recycled plastic lumber for  decks and fences.
Avoid Formaldehyde Two glues or binders dominate the manufactured wood products industry:  urea formaldehyde (UF) and phenol formaldehyde (PF). While   UF binders  are significantly less expensive than PF binders, they  give a lot more formaldehyde – a volatile compound that is classified as a known hum carcinogen. Formaldehyde’s other health impacts include respiratory problems; eye, nose and throat irritation; allergic reactions; and depression.
Rapidly Renewable Products PlybooPure   from Smith + Fong is the first bamboo flooring to carry Forest Stewardship Council (FSC) certification and is made with low-emitting,  non-formaldehyde  polyisocyanurate binder. www.plyboo.com
Textiles O Ecotextiles  are made from 100% organic cotton or other sustainable grown fibers. www.oecotextiles.com
www.greenguard.org
 
Many attributes of buildings that are being shown to improve human performance and productivity are also characteristics of green buildings: Intent: Provide for the building occupants a connection between indoor spaces and the outdoors . . .  daylighting,  views to the outdoors,  improved air quality, and  individual control of fresh air +  comforts.  Daylight +  Views
Daylighting Open layout Clerestory windows Skylights Translucent panels
Daylight Harvesting  Can Reduce Amount of artificial lighting and its: Associated energy costs Related carbon emissions
Higher Costs = Change Wal-Mart Supercenters and Sam’s Club stores have skylights with a surface area equal to about 3% - 5% of the floor area. Energy savings are gained by using day-lighting  (skylights and clerestories)  and sensors to dim or turn off artificial lights when natural light is sufficient.
Provide Lighting Control Intent: Provide a high level of lighting system control by individual occupants or by specific groups in multi-occupant (i.e. classrooms or conference areas) to promote the productivity, comfort, and well-being of building occupants. Public Space Lighting Control
Workstation Lighting Control Provision of individual controls for lighting can lead to increased occupant comfort by enabling occupants to tailor the workspace to their individual needs.  Additionally, by reducing ambient space foot-candle levels and providing user controlled, flexible, task-appropriate lighting, the project may reduce the overall lighting energy costs and reduce heat loads associated with high foot-candle levels of indoor lighting.
Provide Thermal Control Intent: To provide high level of thermal comfort system control by individual occupants or specific groups in multi-occupant spaces to promote the productivity, comfort and well-being of building occupants. Strategies: Active Conditioning (e.g. mechanical HVAC systems) Passive Conditioning (e.g. natural ventilation) Mixed-mode conditioning – employing a combination of active and passive systems
True or False  “ People are healthier in spaces that are less severely conditioned.” True Lawrence Berkeley National Laboratory, EBN, October 2009 People get sicker in over-cooled and over-heated buildings. Cooler indoor temperatures in summer and warmer temperatures in winter consistently correlated with more health symptoms.
Operable windows may be used in lieu of individual controls for those occupants located within 20 feet of the exterior wall and within 10 feet of either side of operable window .
4 Simple Ways to Improve IEQ Use low-emitting materials Provide lighting control Provide thermal control Provide daylight and views
Get  Connected www.usgbc.org  U.S. Green Building Council www.greenguard.org  GreenGuard Environmental Institute  www.EDCmag.com  Environmental Design + Construction www.buildinggreen.com  Environmental Building News  www.aia.org  American Institute of Architects
 
GreenBiz.com Free  weekly  newsletter Business The Environment The Bottom Line
www.aia.org/walkthewalk Web Videos: #1  Water Conservation #2  Smart Controls #3  Radiant Heating and Cooling #4  Vegetation for Sun Control #5  Whole Building Approach #6  Green Tags #7  Energy Modeling #8  Green Roofs #9  Daylighting #10   Choosing Green Materials #11 Carbon Offsets #12 Deconstruction
Does Green Building Have an Impact? The equivalent of 2008 LEED  water savings  could fill enough 32 ounce bottles to circle the Earth 300 times. By 2020, LEED  energy savings  will amount to more than 1.3 million tons of coal equivalent each year, representing approximately 78 million tons of carbon dioxide avoided emissions.  Certified projects to date have specified a total of more than $10 billion of  green materials , which could grow to $100 billion by 2020. Green Building Impact Report 2008
Green  Building Strategies 1.  Sustainable Site 2. Water Efficiency 3. Energy & Atmosphere 4. Materials & Resources 5. Indoor Environmental Quality
Thank You and  Good Luck! “  . . . consider the impact on the seventh generation.” Iroquois law

Live Well Live Green

  • 1.
    Live Well, LiveGreen, Indiana Park and Recreation Conference, West Lafayette, Indiana January 21, 2010 Build Green
  • 2.
    Session Outline Understandwhy we need to change our building habits Find out where to start on your next green building improvement Learn how you can implement cost-effective green building improvements
  • 3.
    Learning Objective Togain an understanding of how to incorporate green building strategies . Sustainable Site Water Efficiency Energy and Atmosphere Materials and Resources Indoor Environmental Quality
  • 4.
    Why We Need to Change Our Building Habits 1804 – 1927 1 to 2 billion people 1996 – 2008 6 to 7 billion people 1.
  • 5.
    “ .. . buildings are the biggest source of energy use and greenhouse gas emissions , which in turn impact the world’s climate changes.” Green Building: Essential Design Strategies for a Sustainable Future Barbara A. Nadel, FAIA, Architectural Record, November 2006
  • 6.
    “ Global warmingis not caused by natural forces beyond our control. . . . human beings are the cause of the problem. And so it is our responsibility to fix it.” An Inconvenient Truth Al Gore Total Energy Use
  • 7.
    Oil Dependence TheMiddle East holds 61% of the world's proven oil reserves.  North America has 5%.
  • 8.
    Increasing Oil DemandUnless there is a dramatic effort to change our consumption, energy demand is expected to rise by nearly 20 percent by 2030 according to the Department of Energy. Source: Energy Information Administration
  • 9.
    The amount ofU.S. greenhouse gases flowing into the atmosphere , mainly carbon dioxide from burning fossil fuels, increased last year by 1.4 percent after a decline in 2006. Source: U.S. Energy Department Associated Press, 12/03/08
  • 10.
    “ Carbon emissionshave been growing at 3.5% per year since 2000 , up sharply from the 0.9 percent per year in the 1990s.” 02/15/09 EBN 09/09
  • 11.
  • 12.
    Climate Change Quickens,Seas Rise Global warming is happening faster than expected and at worst could raise sea levels by up to 6-1/2’ by 2100 according to a group of scientists. November 24, 3009
  • 13.
    Where Do WeStart to Build Green? 2.
  • 14.
    A leading-edge systemfor certifying the greenest performing buildings in the world. www.usgbc.org
  • 15.
  • 16.
  • 17.
  • 18.
  • 19.
    Heating and coolingare generally the major expenses (30%-35%) associated with the operation of a building.
  • 20.
    Save Water andEnergy Average Savings LEED Rating # of Bldgs. Water Efficiency Energy Optimization Certified 64 30.1% 29.4% Silver 49 30.4% 33.3% Gold 46 32.5% 40.0% Platinum 9 34.4% 55.0% Total 168 Environmental Design + Construction , December 2006
  • 21.
    Save Green Measuredenergy savings on LEED facilities average 28% more than non-certified buildings. 2008 New Buildings Institute Study of 121 new LEED Facilities occupied for at least one year
  • 22.
    Green Building BenefitsReduce or eliminate negative environmental impacts Reduce operating costs Enhance work productivity Reduce or eliminate indoor air quality problems Why would anyone choose to build in a way that isn’t comfortable, healthy, and energy efficient?
  • 23.
    Ways to MakeYour Building Improvements Green 3.
  • 24.
    #1 Build a LEED Project Level of LEED Rating Ave. Cost Premium Certified 0.66%* Silver 2.11% Gold 1.82% Platinum 6.50% Environmental Design + Construction , December 2006
  • 25.
    Green buildings aregood for the environment, people, and they provide life-cycle cost savings. The Bottom Line:
  • 26.
    #2 IncorporateCost-Effective Green Building Strategies
  • 27.
    1. Sustainable SiteAvoid prime farmland Channel development to urban areas with existing infrastructure Rehabilitate brown-fields Locate project within ½ mile of an existing or planned and funded public transportation system Provide bicycle racks and shower facilities Protect or restore habitat Maximize open space Reduce or eliminate water pollution by reducing impervious cover and increase on-site infiltration
  • 28.
    Install Bicycle RacksProvide bicycle racks for 5% or more of all building users during peak time Reduce automobile use that contributes to air pollution Reduce dependency on oil Reduce impact of oil refining Promote well-being
  • 29.
    Drive Less Walk,bike, carpool or take public transportation more often. You’ll save one lb of CO2 for every mile you don’t drive. Your car will emit as much CO2 in a year as your entire household = 12,000 lbs.
  • 30.
  • 31.
    walkscore.com 90 –100 = Walkers’ Paradise 70 – 89 = Very Walkable 50 – 69 = Somewhat Walkable 25 – 49 = Car-Dependent 0 – 24 = Car-Dependent (driving only) Walk Score calculates the walk-ability of an address by locating nearby stores, restaurants, schools, parks, etc. Walk Score measures how easy it is to live a car- lite lifestyle – not how pretty the area is for walking.
  • 32.
  • 33.
    Provide Hybrid ParkingIntent: Reduce pollution and land development impacts from automobile use Strategy: Provide preferred parking for low-emitting and fuel-efficient vehicles for 5% of the total parking capacity of the site Example: 200 parking spaces x 5%=10 preferred parking spaces
  • 34.
    Heat Island Effect: Environmental Issues The use of dark, non-reflective surfaces for parking, roofs, walkways and other surfaces contributes to heat island effects. As a result of heat island effects, ambient temperatures in urban areas can be artificially elevated by more than 10 degrees when compared with surrounding suburban and undeveloped areas. This results in: increased cooling loads in the summer; larger HVAC equipment; increased electrical demand; more greenhouse gas + pollution; and increased energy consumption . Urban heat islands can maintain temperatures 6 – 8 degrees above that of surrounding rural land. EBN September ‘09
  • 35.
    Heat Island Effect: Non-Roof Use the following for 50% of the site hardscape: Shade Paving materials with a Solar Reflectance Index (SRI) > 29 roads, sidewalks, courtyards and parking lots USGBC Sustainable Site, Credit 7.1
  • 36.
    Paving Materials’ SRISolar Reflectance Index (SRI) is the measure of a material’s ability to reject solar heat, as shown by a small temperature rise. Material Reflectance SRI New Gray Concrete 0.35 35 Weathered Gray Concrete 0.20 19 New White Concrete 0.70 86 Weathered White Concrete 0.40 45 New Asphalt 0.05 0 Weathered Asphalt 0.10 6
  • 37.
  • 38.
  • 39.
    Did You Know?Proper tree placement can reduce air-conditioning costs by 30% AIA, Vegetation for Sun Control Green Step Web Video
  • 40.
    Heat Island Effect: Roof Use roofing materials having a Solar Reflectance Index (SRI) equal to or greater than the values of the table below for a minimum of 75% of the roof surface. USGBC Sustainable Site, Credit 7.2 Roof Type Slope SRI Low-Sloped Roof < 2:12 78 Steep-Sloped Roof > 2:12 29
  • 41.
    Roofing Materials SRIMaterial Solar Reflectance Temperature Rise SRI Gray EPDM 0.23 68 21 Gray Asphalt Shingle 0.22 67 22 White Coating on Metal Roof 0.67 28 79 White EPDM 0.69 25 84 Rising temperatures lead to increased cooling requirements, requiring energy and causing associated emissions.
  • 42.
    new roof, newcolor + drainage White EPDM SRI = 84 Gray EPDM SRI = 21
  • 43.
    Make Your Roof“C-o-o-l” Metal roofs can reflect up to 70% of the sun’s energy and reduce cooling costs by up to 20% Reduce HVAC system size due to smaller peak cooling loads
  • 44.
    Green Roofs Reducesroof heat gain (Sunny 95 degrees, conventional roofs reach 175 vs green at ambient air temperature) Reduces heat island effect Reduces indoor sound by as much as 40 decibels Reduces storm water runoff Extends roof life, no u.v. rays Energy conservation plants and 4 inches of growing medium reduce indoor temperatures 6 to 8 degrees and can reduce air-conditioning costs 25 to 50% in single story buildings Live roof replacement every 20 years u.v. rays breaks down container/tray systems www.greenroofs.com
  • 45.
    4 Simple Wayto Reduce the Heat Island Effect Increase landscaping and shade from tree planting Reduce paved surfaces Incorporate roofing with reflective membranes or coatings Install light-colored pavement and walkway surfaces
  • 46.
    Less than 3percent of the water on Earth is fresh; much of that is unreachable in glaciers, ice-caps or deep in the earth. 2. Water Efficiency`
  • 47.
    Climate change willlikely increase precipitation in some places while reducing it in others , particularly the West, where populations are growing the fastest. Environmental Building News, September 2008
  • 48.
    Limit or eliminatethe use of potable water for landscape irrigation.
  • 49.
    “ The roughly90 million lawnmowers, weed trimmers, leaf blowers, and other small-engine lawn and garden tools in the U.S. spew out approximately 5% of the nation’s air pollution , according to the U.S. Environmental Protection Agency.” Environmental Building News , July 2005 What’s Wrong With the Conventional Lawn?
  • 50.
    Use Native LandscapingReduced air pollution Reduced nutrient runoff, no fertilizer Reduced pesticide use Increased biodiversity Lower annual operating costs
  • 51.
    “ Some expertssay that water may be an even more challenging problem than energy in the coming decades . . . ” Environmental Building News, September 2008
  • 52.
    Lower Volumes ofPotable Water + Less Water for Water Treatment Energy Savings and Carbon Pollution Reduction
  • 53.
    Reduce Water useby 20%-30% Intent: Maximize water efficiency within buildings to reduce the burden on municipal water supply and waste water systems. Strategy: Use high-efficiency fixtures and occupant sensors to reduce the potable water demand.
  • 54.
    Greening Locker RoomsInstall fixtures high a high water efficiency Provide touch-less fixtures Purchase products with a longer lifecycle Consider environmentally-friendly products Purchase products with a high recycled content to conserve resources and prevent overflow in landfills
  • 55.
    Low-Flow ShowerheadsAging showerheads using as much as 8 gallons per minute Although the federal maximum is 2.5 gpm, models from Bricor, Delta, and Niagara offer satisfying showers with 1.6 gpm or a a 36% water savings over a 2.5 gpm showerhead.
  • 56.
    Water Saving FixturesToilet flushing is the largest single use of water in most buildings. Zurn’s EcoVantage uses one pint, or 0.125 or 1/8 gallon of water per flush. They are all sensor-controlled (battery or hard-wired) and have a manual button override. www.zurn.com 1.28 gallons of water per flush
  • 57.
    Four independent, real-worldstudies . . . have all shown that sensor-activated faucets increase water use by anywhere from 30% to 100% . Sensor-activated flushes on toilets and urinals also increase water use, due mainly to “phantom flushes ”. Environmental Building News – April 2009
  • 58.
    4 Simple Waysto Save Water + Costs Use native and or drought resistant landscape Use high-efficiency water fixtures Use low-flow toilets + urinals Consider automatic sensors
  • 59.
    3. Energy +Atmosphere Heating and cooling costs are generally the major expenses (30% - 35%) associated with the operation of a building. USGBC
  • 60.
    Oil Prices andthe Future Prices will start to head up in Spring 2009 Drivers are taking to the road again . . . today’s low prices plant the seed of future hikes By December 2009, the price per barrel will average $70 or $2 a gallon 2010, growing oil consumption will push prices to $100 a barrel. Kiplinger Connection, AIArchitect This Week, December 12, 2008
  • 61.
    Complete an EnergyAudit www.energysavers.gov Learn Where you are losing energy How to conduct your own audit How to hire a professional Or, choose the topic you want to explore: Tax Credits + Rebates Designing + Remodeling Heating + Cooling Landscaping Water Heating Appliances + Electronics Electricity Insulation + Air Sealing Lighting + Day-lighting Windows, Doors + Skylights
  • 62.
    DSIRE Database ofState Incentives for Renewables & Efficiency DSIRE is a comprehensive source of information on state, local, utility, and federal incentives that promote renewable energy and energy efficiency. www.dsireusa.org
  • 63.
  • 64.
  • 65.
    Financial Incentives forRenewable Energy Comparison Chart State Rebates Grants Loans California 7 state 38 utility 3 local 1 state 2 state 1 utility 4 local Illinois 1 state 3 state 1 private 1 state Indiana 4 utility 1 state 1 utility U.S. Totals 307 65 150
  • 66.
    Optimize Energy PerformanceIntent: Reduce environmental and economic impacts associated with excessive energy use. Strategies: 1. Renewable Energy Systems 2. Building Orientation 3. Add Insulation 4. Solar Control Window Films
  • 67.
    Mechanical Systems AnalysisHVAC Description Installation Cost Annual Electrical Usage (kW-hr) Annual Gas Usage (therms) Annual HVAC Utility Costs Payback Period (Years) 50-year Payback Replacement Cost Base: 4-pipe w/VAV air distribution $1,788,136 297,500 21,500 $45,500 NA NA $300,000/ 25 yr. Options Base + Cost Minimal Future Provisions $25,000 297,500 21,500 $45,500 NA NA NA Energy Recovery +$125,000 291,600 12,500 $36,400 16 $225,000 $7,500/ 5 yr. Ice Thermal Storage +$100,000 312,500 21,500 $42,250 31 $62,500 None Geothermal +$450,000 421,000 0 $32,650 29 $42,500 $225,000/ 20 yr.
  • 68.
    Thermal Energy (Ice) Storage Benefit of shifting loads from daytime hours, when most cooling loads occur, to night-time, when electricity demand is lower and costs are often less. Off-peak electricity generation is cleaner than peak energy. Required space and height requirements adds to the building construction cost. TES systems can reduce first costs by allowing chillers or packaged air-conditioners to be down-sized.
  • 69.
    Saving Money withOff-Peak Electricity
  • 70.
    Geo-Thermal HeatPumps Ground-source heat pumps (GSHPs), often called “geothermal heat pumps” exploit the relatively stable temperatures found below the surface, either depositing or extracting low-intensity heat. Ground source heat pumps can be run in reverse to provide heating as well as cooling. Large systems typically use drilled wells that may range up to 1,000 feet, using groundwater as the primary source of stable temperatures. www1.eere.energy.gov/geothermal
  • 71.
    Future Electricity Costs?The cost of fuel and electricity will soar, despite swift growth in alternative sources of energy, such as solar, geothermal, and wind power. New regs will add 20% or so to electricity rates by 2020. . . and that’s over and above any increases anticipated from changes in supply and demand. The average electricity cost for residential, commercial and industrial users may be 50% higher than today . . . more in areas such as the Midwest and Southeast, where coal fired power dominates. There . . . a 100% hike. Kiplinger Connection, AIArchitect This Week, 09/25/09
  • 72.
    Solar Power ProposalFinancial Analysis Installation – Year Costs Average Monthly Utility Savings (over 25-yr. system life) $278 Gross System Cost ($7.05/watt DC, $8.30/watt AC) $100,096 Utility Savings Over System Life $83,352 Installer Contract Cost $100,096 Total Life-Cycle Payback (Cash Flow compared to Net Cost) 132% Incentives/Taxes ($50,048 + $1,485 installer rebate) $51,533 Rate of Return on Cash Invested +2.6% Net Cost $48,563 Levelized Cost of Solar Energy $0.09 / kWh Net Cost per Watt $34.5/watt DC $4.03/watt AC 424 tons of CO2 Reduction in Green House Gas Emissions 3% of Electric Usage Supplied by Solar 66 photovoltaic panels, 8,100 sq. ft. of roof area
  • 73.
    Equivalent CO2 ReductionsSmall Car: 1,436,949 miles Medium Car: 770,727 miles SUV: 540,000 miles Air Miles: 874,021 miles Trees Planted: 16,956 Over 25 Years based on 14.19 kW Solar Power System
  • 74.
    Roof Options +Solar Power Option 1: Flat Proposed 84 SRI > 78 Increases photovoltaic panel use Potential ponding + water leaks Economical roof system 20 yr. single-ply membrane roof Option 2: Sloped Proposed 32 SRI > 29 Limits photovoltaic panel use Potential ice dams in d.s.+gutters More costly roof system 20 yr. standing-seam metal roof
  • 75.
    Thin film PVmodules are only 10% efficient so a larger roof area is required versus a crystalline array with the same electrical rating. Peel and Stick PV Products
  • 76.
    The National RenewableEnergy Laboratory maintains a useful online tool for calculating the annual energy production of PV arrays. www.pvwatts.org
  • 77.
    Purchase Green Power www.renewablechoice.com 10,000 sq.ft, 1-story bldg. 35% green power for 2 years = $414.50 70% green power for 2 years = $710.57
  • 78.
    Building Orientation Elongate the building on the east-west axis with small windows on the north side and large windows on the south side to minimize heat loss and maximize solar gain during the winter. Minimize east and west facing windows. The sun is low in the morning and evening, creating a lot of glare and solar heat gain.
  • 79.
    Knauf Insulation Shelbyville,IN www.ecobatt.us Formaldehyde-free binder Contains no dyes
  • 80.
  • 81.
    Solar Control WindowFilms Window films from companies such as V-Kool and 3M are an excellent retrofit measure for reducing solar heat-gain Films can filter out half the heat of sunlight while allowing most of the visible light through.
  • 82.
    One-third or moreof a building’s electrical consumption may go to lighting, and energy saved in lighting also reduces cooling loads. EBN April 2009 Replacing lamps, ballasts, luminaires, or all three, can lead to significant energy savings
  • 83.
    Use colors ofthe same family to create tonal harmonies.
  • 84.
    Changing a Light?Replacing one light bulb with a compact fluorescent light bulb will save 150 pounds of carbon dioxide a year The Energy Independence and Security Act of 2007 will phase out conventional incandescent lamps by 2014.
  • 85.
  • 86.
    Replacing a 60watt incandescent bulb with a 60 watt compact fluorescent lamp (CFL) results in a 75% energy savings. Reducing energy usage also reduces greenhouse gases from power plants. By using CFL you are having a positive impact on climate change. Incandescent = 1,000 hours, 60 watts of energy used CFL = 10,000 hours, 13 watts of energy used
  • 87.
    Cradle to CradleCertification
  • 88.
    4 Simple Waysto Save Energy Costs Complete an energy audit Investigate on-site / renewable energy systems Add insulation Investigate DSIRE for light replacement grants
  • 89.
    4. Materials +Resources
  • 90.
    Recycle, Reuse, ReduceRecycling 2 lbs saves 130 lbs of CO2 from the air. You can save 2,400 lbs of CO2 per year by recycling just half of your household waste. Recycle copy paper for printing on the other side. www.rcpworksmarter.com Rubbermaid Commercial
  • 91.
    About 80% ofwhat Americans throw away is recyclable, yet our recycling rate is only 28 percent. DoSomething.org 39% of waste in the average American household is paper. Paper made from virgin materials contributes to deforestation and global warming, and often ends up in a landfill. GreenAmericatoday.org
  • 92.
    Recycling Saves Energy Americans throw away 40,000 plastic bottles every minute. (19.2 million bottles in 8 hrs.) Recycling doesn’t use more energy than making a new product. Recycling aluminum saves 95% of energy use, plastic saves 60% – 75% and paper 55% – 75%
  • 93.
    Recycled content refersto the portion of materials used in a product that have been diverted from the solid waste stream. Post consumer content is generally viewed as offering greater environmental benefit than pre-consumer content. Environmental Building News December 1, 2008
  • 94.
  • 95.
    Building Recycling . . . Extends life cycle of existing building stock Conserves resources Retains cultural and historic resources Reduces waste and landfill impact Reduces environmental impact of new buildings as they relate to materials manufacturing and transport
  • 96.
    Maintain Existing Walls& Roof 2005 dollars 4,640 square feet Canopy $17k Tuckpointing + Cleaning $25k Doors + Windows $57k Site Work $54k Landscaping $7k Total Cost $160k
  • 97.
    Recycle Construction Waste USGBC December 2008 Materials Use Buildings use 40% of raw materials globally. Waste The EPA estimates that 136 million tons of building-related construction and demolition debris was generated in the U.S. in a single year. Compare that to 209.7 million tons of municipal solid waste generated in the same year. A LEED project can divert 85% of on-site generated construction waste from a landfill.
  • 98.
    Keep it CompactMultipurpose Stack uses Eliminate dead space Minimize construction cost, conditioned space, lighting, material/resource consumption Keep site disturbance to a minimum
  • 99.
    Eliminate Floor FinishesConcrete finishing options are less expensive than carpet or tile and easier to clean and maintain Eliminates or reduces use of potentially harmful chemicals Risk of injury may a drawback depending on the concrete finish
  • 100.
    Design an OpenLayout Reduces construction cost Improves daylight and natural ventilation Reduces duct runs Minimizes material use Eases space reconfiguration
  • 101.
    Buy Recycled Products Intent: Increase demand for building products that incorporate recycled content materials, thereby reducing impacts from extraction and processing of virgin materials.
  • 102.
    Use Regional Materials Intent: Increase demand for building materials and products that are extracted and manufactured within 500 miles of the project site, thereby supporting the use of indigenous resources and reducing the environmental impacts resulting from transportation.
  • 103.
    Brick is Green and a Natural
  • 104.
    Sustainability Life cycleof 100+ years Fire resistant Impact resistant from wind borne debris and or projectiles Resistant to sound transmission Monticello, built in 1769, home of Thomas Jefferson
  • 105.
    Energy Efficiency Brickbuildings are more energy efficient due to it’s thermal mass Thermal lag keeps the inside temperature more moderate temperature level when outside temperatures change and thus reduce peak heating and cooling loads
  • 106.
    Manufacturing Located closeto production to reduce transportation costs + effects Automation to reduce energy Recycling
  • 107.
    Life Cycle Analysis
  • 108.
    4 Simple Waysto Conserve M + Rs Consider building recycling Buy recycled products Use regional materials Consider life-cycle versus initial costs
  • 109.
    5. Indoor EnvironmentalQuality Americans spend on average 90% of their time indoors where the U.S. EPA reports that levels of pollutants may run 2 to 5 times higher than outdoor levels.
  • 110.
    Use Low-Emitting MaterialsIntent: Reduce the quantity of indoor air contaminants that are odorous, irritating and/or harmful to the comfort and well-being of installers and occupants.
  • 111.
    Volatile Organic CompoundsVOCs are carbon compounds that participate in atmospheric photochemical reactions (excluding carbon monoxide, carbon dioxide, carbonic acid, metallic carbides and carbonates, and ammonium carbonate). We learned that VOCs are any of those carbon-based compounds that smell strong and readily evaporate – items like acetone, rubbing alcohol and paint. Paint
  • 112.
    EBN, June 2007Emissions of volatile organic compounds and other potentially toxic components from carpets have been widely recognized as an indoor air quality problem.
  • 113.
  • 114.
    Carpet covers70% of U.S. floors. EBN June 2007 Choose carpeting and carpet cushion that meet Carpet Rug Institute (CRI) Green Label Plus standards for emissions or better Install carpet with low-VOC adhesive or use mechanical fasteners Before purchasing carpet, ensure that the carpet can be recycled at the end of its life through an established program
  • 115.
    www.interfaceflor.com Interface isthe largest modular carpet manufacturer in the world 40% - 80% recycled content Mission Zero – achieve a zero environmental footprint by 2020 by 2020
  • 116.
    Purge PVC FromYour Life Why? PVC is highly toxic throughout its life cycle, from manufacture to incineration. Potential hormone disrupters and other toxins can leach from PVC products, adversely affecting your health. Action! Use the power of your wallet to send a message to companies that they need to stop manufacturing the “poison plastic.” Spot It “Bad news comes in 3s”, refers to the number 3 recycling symbol displayed on many PVC products, especially packaging. Building Approximately 75 percent of the PVC manufactured is used for building materials. Avoid vinyl windows and siding, plastic patio furniture, PVC-free recycled plastic lumber for decks and fences.
  • 117.
    Avoid Formaldehyde Twoglues or binders dominate the manufactured wood products industry: urea formaldehyde (UF) and phenol formaldehyde (PF). While UF binders are significantly less expensive than PF binders, they give a lot more formaldehyde – a volatile compound that is classified as a known hum carcinogen. Formaldehyde’s other health impacts include respiratory problems; eye, nose and throat irritation; allergic reactions; and depression.
  • 118.
    Rapidly Renewable ProductsPlybooPure from Smith + Fong is the first bamboo flooring to carry Forest Stewardship Council (FSC) certification and is made with low-emitting, non-formaldehyde polyisocyanurate binder. www.plyboo.com
  • 119.
    Textiles O Ecotextiles are made from 100% organic cotton or other sustainable grown fibers. www.oecotextiles.com
  • 120.
  • 121.
  • 122.
    Many attributes ofbuildings that are being shown to improve human performance and productivity are also characteristics of green buildings: Intent: Provide for the building occupants a connection between indoor spaces and the outdoors . . . daylighting, views to the outdoors, improved air quality, and individual control of fresh air + comforts. Daylight + Views
  • 123.
    Daylighting Open layoutClerestory windows Skylights Translucent panels
  • 124.
    Daylight Harvesting Can Reduce Amount of artificial lighting and its: Associated energy costs Related carbon emissions
  • 125.
    Higher Costs =Change Wal-Mart Supercenters and Sam’s Club stores have skylights with a surface area equal to about 3% - 5% of the floor area. Energy savings are gained by using day-lighting (skylights and clerestories) and sensors to dim or turn off artificial lights when natural light is sufficient.
  • 126.
    Provide Lighting ControlIntent: Provide a high level of lighting system control by individual occupants or by specific groups in multi-occupant (i.e. classrooms or conference areas) to promote the productivity, comfort, and well-being of building occupants. Public Space Lighting Control
  • 127.
    Workstation Lighting ControlProvision of individual controls for lighting can lead to increased occupant comfort by enabling occupants to tailor the workspace to their individual needs. Additionally, by reducing ambient space foot-candle levels and providing user controlled, flexible, task-appropriate lighting, the project may reduce the overall lighting energy costs and reduce heat loads associated with high foot-candle levels of indoor lighting.
  • 128.
    Provide Thermal ControlIntent: To provide high level of thermal comfort system control by individual occupants or specific groups in multi-occupant spaces to promote the productivity, comfort and well-being of building occupants. Strategies: Active Conditioning (e.g. mechanical HVAC systems) Passive Conditioning (e.g. natural ventilation) Mixed-mode conditioning – employing a combination of active and passive systems
  • 129.
    True or False “ People are healthier in spaces that are less severely conditioned.” True Lawrence Berkeley National Laboratory, EBN, October 2009 People get sicker in over-cooled and over-heated buildings. Cooler indoor temperatures in summer and warmer temperatures in winter consistently correlated with more health symptoms.
  • 130.
    Operable windows maybe used in lieu of individual controls for those occupants located within 20 feet of the exterior wall and within 10 feet of either side of operable window .
  • 131.
    4 Simple Waysto Improve IEQ Use low-emitting materials Provide lighting control Provide thermal control Provide daylight and views
  • 132.
    Get Connectedwww.usgbc.org U.S. Green Building Council www.greenguard.org GreenGuard Environmental Institute www.EDCmag.com Environmental Design + Construction www.buildinggreen.com Environmental Building News www.aia.org American Institute of Architects
  • 133.
  • 134.
    GreenBiz.com Free weekly newsletter Business The Environment The Bottom Line
  • 135.
    www.aia.org/walkthewalk Web Videos:#1 Water Conservation #2 Smart Controls #3 Radiant Heating and Cooling #4 Vegetation for Sun Control #5 Whole Building Approach #6 Green Tags #7 Energy Modeling #8 Green Roofs #9 Daylighting #10 Choosing Green Materials #11 Carbon Offsets #12 Deconstruction
  • 136.
    Does Green BuildingHave an Impact? The equivalent of 2008 LEED water savings could fill enough 32 ounce bottles to circle the Earth 300 times. By 2020, LEED energy savings will amount to more than 1.3 million tons of coal equivalent each year, representing approximately 78 million tons of carbon dioxide avoided emissions. Certified projects to date have specified a total of more than $10 billion of green materials , which could grow to $100 billion by 2020. Green Building Impact Report 2008
  • 137.
    Green BuildingStrategies 1. Sustainable Site 2. Water Efficiency 3. Energy & Atmosphere 4. Materials & Resources 5. Indoor Environmental Quality
  • 138.
    Thank You and Good Luck! “ . . . consider the impact on the seventh generation.” Iroquois law