More Related Content
Similar to R qa1203 anx9a
Similar to R qa1203 anx9a (20)
R qa1203 anx9a
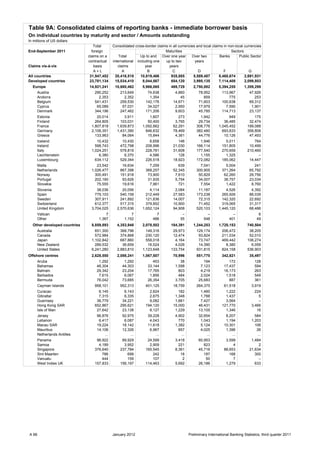
- 1. Table 9A: Consolidated claims of reporting banks - immediate borrower basis
On individual countries by maturity and sector / Amounts outstanding
In millions of US dollars
Total Consolidated cross-border claims in all currencies and local claims in non-local currencies
End-September 2011 foreign Maturities Sectors
claims on a Total Up to and Over one year Over two Banks Public Sector
contractual international including one up to two years
Claims vis-à-vis basis claims year years
A+L A B C D F G
All countries 31,947,452 20,416,518 10,819,466 935,885 5,589,487 8,460,674 2,691,931
Developed countries 23,781,134 15,034,410 8,044,567 654,120 3,995,135 7,114,408 2,099,803
Europe 14,921,241 10,680,462 5,966,065 469,729 2,750,882 5,394,255 1,359,299
Austria 290,252 213,649 74,638 4,860 78,952 113,967 47,926
Andorra 2,353 2,352 1,354 45 859 775 253
Belgium 541,431 259,530 142,176 14,671 71,603 100,638 69,312
Cyprus 65,089 57,031 34,027 2,950 17,979 7,590 1,901
Denmark 344,196 247,462 171,206 9,603 45,785 114,713 23,137
Estonia 20,014 3,911 1,607 273 1,942 949 175
Finland 264,805 103,031 50,400 3,765 29,734 36,485 32,474
France 1,807,818 1,639,873 1,092,662 62,291 308,776 1,045,452 199,088
Germany 2,106,351 1,431,390 846,632 78,469 382,460 693,633 358,806
Greece 133,963 84,064 15,844 4,361 44,776 10,126 47,493
Iceland 10,432 10,430 6,658 146 1,946 5,011 764
Ireland 598,743 472,798 208,996 21,030 166,114 151,805 10,499
Italy 1,024,251 578,819 228,781 31,608 177,540 270,659 210,460
Liechtenstein 6,380 6,370 4,586 128 1,155 1,325 –
Luxembourg 634,112 529,344 226,518 18,923 172,082 185,062 14,447
Malta 23,542 16,634 7,259 639 7,041 5,004 241
Netherlands 1,026,477 867,398 368,257 52,345 300,905 371,264 65,792
Norway 300,491 151,918 73,900 7,610 50,829 62,260 29,756
Portugal 202,160 93,626 31,935 5,754 34,007 38,757 23,034
Slovakia 75,555 19,616 7,961 721 7,554 1,422 8,760
Slovenia 38,036 20,056 4,114 2,084 11,187 4,526 4,392
Spain 779,103 540,158 212,449 27,583 173,238 265,926 88,039
Sweden 307,911 241,892 121,636 14,007 72,315 142,320 22,692
Switzerland 612,377 517,315 379,852 10,900 71,452 319,065 31,317
United Kingdom 3,704,025 2,570,636 1,652,124 94,908 520,103 1,445,120 68,486
Vatican 7 7 7 – – – 6
Other 1,367 1,152 486 55 548 401 49
Other developed countries 8,859,893 4,353,948 2,078,502 184,391 1,244,253 1,720,153 740,504
Australia 651,300 368,796 149,316 29,973 129,174 206,472 38,205
Canada 572,984 374,868 230,120 12,474 93,824 211,034 52,010
Japan 1,102,842 687,860 558,018 4,164 73,747 469,442 106,274
New Zealand 289,532 36,659 16,524 4,026 14,390 8,380 6,059
United States 6,241,280 2,883,810 1,123,648 133,754 931,815 824,158 536,903
Offshore centres 2,628,550 2,088,241 1,067,507 70,996 551,770 342,821 35,497
Aruba 1,292 1,292 453 38 194 172 128
Bahamas 48,304 44,303 33,144 1,598 7,123 17,437 594
Bahrain 29,342 23,204 17,765 803 4,219 16,173 263
Barbados 7,615 6,067 1,856 484 2,024 1,518 549
Bermuda 76,042 73,685 26,354 3,705 25,683 887 361
Cayman Islands 958,101 952,313 401,125 18,759 264,375 61,518 3,919
Curacao 6,145 6,143 2,624 182 1,460 1,222 224
Gibraltar 7,315 6,335 2,675 1,348 1,788 1,437 5
Guernsey 36,779 34,221 9,082 1,661 7,427 3,564 –
Hong Kong SAR 652,867 295,621 194,120 15,000 46,431 121,770 3,466
Isle of Man 27,642 23,138 8,127 1,229 13,105 1,346 16
Jersey 96,876 92,975 39,228 4,902 32,654 8,207 584
Lebanon 6,417 6,087 4,043 770 1,043 1,194 1,203
Macau SAR 19,224 18,142 11,618 1,382 5,124 10,301 106
Mauritius 14,106 12,326 6,967 857 4,025 1,396 26
Netherlands Antilles ... ... ... ... ... ... ...
Panama 96,922 89,929 24,599 3,418 60,953 3,599 1,484
Samoa 4,189 3,952 2,909 221 823 4 2
Singapore 376,640 237,784 165,545 8,361 45,716 88,653 21,634
Sint Maarten 786 699 242 18 187 168 300
Vanuatu 444 159 107 2 50 7 –
West Indies UK 157,833 156,197 114,463 5,692 26,186 1,279 633
A 66 January 2012 Preliminary International Banking Statistics, third quarter 2011
- 2. Table 9A (cont.)
Local currency positions of
Sectors reporting banks' foreign Net risk Total foreign End-September 2011
Non-bank offices with local residents transfers claims on an
private sector Claims Liabilities ultimate risk
basis Claims vis-à-vis
H L M Q R(=A+L+Q)
9,001,807 11,530,934 8,206,758 –654,072 31,293,380 All countries
5,686,169 8,746,724 6,185,997 49,763 23,830,897 Developed countries
3,848,809 4,240,779 2,883,693 –78,734 14,842,507 Europe
51,623 76,603 107,863 –254 289,998 Austria
1,324 1 – –592 1,761 Andorra
89,371 281,901 253,867 –3,525 537,906 Belgium
47,396 8,058 11,610 –11,244 53,845 Cyprus
95,297 96,734 64,515 –75 344,121 Denmark
2,743 16,103 11,310 –140 19,874 Estonia
33,971 161,774 110,927 –152 264,653 Finland
377,330 167,945 134,509 27,578 1,835,396 France
370,350 674,961 592,116 171,269 2,277,620 Germany
26,380 49,899 26,910 –11,190 122,773 Greece
4,621 2 – 334 10,766 Iceland
309,263 125,945 56,029 –79,517 519,226 Ireland
96,742 445,432 184,645 15,906 1,040,157 Italy
4,970 10 4 –31 6,349 Liechtenstein
325,828 104,768 147,451 –102,035 532,077 Luxembourg
10,865 6,908 4,642 –4,199 19,343 Malta
427,645 159,079 38,550 –4,882 1,021,595 Netherlands
59,251 148,573 74,350 –5,444 295,047 Norway
31,822 108,534 54,734 –806 201,354 Portugal
8,845 55,939 20,365 –1,880 73,675 Slovakia
10,826 17,980 5,461 –68 37,968 Slovenia
185,012 238,945 75,853 4,611 783,714 Spain
76,689 66,019 38,509 7,195 315,106 Sweden
161,974 95,062 26,912 16,877 629,254 Switzerland
1,037,983 1,133,389 842,343 –96,581 3,607,444 United Kingdom
1 – – –1 6 Vatican
687 215 218 112 1,479 Other
1,837,360 4,505,945 3,302,304 128,497 8,988,390 Other developed countries
120,435 282,504 213,725 –15,518 635,782 Australia
111,311 198,116 136,392 13,773 586,757 Canada
109,706 414,982 239,519 31,327 1,134,169 Japan
21,958 252,873 162,503 –3,841 285,691 New Zealand
1,473,469 3,357,470 2,550,165 102,714 6,343,994 United States
1,679,126 540,309 450,250 –612,828 2,015,722 Offshore centres
991 – – –89 1,203 Aruba
25,881 4,001 4,269 –22,635 25,669 Bahamas
6,760 6,138 4,562 –6,125 23,217 Bahrain
3,893 1,548 1,285 –324 7,291 Barbados
71,813 2,357 1,659 –4,778 71,264 Bermuda
873,767 5,788 3,485 –322,878 635,223 Cayman Islands
4,656 2 28 –639 5,506 Curacao
4,528 980 2,164 –1,014 6,301 Gibraltar
25,164 2,558 7,408 –2,241 34,538 Guernsey
170,204 357,246 289,291 –84,573 568,294 Hong Kong SAR
21,606 4,504 8,677 –3,616 24,026 Isle of Man
83,158 3,901 16,867 –9,507 87,369 Jersey
3,690 330 205 –237 6,180 Lebanon
6,994 1,082 1,671 –3,348 15,876 Macau SAR
10,903 1,780 1,362 –5,784 8,322 Mauritius
... ... ... ... ... Netherlands Antilles
84,075 6,993 5,866 –47,929 48,993 Panama
3,908 237 182 –2,568 1,621 Samoa
125,270 138,856 99,481 –35,209 341,431 Singapore
230 87 102 44 830 Sint Maarten
153 285 255 –23 421 Vanuatu
148,781 1,636 1,431 –57,782 100,051 West Indies UK
Preliminary International Banking Statistics, third quarter 2011 January 2012 A 67
- 3. Table 9A (Cont.)
Total Consolidated cross-border claims in all currencies and local claims in non-local currencies
End-September 2011 foreign Maturities Sectors
claims on a Total Up to and Over one year Over two Banks Public Sector
contractual international including one up to two years
Claims vis-à-vis basis claims year years
A+L A B C D F G
Developing countries 5,398,529 3,155,256 1,675,551 205,909 1,004,055 991,347 446,000
Africa & Middle East 661,974 440,103 203,920 35,073 182,668 120,035 54,813
Algeria 9,412 2,091 1,138 195 737 384 480
Angola 8,062 7,483 2,427 299 4,433 885 2,340
Benin 83 63 35 – 28 17 29
Botswana 2,539 752 315 58 271 47 150
Burkina Faso 992 485 243 69 172 6 29
Burundi 36 36 13 5 13 16 –
Cameroon 3,237 1,022 351 284 353 37 188
Cape Verde 1,624 834 499 23 224 433 160
Central African Republic 36 36 33 – 3 – –
Chad 64 28 2 7 16 3 –
Comoros Islands 27 27 16 2 6 12 –
Congo 358 239 97 37 99 4 26
Congo Democratic Republic 553 542 210 79 252 200 28
Côte d’Ivoire 4,307 2,040 491 605 824 322 462
Djibouti 218 218 96 4 97 20 15
Egypt 41,368 16,644 8,888 1,557 5,465 3,598 1,786
Equatorial Guinea 588 41 21 4 16 11 3
Eritrea 7 7 7 – – – –
Ethiopia 421 421 340 21 61 2 –
Gabon 942 905 256 39 590 13 765
Gambia 88 77 45 – 21 4 5
Ghana 6,140 4,244 1,945 358 1,706 384 1,606
Guinea 517 325 122 152 47 6 82
Guinea-Bissau 8 8 3 – 5 – –
Iran 11,795 11,795 6,463 867 4,413 7,335 168
Iraq 1,609 1,453 608 21 805 382 881
Israel 23,621 19,788 11,813 721 3,427 2,343 6,251
Jordan 4,132 2,778 1,724 183 755 1,064 293
Kenya 4,044 2,580 1,310 314 924 432 53
Kuwait 15,942 14,756 9,956 549 4,010 1,974 3,200
Lesotho 4 4 4 – – – –
Liberia 36,098 36,095 7,475 2,109 26,247 3 –
Libya 592 592 514 3 60 197 –
Madagascar 1,418 461 117 26 247 91 7
Malawi 109 109 49 14 41 34 –
Mali 427 300 155 35 96 164 17
Mauritania 343 343 142 15 167 131 1
Morocco 28,473 8,180 3,090 929 3,761 2,607 1,962
Mozambique 5,563 1,850 529 101 848 191 395
Namibia 402 402 167 3 198 9 87
Niger 142 137 149 2 –19 49 9
Nigeria 10,126 8,277 5,057 485 1,998 2,859 370
Oman 11,555 9,366 3,049 364 5,886 1,683 921
Palestinian Territory 50 50 28 3 11 14 22
Qatar 58,760 55,009 23,452 7,668 22,784 15,077 8,841
Rwanda 72 72 15 – 42 10 16
Sao Tomé and Principe 60 60 14 – 45 2 22
Saudi Arabia 78,402 67,207 33,624 995 31,543 33,274 3,061
Senegal 2,867 979 199 351 405 54 92
Seychelles 2,438 2,218 1,871 83 248 2 2
Sierra Leone 138 94 59 1 32 1 67
Somalia 93 93 – 17 76 – 10
South Africa 120,557 36,605 17,710 1,707 12,698 12,655 9,659
St. Helena 5 5 2 – 3 – –
Sudan 900 899 550 54 240 201 448
Swaziland 51 51 25 – 25 7 –
A 68 January 2012 Preliminary International Banking Statistics, third quarter 2011
- 4. Table 9A (Cont.)
Local currency positions of
Sectors reporting banks' foreign Net risk Total foreign End-September 2011
Non-bank offices with local residents transfers claims on an
private sector Claims Liabilities ultimate risk
basis Claims vis-à-vis
H L M Q R(=A+L+Q)
1,624,300 2,243,273 1,568,953 –111,629 5,286,900 Developing countries
262,572 221,871 188,587 –20,957 641,017 Africa & Middle East
1,223 7,321 5,499 –812 8,600 Algeria
3,946 579 1,004 –877 7,185 Angola
17 20 – –4 79 Benin
556 1,787 2,120 76 2,615 Botswana
449 507 546 –32 960 Burkina Faso
19 – – 48 84 Burundi
799 2,215 2,326 –130 3,107 Cameroon
243 790 416 –86 1,538 Cape Verde
37 – – –1 35 Central African Republic
25 36 – –6 58 Chad
15 – – –3 24 Comoros Islands
212 119 197 –46 312 Congo
314 11 11 –206 347 Congo Democratic Republic
1,252 2,267 1,580 –307 4,000 Côte d’Ivoire
184 – – –61 157 Djibouti
11,257 24,724 24,164 –803 40,565 Egypt
28 547 – –18 570 Equatorial Guinea
7 – – –1 6 Eritrea
419 – – –319 102 Ethiopia
129 37 152 –287 655 Gabon
68 11 65 – 88 Gambia
2,251 1,896 1,957 –479 5,661 Ghana
238 192 267 –9 508 Guinea
8 – – –1 7 Guinea-Bissau
4,287 – – –3,423 8,372 Iran
189 156 213 237 1,846 Iraq
11,148 3,833 959 486 24,107 Israel
1,418 1,354 841 –5 4,127 Jordan
2,095 1,464 1,678 –370 3,674 Kenya
9,570 1,186 408 952 16,894 Kuwait
4 – – –1 3 Lesotho
35,867 3 6 –7,008 29,090 Liberia
394 – – 36 628 Libya
363 957 962 –81 1,337 Madagascar
76 – – –75 34 Malawi
121 127 136 –125 302 Mali
215 – – –46 297 Mauritania
3,614 20,293 16,007 –2,052 26,421 Morocco
1,265 3,713 1,661 –129 5,434 Mozambique
308 – – –6 396 Namibia
78 5 – –15 127 Niger
5,044 1,849 1,498 –461 9,665 Nigeria
6,761 2,189 1,962 –2,116 9,439 Oman
14 – 2 1 51 Palestinian Territory
30,856 3,751 3,487 162 58,922 Qatar
46 – – –9 63 Rwanda
36 – – –21 39 Sao Tomé and Principe
30,823 11,195 987 6,530 84,932 Saudi Arabia
834 1,888 1,479 –56 2,811 Senegal
2,211 220 473 –897 1,541 Seychelles
26 44 28 240 378 Sierra Leone
84 – – –2 91 Somalia
14,235 83,952 83,467 –902 119,655 South Africa
5 – – 4 9 St. Helena
251 1 – –197 703 Sudan
43 – – 5 56 Swaziland
Preliminary International Banking Statistics, third quarter 2011 January 2012 A 69
- 5. Table 9A (Cont.)
Total Consolidated cross-border claims in all currencies and local claims in non-local currencies
End-September 2011 foreign Maturities Sectors
claims on a Total Up to and Over one year Over two Banks Public Sector
contractual international including one up to two years
Claims vis-à-vis basis claims year years
A+L A B C D F G
Syria 582 582 423 15 94 150 18
Tanzania 2,746 1,379 720 171 423 140 152
Togo 398 383 39 3 328 345 13
Tunisia 8,168 3,981 1,315 808 1,605 879 1,247
Uganda 1,091 836 399 10 402 172 43
United Arab Emirates 141,814 108,986 52,584 12,261 41,064 28,891 8,041
Yemen 1,450 1,177 163 332 681 38 12
Zambia 2,849 1,362 550 52 595 161 257
Zimbabwe 454 234 207 3 21 10 21
Residual 7 7 7 – – – –
Asia & Pacific 2,058,845 1,370,038 915,071 65,930 259,038 578,813 148,039
Afghanistan 204 163 124 8 29 19 –
Armenia 790 619 252 69 269 138 16
Azerbaijan 5,279 5,279 1,603 1,070 2,587 1,257 669
Bangladesh 7,152 4,086 3,430 45 513 1,510 271
Bhutan 83 83 8 – 75 – 78
British Overseas Territories 480 480 306 30 143 – –
Brunei 4,243 2,280 1,860 28 368 30 1,239
Cambodia 346 346 111 3 231 13 3
China 685,313 531,250 409,241 17,319 57,075 299,099 25,694
Chinese Taipei 174,149 95,650 82,213 1,628 4,832 38,483 22,601
Fiji 1,454 36 20 3 13 5 2
French Polynesia 4,875 2,151 248 125 1,555 1,118 32
Georgia 1,002 942 482 43 362 197 108
India 320,914 224,460 139,213 12,311 51,892 83,553 10,632
Indonesia 116,371 81,728 49,070 3,307 23,293 12,400 17,710
Kazakhstan 18,663 13,720 4,375 863 5,027 4,092 1,280
Kiribati – – – – – – –
Kyrgyz Republic 204 127 12 12 97 21 –
Laos 441 441 34 15 391 12 38
Malaysia 145,855 56,544 30,390 3,920 14,309 15,467 9,720
Maldives 677 555 187 47 254 10 170
Marshall Islands 37,062 36,978 9,395 1,713 25,428 7 –
Micronesia 4 4 3 – – – –
Mongolia 534 534 240 47 207 85 46
Myanmar 259 259 194 – 65 167 –
Nauru 4 4 2 – 2 – –
Nepal 342 83 75 1 6 37 –
New Caledonia 6,486 3,210 66 121 2,740 1,295 165
North Korea 246 246 230 10 5 26 11
Pakistan 14,797 5,527 2,620 69 2,325 1,178 1,558
Palau – – – – – – –
Papua New Guinea 4,070 689 99 1 547 5 64
Philippines 39,564 27,934 14,717 1,149 9,534 8,271 8,109
Solomon Islands 176 2 1 – 1 – –
South Korea 339,106 208,975 132,442 18,812 33,555 90,483 38,561
Sri Lanka 6,889 4,591 2,122 95 1,684 763 1,875
Tajikistan 42 42 4 29 8 11 –
Thailand 94,492 38,420 18,535 1,699 11,512 12,996 5,244
Timor Leste 91 91 31 4 19 – –
Tonga 131 1 – – 1 – –
Turkmenistan 242 242 41 – 193 95 94
Tuvalu 8 8 – – 8 – –
US Pacific Islands 336 336 275 19 41 3 –
Uzbekistan 701 696 270 40 373 441 –
Vietnam 24,437 19,921 10,381 1,254 7,334 5,525 2,049
Wallis/Futuna 47 21 – 10 11 – –
Residual 284 284 149 11 124 1 –
A 70 January 2012 Preliminary International Banking Statistics, third quarter 2011
- 6. Table 9A (Cont.)
Local currency positions of
Sectors reporting banks' foreign Net risk Total foreign End-September 2011
Non-bank offices with local residents transfers claims on an
private sector Claims Liabilities ultimate risk
basis Claims vis-à-vis
H L M Q R(=A+L+Q)
413 – – –11 571 Syria
1,085 1,367 695 –176 2,570 Tanzania
23 15 – –11 387 Togo
1,858 4,187 3,633 –385 7,783 Tunisia
620 255 948 –26 1,065 Uganda
70,318 32,828 25,613 –6,279 135,535 United Arab Emirates
1,128 273 – –207 1,243 Yemen
944 1,487 677 –177 2,672 Zambia
203 220 463 24 478 Zimbabwe
3 – – –1 6 Residual
566,696 688,807 457,878 –29,410 2,029,435 Asia & Pacific
145 41 37 –99 105 Afghanistan
464 171 92 –28 762 Armenia
3,357 – – –701 4,578 Azerbaijan
2,304 3,066 3,416 –742 6,410 Bangladesh
5 – – –70 13 Bhutan
479 – – –77 403 British Overseas Territories
1,012 1,963 4,920 –348 3,895 Brunei
228 – – –29 317 Cambodia
145,773 154,063 109,342 7,347 692,660 China
33,247 78,499 40,907 –7,143 167,006 Chinese Taipei
29 1,418 1,595 49 1,503 Fiji
1,000 2,724 2,147 –6 4,869 French Polynesia
635 60 60 –54 948 Georgia
120,592 96,454 53,323 17,252 338,166 India
50,956 34,643 22,949 –24,867 91,504 Indonesia
8,057 4,943 3,583 –541 18,122 Kazakhstan
– – – 34 34 Kiribati
106 77 53 –3 201 Kyrgyz Republic
392 – – –105 336 Laos
30,301 89,311 71,888 –694 145,161 Malaysia
375 122 73 80 757 Maldives
36,967 84 1 –4,514 32,548 Marshall Islands
3 – – – 4 Micronesia
403 – – 3 537 Mongolia
92 – – –13 246 Myanmar
4 – – – 4 Nauru
45 259 343 8 350 Nepal
1,751 3,276 2,465 –231 6,255 New Caledonia
210 – 30 –9 237 North Korea
2,784 9,270 7,687 –2,104 12,693 Pakistan
– – 5 – – Palau
621 3,381 2,963 –114 3,956 Papua New Guinea
11,350 11,630 5,343 –4,504 35,060 Philippines
2 174 160 –1 175 Solomon Islands
78,011 130,131 84,374 5,453 344,559 South Korea
1,954 2,298 1,401 –529 6,360 Sri Lanka
31 – – –11 31 Tajikistan
19,945 56,072 34,836 –6,280 88,212 Thailand
91 – – – 91 Timor Leste
1 130 150 – 131 Tonga
53 – – –166 76 Turkmenistan
8 – – –8 – Tuvalu
333 – – 5 341 US Pacific Islands
253 5 137 –226 475 Uzbekistan
12,143 4,516 3,559 –5,405 19,032 Vietnam
21 26 39 – 47 Wallis/Futuna
163 – – –19 265 Residual
Preliminary International Banking Statistics, third quarter 2011 January 2012 A 71
- 7. Table 9A (Cont.)
Total Consolidated cross-border claims in all currencies and local claims in non-local currencies
End-September 2011 foreign Maturities Sectors
claims on a Total Up to and Over one year Over two Banks Public Sector
contractual international including one up to two years
Claims vis-à-vis basis claims year years
A+L A B C D F G
Europe 1,416,968 803,130 301,042 64,808 378,683 160,443 123,674
Albania 7,003 3,715 1,333 311 2,040 226 931
Belarus 5,351 4,457 2,573 270 1,457 2,504 114
Bosnia and Herzegovina 10,634 4,396 1,710 477 1,821 596 216
Bulgaria 38,973 28,501 10,083 2,820 14,958 1,812 2,616
Croatia 78,087 52,654 16,328 6,036 27,962 3,482 7,917
Czech Republic 201,077 44,955 13,225 2,713 24,040 9,589 9,418
Hungary 125,359 84,652 27,405 4,187 41,932 11,614 18,812
Latvia 22,832 19,570 4,108 688 13,195 1,162 1,205
Lithuania 26,753 20,259 3,815 2,331 11,852 885 3,549
Macedonia, FYR 2,704 1,764 687 196 796 167 441
Moldova 865 616 240 56 223 115 73
Montenegro 1,979 1,158 459 83 545 113 229
Poland 280,214 136,716 37,129 8,792 78,637 17,171 31,042
Romania 111,330 73,374 24,893 8,228 35,830 8,426 12,928
Russia 225,054 146,087 61,708 15,385 60,844 48,934 6,752
Serbia 28,770 18,184 7,646 1,962 7,735 1,672 3,779
Turkey 212,750 140,137 79,455 8,511 46,639 48,804 20,646
Ukraine 36,078 21,147 7,569 1,754 8,127 3,067 2,863
Res. Serbia & Montenegro 227 227 227 – – 17 116
Residual Europe 928 561 449 8 50 87 27
Latin America/Caribbean 1,260,742 541,985 255,518 40,098 183,666 132,056 119,474
Argentina 46,513 22,859 13,167 2,580 5,158 2,471 4,682
Belize 3,242 2,924 2,450 145 277 11 147
Bolivia 508 498 925 141 –568 13 1
Bonaire, Saint Eustatius and 27 27 24 – 2 – –
Brazil 530,116 222,685 106,261 20,754 57,500 67,266 63,093
Chile 124,884 52,674 28,467 3,829 16,874 17,640 3,476
Colombia 42,469 19,838 12,575 1,163 4,963 5,197 3,411
Costa Rica 10,274 8,241 2,803 404 4,662 1,904 543
Cuba 1,794 1,717 795 112 630 1,200 141
Dominica 996 882 279 83 496 141 57
Dominican Republic 5,466 4,225 2,035 133 1,939 379 1,387
Ecuador 2,996 2,583 1,547 257 716 445 176
El Salvador 7,920 6,136 1,853 97 4,125 1,352 1,040
Falkland Islands 48 25 14 – 11 – –
Grenada 283 139 30 12 63 – 8
Guatemala 5,358 4,459 2,271 192 1,970 1,243 439
Guyana 318 73 53 – 18 – –
Haiti 281 166 78 – 74 26 60
Honduras 2,523 1,310 617 52 494 615 100
Jamaica 6,559 3,718 1,133 132 1,746 355 1,310
Mexico 351,203 111,827 45,565 5,331 52,103 14,468 27,877
Nicaragua 734 650 322 23 299 99 10
Paraguay 5,481 2,628 1,649 235 432 787 132
Peru 47,981 34,069 15,628 1,928 12,384 8,060 6,274
St. Lucia 1,578 1,208 277 20 300 79 108
St. Vincent 986 876 535 74 215 1 8
Surinam 571 571 9 6 226 106 27
Trinidad and Tobago 9,762 3,388 1,298 399 1,661 149 326
Turks and Caicos 1,311 845 304 13 470 47 –
Uruguay 12,961 9,789 5,348 326 3,709 1,573 2,217
Venezuela 28,744 14,100 3,811 1,204 7,712 6,283 2,419
Residual 6,855 6,855 3,395 453 3,005 146 5
Int. organisations 123,419 122,857 19,790 4,686 36,325 10,058 109,760
Unallocated 15,820 15,754 12,051 174 2,202 2,040 871
A 72 January 2012 Preliminary International Banking Statistics, third quarter 2011
- 8. Table 9A (Cont.)
Local currency positions of
Sectors reporting banks' foreign Net risk Total foreign End-September 2011
Non-bank offices with local residents transfers claims on an
private sector Claims Liabilities ultimate risk
basis Claims vis-à-vis
H L M Q R(=A+L+Q)
511,405 613,838 367,805 –52,831 1,364,137 Europe
2,550 3,288 1,396 –76 6,927 Albania
1,733 894 – –167 5,184 Belarus
3,351 6,238 1,285 –553 10,081 Bosnia and Herzegovina
23,562 10,472 8,063 –3,300 35,673 Bulgaria
40,493 25,433 7,717 –2,652 75,435 Croatia
25,317 156,122 86,569 –2,926 198,151 Czech Republic
52,747 40,707 23,682 –6,344 119,015 Hungary
17,144 3,262 3,006 –554 22,278 Latvia
15,781 6,494 11,946 –2,209 24,544 Lithuania
1,157 940 729 –55 2,649 Macedonia, FYR
411 249 164 –14 851 Moldova
751 821 180 –273 1,706 Montenegro
87,588 143,498 116,653 –18,049 262,165 Poland
51,666 37,956 17,088 –3,289 108,041 Romania
89,079 78,967 34,607 –5,358 219,696 Russia
12,287 10,586 2,367 –853 27,917 Serbia
70,581 72,613 45,640 –3,187 209,563 Turkey
14,722 14,931 6,492 –2,968 33,110 Ukraine
94 – 2 1 228 Res. Serbia & Montenegro
391 367 219 –5 923 Residual Europe
283,627 718,757 554,683 –8,431 1,252,311 Latin America/Caribbean
15,609 23,654 20,249 –1,697 44,816 Argentina
2,763 318 269 –936 2,306 Belize
482 10 3 –216 292 Bolivia
27 – – – 27 Bonaire, Saint Eustatius and
89,525 307,431 211,752 25,160 555,276 Brazil
31,531 72,210 56,546 –6,266 118,618 Chile
11,215 22,631 15,272 –926 41,543 Colombia
5,792 2,033 1,507 –544 9,730 Costa Rica
374 77 – –188 1,606 Cuba
684 114 152 –3 993 Dominica
2,456 1,241 937 –1,190 4,276 Dominican Republic
1,961 413 404 –708 2,288 Ecuador
3,743 1,784 1,406 –91 7,829 El Salvador
25 23 104 –4 44 Falkland Islands
132 144 173 –13 270 Grenada
2,777 899 565 –118 5,240 Guatemala
73 245 219 –5 313 Guyana
80 115 100 –67 214 Haiti
594 1,213 1,049 48 2,571 Honduras
2,047 2,841 1,345 –96 6,463 Jamaica
69,412 239,376 208,683 –15,440 335,763 Mexico
539 84 46 –78 656 Nicaragua
1,653 2,853 2,550 –109 5,372 Paraguay
19,531 13,912 10,437 –1,719 46,262 Peru
1,022 370 348 –16 1,562 St. Lucia
852 110 106 –197 789 St. Vincent
439 – – –23 548 Surinam
2,911 6,374 4,825 77 9,839 Trinidad and Tobago
794 466 282 –99 1,212 Turks and Caicos
5,947 3,172 2,352 –1,467 11,494 Uruguay
5,216 14,644 13,002 –592 28,152 Venezuela
3,421 – – –908 5,947 Residual
3,035 562 1,432 7,831 131,250 Int. organisations
9,177 66 126 12,791 28,611 Unallocated
Preliminary International Banking Statistics, third quarter 2011 January 2012 A 73