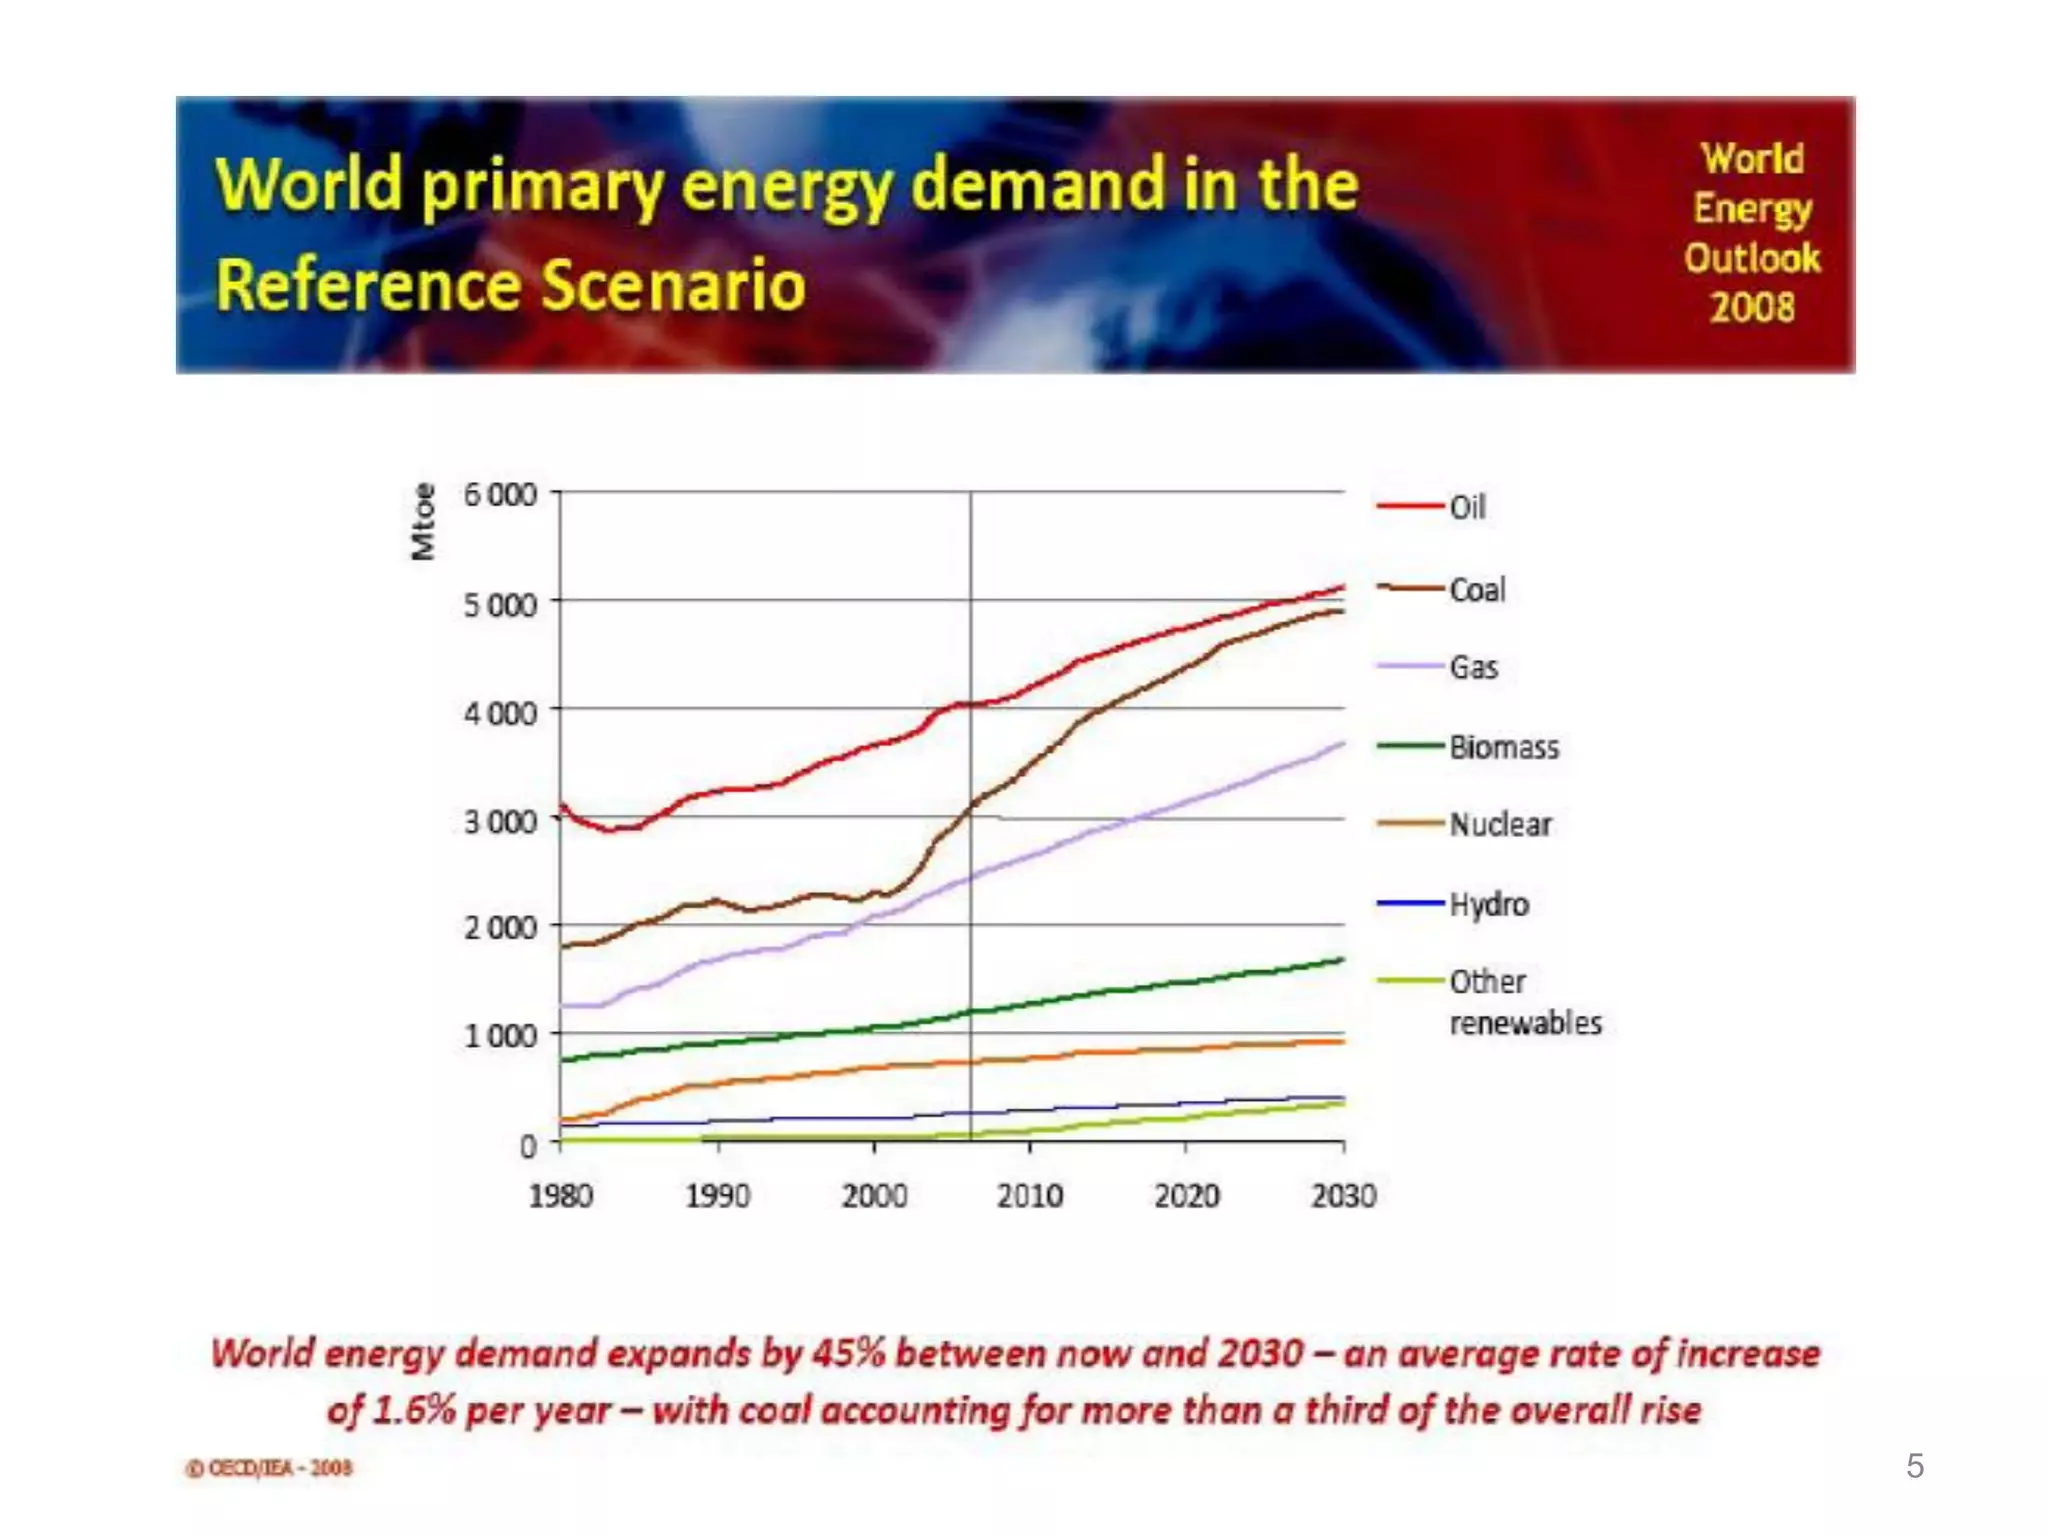
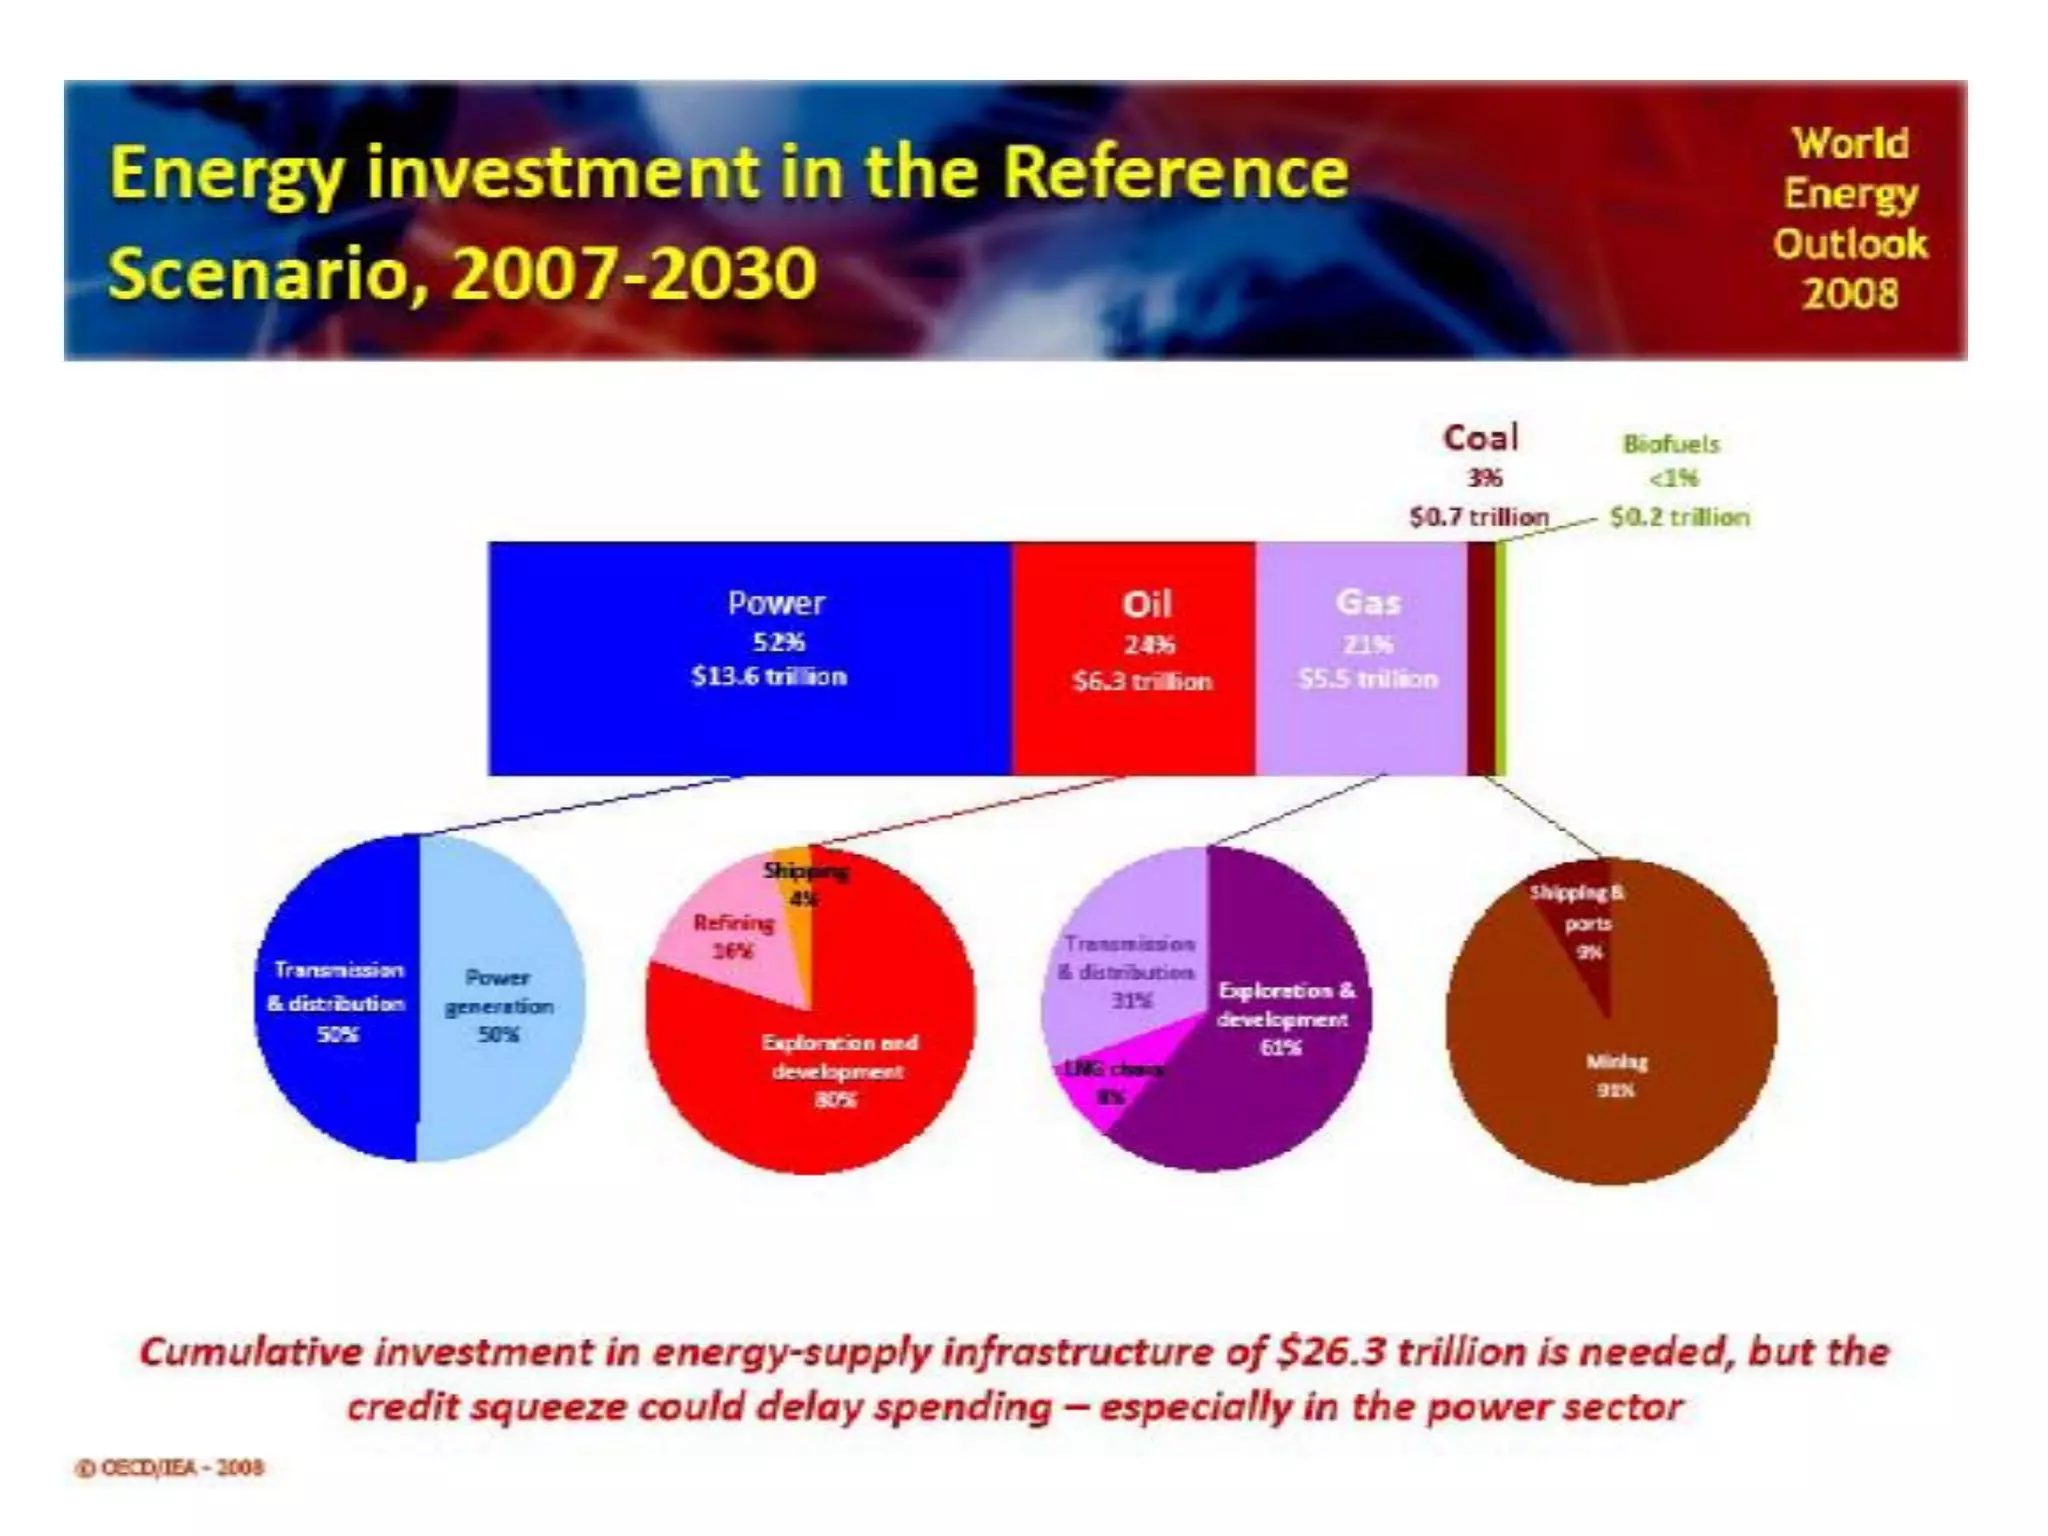
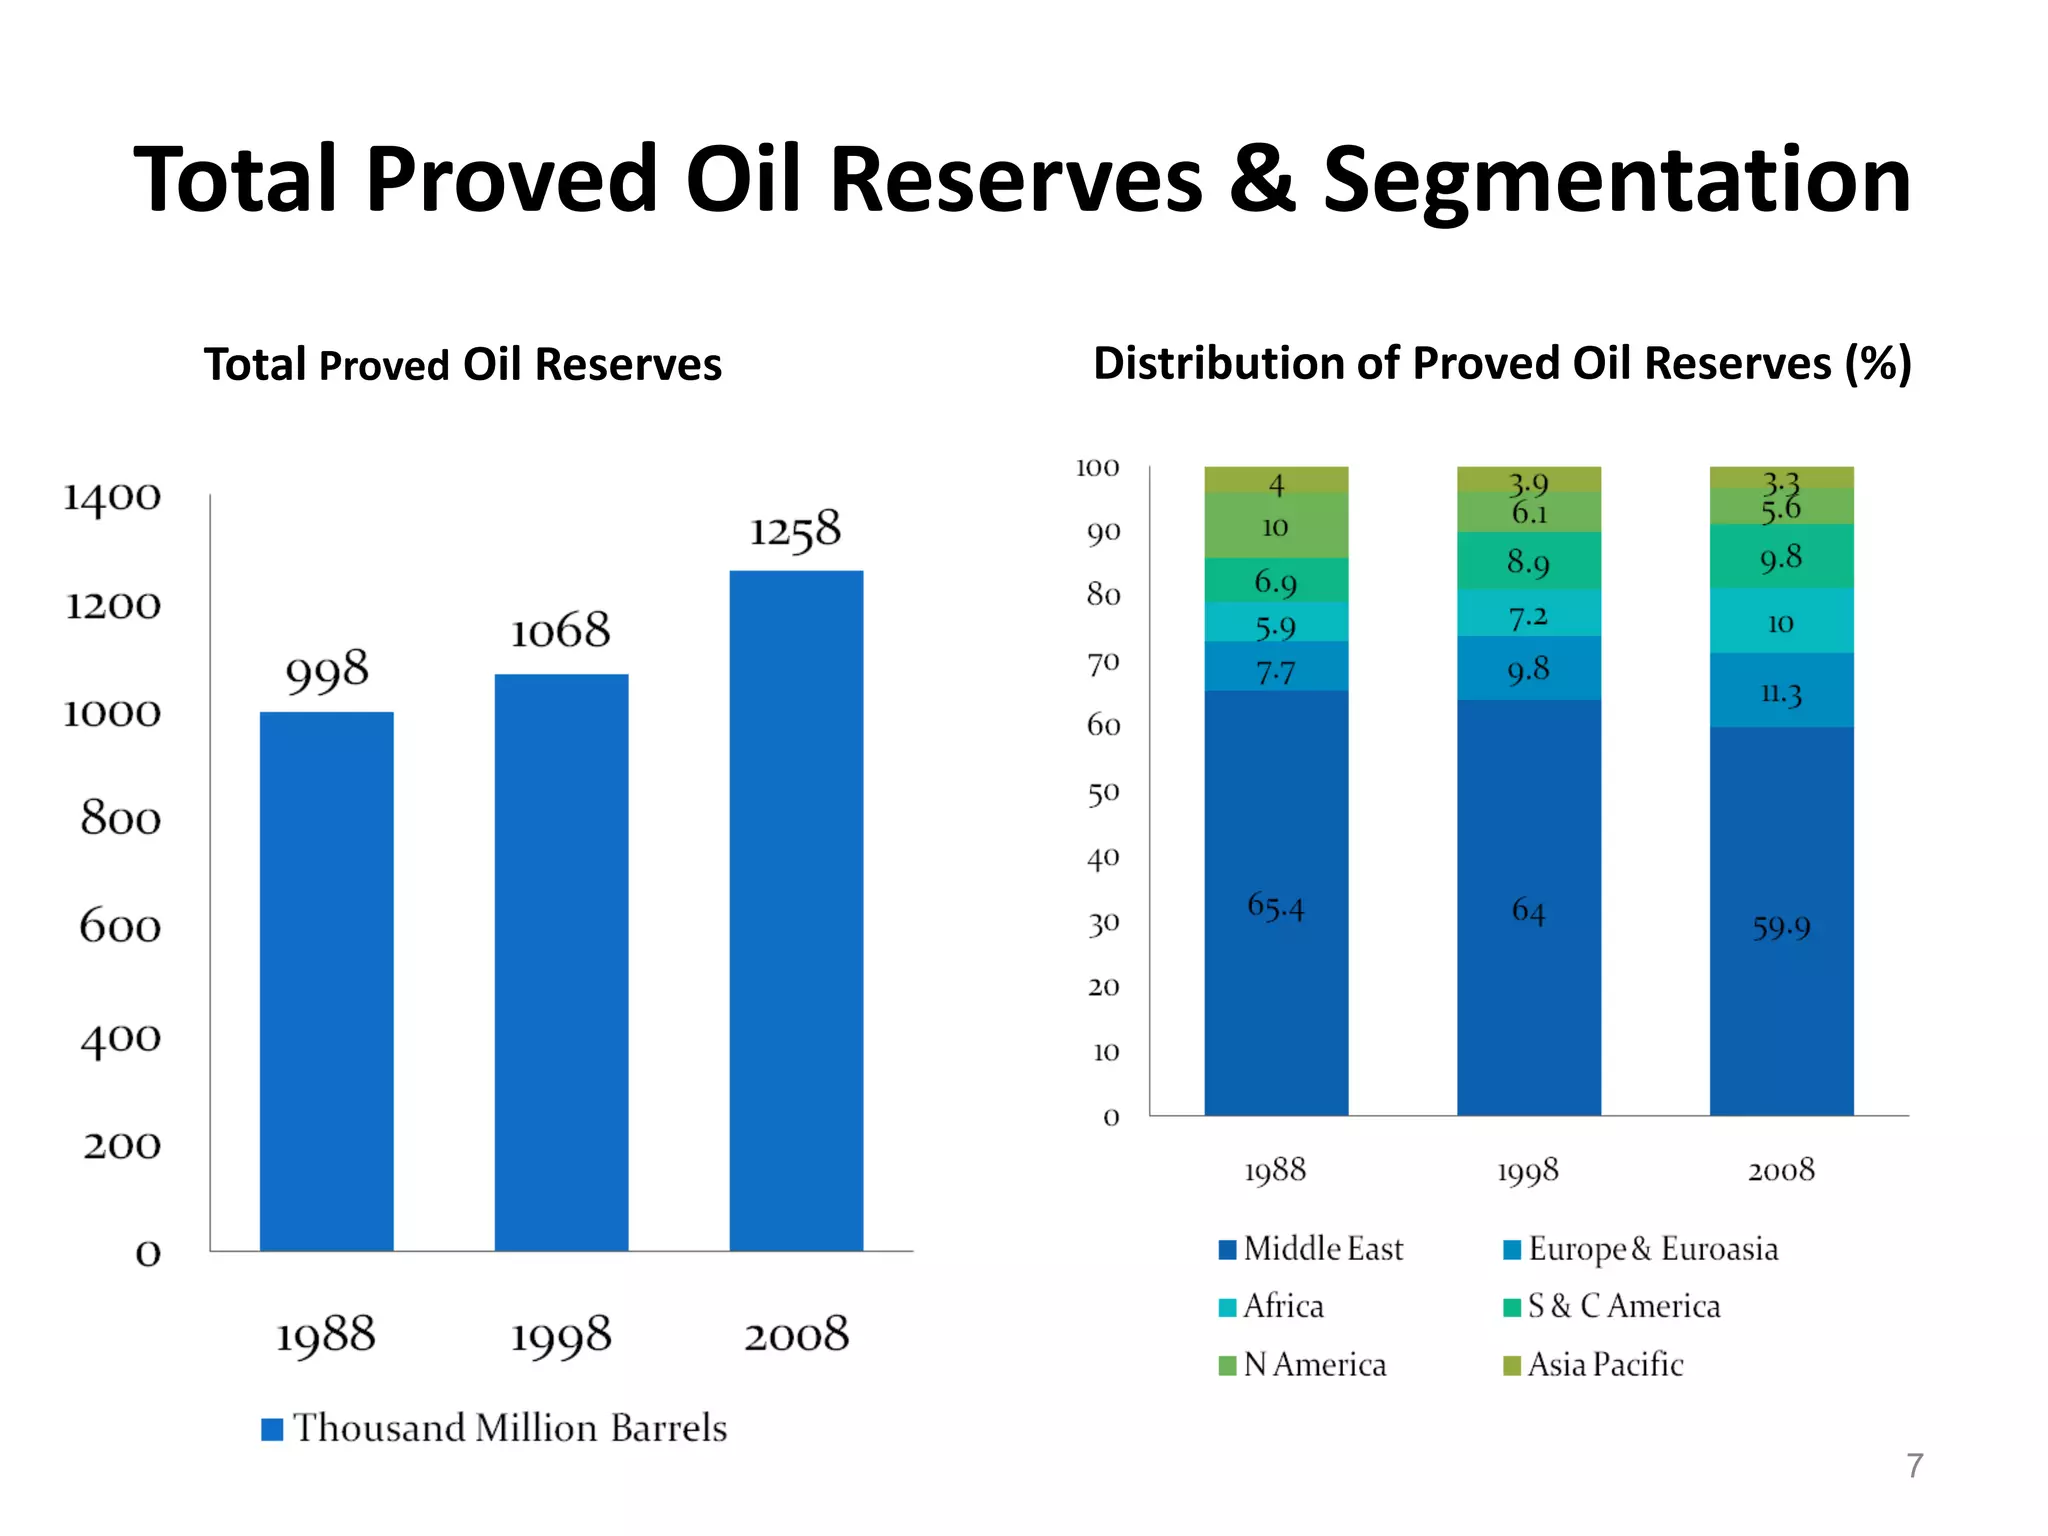
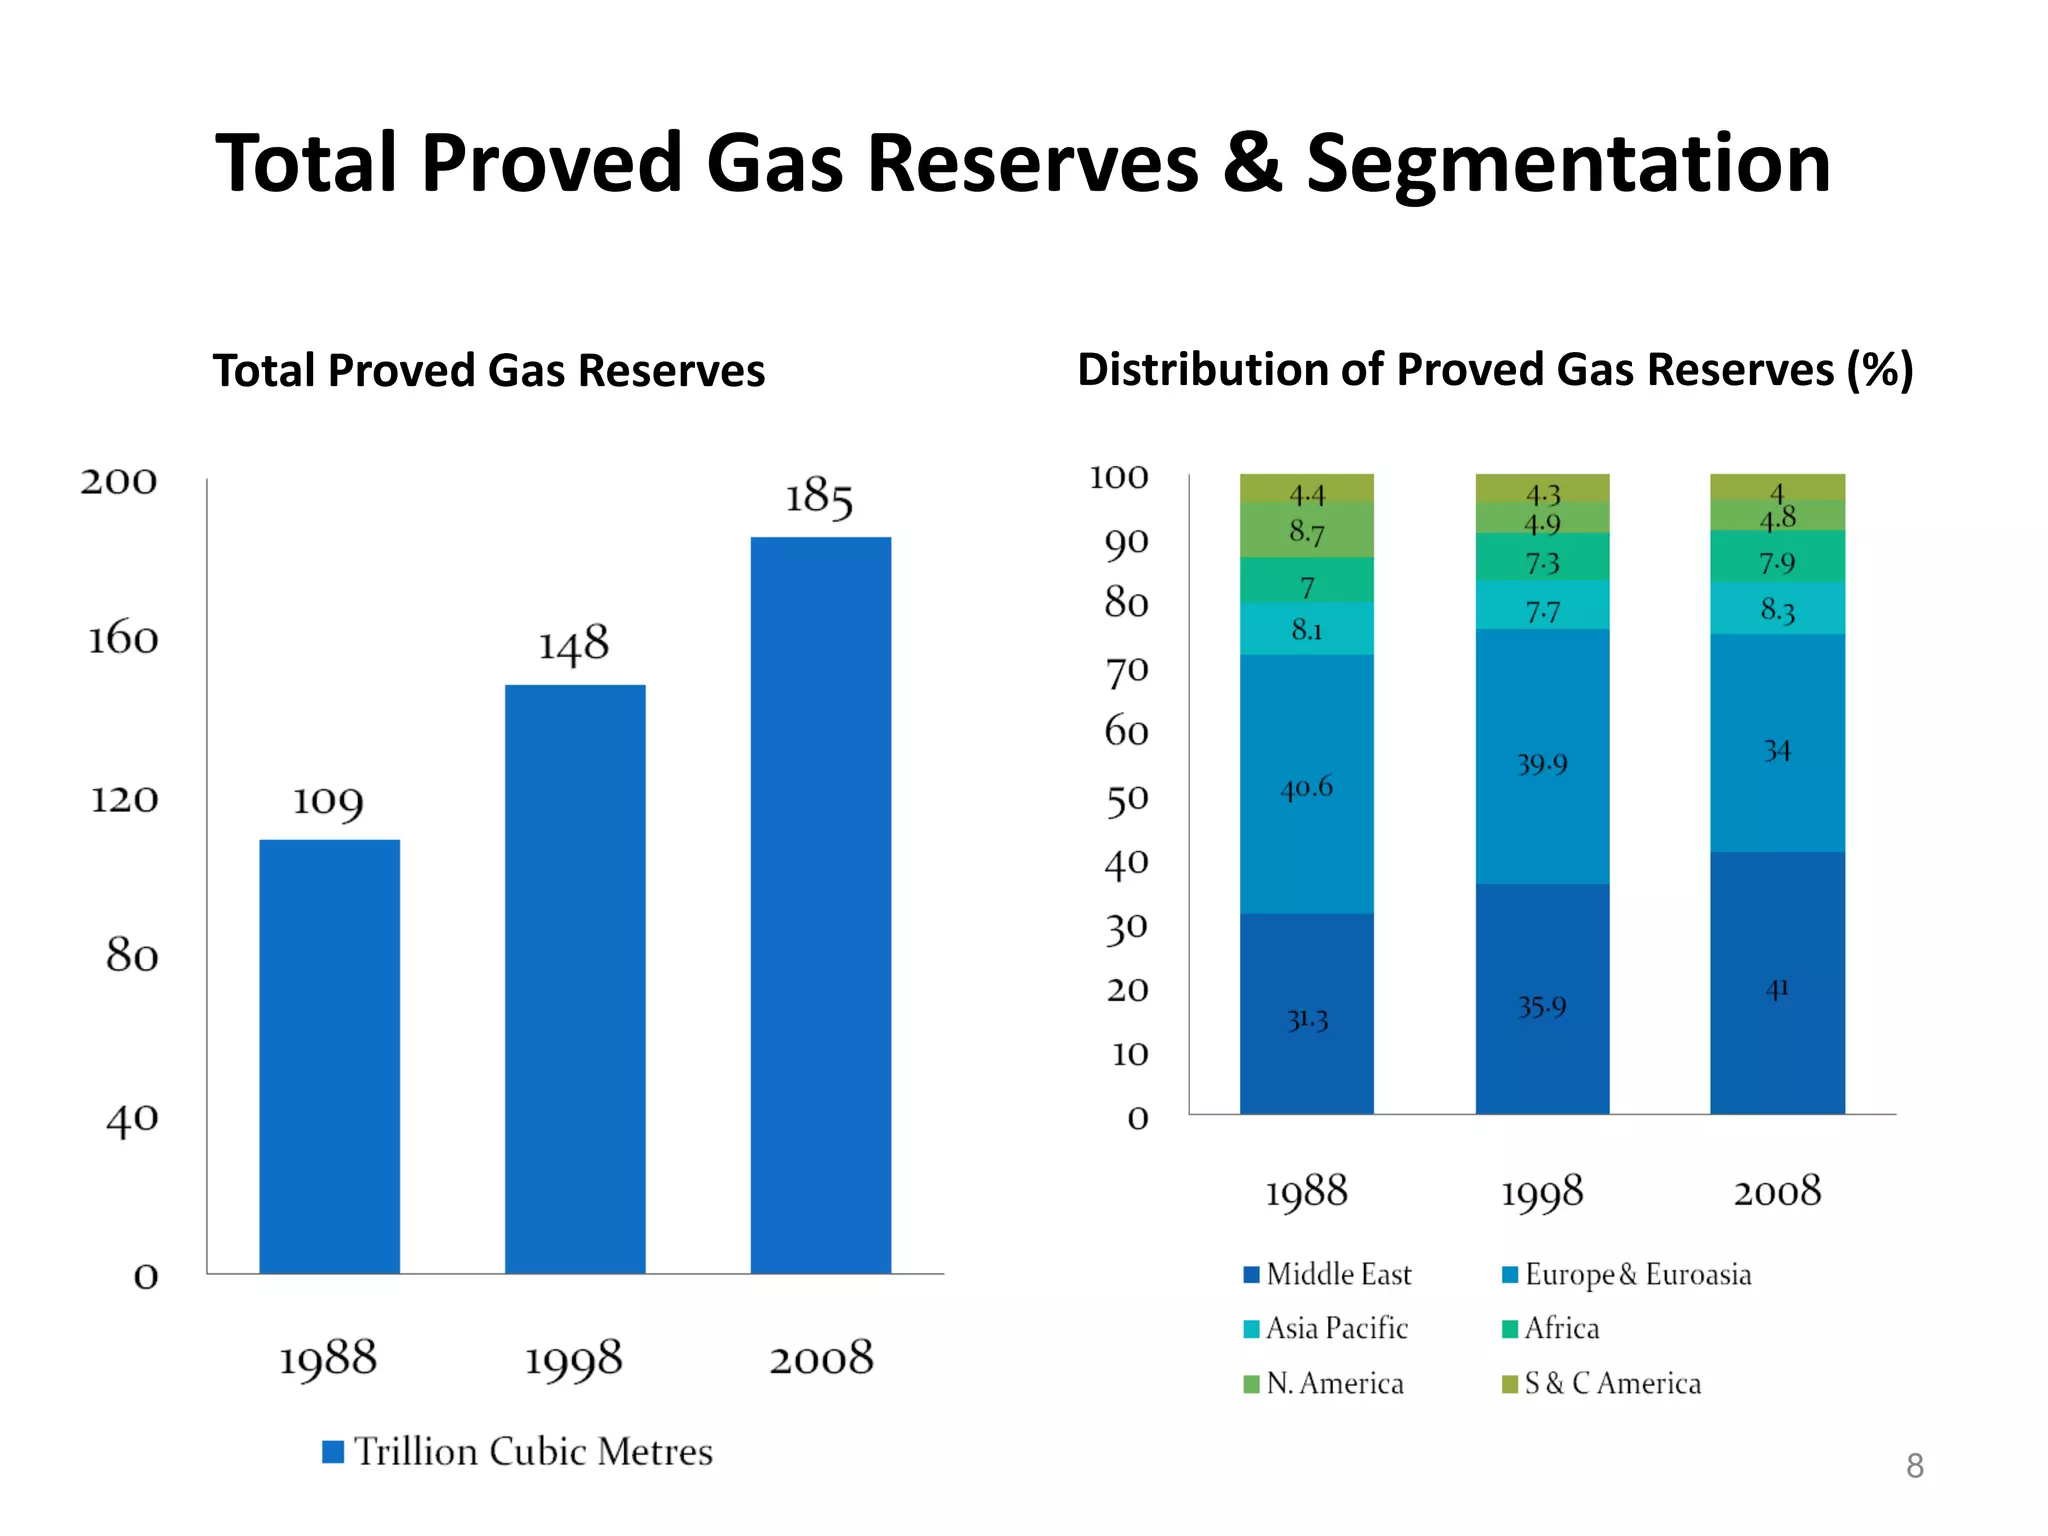
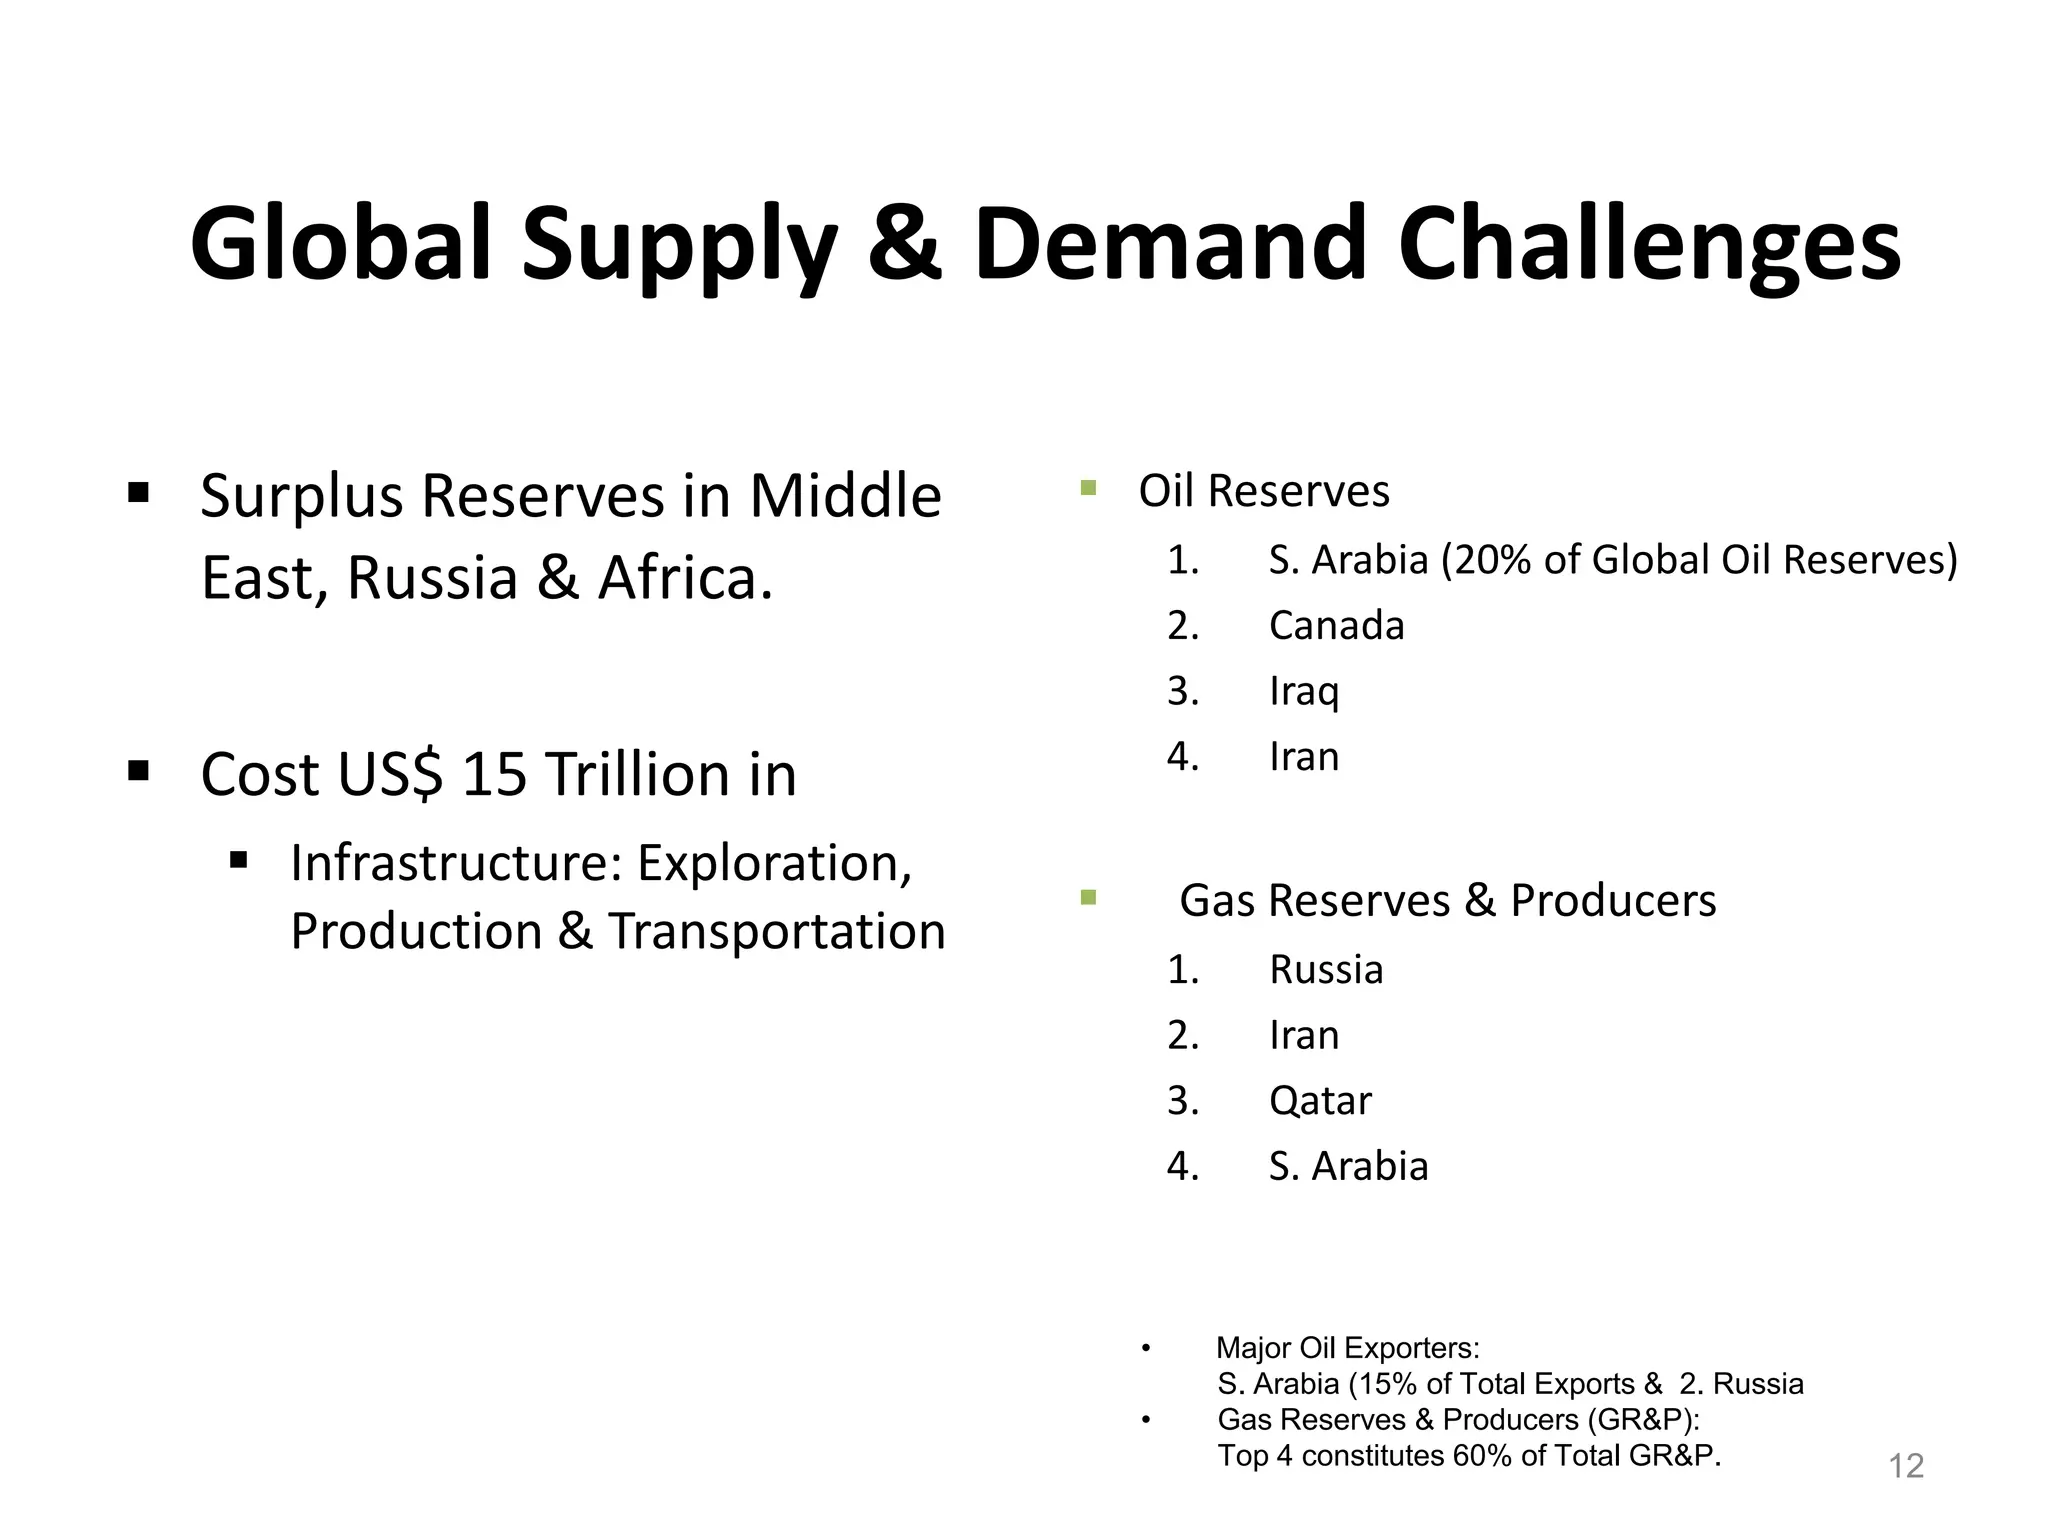
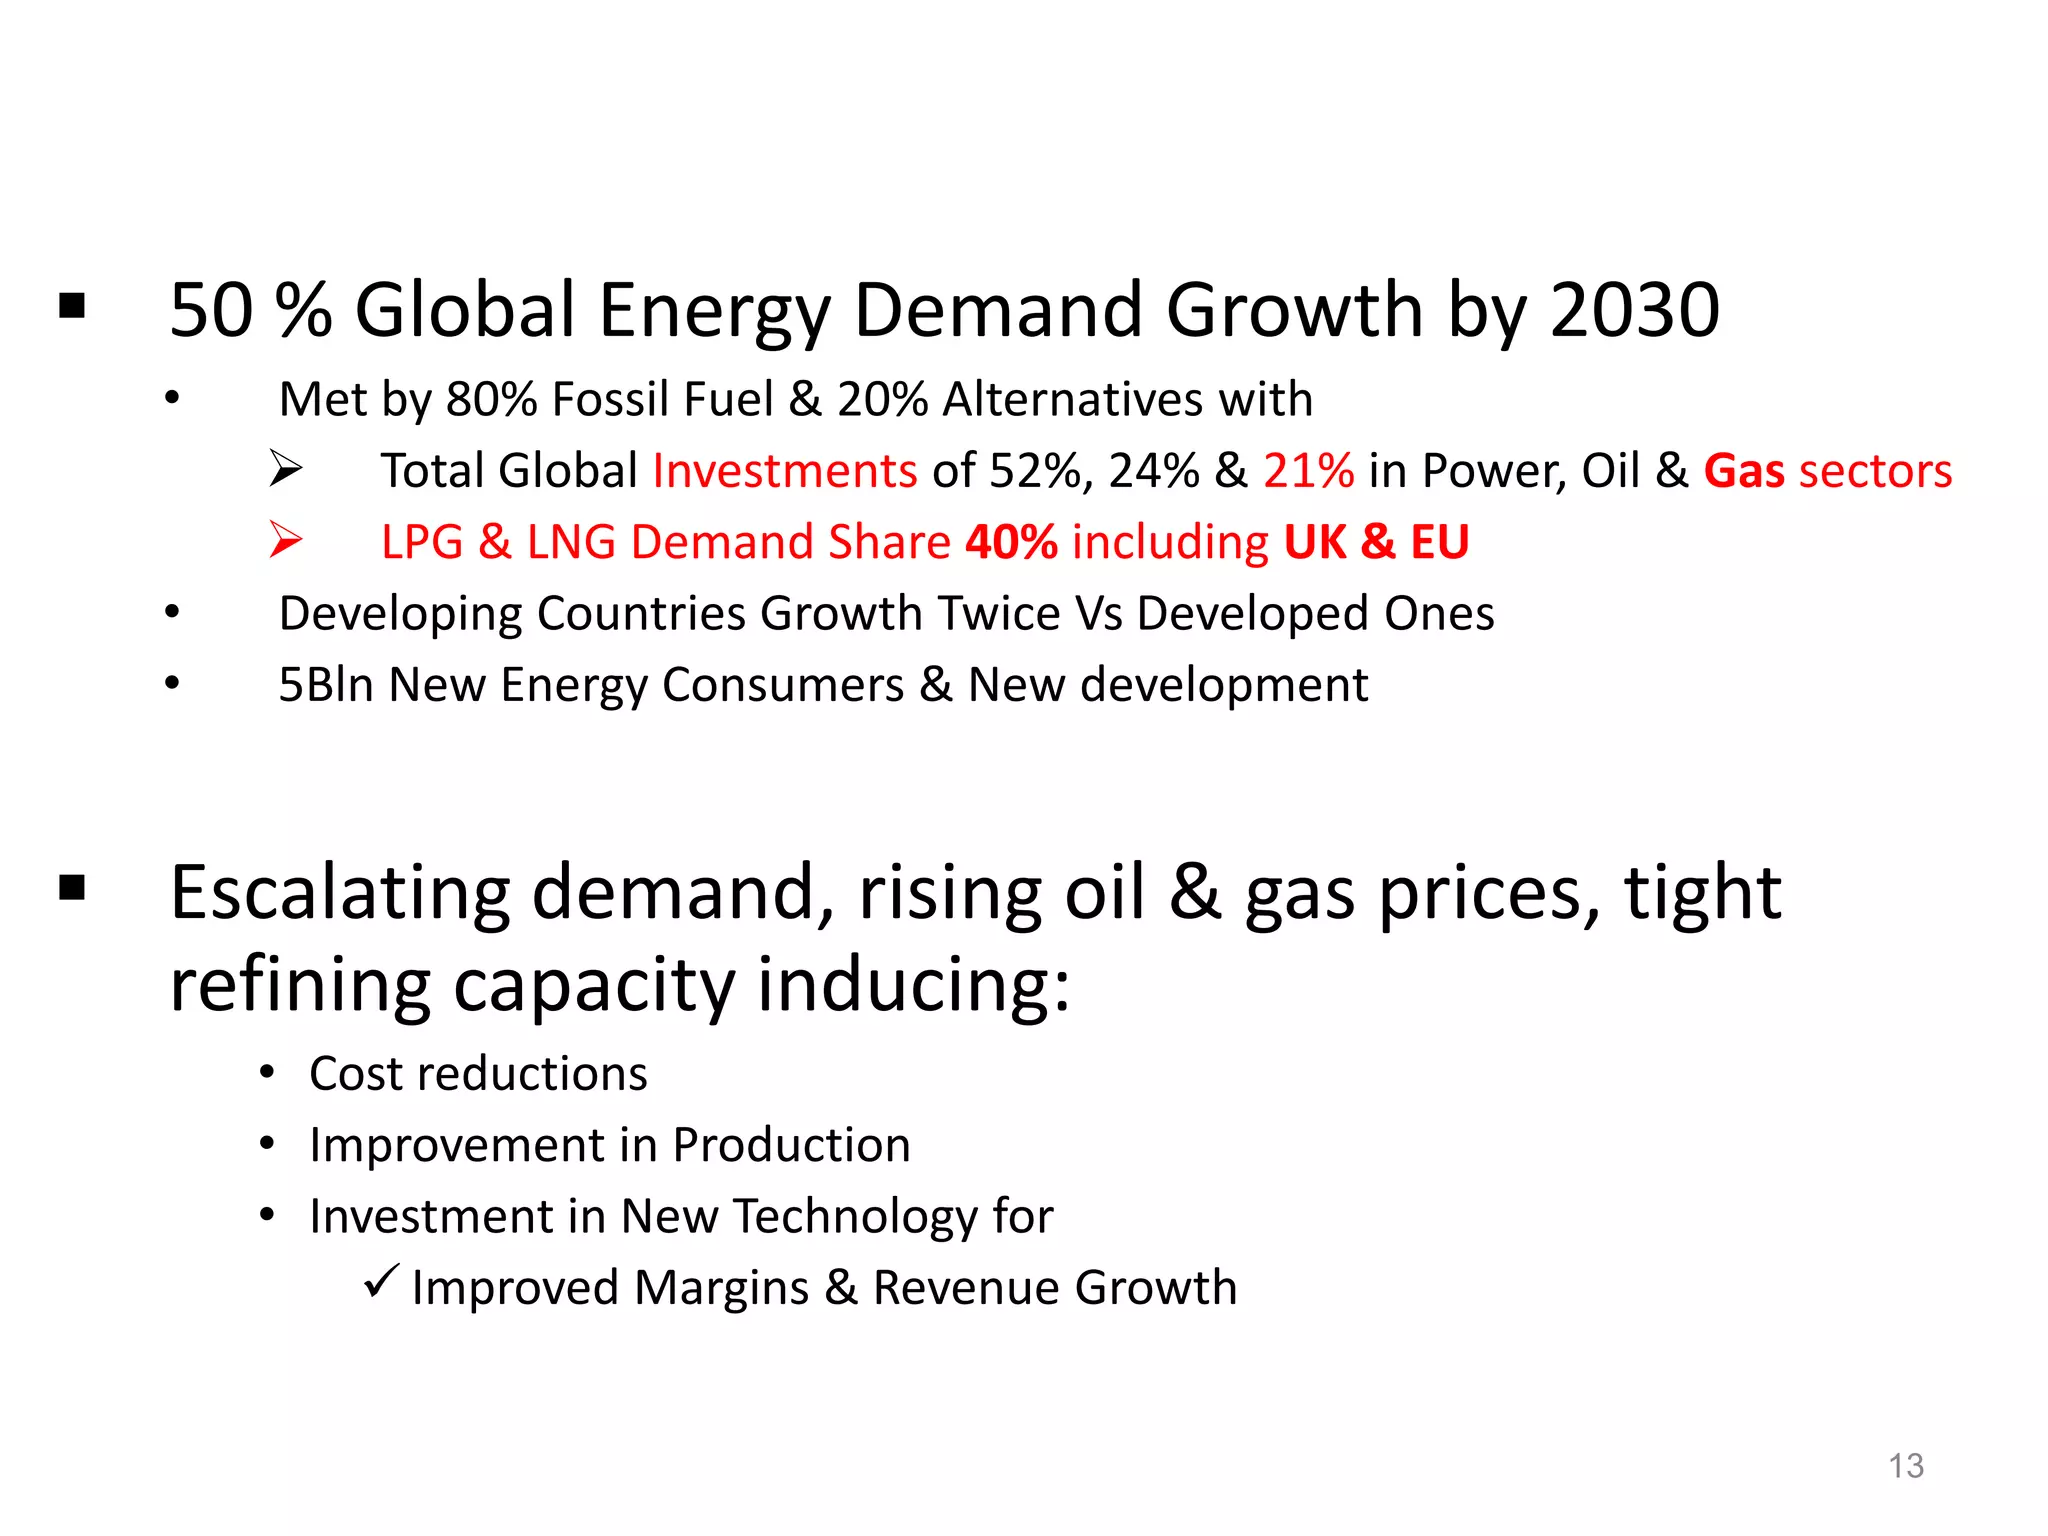
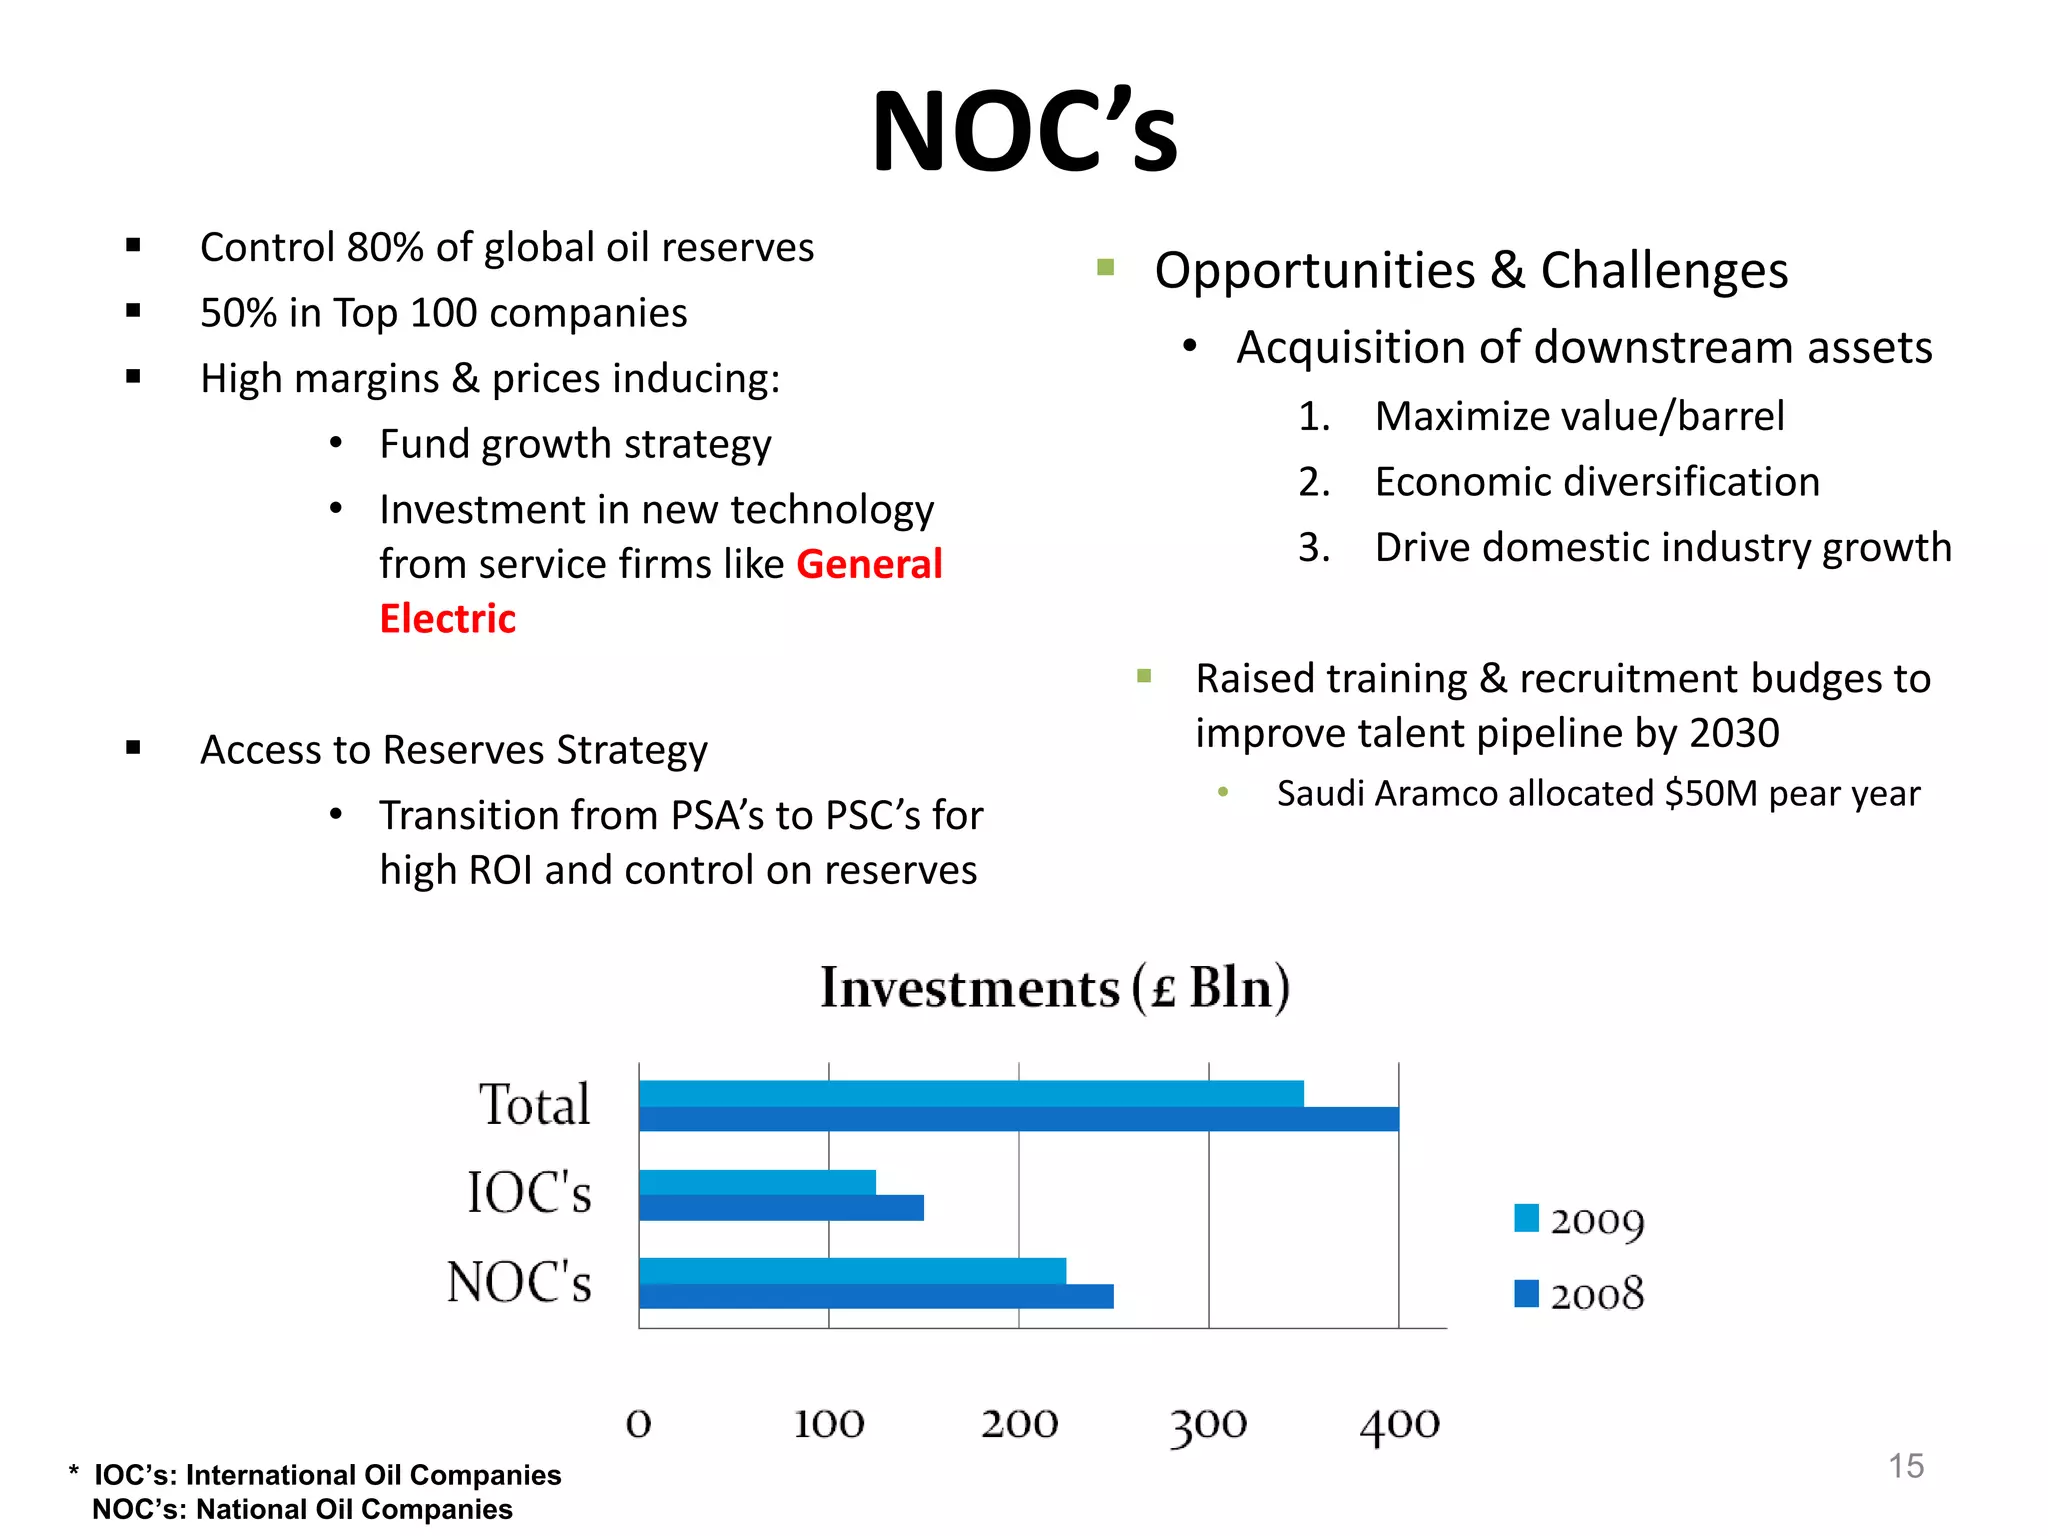
Global Energy Outlook 2010-2030

   Emerging Markets, Challenges, Opportunities & Winning
                 Strategies for Energy Companies and GE


                                         By Shahzad Paracha
                                         By Shahzad Paracha
2009 Review
    Primary Energy Consumption Growth                 +7.2%               -2.8%
                                                       China                USA


                                                                   -0.6%
    Global oil consumption Growth
          •      First Decline since 1993
     • Global Oil Production Growth +0.4%
     • Oil production outside OPEC -1.4% or 610K b/d, the largest decline since 1992

   Global Refining Capacity Additions                     +2.8%
          •   Led by Asia Pacific (China)


   Refining Capacity Utilization
          •   Consistent Decline since 2003                  85%

                                                                                       2
   Global Natural Gas Consumption                            +2.5%
     •   Below 10 years Historical Average
                                                                                   +16%
     •   Middle East led Above Average 3.1% growth BUT China led..............


   Global Gas Production above 10 years Average (3%)                     +3.5%

     •   Output Led by USA                      +7.5%
     •   10 times than 10 year Average


   Natural Gas
                                                                          +24.1%
     •   Highest Share of energy consumption
           • LNG & LPG share 15%
           • 2020 LNG & LPG Demand/Share 30%

   Other Fuels:                                           +3.1%
   Global Coal consumption growth
     •   Worlds fastest growing fuel
     •   China with 43% consumption share led with 7% growth equivalent to 85% global growth
   Renewable Energy Stronger Growth
     • Wind & Solar Capacity rise of 30% & 70%
                                                                                               3
     • Driven by 50% rise in USA Wind Capacity surpassing Germany
World Primary Fuel Mix 2009


EIA – September’09                4
5
6
Total Proved Oil Reserves & Segmentation
 Total Proved Oil Reserves   Distribution of Proved Oil Reserves (%)


                                                                   7
Total Proved Gas Reserves & Segmentation

Total Proved Gas Reserves   Distribution of Proved Gas Reserves (%)


                                                                  8
Reserves to Production Ratios (R/P)


                                      9
Global Coal Demand & Supply
Production                      Consumption
Million Tonnes Oil Equivalent   Million Tonnes Oil Equivalent


                                                                10
Opportunities & Challenges


                             11
Global Supply & Demand Challenges

 Surplus Reserves in Middle         Oil Reserves
                                            1.      S. Arabia (20% of Global Oil Reserves)
  East, Russia & Africa.
                                            2.      Canada
                                            3.      Iraq
 Cost US$ 15 Trillion in                   4.      Iran

    Infrastructure: Exploration,
                                           Gas Reserves & Producers
     Production & Transportation
                                            1.      Russia
                                            2.      Iran
                                            3.      Qatar
                                            4.      S. Arabia


                                        •        Major Oil Exporters:
                                                 S. Arabia (15% of Total Exports & 2. Russia
                                        •        Gas Reserves & Producers (GR&P):
                                                 Top 4 constitutes 60% of Total GR&P.          12
 50 % Global Energy Demand Growth by 2030
   •   Met by 80% Fossil Fuel & 20% Alternatives with
        Total Global Investments of 52%, 24% & 21% in Power, Oil & Gas sectors
        LPG & LNG Demand Share 40% including UK & EU
   •   Developing Countries Growth Twice Vs Developed Ones
   •   5Bln New Energy Consumers & New development


 Escalating demand, rising oil & gas prices, tight
  refining capacity inducing:
       • Cost reductions
       • Improvement in Production
       • Investment in New Technology for
            Improved Margins & Revenue Growth


                                                                            13
Global & Regional
 Power & Gas                                                   Refining (Including Petrochemicals)
   •   Efficient technology installation in Power generation       •   Environmental compliance investments
       - 52% of Total investments                                  •   Capex upgrade investment decisions
   •   Future gas supply assessment, Storage Capacities &          •   Constantly changing global markets
       role of LNG & Gas to liquid (GTL)                           •   Cost reduction programs to Improve NIAT
          1. W. Europe supplier, Norway with 45% EU gas                due to potential declining margins.
             reserves
          2. Investments in EU (UK focus) Gas Storage           Retail
             Capacities
                                                                   • Eroding margins in mature markets
          3. 30% Global & EU LNG Supply Growth by 2020
                                                                     (later stage of market development)
                                                                   • BRICS : 135% demand growth by 2030
 Upstream (E&P)                                                          •Early Stage Markets
   •   High % of Total Oil & Gas Investments                                    India, China, Russia
   •   Increase volume from existing reserves                           • Transitional Markets
   •   Reduce cost of producing reserves                                        Brazil
   •   Partnering & role of NOC’s                                     Opportunities
   •   Cost effective technological solutions from suppliers              Urbanization
                                                                          High population & demand growth
                                                                          Double Digit Fuels market
                                                                            development

                                                                                                          14
NOC’s
        Control 80% of global oil reserves
                                                        Opportunities & Challenges
        50% in Top 100 companies
                                                          • Acquisition of downstream assets
        High margins & prices inducing:
                                                                 1. Maximize value/barrel
               • Fund growth strategy
                                                                 2. Economic diversification
               • Investment in new technology
                  from service firms like General                3. Drive domestic industry growth
                  Electric
                                                         Raised training & recruitment budges to
        Access to Reserves Strategy                      improve talent pipeline by 2030
                                                            •   Saudi Aramco allocated $50M pear year
                • Transition from PSA’s to PSC’s for
                   high ROI and control on reserves


* IOC’s: International Oil Companies                                                               15
  NOC’s: National Oil Companies
Moving Forward


                 16
Upstream Strategy
   Regional fit for purpose strategy development
     • Minimize over–investment in capacity utilization
     • Practice for high ROI:
           1.    Stringent fuel specifications
           2.    Degradation of crude oil quality
           3.    High capacity utilization (>90%)

     • Appropriate Investments in Projects with Positive NPV on
       right - Oil prices in range $70-95 in 2010-2012.
          • Weighted Average Cost stands $45/boe
          • High Payback Investments costing $65/boe


     • Capacity additions by building green-field refineries
     • Expansion in attractive alternative energy
           • US$ 1 Trillion investment by 2030
     • Penetration in LNG emerging markets
           •    US$250 Bln investment to fuel 100% growth by 2020


                                                                    17
Downstream Strategy
 Regional market entry strategy development.
 BRIC emerging economies market development.
 Fuel & Non-Fuel Opportunities (Mature Markets):
            Low Fuel Margins, Efficiency Index & 30% network rationalization 1998-2008
            Current Forecourt CR penetration 17% of CR industry.
            Target high margin CR & capitalize projected £30 Billion industry by 2020.
            Customer centric retailing with RCVP development & implementation:
              •       BSP, VFM, customer loyalty/penetration, Sales density (£/sqm), Avg transaction
                      value, shopper marketing
     • Desired Customer Experience Offer:
                  •    Store concepts, formats, branding, channel management
                  •    Site & network operations, CRM, Supply chain management
     •   Card Payment & terminals, huge gap in demand vs actual
     •   Locations : Store footprints on consumer insight not property deals

                                                                                                       18
Regional & UK Gas Demand & Storage
 30% Global & Regional LNG Demand Growth                 UK Gas Supply 2016 Proportion:
  by 2020                                                            Domestic production 20%, Imports 80%
       EU: 10% & BRIC’s: 50%                                         (Norway 35%, LNG 35%, Continent 10%)
       IOC’s focus on Global & Regional LNG                         Current Gas Imports 40%
        acquisitions
                                                             UK Supply Cover Storage
 Gas Supplier Qatar meets 30% of EU, US &
                                                                     15 days Vs 100 in France & SC/AC only 4%
  Russia demand.
     Will meet 20% of UK Gas demand from 2011
                                                             Investments In Gas Storage :
                                                                     From 2010-2020 : 14 bcm (SC/AC - 11%)
 UK - 2nd Largest Gas Markets in EU                                    • Will lead Supply Cover Storage – 45 days
     1999 – 2009 Average demand growth 6%
     Gas Fired Power Generation to drive Gas
      demand till 2020

                                    Annual         Storage Capacity      Storage capacity/ Annual
                               Consumption (bcm)        (bcm)                consumption (%)

               UK                      99                 4                         4

               Germany                 101                9                        19

               Italy                   86                13                        15

               France                  46                11                        25
                                                                                                           19
Few Other Opportunities for Oil, Gas Utilities &
                   Service Companies
   Investments by Oil & Gas companies in Upstream generating Order Intake for Vetco Business
       Predominantly Surface (On-shore) AND Subsea (Off-shore) Drilling & Production
   Gas Fired Plants Roll-out for Electricity Generation using Combined Cycle Turbines
   Coal Fuelled Carbon Capture Storage (CCS) Plants Roll-out from 2030 *
      • Current Efficiency 35% to rise to 55%
      • Potential to Meet 25% of UK Gas / Energy Demand
   Oil Refineries :
       IOC’s divestments of EU Assets (Less Margins & 1% Growth) and investments in BRIC’s
   Alternative Energy:
       Huge UK Government Stimulus Packages for 34% CERT by 2020* (Slide 19)
       Concentrated Solar Panel (CSP) Market:
             $20 Bln Global Industry
             Double digit growth in ALL Markets 2010-2030
       Wind Farms (On and Off-Shore) –More Potential as costs cheaper
       Solar Plants (Farms)


* In US Coal accounts for 50% Power Generation but Generates 80% Emissions
                                                                                            20
* CERT-Carbon Emission Reduction Target

Linked Global Energy Outlook 050210

  • 1.
    Global Energy Outlook2010-2030 Emerging Markets, Challenges, Opportunities & Winning Strategies for Energy Companies and GE By Shahzad Paracha By Shahzad Paracha
  • 2.
    2009 Review  Primary Energy Consumption Growth +7.2% -2.8% China USA -0.6%  Global oil consumption Growth • First Decline since 1993 • Global Oil Production Growth +0.4% • Oil production outside OPEC -1.4% or 610K b/d, the largest decline since 1992  Global Refining Capacity Additions +2.8% • Led by Asia Pacific (China)  Refining Capacity Utilization • Consistent Decline since 2003 85% 2
  • 3.
    Global Natural Gas Consumption +2.5% • Below 10 years Historical Average +16% • Middle East led Above Average 3.1% growth BUT China led..............  Global Gas Production above 10 years Average (3%) +3.5% • Output Led by USA +7.5% • 10 times than 10 year Average  Natural Gas +24.1% • Highest Share of energy consumption • LNG & LPG share 15% • 2020 LNG & LPG Demand/Share 30%  Other Fuels: +3.1%  Global Coal consumption growth • Worlds fastest growing fuel • China with 43% consumption share led with 7% growth equivalent to 85% global growth  Renewable Energy Stronger Growth • Wind & Solar Capacity rise of 30% & 70% 3 • Driven by 50% rise in USA Wind Capacity surpassing Germany
  • 4.
    World Primary FuelMix 2009 EIA – September’09 4
  • 5.
  • 6.
  • 7.
    Total Proved OilReserves & Segmentation Total Proved Oil Reserves Distribution of Proved Oil Reserves (%) 7
  • 8.
    Total Proved GasReserves & Segmentation Total Proved Gas Reserves Distribution of Proved Gas Reserves (%) 8
  • 9.
    Reserves to ProductionRatios (R/P) 9
  • 10.
    Global Coal Demand& Supply Production Consumption Million Tonnes Oil Equivalent Million Tonnes Oil Equivalent 10
  • 11.
  • 12.
    Global Supply &Demand Challenges  Surplus Reserves in Middle  Oil Reserves 1. S. Arabia (20% of Global Oil Reserves) East, Russia & Africa. 2. Canada 3. Iraq  Cost US$ 15 Trillion in 4. Iran  Infrastructure: Exploration,  Gas Reserves & Producers Production & Transportation 1. Russia 2. Iran 3. Qatar 4. S. Arabia • Major Oil Exporters: S. Arabia (15% of Total Exports & 2. Russia • Gas Reserves & Producers (GR&P): Top 4 constitutes 60% of Total GR&P. 12
  • 13.
     50 %Global Energy Demand Growth by 2030 • Met by 80% Fossil Fuel & 20% Alternatives with  Total Global Investments of 52%, 24% & 21% in Power, Oil & Gas sectors  LPG & LNG Demand Share 40% including UK & EU • Developing Countries Growth Twice Vs Developed Ones • 5Bln New Energy Consumers & New development  Escalating demand, rising oil & gas prices, tight refining capacity inducing: • Cost reductions • Improvement in Production • Investment in New Technology for  Improved Margins & Revenue Growth 13
  • 14.
    Global & Regional Power & Gas  Refining (Including Petrochemicals) • Efficient technology installation in Power generation • Environmental compliance investments - 52% of Total investments • Capex upgrade investment decisions • Future gas supply assessment, Storage Capacities & • Constantly changing global markets role of LNG & Gas to liquid (GTL) • Cost reduction programs to Improve NIAT 1. W. Europe supplier, Norway with 45% EU gas due to potential declining margins. reserves 2. Investments in EU (UK focus) Gas Storage  Retail Capacities • Eroding margins in mature markets 3. 30% Global & EU LNG Supply Growth by 2020 (later stage of market development) • BRICS : 135% demand growth by 2030  Upstream (E&P) •Early Stage Markets • High % of Total Oil & Gas Investments  India, China, Russia • Increase volume from existing reserves • Transitional Markets • Reduce cost of producing reserves  Brazil • Partnering & role of NOC’s  Opportunities • Cost effective technological solutions from suppliers  Urbanization  High population & demand growth  Double Digit Fuels market development 14
  • 15.
    NOC’s  Control 80% of global oil reserves  Opportunities & Challenges  50% in Top 100 companies • Acquisition of downstream assets  High margins & prices inducing: 1. Maximize value/barrel • Fund growth strategy 2. Economic diversification • Investment in new technology from service firms like General 3. Drive domestic industry growth Electric  Raised training & recruitment budges to  Access to Reserves Strategy improve talent pipeline by 2030 • Saudi Aramco allocated $50M pear year • Transition from PSA’s to PSC’s for high ROI and control on reserves * IOC’s: International Oil Companies 15 NOC’s: National Oil Companies
  • 16.
  • 17.
    Upstream Strategy  Regional fit for purpose strategy development • Minimize over–investment in capacity utilization • Practice for high ROI: 1. Stringent fuel specifications 2. Degradation of crude oil quality 3. High capacity utilization (>90%) • Appropriate Investments in Projects with Positive NPV on right - Oil prices in range $70-95 in 2010-2012. • Weighted Average Cost stands $45/boe • High Payback Investments costing $65/boe • Capacity additions by building green-field refineries • Expansion in attractive alternative energy • US$ 1 Trillion investment by 2030 • Penetration in LNG emerging markets • US$250 Bln investment to fuel 100% growth by 2020 17
  • 18.
    Downstream Strategy  Regionalmarket entry strategy development.  BRIC emerging economies market development.  Fuel & Non-Fuel Opportunities (Mature Markets):  Low Fuel Margins, Efficiency Index & 30% network rationalization 1998-2008  Current Forecourt CR penetration 17% of CR industry.  Target high margin CR & capitalize projected £30 Billion industry by 2020.  Customer centric retailing with RCVP development & implementation: • BSP, VFM, customer loyalty/penetration, Sales density (£/sqm), Avg transaction value, shopper marketing • Desired Customer Experience Offer: • Store concepts, formats, branding, channel management • Site & network operations, CRM, Supply chain management • Card Payment & terminals, huge gap in demand vs actual • Locations : Store footprints on consumer insight not property deals 18
  • 19.
    Regional & UKGas Demand & Storage  30% Global & Regional LNG Demand Growth  UK Gas Supply 2016 Proportion: by 2020  Domestic production 20%, Imports 80%  EU: 10% & BRIC’s: 50% (Norway 35%, LNG 35%, Continent 10%)  IOC’s focus on Global & Regional LNG  Current Gas Imports 40% acquisitions  UK Supply Cover Storage  Gas Supplier Qatar meets 30% of EU, US &  15 days Vs 100 in France & SC/AC only 4% Russia demand.  Will meet 20% of UK Gas demand from 2011  Investments In Gas Storage :  From 2010-2020 : 14 bcm (SC/AC - 11%)  UK - 2nd Largest Gas Markets in EU • Will lead Supply Cover Storage – 45 days  1999 – 2009 Average demand growth 6%  Gas Fired Power Generation to drive Gas demand till 2020 Annual Storage Capacity Storage capacity/ Annual Consumption (bcm) (bcm) consumption (%) UK 99 4 4 Germany 101 9 19 Italy 86 13 15 France 46 11 25 19
  • 20.
    Few Other Opportunitiesfor Oil, Gas Utilities & Service Companies  Investments by Oil & Gas companies in Upstream generating Order Intake for Vetco Business  Predominantly Surface (On-shore) AND Subsea (Off-shore) Drilling & Production  Gas Fired Plants Roll-out for Electricity Generation using Combined Cycle Turbines  Coal Fuelled Carbon Capture Storage (CCS) Plants Roll-out from 2030 * • Current Efficiency 35% to rise to 55% • Potential to Meet 25% of UK Gas / Energy Demand  Oil Refineries :  IOC’s divestments of EU Assets (Less Margins & 1% Growth) and investments in BRIC’s  Alternative Energy:  Huge UK Government Stimulus Packages for 34% CERT by 2020* (Slide 19)  Concentrated Solar Panel (CSP) Market:  $20 Bln Global Industry  Double digit growth in ALL Markets 2010-2030  Wind Farms (On and Off-Shore) –More Potential as costs cheaper  Solar Plants (Farms) * In US Coal accounts for 50% Power Generation but Generates 80% Emissions 20 * CERT-Carbon Emission Reduction Target